Abstract
Chitosan has been widely employed to deliver nucleic acids such as siRNA and plasmids. However, chitosan-mediated delivery of a gene-editing system has not been reported yet. In this study, poly(ethylene glycol) monomethyl ether (mPEG) was conjugated to chitosan with different molecular weights (low molecular weight and medium molecular weight chitosan) achieving a high degree of substitution as identified by Fourier transform infrared spectroscopy (FTIR) and proton nuclear magnetic resonance (1H NMR) spectra. PEGylated chitosan/pSpCas9-2A-GFP nanocomplexes were formed at different N/P (amine group to phosphate group) ratios and characterized in terms of size and zeta potential. The nanocomplexes developed showed the capability to protect loaded nucleic acids from DNase I digestion and from the stresses of nebulization. In addition, we demonstrated that the PEG conjugation of chitosan improved the mucus-penetration capability of the formed nanocomplexes at N/P ratios of 5, 10, 20, and 30. Finally, PEGylated low molecular weight chitosan nanocomplexes showed optimal transfection efficiency at an N/P ratio of 20, while PEGylated medium molecular weight chitosan nanocomplexes showed an optimal transfection efficiency at an N/P ratio of 5 at pH 6.5 and 6.8. This study established the basis for the delivery of a gene-editing system by PEGylated chitosan nanocomplexes.
Keywords: chitosan, PEGylation, nanocomplexes, nanoparticle, nucleic acid delivery, gene editing
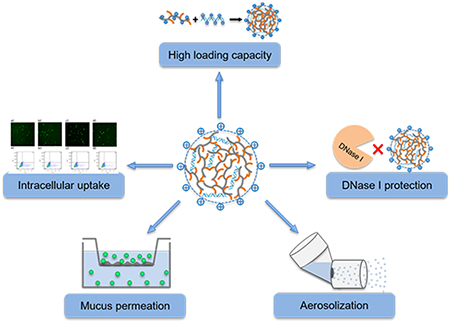
Graphical Abstract
1. INTRODUCTION
Genome-editing technologies have grown rapidly and become the focus of research on genetic diseases, since they bring the hope to cure genetic diseases fundamentally. A desirable delivery system for nucleic acid based genome-editing platforms requires carriers that are safe, efficient, and capable to overcome a series of obstacles including extracellular barriers (such as mucus), enzymatic digestion barriers, immune barriers, cellular barriers, and intracellular targeting.1 Currently, there are two major vector-mediated delivery systems of a genome-editing platform: viral and nonviral delivery systems.2 Viral vectors have generally shown higher delivery efficiency than nonviral delivery systems, but concerns such as potential infectivity, inflammation, and immunogenicity may limit their applications.3,4 In contrast, nonviral delivery systems including cationic lipid, cationic polymer, and cell-penetrating peptides (CPP) possess advantages including low cost, less immunogenicity, and no limitation in size of transgenic DNA, which has made nonviral delivery systems attractive for gene delivery.5,6 Many cationic polymers have been developed for gene delivery, including polyethylenimine (PEI),7 poly(l-lysine) (PLL),8 diethylaminoethyl dextran,9 and chitosan.10
Among nonviral vectors, chitosan is biodegradable,11 biocompatible, and has been called nontoxic.12 As such, chitosan has been recognized as a desirable candidate for the delivery of nucleic acids.13 Chitosan consists of repeating d-glucosamine and N-acetyl-d-glucosamine units, linked via (1–4) glycosidic bonds,11 and each d-glucosamine subunit contains a positively charged primary amine group (pKa = 6.5), which can interact with negatively charged nucleic acids to form complexes by electrostatic interaction.14 The transfection efficiency of chitosan in vitro is influenced by different factors including but not limited to degree of deacetylation (DDA) and molecular weight (MW) of the chitosan, pH, charge ratio of chitosan to DNA, and cell type.15 Beside the effects of chitosan’s properties on cellular uptake, extracellular biopolymers may limit delivery system diffusion to the target cells. For example, the mucus lining in the airway is a major barrier for gene delivery even in healthy individuals.16 In the airway of cystic fibrosis (CF) patients, the mucus is denser, highly glycosylated, and more acidic compared to mucus in healthy people.17,18 Indeed, chitosan is known as mucoadhesive,19 which limits its practical application in pulmonary gene delivery due to the significant amounts of functional mucus in the airways. However, poly(ethylene glycol) (PEG) has been demonstrated to be able to improve the diffusion rate of nanoparticles in different types of mucus including cystic fibrosis mucus.20,21
In this study, in order to utilize the attractive nucleic acid delivery properties of chitosan but at the same time overcome its well-documented mucoadhesion, we developed a series of PEGylated chitosan copolymers by conjugating methoxy PEG to chitosan at different molecular weights (oligosaccharide and medium molecular weight chitosan) with a high mPEG degree of substitution (DS). These systems were then assessed as potential carriers for CRISPR/Cas9 system delivery. We characterized the PEGylated chitosan nanocomplexes by evaluating the size, surface charge, DNA binding efficiency, releasing capability, enzyme protection, and nebulization protection ability. Finally, the mucus-penetration ability and transfection efficiency of nanocomplexes were assessed in vitro in a mucus model and HEK293 cells, respectively. Even though there are several articles focusing on chitosan-mediated delivery of DNA, the capability of chitosan/DNA nanocomplexes to penetrate mucus is not well-defined. In fact, chitosan is often included in mucosally delivered systems as a mucoadhesive. In contrast, and to the best of our knowledge, this is the first report demonstrating that PEGylated chitosan not only improved the mucus-penetration capability of nanocomplexes but protected nucleic acids from the stresses of nebulization. This proof-of-concept study demonstrated the feasibility of delivery of the CRISPR/Cas9 system to HEIK293 cells by PEGylated chitosan, and further studies are needed to explore the delivery capability in lung epithelial cells for clinical-ready formulations.
2. MATERIALS AND METHODS
2.1. Materials.
Poly(ethylene glycol) monomethyl ether MW 5000 kDa (mPEG), medium molecular weight chitosan (190–340 kDa), phthalic anhydride, anhydrous pyridine, 4-dimethylamino-pyridine (DMAP), succinic anhydride, anhydrous N,N-dimethylformamide (DMF), hydrazine monohydrate, hydroxybenzotrizole (HOBt), mucin from porcine stomach type III, egg yolk from chicken, and lactoferrin human were purchased from Sigma-Aldrich (St. Louis, MO, USA). Low molecular weight chitosan (oligosaccharide) (LMW OCs), 15 kDa, was obtained from Polysciences Inc., USA. Dulbecco’s Modified Eagle’s Medium (DMEM), Opti-MEM, and diethyl ether were obtained from Thermo Fisher Scientific Inc. (Waltham, MA, USA). Carbodiimide hydrochloride (EDC·HCl) and deuterium chloride were obtained from ACROS Organics (Morris Plains, NJ, USA). Deuterium oxide (D2O) and dimethyl sulfoxide-d6 were obtained from EMD Millipore Corporation (Billerica, MA, USA). pSpCas9-2A-GFP plasmid was purchased from Addgene (Plasmid #48138).
2.2. Methods.
2.2.1. Synthesis of mPEG–OC and mPEG–C Copolymers.
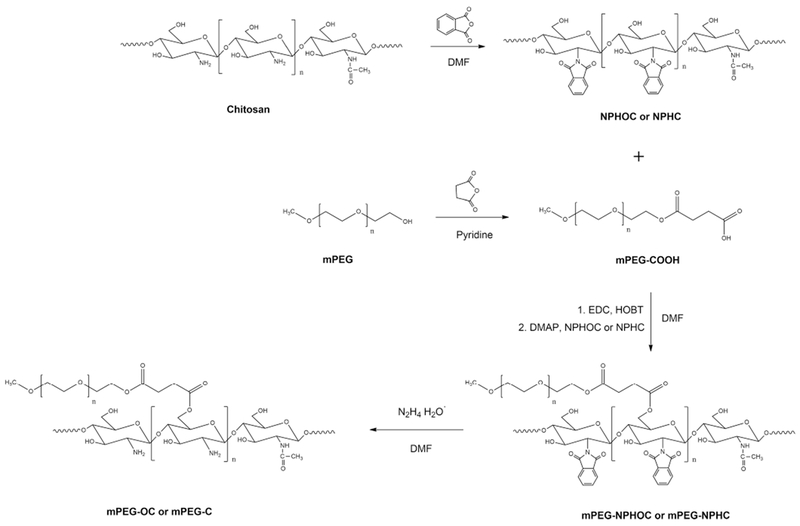
PEGylated chitosan copolymer were synthesized by a modified method as previously reported.22 Briefly, N-phthaloyl oligosaccharide (low molecular weight chitosan) (NPHOC) or N-phthaloyl medium molecular weight chitosan (NPHC) was prepared by reacting 5 g of chitosan with 13.8 g of phthalic anhydride (3 equiv to NH2 groups in chitosan) in DMF at 120 °C for 8 h under nitrogen atmosphere. After the reaction, the mixture was poured into ice water to get the precipitate, which was then filtered and washed with methanol thoroughly. The phthaloylated product was dried under vacuum. PEG monomethyl ether succinate (mPEG–COOH) was carried out by reacting 20 g of mPEG to aliquots of succinic anhydride (10 g each, totally 30 g) at 1 h intervals in 100 mL of pyridine at 50 °C as described previously.23 After the last addition of succinic anhydride, the mixture was reacted for 2 h at 50 °C. The mixture was precipitated and washed by cold diethyl ether three times and dissolved in 200 mL of distilled water. The residue was dialyzed in a 3.5 kDa molecular weight cutoff dialysis membrane (Spectrum Laboratories, Inc. CA, USA) against distilled water at 4 °C for 4 days and lyophilized to get mPEG–COOH white powder. mPEG–NPHOC and mPEG–NPHC copolymers were prepared by a modified method described previously.24 First, 8.5 g of PEG–COOH, 1.6 g of EDC (5 equiv to PEG–COOH), and 1.28 g of HOBT (5 equiv to mPEG–COOH) were dissolved in 70 mL of DMF and reacted in room temperature for 30 min. Then, 1 g of NPHOC or NPHC (0.5 equiv to PEG–COOH) and 1.01 g of DMAP (5 equiv to mPEG–COOH) were added and reacted overnight at 50–60 °C. The mixture was washed with ethanol and dialyzed against distilled water for 3 days. The mixture was then lyophilized to get the powder-like products mPEG–NPHOC and mPEG–NPHC. Finally, the N-phthalimido group was removed by mixing 4 g of mPEG–NPHOC or mPEG–NPHC with 20 mL of hydrazine monohydrate in 15 mL of DMF and reacting at 100 °C for 2 h, The mixture was dialyzed in a 12–14 kDa molecular weight cutoff membrane (Spectrum Laboratories, Inc. CA, USA) against water for 3 days and lyophilized to get the mPEG–OC and mPEG–C copolymers (Scheme 1).
Scheme 1.
Synthesis of PEGylated Chitosan
2.2.2. Characterization of PEGylated Chitosan: FTIR, NMR, and TGA.
Attenuated total reflectance-Fourier transform infrared spectroscopy (ATR-FTIR) (NicoletTM iSTM 50 spectrometer, Thermo Scientific, Waltham MA, USA) and proton nuclear magnetic resonance (1H NMR) (Agilent MR 400, 400 MHz, Agilent Technologies, Inc. Santa Clara CA, USA) were employed to characterize the structure of PEGylated chitosan and subproducts. FTIR spectra were collected from 4000 to 700 cm−1 with a resolution of 4 cm−1. The spectra of 1H NMR were collected with VNMRJ 3.0 software with a relaxation delay of 1 s and a pulse angle of 90°. Thermogravimetric analysis (TGA) (TGA/DSC 1 Star System, Mettler Toledo, Switzerland) was also performed to characterize the thermal properties of PEGylated chitosan at temperatures ranging from 25 to 600 °C at a 10 °C/min heating rate under nitrogen atmosphere.
2.2.3. Preparation of PEGylated Chitosan/DNA Nanocomplexes.
DNA was dissolved in 250 μL of sodium acetate buffer (pH 5.5) at a final concentration 100 ng/μL. PEGylated chitosan was dissolved in 250 μL of sodium acetate buffer (pH 5.5) at different concentrations to reach different N/P ratios (amine group/phosphate group). PEGylated chitosan solution was added to DNA solution at 55 °C and vortexed for 15 s at 1200 rpm. The mixture was incubated in room temperature for at least 30 min to allow the formation of nanocomplexes.
2.2.4. Gel Retardation Assay.
Agarose gel electrophoresis was performed to characterize the binding, release ability, nuclease protection ability, and nebulization protection ability of the nanocomplexes. Briefly, 20 μL of naked DNA (50 ng/μL) and 20 μL of nanocomplexes at different N/P ratios were loaded into the 0.8% agarose gel with SYBR safe DNA gel stain or ethidium bromide. The gel was immersed in Tris–acetate–EDTA (TAE) buffer and exposed for 35 min to 120 V. For the DNA displacement assay, SDS solution was added to 20 μL of naked DNA and nanocomplexes at different N/P ratios to reach a final SDS concentration of 2% and incubated for 30 min. For the nuclease protection assay, DNase I (0.4 U for 1 μg of DNA) was added to samples and incubated at 37 °C for 20 min, followed by inactivation at 75 °C for 10 min. Finally, SDS was added to each sample and incubated for 30 min before running agarose gel. For aerosolization of nanocomplexes, Aerogen Solo was used to generate the aerosol of nanocomplexes.
2.2.5. Measurements of Size and Zeta Potential.
The hydrodynamic diameter and zeta potential were measured in triplicate by Zetasizer Nano ZS (Malvern Instruments, UK) at 25 °C. Briefly, 100 μL of the nanocomplexes (with or without nebulization) was added to 600 μL of sodium acetate buffer at pH 5.5 and mixed thoroughly before measurements.
2.2.6. Cell Culture.
HEK293 cells were maintained in Dulbecco’s Modified Eagle’s Medium (DMEM) supplemented with 10% fetal bovine serum (FBS) and 100 U/mL penicillin/streptomycinin and incubated with 5% CO2 at 37 °C.
2.2.7. MTT Assays.
The cytotoxicity of the PEGylated chitosan was assessed by MTT assays in HEK293 cells lines. Briefly, 1 × 10⁴ of cells were plated in each well of 96-well plates, and the cells were incubated overnight to allow cell adherence. Then, PEGylated chitosan solution was added to each well to reach different concentrations (100–500 μg/mL). After 24 h incubation at 37 °C, MTT reagent was added to each well and incubated for 4 h at 37 °C. DMSO was added to each well, and the 96-well plate was incubated in the dark for 2 h to allow the complete dissolution of the formazan crystals. The absorbance of samples was measured by a UV–vis reader at a 570 nm wavelength. The results were normalized based on the absorbance of untreated cells and expressed by the following equation
| (1) |
2.2.8. Transwell Permeation Assay.
The penetration capability of nanocomplexes was evaluated by Transwell assay. A mucus model was prepared by a modified method described previously.25 The components in the mucus model included mucin (5 mg/mL), egg yolk (5 mg/mL), lactoferrin (0.9 mg/mL), sodium chloride (5 mg/mL), and potassium chloride (2.2 mg/mL), and hydrogen chloride was used to adjust the pH to 6.5. 20 μL of 5-fold concentrated CF-like mucus (25 mg/mL of mucin) was added to the insets of the Transwell (pore size: 3 μm; Costar, Corning Inc. ME, USA). After 15 min of equilibration, 80 μL of PEGylated chitosan nanocomplexes at different N/P ratios were added to the top of the mucus. For the mucus-only control group, 80 μL of 0.05 M sodium acetate buffer was added to the top of the mucus. For the DNA control group, a total 2.5 μg of plasmid was added to the top of the mucus. 600 μL of 0.05 M sodium acetate buffer was added to the plate well. After incubation for 6 h at room temperature, 40 μL of sample was collected from each plate well, and agarose gel electrophoresis was employed to identify the nanocomplexes that penetrated the mucus.
2.2.9. Intracellular Delivery of PEG–OC/DNA and PEG–C/DNA Nanocomplexes.
The transfection efficiency of the DNA plasmid (pSpCas9(BB)-2A-GFP) was evaluated in HEK293 cells. In brief, 5 × 10³ of HEK293 cells were seeded in 100 μL of DMEM media in each well of 96-well plates and incubated for 24–36 h to allow complete adherence. After incubation, the media was removed, and Opti-MEM reduced serum media was added to the cells. DNA plasmid liposomes were also prepared as a positive control group: for each transfected well, 200 ng of DNA and 0.2 μL of P3000 were diluted in 10 μL of Opti-MEM reduced serum media, and 0.3 μL of lipofectamine 3000 was diluted in 10 μL of Opti-MEM reduced serum media. Both solutions were mixed together and incubated for 15 min at room temperature before addition to the cells. For nanocomplexes, 10 μL of complexes at different N/P ratios were added to cells cultured in media with different pH (6.5 and 6.8) After incubation for 48 h, the transfection efficiency was evaluated by fluorescence microscopy and flow cytometry.
2.2.10. Statistical Analysis.
The statistical analysis was performed using JMP 10.0.0. All experiments were performed in triplicate. Data values are expressed as mean ± standard deviations (SD). When required, Student’s t-test was performed. *p-values < 0.05 were considered statistically significant.
3. RESULTS
3.1. Characterization of Polymers.
3.1.1. Characterization of Polymers by FTIR.
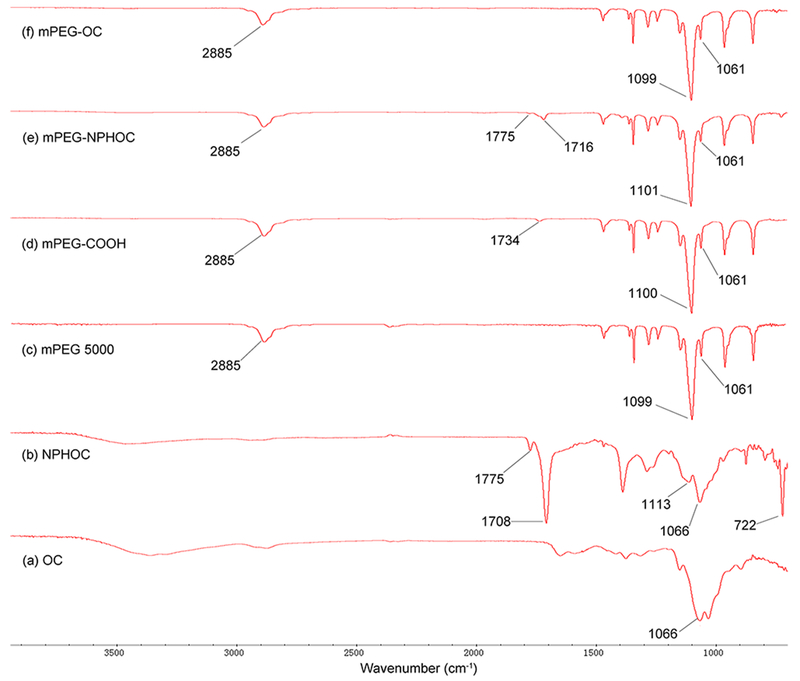
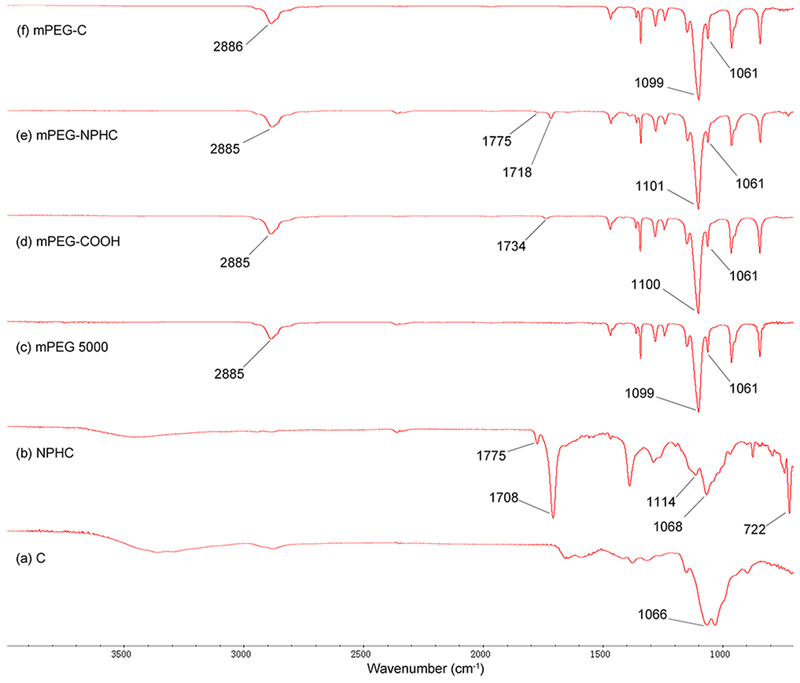
PEGylated chitosan was synthesized by conjugating PEG–COOH to the hydroxyl group of amine-protected chitosan followed by deprotection of PEGylated phthaloyl chitosan (Scheme 1). The FT-IR spectra shown in Figure 1 represent the mPEG–OC and subproducts. Figure 1b represents NPHOC with characteristic peaks at νmax/cm−1 of 3100–3400 (O–H), 1775 (imide C═O), 1708 (imide C═O), 1150–1000 (pyranose), and 722 (arom). The carboxylate-terminated mPEG (mPEG–COOH) was confirmed by the presence of a carboxylic peak at νmax/cm−1 of 1734 (C═O) as shown in Figure 1d compared to the commercially available mPEG (Figure 1c). The FT-IR spectra of mPEG–NPHOC presented in Figure 1e shows the mPEG characteristic peaks at νmax/cm−1 of 2885 (stretching C–H), 1101 (stretching C–O), and 1061 (stretching C–O–C) in addition to the peaks of phthaloylated chitosan. The deprotection of mPEG–NPHOC was confirmed by the disappearance of peaks at νmax/cm−1 of 1775 (imide C═O) and 1716 (imide C═O) as shown in Figure 1f. Figure 2 represents the FT-IR spectra of mPEG–C and subproducts. Figure 2b represents NPHC with characteristic peaks at νmax/cm−1 of 3100–3400 (O–H), 1775 (imide C═O), 1708 (imide C═O), 1150–1000 (pyranose), and 722 (arom). The carbonyl groups of carboxylate-terminated PEG (mPEG–COOH) were confirmed by the presence of carboxylic peaks at νmax/cm−1 of 1734 (C═O) as shown in Figure 2d compared to the commercially available mPEG (Figure 2c). The FT-IR spectra of mPEG–NPHC presented in Figure 2e shows the mPEG characteristic peaks at νmax/cm−1 od 2885 (stretching C–H), 1101 (stretching C–O), and 1061 (stretching C–O–C) in addition to the peaks of phthaloylated chitosan. The deprotection of mPEG–NPHC was confirmed by the disappearance of peaks at νmax/cm−1 of 1775 (imide C═O) and 1718 (imide C═O) as shown in Figure 2f.
Figure 1.
FTIR spectra of mPEG–OC and subproducts. (a) Commercially available oligosaccharide (OC), (b) N-phthaloyl oligosaccharide (NPHOC), (c) commercially available poly(ethylene glycol) monomethyl ether (mPEG), (d) PEG monomethyl ether succinate (mPEG–COOH), (e) PEGylated NPHOC (mPEG–NPHOC), (f) PEGylated oligosaccharide (mPEG–OC).
Figure 2.
FTIR spectra of mPEG–C and subproducts. (a) Commercially available medium molecular weight chitosan (C), (b) N-phthaloyl medium molecular weight chitosan (NPHC), (c) commercially available poly(ethylene glycol) monomethyl ether (mPEG), (d) PEG monomethyl ether succinate (mPEG–COOH), (e) PEGylated NPHC (mPEG–NPHC), (f) PEGylated medium molecular weight chitosan (mPEG–C).
3.1.2. Characterization of Polymers by 1H NMR.
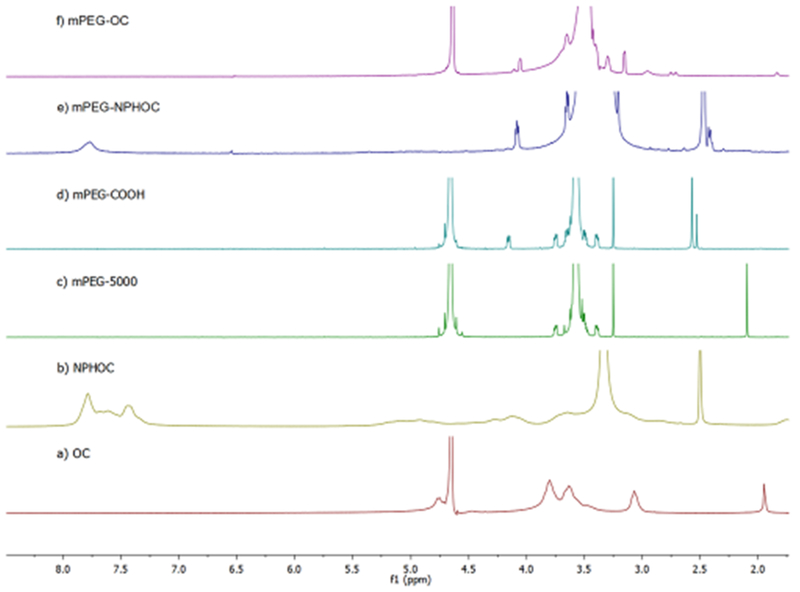
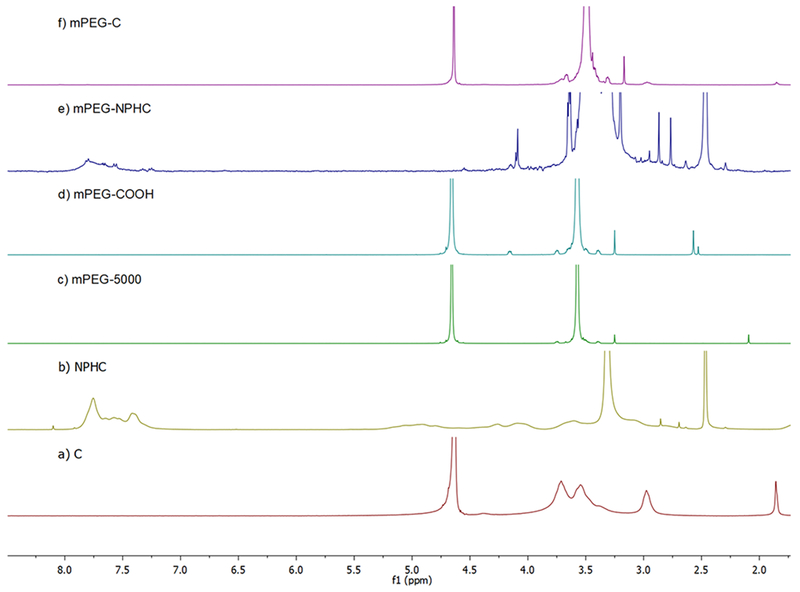
A chemical shift at 7.78 ppm represents the aromatic protons of the phthaloyl moiety in the NPHOC or NPHC as shown in Figures 3b and 4b, respectively. The structure of mPEG–COOH (Figures 3d and 4d) was confirmed by the presence of characteristic peaks at 4.16 ppm (–CH2–O–CO–) besides the peaks at 3.3–4.0 ppm ([–O–CH2–CH2–]n) and 3.25 ppm (–O–CH3), which are also presented in mPEG (Figures 3c and 4c). In Figures 3e and 4e, the presence of a peak at 7.78 ppm representsthe phthaloyl group in NPHOC or NPHC, and the presence of a peak at 3.21 represents PEG–OCH3. In Figures 3f and 4f, the disappearance of 7.78 ppm confirmed that the phthaloyl moiety was removed. The peaks between 3.3 and 3.9 ppm are for the chitosan skeleton and were not well-separated, because they were covered by more intense PEG methylene peaks between 3.3 and 3.7 ppm. In addition, the signal at 3.0 ppm represents the proton of –CH–N– in chitosan. The DS of mPEG for each copolymer was calculated based on eq 2, which is modified from the method previously reported.26 DS of mPEG–OC and mPEG–C copolymers was identified as 44.9 and 47.8%, respectively.
Figure 3.
Characterization of mPEG–OC and subproducts by using 1H NMR. (a) Oligosaccharide (OC), (b) N-phthaloyl chitosan (NPHOC), (c) mPEG5000, (d) PEG monomethyl ether succinate (mPEG–COOH), (e) PEGylated phthaloyl chitosan (mPEG–NPHOC), (f) PEGylated oligosaccharide (mPEG–OC). (c) and (d) are in D2O, (a) and (f) are in 1% DCl/D2O, (b) and (e) are in DMSO.
Figure 4.
Characterization of mPEG–C and subproducts by using 1H NMR. (a) Medium molecular weight chitosan (C), (b) N-phthaloyl medium molecular weight chitosan (NPHC), (c) mPEG5000, (d) PEG monomethyl ether succinate (mPEG–COOH), (e) PEGylated N-phthaloyl medium molecular weight chitosan (mPEG–NPHC), (f) PEGylated medium molecular weight chitosan (mPEG–C). (c) and (d) are in D2O, (a) and (f) are in 1% DCl/D2O, (b) and (e) are in DMSO.
| (2) |
where
| (3) |
3.1.3. Characterization of Polymers by TGA.
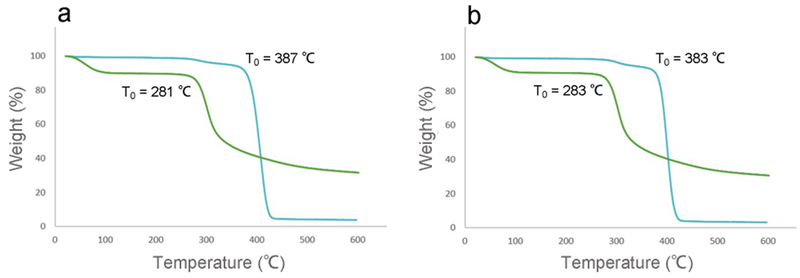
Figure 5 represents the TGA spectra of chitosan and PEGylated chitosan. A bitangent method was used to calculate the onset temperature (T0) of polymers. The T0 of low molecular weight chitosan and PEG–OC were 281 and 387 °C, respectively (Figure 5a), while the T0 of medium molecular weight chitosan and PEG–C were 283 and 383 °C, respectively (Figure 5b). The slight shift of T0 to a higher temperature can be attributed to grafting of mPEG (T0 = 388 °C, data not shown) to chitosan.
Figure 5.
TGA spectra of (a) OC (green) and PEG–OC (blue), (b) C (green) and PEG–C (blue).
3.2. Cytotoxicities of PEG–OC and PEG–C Copolymers.
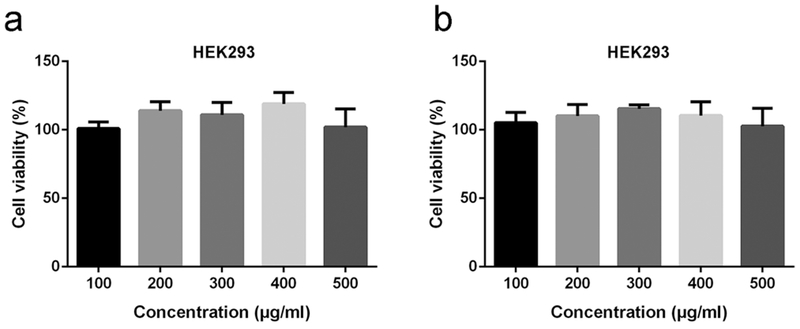
The cytotoxicity of copolymers was assessed by MTT assay by the manufacturer’s instructions. PEGylated chitosan copolymers were added to HEK293 cells and incubated for 24 h before measurements, and the data were normalized to control group without any treatment. At a final concentration between 100 and 500 fig/mL, both mPEG–OC and mPEG–C copolymers showed no significant cytotoxic effect on HEK293 cells (Figure 6a,b).
Figure 6.
Effects of mPEG–OC (a) and mPEG–C (b) on the cell viability. Means ± SD.
3.3. Loading Efficiency of PEG–OC/DNA and PEG–C/DNA Nanocomplexes.
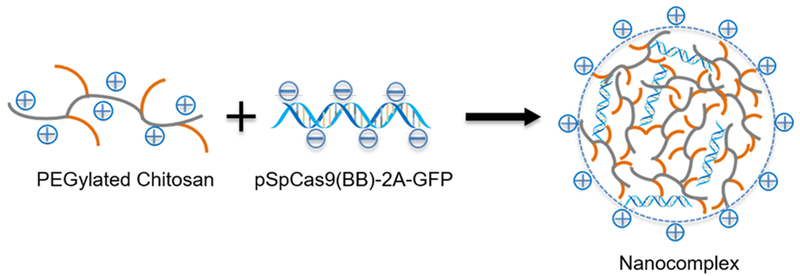
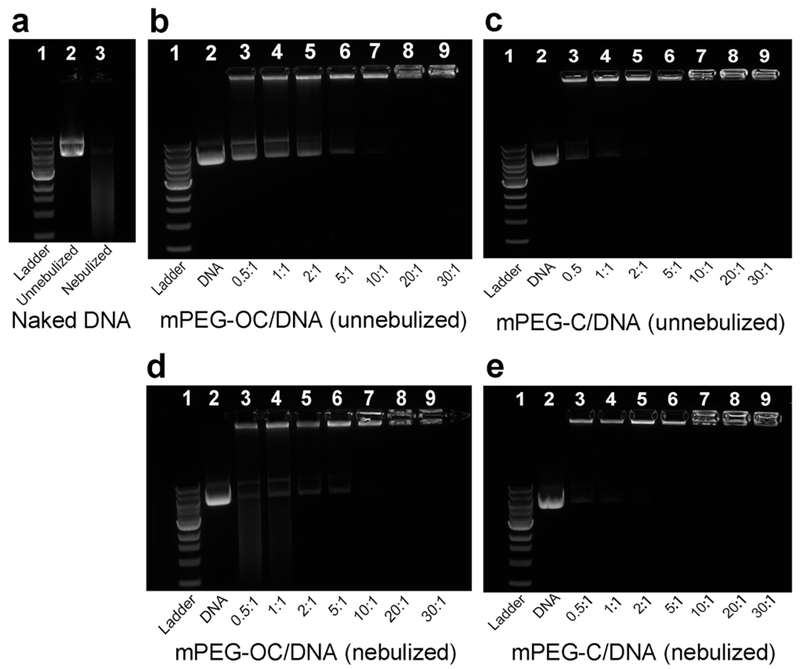
PEGylated chitosan/DNA nanocomplexes were prepared by a self-assembly method (Scheme 2). Agarose gel electrophoresis was used to study the loading efficiency of PEGylated chitosan nanocomplexes at different N/P ratios. The bands located near the wells at the top of the gels represent the immobilization of the DNA, which indicated the DNA in the form of a nanocomplex As shown in Figure 7a, the disappearance of distinct DNA bands in lane 3 indicated the degradation of DNA with the nebulization treatment. In Figure 7b–e, lane 1 represents 1 kb DNA ladder, lane 2 represents naked DNA, and lanes 3–9 represent nanocomplexes at N/P ratios of between 0.5 and 30. Figure 7b,c shows that complete binding of DNA was achieved at N/P ratios of 10 and 2 for PEG–OC/DNA and PEG–C/DNA nanocomplexes, respectively, which indicated that PEG–C had a higher DNA loading capability than PEG–OC. Nanocomplexes after nebulization are shown in Figure 7d,e. The immobilized bands near the wells demonstrated that the structure of the nanocomplexes was maintained, and DNA was protected by the nanocomplexes during the nebulization process performed with Aerogen Solo. In contrast, the intensity of free DNA bands (appeared at N/P ratios of 0.5, 1, 2, and 5 for mPEG–OC/DNA and N/P ratios of 0.5 and 1 for mPEG–C/DNA nanocomplexes in Figure 7d and e, respectively) decreased, which indicated that the DNA that were not loaded were degraded by the nebulization process.
Scheme 2.
Illustration of Nanocomplex Formation
Figure 7.
Loading efficiency of mPEG–OC/DNA and mPEG–C/DNA nanocomplexes. (a) Naked DNA, lane 1: ladder, lane 2: naked DNA without nebulization, lane 3: naked DNA with nebulization; (b) mPEG–OC/DNA nanocomplexes without nebulization; (c) mPEG–C/DNA nanocomplexes without nebulization; (d) mPEG–OC/DNA nanocomplexes after nebulization; (e) mPEG–C nanocomplexes after nebulization. In (b–e), lane 1: ladder, lane 2: naked DNA without nebulization, lanes 3–9: nanocomplexes at N/P ratios of 0.5, 1, 2, 5, 10, 20, and 30, respectively.
3.4. Size and Zeta Potential of mPEG–OC/DNA and mPEG–C/DNA Nanocomplexes.
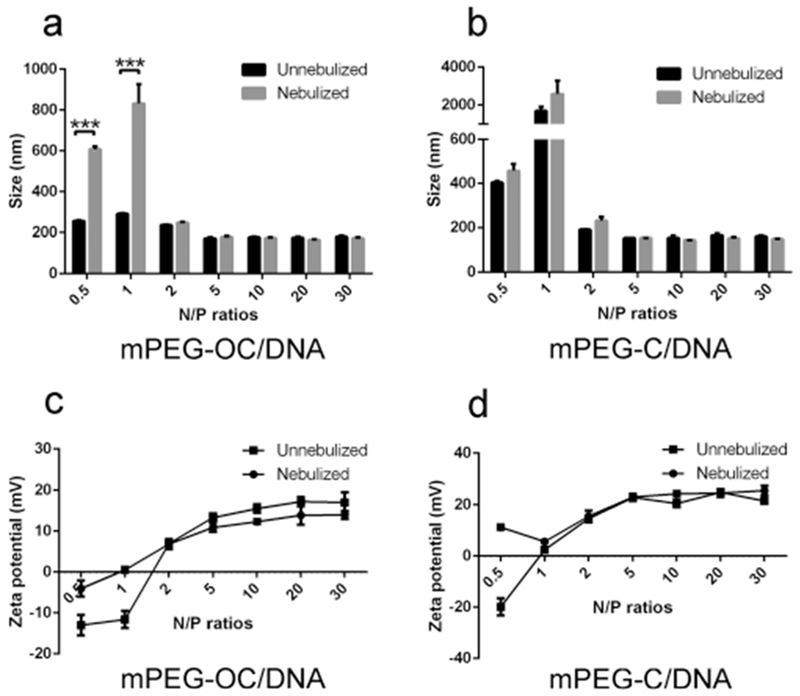
The average particle size and zeta potential are shown in Figure 8. The size of PEG–OC/DNA nanocomplexes without nebulization changed in the range of 291.3 ± 4.1 nm at an N/P ratio of 1, to 172.3 ± 4.2 nm at an N/P ratio of 5. The size of PEG–OC/DNA nanocomplexes after nebulization were in the range of 832.4 ±nm at an N/P ratio of 1 and changed to 165.7 ± 2.9 nm at an N/P ratio of 20 (Figure 8a). The size of PEG–OC/DNA nanocomplexes at N/P ratios of 0.5 and 1 significantly increased with the nebulization treatment (***p < 0.001). The size of PEG–C/DNA nanocomplexes changed from 1687 ± 228.1 nm without nebulization for an N/P ratio of 1 to 2578.7 ± 701.9 nm after nebulization. In contrast, the size of PEG–C/DNA nanocomplexes was not significantly different between groups without nebulization and with nebulization treatment for all N/P ratios in PEG–C/DNA nanocomplexes (Figure 8b).
Figure 8.
Size and zeta potential of nanocomplexes without and with nebulization. (a) Size of mPEG–OC/DNA nanocomplexes at different N/P ratios, (b) size of mPEG–C/DNA nanocomplexes at different N/P ratios, (c) zeta potential of mPEG–OC/DNA nanocomplexes at different N/P ratios, (d) zeta potential of mPEG–C/DNA nanocomplexes at different N/P ratios (measured in sodium acetate buffer at pH 5.5, n = 3). ***p < 0.001.
Figure 8c,d shows the zeta potential of mPEG–OC/DNA and mPEG–C/DNA respectively. The zeta potential of mPEG–OC/DNA without nebulization switched from −13.0 ± 2.5 mv at an N/P ratio of 0.5 to 17.2 ± 1.1 mv at an N/P ratio of 20, while the zeta potential of mPEG–OC/DNA nanocomplexes after nebulization changed from 0.522 ± 0.7 mv at an N/P ratio of 0.5 to 14.0 ± 1.0 at an N/P ratio of 30. In Figure 8d, the zeta potential of mPEG–C/DNA switched from 19.9 ± 3.2 mv at an N/P ratio of 0.5 to 24.9 ± 0.9 mv at an N/P ratio of 20, while after nebulization treatment, the zeta potential changed from 5.7 ± 0.5 mv at an N/P ratio of 1 to 25.6 ± 2.0 mv at an N/P ratio of 30. The zeta potential was substantially affected by the nebulization process for mPEG–OC/DNA nanocomplexes at N/P ratios of 0.5 and 1 and for mPEG–C/DNA nanocomplexes at an N/P ratio of 0.5. In all cases, the polydispersity index was below 0.3 (data not shown).
3.5. Displacement Assay and Nuclease Protection Assay.
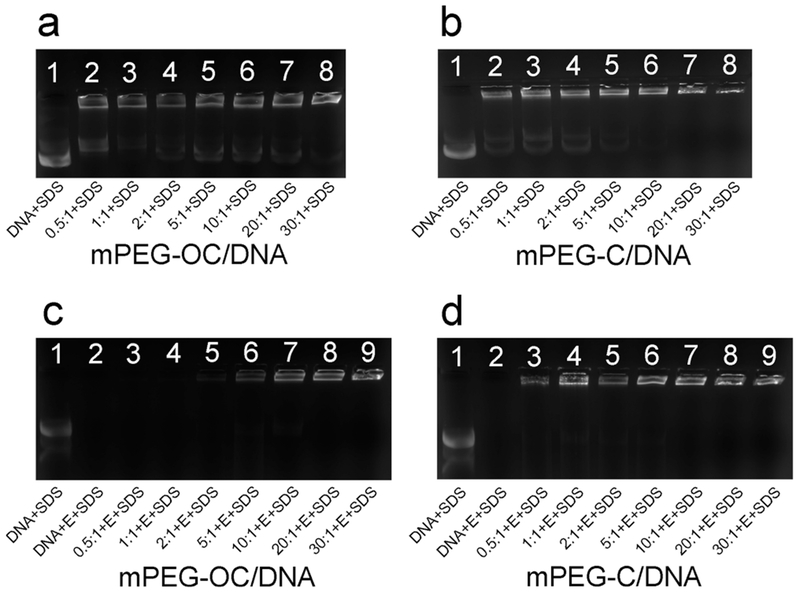
To estimate the capacity of nanocomplexes to release DNA, SDS solution was used to release DNA from the nanocomplexes (final concentration = 2%). Figure 9a and b represents the displacement assays for mPEG–OC/DNA and mPEG–C/DNA nanocomplexes, respectively. Free DNA bands were observed with the treatment of SDS in lanes 2–8 in Figure 9a, which suggested that part of the DNA can be displaced by SDS at all N/P ratios in mPEG–OC/DNA nanocomplexes. In Figure 9b, free DNA bands were observed in lanes 2–6, which indicated that part of DNA can be released from mPEG–C nanocomplexes at N/P ratios of 0.5–10 but not in N/P ratios of 20 and 30. Figure 9c,d showed the enzyme protection assays for mPEG–OC/DNA and PEG–C/DNA nanocomplexes, respectively. The disappearance of free DNA band in lane 2 in both Figure 9c and d showed that the unprotected DNA was degraded by DNase I completely. The disappearance of mPEG–OC/DNA nanocomplex bands near the wells in lane 3 and lane 4 in Figure 9c indicated that the DNA loaded to PEG–OC at N/P ratios of 0.5 and 1 were degraded by DNase I. In contrast, the appearance of bands near the wells in Figure 9d indicate that the DNA condensed by mPEG–C was protected from DNase I at N/P ratios ranging from 0.5 to 30.
Figure 9.
SDS displacement and DNase I degradation protection assay. (a) SDS displacement assay of mPEG–OC/DNA nanocomplexes, lane 1: naked DNA + SDS, lanes 2–8: SDS + mPEG–OC/DNA nanocomplexes at N/P ratios of 0.5, 1, 2, 5, 10, 20, and 30, respectively. (b) SDS displacement assay of mPEG–C/DNA nanocomplexes, lane 1: naked DNA + SDS, lanes 2–8: SDS + mPEG–C/DNA nanocomplexes at N/P ratios of 0.5, 1, 2, 5, 10, 20, and 30, respectively. (c) DNase I degradation protection assay of mPEG–OC nanocomplexes, lane 1: naked DNA + SDS, lane 2: naked DNA + DNase I (E) + SDS, lanes 3–9: DNase I (E) + SDS + mPEG–OC nanocomplexes at N/P ratios of 0.5, 1, 2, 5, 10, 20, and 30, respectively. (d) DNase I protection assay of mPEG–C/DNA nanocomplexes, lane 1: naked DNA + SDS, lane 2: naked DNA + DNase I (E) + SDS, lanes 3–9: DNase I (E) + SDS + mPEG–C/DNA nanocomplexes at N/P ratios of 0.5, 1, 2, 5, 10, 20, and 30, respectively.
3.6. Mucus Permeation Assay.
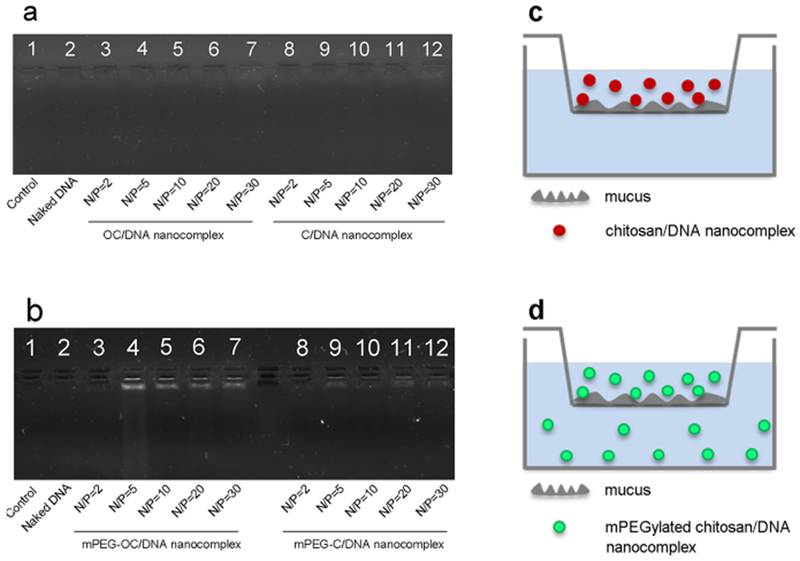
We designed a Transwell assay to evaluate the mucus-penetration capability of the nanocomplexes. Figure 10a represents the image of agarose gel electrophoresis of nanocomplexes at different N/P ratios for both OC/DNA and C/DNA nanocomplexes (i.e., for systems without PEG conjugation). Figure 10b represents the image of agarose gel electrophoresis of nanocomplexes at different N/P ratios for both mPEG–OC/DNA and mPEG–C/DNA nanocomplexes. In Figure 10a, there were no bands visible, which indicated that the chitosan/DNA nanocomplexes without PEGylation at an N/P ratio of 2–30 showed no capability to penetrate the model mucus system. In Figure 10b, the appearance of bands in lanes 4–7 suggested that mPEG–OC/DNA nanocomplexes at N/P ratios of 5–30 had the capability to penetrate mucus, while the bands that appeared in lanes 8–12 suggested that mPEG–C/DNA nanocomplexes at N/P ratios of 5–30 had the capability to transport through mucus. These data demonstrated that PEGylation modification of chitosan improved the penetration ability of nanocomplexes.
Figure 10.
Mucus-penetration assay. (a) OC/DNA and C/DNA nanocomplexes. Lane 1: mucus only, lane 2: mucus + naked DNA, lanes 3–7: mucus + OC/DNA nanocomplexes at N/P ratios of 2, 5, 10, 20, and 30, respectively, lanes 8–12: mucus + C/DNA nanocomplexes at N/P ratios of 2, 5, 10, 20, and 30, respectively. (b) mPEG–OC/DNA and mPEG–C/DNA nanocomplexes. Lane 1: mucus only, lane 2: mucus + naked DNA, lanes 3–7: mucus + mPEG–OC/DNA nanocomplexes at N/P ratios of 2, 5, 10, 20, and 30, respectively, lanes 8–12: mucus + mPEG–C/DNA nanocomplexes at N/P ratios of 2, 5, 10, 20, and 30, respectively. (c) Illustration of mucus permeation assay for chitosan/DNA nanocomplexes. (d) Illustration of mucus permeation assay for PEGylated chitosan/DNA nanocomplexes.
3.7. Intracellular Delivery of DNA.
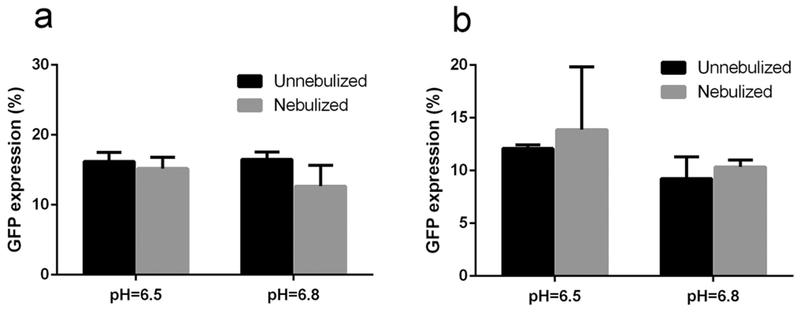
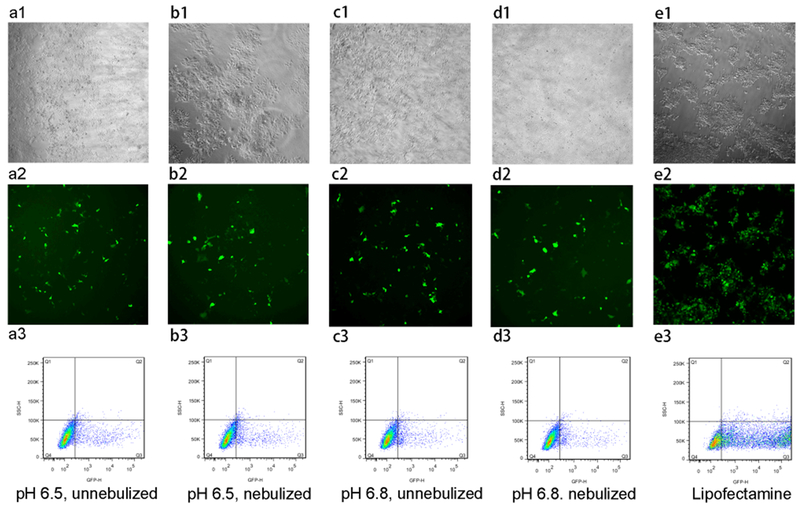
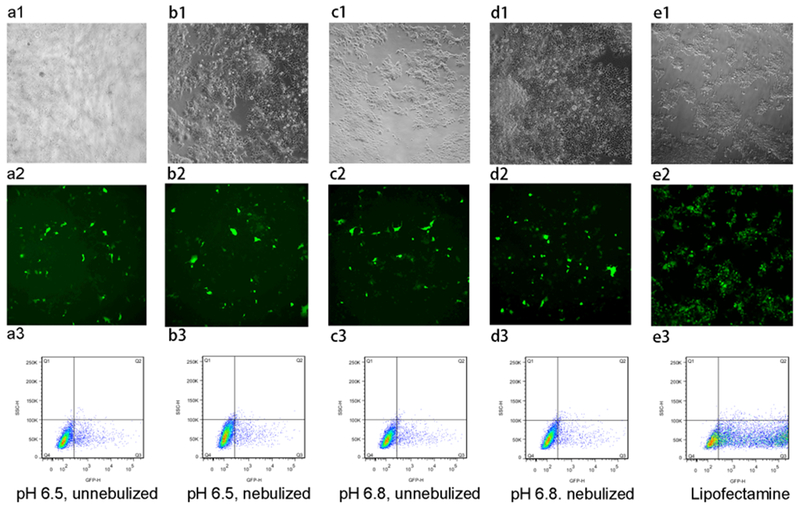
Figure 11 shows the transfection efficiency of mPEG–OC/DNA and mPEG–C/DNA nanocomplexes, respectively (data normalized to the lipofectamine group). We tested the effects of nebulization, N/P ratios, and media pH values on transfection efficiency. It was found that there was no obvious transfection in media at pH for nanocomplexes at different N/P ratios (data not shown), while the maximum transfection efficiency was reached in media at pH 6.5 and 6.8 for mPEG–OC/DNA nanocomplexes at an N/P ratio of 20. After the nebulization, there is no significant change in the transfection efficiency in media at pH 6.5 and 6.8 (Figure 11a). For mPEG–C/DNA nanocomplexes, it was also found that the maximum transfection efficiency was obtained in media at pH 6.5 and 6.8 at an N/P ratio of 5. The nebulization process had no significant effect on the transfection efficiency (Figure 11b). Figures 12 and 13 represent the contrast images, fluorescent images, and flow cytometry dot-plot graph of mPEG–OC/DNA nanocomplexes and mPEG–C/DNA nanocomplexes.
Figure 11.
Transfection efficiency of (a) mPEG–OC/DNA nanocomplexes, (b) mPEG–C/DNA nanocomplexes.
Figure 12.
Transfection efficiency of mPEG–OC/DNA nanocomplexes (N/P = 20) in HEK-293 cells. (a1–a3) HEK-293 cells transfected with mPEG–OC/DNA nanocomplexes without nebulization at pH = 6.5, (b1–b3) HEK-293 cells transfected with mPEG–OC/DNA nanocomplexes with nebulization at pH = 6.5, (c1–c3) HEK-293 cells transfected with mPEG–OC/DNA nanocomplexes without nebulization at pH = 6.8, (d1–d3) HEK-293 cells transfected with mPEG–OC/DNA nanocomplexes with nebulization at pH = 6.8, (e1–e3) HEK-293 cells transfected with lipofectamine 3000. (a1–e1) contrast phase images, (b1–e1) fluorescent images, and (c1–e1) flow cytometry dot-plot (SSC-H/GFP-H).
Figure 13.
Transfection efficiency of mPEG–C/DNA nanocomplexes (N/P = 5) in HEK-293 cells. (a1–a3) HEK-293 cells transfected with mPEG–C/DNA nanocomplexes without nebulization at pH = 6.5, (b1–b3) HEK-293 cells transfected with mPEG–C/DNA nanocomplexes with nebulization at pH = 6.5, (c1–c3) HEK-293 cells transfected with mPEG–C/DNA nanocomplexes without nebulization at pH = 6.8, (d1–d3) HEK-293 cells transfected with mPEG–C/DNA nanocomplexes with nebulization at pH = 6.8, (e1–e3) HEK-293 cells transfected with lipofectamine 3000. (a1–e1) contrast phase images, (b1–e1) fluorescent images, and (c1–e1) flow cytometry dot-plot (SSC-H/GFP-H).
4. DISCUSSION
The present study is a proof-of-concept study that investigated the potential use of PEGylated chitosan copolymer-mediated nonviral delivery of a gene-editing system for the treatment of lung diseases via aerosolization. Both mPEG–OC/DNA and mPEG–C/DNA nanocomplexes showed the capability not only to protect DNA from degradation by DNase I and nebulization but also to transport through a mucus model (Figures 9 and 10) and reached maximum transfection efficiency at an N/P ratio of 20 and an N/P ratio of 5 for mPEG–OC/DNA and mPEG–C/DNA nanocomplexes (Figures 11–13), respectively.
4.1. Properties of Nanocomplexes.
Since the positively charged amine groups present in N-deacetylated subunits of chitosan are essential for gene delivery function,27 we conjugated PEG to the hydroxyl groups on the chitosan to preserve the amine group’s function. In the copolymer synthesis, the activation of mPEG–COOH is a key step. In this study, we activated mPEG–COOH with HOBT first in room temperature followed by DMAP-mediated activation. This two-step activation process was employed to overcome the low esterification of sterically hindered hydroxyl groups.24 By using this method, we obtained mPEG–OC and mPEG–C copolymers with relatively high DS values, which were calculated based on eq 2 (44.9% for mPEG–OC and 47.8% for mPEG–C).26 Then, we prepared the PEGylated chitosan/DNA nanocomplexes at different N/P ratios through a self-assembly process by the electrostatic interaction between the positively charged amine groups in chitosan and the negatively charged phosphate groups in plasmid DNA. The binding of DNA to PEGylated chitosan through electrostatic interaction is important for the formation and effectiveness of nanocomplexes, so we employed agarose gel electrophoresis to identify the loading efficiency of DNA. Once the nanocomplexes formed through the electrostatic interaction, the overall net charge of the nanocomplexes become positive. As shown in Figure 7b,c, the retardation of DNA bands near the wells indicated the loading of DNA in PEGylated chitosan. We found that mPEG–C showed a higher binding efficiency than mPEG–OC, because complete binding of DNA was reached at an N/P ratio of 2 for mPEG–C, while for mPEG–OC, the complete binding of DNA was achieved at an N/P ratio of 10 (Figure 7b,c). This finding indicated that a low molecular weight chitosan required a higher N/P ratio for complete condensation of DNA, which is also shown by the results of ultrapure chitosan-mediated condensation of DNA reported previously, in which NOVAFECT G214 (MW 340 kDa) condensed DNA at a lower N/P ratio compared to NOVAFECT O15 (5.7 kDa) and NOVAFECT O25 (MW 7.3 kDa).28
The size and zeta potential of chitosan/DNA nanocomplexes are affected by various factors including N/P ratio, molecular weight of chitosan, plasmid concentration, pH, and ionic strength of media.27,29,30 The size of mPEG–C/DNA nanocomplexes reached the maximum values (1687 ± nm) at an N/P ratio of 1, which was beyond the nanorange (Figure 8b). This phenomenon may be attributed to the overall neutrally charged nanocomplexes at an N/P ratio of 1 (Figure 8d), in which particle aggregation may occur due to the lack of an interparticulate repulsive force.31 It has been reported that the size of chitosan/DNA nanoparticles decreases as the N/P ratio increased,10 while Kadiyala et al. found the size of chitosan/DNA nanocomplexes increased as N/P ratio increased.32 In this study, we did not observe a clear correlation between the size and N/P ratios, which is consistent with other studies.27,28,30 The most obvious change in zeta potential appeared at an N/P ratio of 2 for mPEG–OC/DNA nanocomplexes and an N/P ratio of 1 for mPEG–C/DNA nanocomplexes and did not change significantly after a certain N/P ratio was reached (10 for mPEG–OC/DNA and 5 for mPEG–C/DNA). This phenomenon was also observed in other studies reported previously.10 The zeta potentials of nanocomplexes in this study are generally lower (more neutral) than those reported in other studies,27,30 which may be in part attributed to the shielding effect of PEG and the fact that pH values and ionic strength of the measurement medium may influence zeta potential values as mentioned above.33
To test the feasibility to deliver nanocomplexes by inhalation, we nebulized the PEGylated chitosan/DNA nanocomplexes with a vibrating mesh nebulizer, Aerogen Solo, and characterized their properties. The gel retardation assay showed that the structural integrity of nanocomplexes at all N/P ratios was preserved after the nebulization process, indicating that PEGylated chitosan did not lose its capability to condense DNA (Figure 7d,e). However, the size and zeta potential of mPEG–OC/DNA nanocomplexes changed largely at N/P ratios of 0.5 and 1 for mPEG–OC/DNA nanocomplexes, while the zeta potential of mPEG–C/DNA nanocomplexes only at an N/P ratio of 0.5 showed the most obvious change (Figure 8c,d). The size and zeta potential of nanocomplexes from an N/P ratio of 2 to an N/P ratio of 30 was not affected by the nebulization process. These data suggested that nanocomplexes at high N/P ratios presented a higher stability than that at lower N/P ratios with the nebulization process. Mohammadi et al. reported that the size and zeta potential of chitosan–DNA–fibronectin attachment protein of Mycobacterium bovis (FAP-B) nanoparticles at an N/P ratio of 20 were not significantly affected after nebulization by the air jet nebulizer, which is consistent with our finding.34
The releasing and enzyme protection capabilities of nanocomplexes were evaluated by gel retardation assay. For mPEG–OC/DNA nanocomplexes, 2% SDS treatment displaced part of the DNA from the compacted nanocomplexes at all charge ratios (lanes 2–8 in Figure 9a). In contrast, for mPEG–C/DNA nanocomplexes, 2% SDS was not able to release DNA when the N/P ratio reached 20 and 30 (lanes 7 and 8 in Figure 9b), which indicated that at high N/P ratios, the plasmid can be condensed more efficiently and therefore was more difficult to be released. One of the reasons why the DNA was not completely displaced in this test may be related to pH and polymer charge. The displacement assay was performed in a pH = 5.5 environment, in which PEGylated chitosan had more protonated amine groups to condense DNA. Chitosan has been shown to be able to protect DNA from nuclease digestion by different studies.10,35 mPEG–OC and mPEG–C showed different capabilities to protect DNA from DNase I digestion. mPEG–OC showed the enzyme protection ability only when the N/P ratio reached 5 (lane 6 in Figure 9c), while the mPEG–C was able to protect DNA from DNase I digestion at all N/P ratios (lanes 3–9 in Figure 9d). This difference can be partially attributed to the higher binding efficiency of mPEG–C, which leads to a stronger electrostatic interaction between copolymer and DNA. It is well-known that recombinant human DNase I (rhDNase I, marketed as Pulmozyme) is routinely applied to the airways of CF patients to help with mucus clearance and pulmonary function.36–38 This DNase I protection property of nanocomplexes enhances their potential to be applied in patients who are coadministrated with DNase I such as Pulmozyme during therapeutic use of the gene-editing system.
4.2. PEGylated Chitosan/DNA Nanocomplexes Have the Capability To Penetrate the Mucus Model.
To our knowledge, this study is the first report showing that PEGylated chitosan can be used as a carrier to transport DNA through the mucus model. Several lung diseases may be considered targets to gene editing. For example, CF is the most common life-limiting genetic disorder caused by mutations in the cystic fibrosis transmembrane conductance regulator (CFTR) gene, which regulates anion transport across epithelia barriers and mucociliary clearance. The defect of CFTR protein leads to reduced secretion of both chloride and bicarbonate, which impedes mucosal clearance.39,40 As a result, mucus in CF patients is denser, highly glycosylated, and more acidic compared to mucus in healthy people,17,18 which results in a difficult barrier for drug transportation in vivo.41 In this study, we utilized a modified mucus model previously described.25 The hydrophilic PEG has been demonstrated to be capable to improve the diffusion rate of particles in mucus by reducing the adherence to hydrophobic domains on mucin fibers.16,21,42–44 PEG has been also employed to improve the diffusion rate of nanoparticulate gene carriers in CF mucus by conjugating PEG to polyethylenimine (PEI) and poly-l-lysine (PLL) densely.20 We conjugated mPEG to chitosan and used the PEGylated chitosan as a carrier to overcome the viscoelastic and adhesive mucus barrier in the airway for pulmonary delivery of the gene-editing system. In our study, even though we did not quantify the diffusion rate, both mPEG–OC/DNA and mPEG–C/DNA nanocomplexes showed their enhanced capability to transport through mucus compared to the mucoadhesive chitosan group. DNA bands were observed after the gel retardation assay for both mPEG–OC/DNA and mPEG–C/DNA (Figure 10b) compared to the absence of bands for complexes without PEGylation (Figure 10a). The hydrodynamic size of nanocomplexes we developed in this study were larger than PEG–PEI and PEG–PLL nanoparticles previously reported, but the nanocomplexes (mostly below 200 nm) were able to penetrate CF mucus, whose average 3D mesh spacing is reported to be on the order of 140 ± 50 nm (range: 60–300 nm).20 Unlike the neutral zeta potential of nanoparticles shown in previous studies, the nanocomplexes we developed possessed more positive zeta potential values. The pKa of the primary amine group in chitosan is around 6.5,14 which means more amine groups can be protonated at pH = 5.5 compared to 7.4, which was the pH value of the buffer they used for the zeta potential measurement20.
4.3. Transfection Efficiency of PEGylated Chitosan Nanocomplexes Is Influenced by Nanocomplex Composition and pH Values.
The chitosan-mediated transfection efficiency of plasmids depends on many factors including N/P ratio, the pH of the culture medium, chitosan molecular weight, degree of deacetylation, and cell type.15 The optimal N/P ratio for chitosan-mediated transfection varied in different studies,45–47 which may be explained, in part, by the fact that chitosan was at a different molecular weight and degree of deacetylation. In present study, the degree of deacetylation of both low molecular weight chitosan and medium molecular weight chitosan is 85%, as identified by NMR (data not shown). We used the HEK293 cell line as model to test the transfection efficiency in media with different pH values. We found that the maximum transfection efficiency of mPEG–OC/DNA and mPEG–C/DNA nanocomplexes was reached at N/P ratios of 20 and 5, respectively (Figures 11–13), which indicated that high molecular weight chitosan showed a higher transfection efficiency at a low N/P ratio.45–47 In order to verify if our PEGylated chitosan/DNA system showed transfection efficiency at the low pH values, we adjusted the media pH to 6.5 and 6.8 and did the transfection assay at these low pH values. As shown in Figures 11–13, DNA was shown to be effectively delivered into cells at low pH conditions as determined by using flow cytometry and fluorescent microscopy. The transfection efficiency is largely dependent on the pH value of the culture medium, because pH value affects the charge density of the nanocomplexes. In this study, both mPEG–OC/DNA and mPEG–C/DNA nanocomplexes achieved a higher transfection efficiency at pH 6.5 and 6.8 than at 7.1 (data not shown) as reported by other authors.46,48 It is worth noting that the pH of mucus in the airway is around 6.5, which indicated that the relative acidic environment in mucus may improve the transfection efficiency of nanocomplexes in patients.17 The low transfection efficiency at higher pH values may be explained by dissociation of free plasmid from the nanocomplex.49 The relatively low transfection efficiency compared to ultrapure chitosan/DNA complexes can be partially attributed to that at a high percent of PEGylation, PEG exerts a shielding effect on the positive surface charge of the nanocomplexes and therefore prevents nonspecific interactions with the cells.50 This inhibitory effect of PEG conjugation on cell uptake was also reported by other authors.51,52 However, the mPEG is critical for the mucus-permeation property. Many studies have proven that the conjugation of PEG at a high density significantly improved the penetration of nanoparticles through mucus.20,21 The balance between transfection efficiency and mucus-penetration capability is worthy to be studied in our future research. We plan to optimize our delivery system by adjusting the degree of PEG substitution and conjugating other moieties to improve the transfection efficiency and mucus-penetration capability. Overall efficiency of the delivery system is not only related to transfection efficiency. It will be a function of stability during aerosolization, mucus penetration, and cellular transfection. One cannot have an effective therapy without all three processes being successful. Therefore, the transfection efficiencies should be viewed in light of the overall delivery process and barriers.
The functional integrity of nanocomplexes after nebulization was evaluated by transfection efficiency. After the treatment of nebulization, the transfection efficiency of both mPEG–OC/DNA and mPEG–C/DNA nanocomplexes showed no significant difference compared to the nanocomplexes without nebulization at pH 6.5 and 6.8 (Figure 11). Suitable aerosol deposition is critical for the effectiveness of inhalation therapy and has been widely studied. Factors affecting aerosol deposition can be broadly classified into three groups: inhalation mode and delivery system, particle properties, and characteristics of the airway of subject.53–55 Thus, correct use of the nebulizer by patients is important for the therapeutic effects of drug. The deposition of aerosol also depends on the size, shape, and density of drug particles because of the dynamic movement of particles through upper and lower airways. The mechanisms for particle deposition include inertial impaction, sedimentation, and diffusion. Inertial impaction generally occurs in upper airways when the particle size is larger than 5 μm. As the particle size decreases to 0.5–5 μm, the main mechanism for deposition is gravitational sedimentation, and particles with sizes between 1 and 5 μm tend to deposit in lower airways.55 As a result, a desirable regional particle deposition to lower airways can be achieved by appropriate nebulizer selection and drug formulation composition.
It is worth noting that the plasmid encodes sgRNA, Cas9 and GFP. Therefore, expression of GFP is also an indication of expression of Cas9 and sgRNA. After the expression of Cas9 and sgRNA, the gene-editing events depend on the cellular mechanisms such as the NHEJ pathway. Since our goal is to correct gene mutations in CFTR utilizing this platform in future studies, we plan to test the gene correction efficiency in lung epithelial cells with CFTR mutations (such as CuFi-1 cells) in our future research. The functional activity of the CRISPR/Cas9 system we used in this study has been widely reported in other research articles. Here we only tested the transfection efficiency in HEK293 cells, and further studies are needed to show the transfection capability in lung epithelial cells for clinical application.
5. CONCLUSION
The design requirements for an inhaled gene-editing delivery system are highly restrictive. In this study, we developed PEGylated chitosan as a carrier to deliver a CRISPR/Cas9 genome-editing system and demonstrated that the nanocomplexes can be aerosolized without loss of function, had the capability to penetrate mucus, and could deliver the CRISPR/Cas9 system to cells. In addition, the nanocomplexes protected CRISPR/Cas9 in the format of DNA from both DNase I digestion and nebulization. Through a balance of factors, a nontoxic system may be engineered through modification of the polymer chemistry and nanoparticle design.
ACKNOWLEDGMENTS
We thank Dr. Hui Huang and Yu-Cheng Yeh for sharing their knowledge in chemical conjugation. Research reported in this publication was supported by NIH National Heart, Lung and Blood Institute (NHLBI) of the National Institutes of Health under award number R01HL138251. The content is solely the responsibility of the authors and does not necessarily represent the official views of the National Institutes of Health.
Footnotes
The authors declare no competing financial interest.
REFERENCES
- (1).Jones CH; Chen C-K; Ravikrishnan A; Rane S; Pfeifer BA Overcoming Nonviral Gene Delivery Barriers: Perspective and Future. Mol. Pharmaceutics 2013, 10 (11), 4082–4098. [DOI] [PMC free article] [PubMed] [Google Scholar]
- (2).Kay MA State-of-the-art gene-based therapies: the road ahead. Nat. Rev. Genet 2011, 12 (5), 316–28. [DOI] [PubMed] [Google Scholar]
- (3).Robbins PD; Ghivizzani SC Viral Vectors for Gene Therapy. Pharmacol. Ther 1998, 80 (1), 35–47. [PubMed] [Google Scholar]
- (4).Kotterman MA; Chalberg TW; Schaffer DV Viral Vectors for Gene Therapy: Translational and Clinical Outlook. Annu. Rev. Biomed. Eng 2015, 17 (1), 63–89. [DOI] [PubMed] [Google Scholar]
- (5).Ramamoorth M; Narvekar A Non Viral Vectors in Gene Therapy-An Overview. Journal of Clinical and Diagnostic Research: JCDR 2015, 9 (1), GE01–GE06. [DOI] [PMC free article] [PubMed] [Google Scholar]
- (6).Nayerossadat N; Maedeh T; Ali PA Viral and nonviral delivery systems for gene delivery. Adv. Biomed. Res 2012, 1, 27. [DOI] [PMC free article] [PubMed] [Google Scholar]
- (7).Boussif O; Lezoualc’h F; Zanta MA; Mergny MD; Scherman D; Demeneix B; Behr JP A versatile vector for gene and oligonucleotide transfer into cells in culture and in vivo: polyethylenimine. Proc. Natl. Acad. Sci. U. S. A 1995, 92 (16), 7297–301. [DOI] [PMC free article] [PubMed] [Google Scholar]
- (8).Wu GY; Wu CH Receptor-mediated in vitro gene transformation by a soluble DNA carrier system. J. Biol. Chem 1987, 262 (10), 4429–4432. [PubMed] [Google Scholar]
- (9).Sompayrac LM; Danna KJ Efficient infection of monkey cells with DNA of simian virus 40. Proc. Natl. Acad. Sci. U. S. A 1981, 78 (12), 7575–8. [DOI] [PMC free article] [PubMed] [Google Scholar]
- (10).Puras G; Zarate J; Aceves M; Murua A; Diaz AR; Aviles-Triguero M; Fernandez E; Pedraz JL Low molecular weight oligochitosans for non-viral retinal gene therapy. Eur. J. Pharm. Biopharm 2013, 83 (2), 131–40. [DOI] [PubMed] [Google Scholar]
- (11).Onishi H; Machida Y Biodegradation and distribution of water-soluble chitosan in mice. Biomaterials 1999, 20 (2), 175–82. [DOI] [PubMed] [Google Scholar]
- (12).Aspden TJ; Mason JD; Jones NS; Lowe J; Skaugrud O; Illum L Chitosan as a nasal delivery system: the effect of chitosan solutions on in vitro and in vivo mucociliary transport rates in human turbinates and volunteers. J. Pharm. Sci 1997, 86 (4), 509–13. [DOI] [PubMed] [Google Scholar]
- (13).Lee KY; Kwon IC; Kim YH; Jo WH; Jeong SY Preparation of chitosan self-aggregates as a gene delivery system. J. Controlled Release 1998, 51 (2), 213–220. [DOI] [PubMed] [Google Scholar]
- (14).Mao S; Sun W; Kissel T Chitosan-based formulations for delivery of DNA and siRNA. Adv. Drug Delivery Rev. 2010, 62 (1), 12–27. [DOI] [PubMed] [Google Scholar]
- (15).Kim T-H; Jiang H-L; Jere D; Park I-K; Cho M-H; Nah J-W; Choi Y-J; Akaike T; Cho C-S Chemical modification of chitosan as a gene carrier in vitro and in vivo. Prog. Polym. Sci 2007, 32 (7), 726–753. [Google Scholar]
- (16).Cone RA Barrier properties of mucus. Adv. Drug Delivery Rev. 2009, 61 (2), 75–85. [DOI] [PubMed] [Google Scholar]
- (17).Song Y; Salinas D; Nielson DW; Verkman AS Hyperacidity of secreted fluid from submucosal glands in early cysticfibrosis. American journal of physiology. Cell physiology 2006, 290 (3), C741–9. [DOI] [PubMed] [Google Scholar]
- (18).Bhat PG; Flanagan DR; Donovan MD Drug diffusion through cystic fibrotic mucus: steady-state permeation, rheologic properties, and glycoprotein morphology. J. Pharm. Sci 1996, 85 (6), 624–30. [DOI] [PubMed] [Google Scholar]
- (19).Dang JM; Leong KW Natural polymers for gene delivery and tissue engineering. Adv. Drug Delivery Rev. 2006, 58 (4), 487–499. [DOI] [PubMed] [Google Scholar]
- (20).Suk JS; Kim AJ; Trehan K; Schneider CS; Cebotaru L; Woodward OM; Boylan NJ; Boyle MP; Lai SK; Guggino WB; Hanes J Lung gene therapy with highly compacted DNA nanoparticles that overcome the mucus barrier. J. Controlled Release 2014, 178, 8–17. [DOI] [PMC free article] [PubMed] [Google Scholar]
- (21).Lai SK; O’Hanlon DE; Harrold S; Man ST; Wang YY; Cone R; Hanes J Rapid transport of large polymeric nanoparticles in fresh undiluted human mucus. Proc. Natl. Acad. Sci. U. S. A 2007, 104 (5), 1482–1487. [DOI] [PMC free article] [PubMed] [Google Scholar]
- (22).El-Sherbiny IM; McGill S; Smyth HD Swellable microparticles as carriers for sustained pulmonary drug delivery. J. Pharm. Sci 2010, 99 (5), 2343–56. [DOI] [PMC free article] [PubMed] [Google Scholar]
- (23).Atassi MZ; Manshouri T Synthesis of tolerogenic monomethoxypolyethylene glycol and polyvinyl alcohol conjugates of peptides. J. Protein Chem. 1991, 10 (6), 623–7. [DOI] [PubMed] [Google Scholar]
- (24).Morales-Serna JA; Vera A; Paleo E; Garcia-Rios E; Gavino R; García de la Mora G; Cardenas J Using Benzotriazole Esters as a Strategy in the Esterification of Tertiary Alcohols. Synthesis 2010, 2010 (24), 4261–4267. [Google Scholar]
- (25).Ghani M; Soothill JS Ceftazidime, gentamicin, and rifampicin, in combination, kill biofilms of mucoid Pseudomonas aeruginosa. Can. J. Microbiol 1997, 43 (11), 999–1004. [DOI] [PubMed] [Google Scholar]
- (26).Sugimoto M; Morimoto M; Sashiwa H; Saimoto H; Shigemasa Y Preparation and characterization of water-soluble chitin and chitosan derivatives. Carbohydr. Polym 1998, 36 (1), 49–59. [Google Scholar]
- (27).MacLaughlin FC; Mumper RJ; Wang J; Tagliaferri JM; Gill I; Hinchcliffe M; Rolland AP Chitosan and depolymerized chitosan oligomers as condensing carriers for in vivo plasmid delivery. J. Controlled Release 1998, 56 (1–3), 259–72. [DOI] [PubMed] [Google Scholar]
- (28).Klausner EA; Zhang Z; Chapman RL; Multack RF; Volin MV Ultrapure chitosan oligomers as carriers for corneal gene transfer. Biomaterials 2010, 31 (7), 1814–20. [DOI] [PubMed] [Google Scholar]
- (29).Nimesh S; Thibault MM; Lavertu M; Buschmann MD Enhanced Gene Delivery Mediated by Low Molecular Weight Chitosan/DNA Complexes: Effect of pH and Serum. Mol. Biotechnol 2010, 46 (2), 182–196. [DOI] [PMC free article] [PubMed] [Google Scholar]
- (30).Fernandez Fernandez E; Santos-Carballal B; Weber WM; Goycoolea FM Chitosan as a non-viral co-transfection system in a cystic fibrosis cell line. Int. J. Pharm 2016, 502 (1–2), 1–9. [DOI] [PubMed] [Google Scholar]
- (31).De Smedt SC; Demeester J; Hennink WE Cationic Polymer Based Gene Delivery Systems. Pharm. Res 2000, 17 (2), 113–126. [DOI] [PubMed] [Google Scholar]
- (32).Kadiyala I; Loo Y; Roy K; Rice J; Leong KW Transport of Chitosan-DNA nanoparticles in human intestinal M-cell model versus normal intestinal enterocytes. Eur. J. Pharm. Sci 2010, 39 (1-3), 103. [DOI] [PMC free article] [PubMed] [Google Scholar]
- (33).Guzman-Villanueva D; El-Sherbiny IM; Vlassov AV; Herrera-Ruiz D; Smyth HD Enhanced cellular uptake and gene silencing activity of siRNA molecules mediated by chitosan-derivative nanocomplexes. Int. J. Pharm 2014, 473 (1-2), 579–90. [DOI] [PubMed] [Google Scholar]
- (34).Mohammadi Z; Dorkoosh FA; Hosseinkhani S; Gilani K; Amini T; Najafabadi AR; Tehrani MR In vivo transfection study of chitosan-DNA-FAP-B nanoparticles as a new non viral vector for gene delivery to the lung. Int. J. Pharm 2011, 421 (1), 183–8. [DOI] [PubMed] [Google Scholar]
- (35).Mao HQ; Roy K; Troung-Le VL; Janes KA; Lin KY; Wang Y; August JT; Leong KW Chitosan-DNA nanoparticles as gene carriers: synthesis, characterization and transfection efficiency. J. Controlled Release 2001, 70 (3), 399–421. [DOI] [PubMed] [Google Scholar]
- (36).Shah PL; Scott SF; Knight RA; Marriott C; Ranasinha C; Hodson ME In vivo effects of recombinant human DNase I on sputum in patients with cystic fibrosis. Thorax 1996, 51 (2), 119–125. [DOI] [PMC free article] [PubMed] [Google Scholar]
- (37).Shak S; Capon DJ; Hellmiss R; Marsters SA; Baker CL Recombinant human DNase I reduces the viscosity of cystic fibrosis sputum. Proc. Natl. Acad. Sci. U. S. A 1990, 87 (23), 9188–9192. [DOI] [PMC free article] [PubMed] [Google Scholar]
- (38).El Hassan NO; Chess PR; Huysman MW; Merkus PJ; de Jongste JC Rescue use of DNase in critical lung atelectasis and mucus retention in premature neonates. Pediatrics 2001, 108 (2), 468–470. [DOI] [PubMed] [Google Scholar]
- (39).O’Sullivan BP; Freedman SD Cystic fibrosis. Lancet 2009, 373 (9678), 1891–904. [DOI] [PubMed] [Google Scholar]
- (40).Elborn JS Cystic fibrosis. Lancet 2016, 388 (10059), 2519–2531. [DOI] [PubMed] [Google Scholar]
- (41).Wesley AW; Qureshi AR; Forstner GG; Forstner JF Differences in mucus glycoproteins of small intestine from subjects with and without cystic fibrosis. Advances in experimental medicine and biology 1982, 144, 145–6. [DOI] [PubMed] [Google Scholar]
- (42).Suk JS; Lai SK; Wang Y-Y; Ensign LM; Zeitlin PL; Boyle MP; Hanes J The penetration of fresh undiluted sputum expectorated by cystic fibrosis patients by non-adhesive polymer nanoparticles. Biomaterials 2009, 30 (13), 2591–2597. [DOI] [PMC free article] [PubMed] [Google Scholar]
- (43).Schuster BS; Suk JS; Woodworth GF; Hanes J Nanoparticle diffusion in respiratory mucus from humans without lung disease. Biomaterials 2013, 34 (13), 3439–3446. [DOI] [PMC free article] [PubMed] [Google Scholar]
- (44).Lai SK; Wang YY; Hida K; Cone R; Hanes J Nanoparticles reveal that human cervicovaginal mucus is riddled with pores larger than viruses. Proc. Natl. Acad. Sci. U. S. A 2010, 107 (2), 598–603. [DOI] [PMC free article] [PubMed] [Google Scholar]
- (45).Romøren K; Pedersen S; Smistad G; Evensen Ø; Thu BJ The influence of formulation variables on in vitro transfection efficiency and physicochemical properties of chitosan-based polyplexes. Int. J. Pharm 2003, 261 (1), 115–127. [DOI] [PubMed] [Google Scholar]
- (46).Lavertu M; Methot S; Tran-Khanh N; Buschmann MD High efficiency gene transfer using chitosan/DNA nanoparticles with specific combinations of molecular weight and degree of deacetylation.Biomaterials 2006, 27 (27), 4815–24. [DOI] [PubMed] [Google Scholar]
- (47).Weecharangsan W; Opanasopit P; Ngawhirunpat T; Apirakaramwong A; Rojanarata T; Ruktanonchai U; Lee RJ Evaluation of chitosan salts as non-viral gene vectors in CHO-K1 cells. Int. J. Pharm 2008, 348 (1-2), 161–8. [DOI] [PubMed] [Google Scholar]
- (48).Zhao X; Yu SB; Wu FL; Mao ZB; Yu CL Transfection of primary chondrocytes using chitosan-pEGFP nanoparticles. J. Controlled Release 2006, 112 (2), 223–8. [DOI] [PubMed] [Google Scholar]
- (49).Ishii T; Okahata Y; Sato T Mechanism of cell transfection with plasmid/chitosan complexes. Biochim. Biophys. Acta, Biomembr. 2001, 1514 (1), 51–64. [DOI] [PubMed] [Google Scholar]
- (50).Benns JM; Mahato RI; Kim SW Optimization of factors influencing the transfection efficiency of folate-PEG-folate-graftpolyethylenimine. J. Controlled Release 2002, 79 (1-3), 255–69. [DOI] [PubMed] [Google Scholar]
- (51).Majzoub RN; Chan C-L; Ewert KK; Silva BFB; Liang KS; Jacovetty EL; Carragher B; Potter CS; Safinya CR Uptake and transfection efficiency of PEGylated cationic liposome–DNA complexes with and without RGD-tagging. Biomaterials 2014, 35 (18), 4996–5005. [DOI] [PMC free article] [PubMed] [Google Scholar]
- (52).Pelaz B; del Pino P; Maffre P; Hartmann R; Gallego M; Rivera-Fernandez S; de la Fuente JM; Nienhaus GU; Parak WJ Surface Functionalization of Nanoparticles with Polyethylene Glycol: Effects on Protein Adsorption and Cellular Uptake. ACS Nano 2015, 9 (7), 6996–7008. [DOI] [PubMed] [Google Scholar]
- (53).Palmes ED; Wang CS; Goldring RM; Altshuler B Effect of depth of inhalation on aerosol persistence during breath holding. J. Appl. Physiol 1973, 34 (3), 356–360. [DOI] [PubMed] [Google Scholar]
- (54).Pavia D; Thomson ML; Clarke SW; Shannon HS Effect of lung function and mode of inhalation on penetration of aerosol into the human lung. Thorax 1977, 32 (2), 194–197. [DOI] [PMC free article] [PubMed] [Google Scholar]
- (55).Hilman B Aerosol Deposition and Delivery of Therapeutic Aerosols. J. Asthma 1991, 28 (4), 239–242. [DOI] [PubMed] [Google Scholar]


