Abstract
In this study we investigated the performance of two norbormide (NRB)-derived fluorescent probes, NRBMC009 (green) and NRBZLW0047 (red), on dissected, living larvae of Drosophila, to verify their potential application in live cell imaging confocal microscopy. To this end, larval tissues were exposed to NRB probes alone or in combination with other commercial dyes or GFP-tagged protein markers. Both probes were rapidly internalized by most tissues (except the central nervous system) allowing each organ in the microscope field to be readily distinguished at low magnification. At the cellular level, the probes showed a very similar distribution (except for fat bodies), defined by loss of signal in the nucleus and plasma membrane, and a preferential localization to endoplasmic reticulum (ER) and mitochondria. They also recognized ER and mitochondrial phenotypes in the skeletal muscles of fruit fly models that had loss of function mutations in the atlastin and mitofusin genes, suggesting NRBMC009 and NRBZLW0047 as potentially useful screening tools for characterizing ER and mitochondria morphological alterations. Feeding of larvae and adult Drosophilae with the NRB-derived dyes led to staining of the gut and its epithelial cells, revealing a potential role in food intake assays. In addition, when flies were exposed to either dye over their entire life cycle no apparent functional or morphological abnormalities were detected. Rapid internalization, a bright signal, a compatibility with other available fluorescent probes and GFP-tagged protein markers, and a lack of toxicity make NRBZLW0047 and, particularly, NRBMC009 highly performing fluorescent probes for live cell microscopy studies and food intake assays in Drosophila.
Introduction
Norbormide [5-(α-hydroxy-α-2-pyridylbenzyl)-7-(α-2-pyridylbenzylidene)-5-norbornene-2,3-dicarboximide] (NRB) is a selective rat toxicant that exhibits little or no non-target effects [1], and was developed and commercialized as an ecologic pesticide in the 1980s. Evidence suggests that the rat-selective action of NRB is mediated by a generalized vasoconstrictor effect that has only been observed in the rat peripheral blood vessels, both in vivo and in vitro. In contrast, NRB displays a vasorelaxant action in arteries from non-rat species, as well as in rat aorta and extravascular smooth muscle, that has been proposed to be the result of a reduction of Ca2+ entry through L-type Ca2+ channels [2,3]. The molecular mechanism underlying NRB-induced vasoconstriction is not known, however, it has been proposed that the compound acts on rat vascular myocytes where it activates the PLC-IP3-PKC pathway [2], a signaling cascade stimulated by most receptor-coupled vasoconstrictor agents [4]. In an attempt to identify the cellular targets of NRB, we previously developed fluorescent derivatives of the parent compound by linking it to either nitrobenzoxadiazole (NBD) or boron-dipyrromethene (BODIPY FL) fluorophores, and found that both were able to clearly label intracellular structures such as endoplasmic reticulum (ER), Golgi apparatus, mitochondria, and lipid droplets (LDs) in various cell lines, in the absence of cytotoxic effects. Based on these results, we proposed NRB as a scaffold for the development of new, high performing, non-toxic fluorescent probes for live cell imaging [5,6].
Drosophila melanogaster is an animal model widely used to investigate the biochemical pathways and the cellular/subcellular morphological alterations that characterize human diseases [7–12]. Confocal fluorescent microscopy live cell imaging is a particularly informative methodology in this model, especially when fluorescent probes are used in combination with genetic tools (e.g. mutant flies, RNA interference, fluorescently marked proteins, Gal4/UAS activation system) [13,14], allowing the visualization of dynamic biological processes in living systems without the artifacts often generated by sample fixation procedures [15].
In this study, we investigated the performance of two NRB-derived fluorescent probes, the previously developed NRBMC009 (green fluorescence) and the newly developed NRBZLW0047 (red fluorescence), on dissected, living third instar larvae of Drosophila melanogaster, to assess their potential application in live cell imaging confocal microscopy. In particular, we were able to characterize the distribution of NRBMC009 and NRBZLW0047 to cellular structures and organelles in tissues of wild-type Drosophila larvae, as well as in tissues of mutant lines exhibiting morphological alterations of endoplasmic reticulum and mitochondria. Finally, we explored if these probes could be useful for studying fruit fly feeding and gut morphology.
Material and methods
NRBMC009 and NRBZLW0047 synthesis
NRBMC009, a BODIPY FL derivative of norbormide, was synthesized as previously reported [6]. Stock solutions 1 mM in DMSO were prepared and maintained at -20°C and diluted to the desired concentration before each experiment.
NRBZLW0047, a BODIPY TMR derivative of norbormide, was prepared as follows: BODIPY TMR (4,4-difluoro-5-(4-methoxyphenyl)-1,3-dimethyl-4-bora-3a,4a-diaza-s-indacene-2-propionic acid) [16], along with its corresponding N-hydroxysuccinimide ester, BODIPY TMR NHS ester [16], and N-2’-aminoethyl-endo-5-(α-hydroxy-α-2-pyridylbenzyl)-7-(α-2-pyridylbenzylidene)-5-norbornene-2,3-dicarboximide [17] were prepared using literature methods. A solution of N-2’-aminoethyl-endo-5-(α-hydroxy-α-2-pyridylbenzyl)-7-(α-2-pyridylbenzylidene)-5-norbornene-2,3-dicarboximide (111 mg, 0.20 mmol), BODIPY TMR NHS ester (110 mg, 0.20 mmol) and N,N-diisopropylethylamine (35 μl, 0.20 mmol) in dichloromethane (7 ml) was stirred at room temperature for 16 h. The mixture was then diluted with dichloromethane (20 ml), washed with water (10 ml), the separated aqueous phase further extracted with dichloromethane (2 × 10 ml), the combined organic layers washed with brine (3 × 20 ml), dried over anhydrous magnesium sulfate, filtered and the solvent removed in vacuo. Purification by flash chromatography (petroleum ether/ethyl acetate, 1:3) afforded NRBZLW0047 as a mixture of endo stereoisomers (purple solid; 70 mg, 37%). 1H NMR (400 MHz, CDCl3) δ 8.64–8.38 (2H, m, αPyr), 7.88–7.82 (2H, m, ArH), 7.59–6.77 (20H, m, ArH), 6.53–6.47 (1H, m, C = CH), 6.29 (0.2H, br s, OH), 6.28 (0.1H, br s, OH), 6.21–6.20 (0.2H, m, W/H-6), 6.15–6.14 (0.1H, m, U/H-6), 5.54–5.53 (0.4H, m, Y/H-6), 5.52–5.51 (0.3H, m, V/H-6), 5.22 (0.4H, br s, OH), 5.15 (0.3H, br s, OH), 4.49–4.46 (0.2H, m, W/H-1), 4.46–4.43 (0.4H, m, Y/H-1), 4.31–4.29 (0.3H, m, V/H-1), 4.03–4.01 (0.1H, m, U/H-1), 3.85–3.84 (3H, m, OMe), 3.84–3.24 (7H, m, H-2, H-3, H-4 and NCH2CH2), 2.75–2.72 (2H, m, COCH2CH2 or COCH2CH2), 2.47 (3H, m, Me), 2.26–2.22 (2H, m, COCH2CH2 or COCH2CH2), 2.20–2.18 (3H, m, Me).
Stock solutions 1 mM in DMSO were prepared and maintained at -20°C and diluted to the desired concentration before each experiment.
Fluorescence spectra
Excitation and emission spectra of NRBMC009 and NRBZLW0047 were obtained by diluting the stock solution in Milli-Q water to reach the final concentration of 2 μM. To verify that the medium used for Drosophila live imaging (HL3) had no effect on the emission spectra, a comparison was made between probes diluted in water and probes diluted in HL3—no variation in fluorescence was observed.
Analysis of excitation/emission peaks were evaluated using a Jasco FP6500 spectrofluorometer (temperature 25°C; b = 1 cm; λ ex/em: 470/540 for NRBMC009 and 545/580 for NRBZLW0047; sli: 5/10 nm; data pitch 0.2 nm; scanning speed 200nm/min).
Fly stocks
Drosophila melanogaster strains used: w[1118] (BL-5905), Tubulin-Gal4 (BL-5138), UAS-Mito-GFP (BL-8443), UAS-mCD8-GFP (BL-5130), were obtained from Bloomington Drosophila Stock Center, and UAS-ATL2RNAi [18] and UAS-MarfRNAi (ID 40478), were resourced from Vienna Drosophila Resource Center. UAS-Lamp-GFP was provided by Helmut Krämer (University of Texas Southwestern Medical Center, Dallas), and UAS-HneuGFP was generated by cloning HNEU-GFP [19] in pUASTattB, and transgenic lines generated by BestGene Inc, (Chino Hills, CA, USA). W[1118] flies were maintained on standard food at 25°C, and Gal4/UAS crossings were performed at 28°C. Starvation was induced by leaving third instar larvae for 6 hours in 20% sucrose dissolved in PBS.
Larval dissection
Fly larvae having reached the third instar stage were pinned between the posterior spiracles and above the mouth hooks in a Sylgard dissection dish, and cut along the dorsal midline. Hemolymph-like (HL3) saline (70 mM NaCl, 5 mM KCl, 1.5 mM CaCl2, 20 mM MgCl2, 10 mM NaHCO3, 5 mM trehalose, 115 mM sucrose, 5 mM sodium HEPES, pH 7.2, all supplied by Sigma-Aldrich) was added and the lateral flaps were fastened with four needles to stretch the body wall. All larval organs were left on the muscle fillet for whole larval acquisition, whereas for single tissue acquisition the unnecessary organs were removed.
Live tissue imaging
To characterize NRBMC009 and NRBZLW0047 localization, each were diluted in HL3 medium at concentrations of 500 nM and 1 μM, respectively, and were added to the dissected larva and images acquired after 15 min. For NRBMC009 colocalization studies, ER-Tracker Red 2 μM (BODIPY TR Glibenclamide), MitoTracker Orange CMTMRos 1 μM, LysoTracker Deep Red 2 μM, HCS LipidTOX Deep Red Neutral Lipid Stain 1:100, or CellMask Orange 1 μM (all by Thermo Fisher, respectively #E34250, #M7510, #L12492, #H34477, and #10045) were added, together with NRBMC009 at 500 nM. To verify NRBZLW0047 colocalization with other organelles, it was added on dissected larvae expressing GFP-tagged proteins (Hneu-GFP, Mito-GFP, Lamp-GFP, and mCD8-GFP), or together with BODIPY 493/503 dye 10 μg/ml (#D3922, Thermo Fisher). In order to test tissue autofluorescence, dissected larvae were imaged in HL3 medium without fluorescent probes with identical laser settings of labeled tissues (S1 Fig). Whole larvae images and magnifications were acquired using a Zeiss LSM800 Axio Observer Z1 inverted microscope equipped with a Zeiss Plan-Apochromat 5x/0.15 ph1 or 40x/0.95 objectives, all other images were acquired with a Nikon D-Eclipse C1 confocal microscope equipped with a Nikon Plan Apo 60×/1.40 or a Nikon Plan Apo 40x/1.0 oil immersion objectives.
Three-choice preference assay
To test larval food preference, a Petri dish was divided in three quadrants filled with a warm liquefied standard food solution. In two quadrants, the food contained either NRBMC009 or NRBZLW0047 (both 20 μM), in the third the food was left probe-free. At the beginning of the experiment, a group of 10 larvae was placed in the middle of the assay plate and after 5 min the number of larvae on each quadrant was counted [20]. The experiment was repeated five times.
Food intake test
The food intake test was conducted in third instar larvae starved for 1 hour in 20% sucrose dissolved in PBS. The starved larvae were then divided into three groups, separately fed with brilliant blue R dye 0.08%, NRBMC009, or NRBZLW0047 (both at a concentration of 20 μM) dissolved in liquid food (sucrose 20% and 20% dry yeast in PBS) for 30 min [21], frozen at -80° C and imaged using a Leica MZ 16 FA microscope. To estimate food intake, the area of dye-labeled gut, visible through the cuticle, was quantified relative to larval total body area. 10 larvae for each experiment were used and the experiment was repeated three times. Image analysis was performed with ImageJ 1.52h software.
Analysis of gut fluorescence in Drosophila chronically fed with NRBMC009 and NRBZLW0047
Third instar larvae, grown in NRBMC009- and NRBZLW0047- enriched food as described in the chronic toxicity assay, were collected and food debris was removed by washing in PBS for 5 minutes and 70% ethanol for 1 minute and then dissected, being careful to not cut the digestive tract. Images were acquired using a Zeiss Axio Observer Z1 inverted microscope equipped with a Zeiss Plan-Apochromat 5x/0.15 ph1 or 40x/0.95 objectives.
Chronic toxicity assay
The toxicity of NRB-derived probes was investigated by exposing the flies to NRBMC009 or NRBZLW0047 20 μM over the entire life-cycle (mating, eggs maturation, pupal development, eclosion). Male and female w[1118] flies were placed in a tube with standard food containing vehicle, NRBMC009, or NRBZLW0047 20 μM, and grown at 25°C. After 5–6 days, parent flies were removed and analyzed to verify probe intake. Eggs were left to develop in food containing one of each of the NRB fluorescent probes until the eclosion. Two parameters were considered in the evaluation of toxicity: 1) eclosion rate (percent of emerged flies versus the total number of pupae, including the dead ones); 2) morphological alterations of eclosed adults. Morphological alterations of male and female adult body, eyes, wings, and legs were evaluated and imaged using a Leica MZ 16 FA microscope.
Statistical analysis
Analysis of colocalization was performed using Pearson’s correlation coefficient calculated with Coloc2 plugin of Fiji [22]. All values are expressed as means ± standard error of the mean (SEM) of n observations (n≥10). The significance of the probes fluorescence intensity versus background subtracted fluorescence intensity was calculated using unpaired t test. The significance of the three-choice assays, food intake tests and eclosion rate was calculated using One-way ANOVA test followed by Tukey's Multiple Comparison Test, using GraphPad Prism 6.01.
Results and discussion
Synthesis and excitation/emission spectra of fluorescent probes NRBMC009 and NRBZLW0047
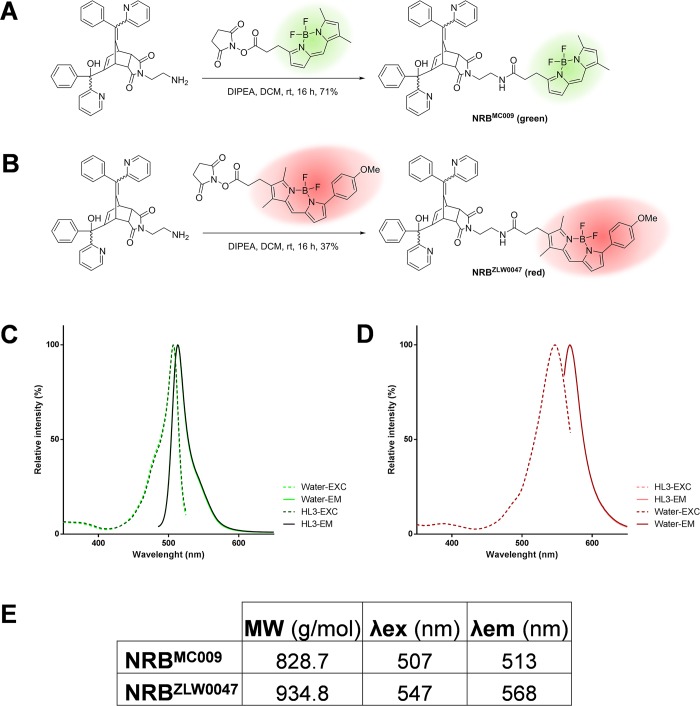
The structures and synthetic routes to generate NRBMC009 and NRBZLW0047 are summarized in Fig 1A and 1B, respectively. The excitation and emission spectra of the dyes in water, and in the physiological buffer (HL3) solution, which was used to perform live imaging experiments in Drosophila tissues, are presented in Fig 1C and 1D, respectively, and summarized in Fig 1E. The excitation spectra analysis showed that the probes can be excited using the common laser lines 561 nm (NRBZLW0047) and 488 nm (NRBMC009), respectively.
Fig 1. NRBMC009 and NRBZLW0047 synthesis and fluorescent spectra.
Scheme of the synthesis of NRBMC009 (A) and NRBZLW0047 (B). Excitation and emission spectra of NRBMC009 (C) and NRBZLW0047 (D) diluted in water (light color) or in HL3 medium (dark color). Summary table of physical properties of NRBMC009 and NRBZLW0047 (E), MW: molecular weight; λex: excitation wavelength; λem: emission wavelength.
Tissue distribution of NRBMC009 and NRBZLW0047 in Drosophila larvae
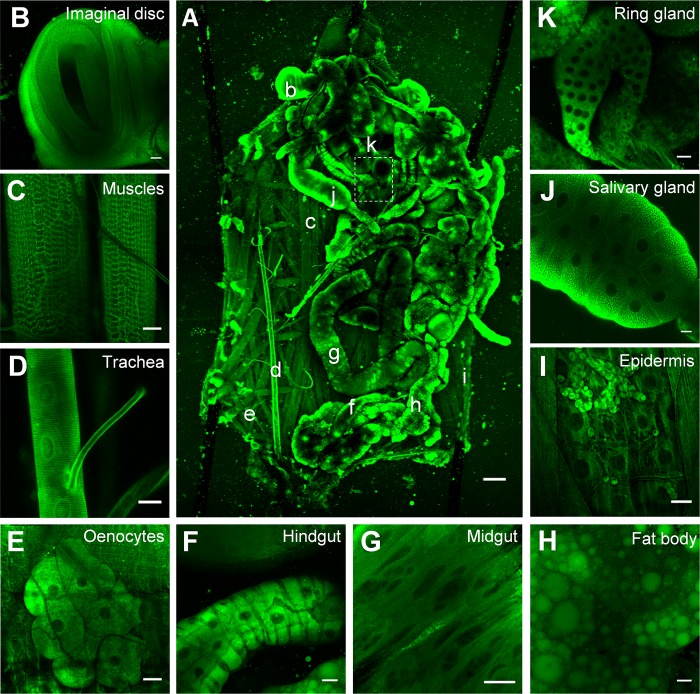
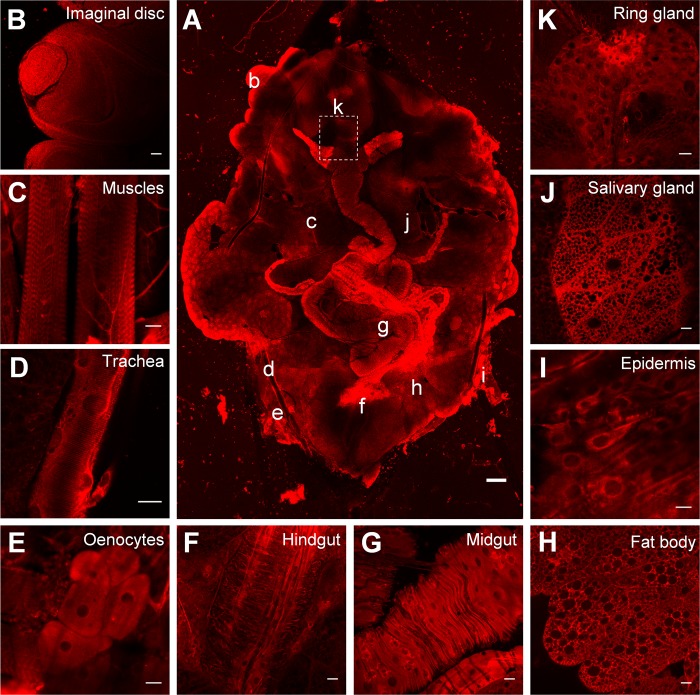
To characterize NRBMC009 and NRBZLW0047 fluorescence distribution in Drosophila tissues, we dissected a wild type larva and exposed the whole body to the fluorescent probes. Figs 2A and 3A are confocal images of dissected third instar larvae in which all tissues were left intact and labeled with 500 nM NRBMC009 or 1 μM NRBZLW0047, respectively. As shown in the pictures, both dyes localized to most of the tissues, with an apparent brighter signal detected in imaginal discs, tracheal system, salivary glands, and fat body (Fig 2B, 2D, 2H and 2J, respectively, and Fig 3B, 3H and 3J, respectively), and a less intense signal being detected in muscular tissues, oenocytes, the entire digestive tract, the ring gland, and epidermal cells (Fig 2C, 2E, 2F, 2G, 2I and 2K, respectively, and Fig 3C, 3E, 3F, 3G, 3I and 3K, respectively). NRBMC009 and NRBZLW0047 were unable to label the central nervous system i.e. ganglion, brain lobes, and nerves (dotted boxes on Figs 2A and 3A). In order to exclude possible autofluorescence disturbance, all tissues were captured under the same laser conditions without probe labeling; as shown in S2A–S2J Fig, tissues autofluorescence is almost null and does not interfere with the emission intensity of NRBMC009 and NRBZLW0047 (S2K and S2L Fig).
Fig 2. NRBMC009 distribution in Drosophila larval tissues.
Confocal live imaging of (A) whole dissected w[1118] third instar larva labeled with NRBMC009 500 nM. Small letters reveal corresponding magnified tissues, dotted box shows unlabeled central nervous system (CNS). Magnification 5x; scale bar 200 μm. Detailed images of (B) leg imaginal disc, (C) muscles, (D) trachea, (E) oenocytes, (F) hindgut, (G) midgut, (H) fat body, (I) epidermis and hematocytes, (J) salivary gland, and (K) ring gland; magnification 40x; scale bars 20 μm.
Fig 3. NRBZLW0047 distribution in Drosophila larval tissues.
Confocal live imaging of (A) whole dissected w[1118] third instar larva labeled with NRBZLW0047 1 μM. Small letters reveal corresponding magnified tissues, dotted box shows unlabeled CNS. Magnification 5x; scale bar 200 μm. Detailed images of (B) leg imaginal disc, (C) muscles, (D) trachea, (E) oenocytes, (F) hindgut, (G) midgut, (H) fat body, (I) epidermis, (J) salivary gland, and (K) ring gland; magnification 40x; scale bars 20 μm.
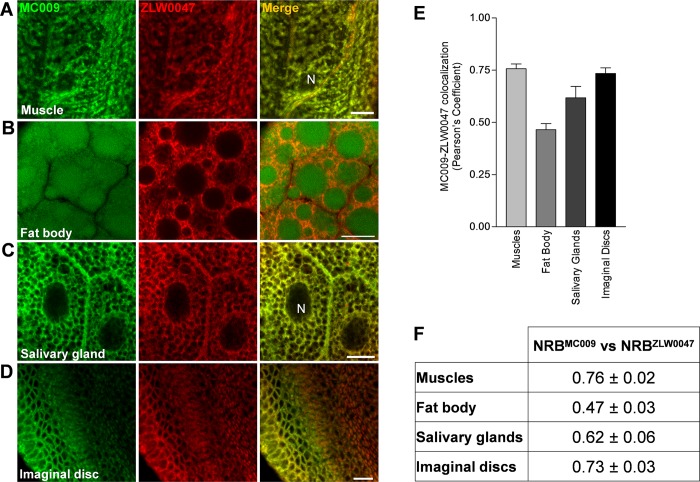
The labeling properties of the two probes were compared by co-loading larval tissues with both dyes, and merging the corresponding images for colocalization analysis. The results, reported in Fig 4A–4D, indicate that both dyes were able to penetrate the cells of the tissues, and effectively label the intracellular structures. Cell internalization of the dyes was very rapid, allowing a clear visualization of the intracellular structures in less than 2 minutes (S1 and S2 Videos and S3 Fig). Pearson’s coefficient results (Fig 4E and 4F) confirmed that NRBMC009 and NRBZLW0047 recognized the same intracellular structures in most of the tissues investigated. However, a clear difference in subcellular expression between NRBMC009 and NRBZLW0047 was observed in the fat bodies, in which lipid droplets (LDs) were selectively stained by NRBMC009 (Fig 4B). This behavior may reflect a different binding capacity of the two probes to the constituents of LDs, i.e. neutral lipids, mainly triacylglycerols and sterol esters, and phospholipids [23,24].
Fig 4. NRBMC009 and NRBZLW0047 colocalization.
Confocal live imaging of dissected w[1118] third instar larval (A) muscle, (B) fat body, (C) salivary gland, and (D) imaginal disc labeled with NRBMC009 500 nM (green) together with NRBZLW0047 1 μM (red). Magnification 60x; scale bars 10 μm. Graph (E) and summary table (F) of Pearson’s correlation coefficients between NRBMC009 and NRBZLW0047 in the evaluated tissues. Data are expressed as mean ± SEM, n≥10.
Cellular distribution of NRBMC009 and NRBZLW0047
We next characterized the cellular structures labeled by NRBMC009 and NRBZLW0047. In all the tissues investigated, we found that both probes allowed the visualization of intracytoplasmic organelles but did not penetrate the nuclei (S4 Fig). Furthermore, neither probe was able to label plasma membrane as shown by experiments using CellMask Orange dye (S4A–S4E Fig) and in larval tissues expressing mCD8-GFP (S4F–S4L Fig).
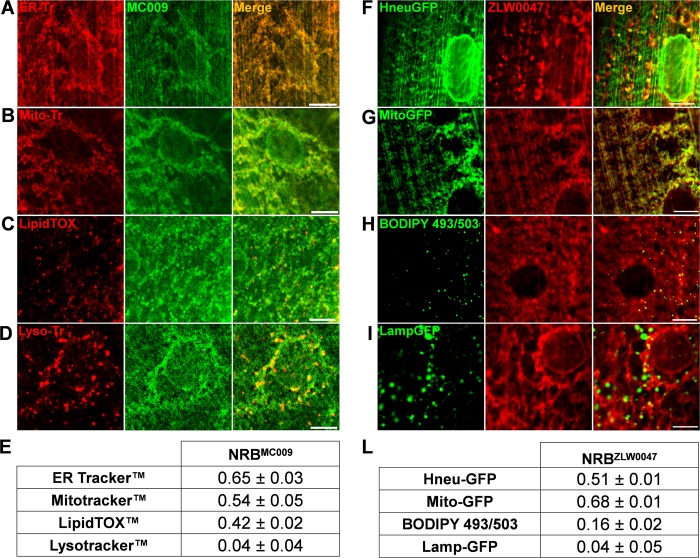
The intracellular distribution of NRBMC009 and NRBZLW0047 was analyzed in more detail in Drosophila larval musculature in which we investigated the binding of these NRB fluorescent derivatives to ER, mitochondria, lysosomes and LDs. The larval body wall muscles provide a relatively simple system to study development of muscles, cytoskeleton dynamics, intracellular trafficking and neuromuscular junction dysfunction. In fact, besides the well-known actin and myosin filaments and their associated proteins, muscles also contain a cytoskeleton, intracellular organelles of the endo-lysosomal pathway, and well-defined endoplasmic reticulum and mitochondrial networks [25]. We focused on these particular structures because we recently showed that they contained a significant density of binding sites for NRBMC009 [6]. To study the intracellular localization of NRBMC009 we co-loaded it into larval muscle with organelle-specific red fluorescent dyes. To confirm NRBZLW0047 localization we profiled it in larval muscles labelled with organelle-selective green fluorescent proteins.
The results, showed good co-localization of NRBMC009 with ER tracker Red (ER probe, Pearson’s coefficient 0.65 ± 0.03, Fig 5A), Mitotracker Orange (mitochondrial probe, Pearson’s coefficient 0.54 ± 0.05, Fig 5B) and LipidTOX (lipid droplets probe, Pearson’s coefficient 0.42 ± 0.02, Fig 5C); however, NRBMC009 did not colocalize with Lysotracker Deep Red (a lysosome probe, Pearson’s coefficient 0.04 ± 0.04, Fig 5D). The localization of NRBZLW0047 was confirmed using green fluorescent-tagged proteins that specifically targeted the ER (UAS-Hneu-GFP), mitochondria (UAS-Mito-GFP) and lysosomes (UAS-Lamp-GFP), and BODIPY 493/503 dye that targeted the LDs. The results, shown in Fig 5E–5H, demonstrated that the distribution of NRBZLW0047 partially overlapped that of NRBMC009; that both NRBMC009 and NRBZLW0047 exhibited good labeling of ER and mitochondria (Pearson’s coefficient 0.51 ± 0.01 and 0.68 ± 0.01, respectively, Fig 5F and 5G); that both were absent in lysosomes (Pearson’s coefficient 0.04 ± 0.02, Fig 5I); and that they differed in their localization in LDs, where NRBMC009 fluorescence was present (Pearson’s coefficient 0.42 ± 0.02, see also Fig 5C) but NRBZLW0047 fluorescence was absent (Pearson’s coefficient 0.16 ± 0.05, Fig 5H).
Fig 5. NRBMC009 and NRBZLW0047 intracellular distribution in larval muscles.
Confocal live imaging of w[1118] third instar larval muscles 6–7 from segment A3 labeled and ER-tracker 2 μM (ER marker, A), Mitotracker 1 μM (mitochondria marker, B), LipidTOX 1:100 (LDs marker, C), and Lysotracker 2 μM (lysosomes marker, D), all in red, together with NRBMC009 500 nM (green). Magnification 60x; scale bars 10 μm. Summary table of Pearson’s correlation coefficients between NRBMC009 and fluorescent organelle-marker probes used in larval muscles (E). Data are expressed as mean ± SEM, n≥10. Confocal live imaging of third instar larval muscles 6–7 from segment A3 of UAS-Hneu-GFP/Tubulin-Gal4 (ER marker, F), UAS-Mito-GFP/Tubulin-Gal4 (mitochondrial marker, G), w[1118] added with BODIPY 493/503 10 μg/ml (LDs marker, H), and UAS-Lamp-GFP/+;Tubulin-Gal4/+ (Lysosomes marker, I), all labeled with NRBZLW0047 1 μM (red). Magnification 60x; scale bars 10 μm. Summary table of Pearson’s correlation coefficients between NRBMC009 and fluorescent organelle-markers in Drosophila larval muscles (L). Data are expressed as mean ± SEM, n≥10.
These data show that both compounds, but particularly NRBMC009, can be used to visualize and distinguish most organs/tissues of the dissected living larvae, and allow good definition of their intracellular structures. In addition, the co-localization studies revealed that both NRBMC009 and NRBZLW0047 labelled subcellular organelles, that they preferentially targeted the ER and mitochondria, and that they were totally absent from the nuclei, plasma membranes and lysosomes, which is in agreement with data reported in mammalian cell studies [6]. Moreover, the efficiency of the probes was tested with two different approaches: 1) in combination with commercially available dyes for live imaging, and 2) together with green fluorescent proteins that label specific cellular structures. In both the experimental backgrounds the NRB based probes allowed the identification of endoplasmic reticulum and mitochondria structures, making both probes useful new markers in Drosophila studies. Based on the capability of these dyes to recognize the same intracellular structures in both mammalian and fruit fly cells, their potential use in more complex animal models is anticipated. Subsequently, our ongoing work is focused on the development of these probes as tools to allow live imaging studies to be conducted in mouse and rat tissues.
NRBMC009 and NRBZLW0047 cellular distribution in pathologic mutation-related phenotypes
In consideration of the preferential distribution of NRB-derived fluorescent probes to ER and mitochondria we next verified if they could be developed into tools to highlight phenotypic modifications of the ER and mitochondrial networks in Drosophila muscles. A large number of human disease genes are conserved in Drosophila and its genome can be easily manipulated to recreate and study human pathologic phenotypes [26]; subsequently, Drosophila is widely used as a model to study muscle growth, degeneration and correlated diseases [27–30].
In this study NRBMC009 and NRBZLW0047 were tested on two Drosophila pathologic models: Charcot–Marie–Tooth disease (CMTd) and hereditary spastic paraplegia (HSP) [31,32].
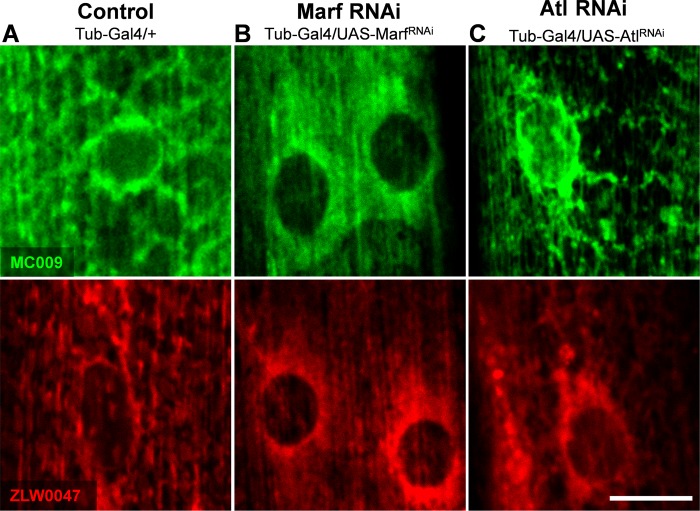
CMTd Drosophila phenotype was obtained by inducing a downregulation of Marf, the fruit fly orthologue of the human gene Mitofusin2, which encodes for a GTPase that, together with Opa1, fuses mitochondria; mutations of this gene are implicated in CMT disease [33]. The depletion of this protein in Drosophila is known to cause fragmented and clustered mitochondria in neuronal cell bodies and to disorganize the typical sarcomeric location of mitochondria in the larval muscles, clumping them mainly around the nuclei [34]. Fig 6B shows the fluorescent distribution of NRBMC009 and NRBZLW0047 in muscles of larvae in which Marf had been ubiquitously downregulated (UAS-MarfRNAi/Tubulin-Gal4). Since these fluorescent images are comparable with those previously reported with the mitochondrial marker UAS-Mito-GFP [34] in the same model, when considering the mitochondrial labeling properties of NRBMC009 and NRBZLW0047 (this study), it can be argued that fluorescent derivatives of NRB are able to also stain altered mitochondria, and be able to highlight pathologic mitochondrial phenotypes.
Fig 6. NRBMC009 and NRBZLW0047 highlight pathologic mutation related phenotypes.
Confocal live imaging of Drosophila muscles 6–7 from segment A3 of (A) control (Tubulin-Gal4/+), (B) Marf downregulation (UAS-MarfRNAi/Tubulin-Gal4), and (C) atlastin downregulation (UAS-AtlastinRNAi/Tubulin-Gal4) labeled with NRBMC009 500 nM (green) or NRBZLW0047 1 μM (red). Magnification 60x; scale bars 10 μm.
HSP Drosophila phenotype was obtained by inducing a downregulation of atlastin. Atlastins are membrane-bound dynamin-like GTPases implicated in ER network morphogenesis, and mutations in atlastin1 gene are involved in the onset of a common form of HSP (SPG3A). Drosophila holds a unique highly conserved atlastin orthologue, and its downregulation elicits a fragmented ER in neurons and an enrichment of ER punctae localized in the proximity of nuclei, and visualized using UAS-KDEL-GFP [18]. Labeling of larva fillets with NRBMC009 and NRBZLW0047 revealed a different pattern between muscles of wild type (Fig 6A) and atlastin-downregulated (UAS-AtlRNAi/Tubulin-Gal4) larvae (Fig 6C), in which a brighter perinuclear signal, compatible with the previously described HSP phenotype, is observed.
Taken together, these results indicate that NRBMC009 and NRBZLW0047 could be useful tools for Drosophila live imaging to highlight phenotypes attributable to mutations in, and/or downregulation of genes implicated in mitochondria and/or endoplasmic reticulum network modifications. In addition, the short time it takes for these probes to permeate and label tissue and their general ease of use, means that both could be used as tools in compound screening studies to identify candidates that would help alleviate any network malfunction due to genetic modification.
NRBMC009 and NRBZLW0047 in food intake tests
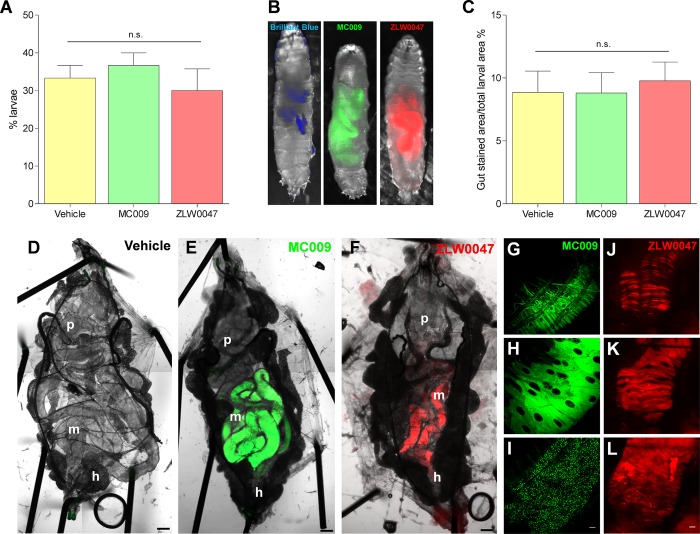
Next we explored the possibility of using NRBMC009 and NRBZLW0047 as tools to evaluate food intake and to investigate potential gut morphological modifications in Drosophila in vivo. By adopting a three-choice test (behavioral choice test) we verified that NRBMC009 and NRBZLW0047, when added to the food, were accepted by the flies. As summarized in Fig 7A, there were no substantial differences in food preference between the standard diet and NRBMC009- and NRBZLW0047-supplemented diets, indicating that the presence of the dyes did not influence the larval food choice. In addition, fluorescence imaging of larvae fed for 30 min with probe-enriched liquid food indicated that both NRBMC009 and NRBZLW0047 could be clearly detected in the gut (Fig 7B); a more in depth analysis revealed that gut fluorescence was regulated by the probes contained in the food, since no signal was observed in the gut wall, leading to the conclusion that the strength of the fluorescent signal could be taken as an index of the quantity of ingested food. Fig 7C reports the results of the food intake assay, expressed as a percentage of the gut stained area relative to the total body area—no significant difference was observed between larvae fed with NRBMC009, NRBZLW0047, or brilliant blue dye, a commonly used dye for the evaluation of food intake in Drosophila [21].
Fig 7. Use of NRBMC009 and NRBZLW0047as dyes for food intake tests.
Quantification of larval dispersal after 5 minutes of three-choice preference assay of vehicle-added food, NRBMC009 20 μM -added food, or NRBZLW0047 20 μM -added food (A). Data are expressed as percent of total larvae number and represent mean ± SEM of five different experiments. Significance was calculated using One-way ANOVA test followed by Tukey's Multiple Comparison Test; n.s. p > 0.05. Representative images of larvae fed with liquid food supplemented with Brilliant blue R 0.08%, NRBMC009 20 μM, or NRBZLW0047 20 μM, where gut was labeled by the three dyes (B) and quantification of gut stained area versus total larval area (C). Data are expressed as mean of percent ± SEM of 30 larvae. Significance was calculated using One-way ANOVA test followed by Tukey's Multiple Comparison Test; n.s. p > 0.05. Confocal live imaging of whole dissected Drosophila third instar larva fed with vehicle-supplemented food (D), NRBMC009 20 μM-supplemented food (E), or NRBZLW0047 20 μM-supplemented food (F); magnification 5x; scale bar 200 μm. p: proventriculus, m: midgut, h: hindgut. Detailed images of mid gut external muscular cells (G, J), enterocytes (H, K) and intestinal food (I, L), labeled with the two NRB fluorescent derivatives; magnification 40x; scale bars 20 μm.
The lack of gut labeling by NRBMC009 and NRBZLW0047, although a useful outcome for the food intake test, was somewhat unexpected, particularly considering the results obtained in the dissected larvae (see Figs 2 and 3) where the dyes were clearly localized to the intestinal tract. To explain this inconsistency, we hypothesized that the time of exposure (30 min) of the larvae to the probe-supplemented food in the food intake assay was potentially too short to allow an internalization of the dyes to the gut epithelial cells. Therefore, we analyzed the gut wall of larvae grown for 5–7 days in food enriched with NRBMC009 or NRBZLW0047. Fig 7D–7F show the clear difference between vehicle-fed (Fig 7D) and NRBMC009- and NRBZLW0047-fed larvae (Fig 7E and 7F, respectively). The bright fluorescent signal in the digestive tract (mainly midgut and hindgut) indicates that Drosophila larvae readily eat the probe-containing food. The digestive tract of NRBMC009- and NRBZLW0047-fed larvae were clearly labeled by the dyes, a result that was accentuated by the absence of fluorescence in the rest of the body. The Drosophila intestinal tract is formed by a monolayer of epithelial cells, intestinal stem cells and enteroendocrine cells, surrounded by visceral muscles, nerves and tracheae. Ingested food from the proventriculus is pushed into the midgut, the main region of digestion and absorption, and then to the hindgut where the final absorption process takes place [13,14]. A deeper investigation on dissected Drosophila gut revealed that NRBMC009 and NRBZLW0047 did not only label the food that was present and visible in the intestinal tract (Fig 7I and 7L), but they also bound to the gut external muscular cells (Fig 7G and 7J) and enterocytes (Fig 7H and 7K).
The bright fluorescence of NRBMC009 and NRBZLW0047 make these probes eminently suitable for use in food intake tests and chronic feeding assays; as monitoring tools for abnormal gut morphology; and identifying defects in gut functionality during development or screening tests.
NRBMC009 and NRBZLW0047 toxicity
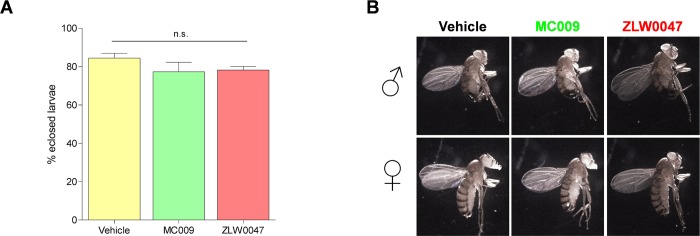
In an attempt to validate the use of the NRB-derived fluorescent probes for use in chronic assays, we next verified their lack of toxicity in Drosophila by exposing the flies to NRBMC009 or NRBZLW0047 over their entire life-cycle. The results indicate that male and female flies readily ingested NRBMC009- and NRBZLW0047-supplemented food, mated and laid eggs normally, from which embryos hatched and larvae developed, grew, underwent pupation and eclosed in a similar fashion to non-treated flies. In addition, no difference in eclosion rate and lethality of adult flies was observed between probe-exposed and control flies (Fig 8A). Finally, we could not detect any apparent macroscopic morphological alteration in adult flies treated with either NRBMC009 or NRBZLW0047 (Fig 8B).
Fig 8. NRBMC009 and NRBZLW0047 chronic toxicity.
Evaluation of toxicity after exposition to standard food added with vehicle, NRBMC009 (20 μM) or NRBZLW0047 (20 μM) over the Drosophila entire life-cycle. (A) Quantification of eclosion rate. Data are expressed as mean of percentages of emerged flies versus to the total number of pupae. Significance was calculated using One-way ANOVA test followed by Tukey's Multiple Comparison Test; n.s. p > 0.05. (B) Representative images of emerged male (♂) and female (♀) w[1118] flies, where morphological alterations of body, eyes, wings, and legs were evaluated.
The absence of toxicity and the high level of palatability supportsNRBMC009 and NRBZLW0047 as potential monitoring tools for long term feeding assays, as markers of intestinal epithelia, and their use in studying Drosophila digestive tract functionality e.g. monitoring the effect of compounds or diet on intestinal performance [35–37]. These attributes also make these probes potentially useful as mammalian gastrointestinal (GI) tract markers; for example, the GI tract is one of the most studied tissues in many pathological rodent models [38,39] and the availability of easy-to-use, high performance fluorescent probes to detect intracellular structure abnormalities could be of great benefit.
Overall, this study has investigated live cell imaging applications of NRBMC009 and NRBZLW0047 in Drosophila melanogaster. The analysis of the fluorescent signals of these compounds reveal that both can label subcellular specific organelles (preferentially ER and mitochondria), in both wild type and pathological phenotypes. The absence of toxicity and the minimal effect on palatability also allows them to be used as potential monitoring tools in feeding assays, and as markers for intestinal epithelia that could be useful in Drosophila digestive tract studies. In summary, the characteristically bright signals of NRBMC009 and NRBZLW0047, in combination with their capacity to permeate tissues rapidly, makes them eminently suitable for confocal imaging applications. Our future studies will focus on investigating whether these compounds, with their enhanced attributes, may have potential to be used in invertebrate animal models.
Supporting information
Zeiss LSM800 Axio Observer Z1 inverted microscope and Nikon D-Eclipse C1 confocal microscope settings used (A). Summary table of laser intensity (%) and pinhole size (μm) used to capture NRBMC009 and NRBZLW0047 in each tissue considered in the study (B).
(TIF)
Confocal live cell images of unlabeled (A) leg imaginal disc, (B) muscles, (C) trachea, (D) oenocytes, (E) hindgut, (F) midgut, (G) fat body, (H) epidermis, (I) salivary gland, and (J) ring gland; magnification 40x; scale bars 20 μm. TL: transmitted light; green AF: autofluorescence using BODIPY-FL laser settings; red AF: autofluorescence using BODIPY-TMR laser settings. Quantification of NRBMC009 (K) and NRBZLW0047 (L) fluorescence intensity without (dark bars) or with (light bars) autofluorescence subtraction in different larval tissues. Data are expressed as mean ± SEM, n≥5; significance was calculated using unpaired t test; n.s. p > 0.05.
(TIF)
Fluorescence intensity of NRBMC009 and NRBZLW0047 internalization in dissected w[1118] larval muscles, extrapolated from a time-lapse image taken every 5 seconds for about 5 minutes. Data are expressed as mean ± SEM, n≥10.
(TIF)
Confocal live imaging of w[1118] larval (A) peripodal membrane cells of a leg imaginal disc, (B) salivary gland, (C) fat body, and (D) central nervous system labeled with NRBMC009 500 nM (green) and CellMask Orange (cell membrane marker) 1 μM (red). Magnification 60x, scale bars 10 μm (A-C); magnification 40x, scale bar 100 μm (D). N: nucleus, G: ganglion, Nv: nerves. Summary table of Pearson’s correlation coefficients between NRBMC009 and CellMask in the evaluated tissues (E). Data are expressed as mean ± SEM, n≥10. Confocal live imaging of UAS-mCD8-GFP/Tubulin-Gal4 (cell membrane marker) larval (F) peripodal membrane cells of a leg imaginal disc, (G) salivary gland, (H) fat body, and (I) central nervous system labeled with NRBZLW0047 1 μM (red). Magnification 60x, scale bars 10 μm (A-C); magnification 40x, scale bar 100 μm (D). N: nucleus, G: ganglion, Nv: nerves. Summary table of Pearson’s correlation coefficients between NRBZLW0047 and mCD8-GFP signal in the evaluated tissues (L). Data are expressed as mean ± SEM, n≥10.
(TIF)
Scale bar 20 μm.
(AVI)
Scale bar 20 μm.
(AVI)
Data Availability
All relevant data are within the manuscript and its Supporting Information files.
Funding Statement
This project was supported by the New Zealand Ministry of Business, Innovation and Employment’s Endeavour Fund C09X1710 (BH, SBo, MB, GO, DR): https://www.mbie.govt.nz/ and by the University of Padova, project n. 148125/14 (SBo) and SID18-01 (GO): https://www.unipd.it/en/. The funders had no role in study design, data collection and analysis, decision to publish, or preparation of the manuscript.
References
- 1.Roszkowski AP. The pharmacological properties of norbormide, a selective rat toxicant. J Pharmacol Exp Ther. 1965. August;149(2):288–99. [PubMed] [Google Scholar]
- 2.Fusi F, Saponara S, Sgaragli G, Cargnelli G, Bova S. Ca2+ entry blocking and contractility promoting actions of norbormide in single rat caudal artery myocytes. Br J Pharmacol. 2002. October;137(3):323–8. 10.1038/sj.bjp.0704877 [DOI] [PMC free article] [PubMed] [Google Scholar]
- 3.Cavalli M, Omiciuolo L, Cargnelli G, Cima L, Hopkins B, Bova S. Distribution of the vasoconstrictor and vasorelaxant effects of norbormide along the vascular tree of the rat. Life Sci. 2004. September 17;75(18):2157–65. 10.1016/j.lfs.2004.04.022 [DOI] [PubMed] [Google Scholar]
- 4.Bova S, Cima L, Golovina V, Luciani S, Cargnelli G. Norbormide: a Calcium Entry Blocker with Selective Vasoconstrictor Activity in Rat Peripheral Arteries. Cardiovasc Drug Rev. 2001. September 1;19(3):226–33. [DOI] [PubMed] [Google Scholar]
- 5.D’Amore C, Orso G, Fusi F, Pagano MA, Miotto G, Forgiarini A, et al. An NBD Derivative of the Selective Rat Toxicant Norbormide as a New Probe for Living Cell Imaging. Front Pharmacol. 2016. September;7. [DOI] [PMC free article] [PubMed] [Google Scholar]
- 6.D’Amore C, Orso G, Forgiarini A, Ceolotto G, Rennison D, Ribaudo G, et al. Synthesis and Biological Characterization of a New Norbormide Derived Bodipy FL-Conjugated Fluorescent Probe for Cell Imaging. Front Pharmacol. 2018. September 25;9:1055 10.3389/fphar.2018.01055 [DOI] [PMC free article] [PubMed] [Google Scholar]
- 7.Aldaz S, Escudero LM, Freeman M. Live imaging of Drosophila imaginal disc development. Proc Natl Acad Sci U S A. 2010. August;107(32):14217–22. 10.1073/pnas.1008623107 [DOI] [PMC free article] [PubMed] [Google Scholar]
- 8.Tan FHP, Azzam G. Drosophila melanogaster: Deciphering Alzheimer’s Disease. Malays J Med Sci MJMS. 2017. March;24(2):6–20. 10.21315/mjms2017.24.2.2 [DOI] [PMC free article] [PubMed] [Google Scholar]
- 9.Musselman LP, Kühnlein RP. Drosophilaas a model to study obesity and metabolic disease. J Exp Biol. 2018. March 7;221(Pt Suppl 1):jeb163881. [DOI] [PubMed] [Google Scholar]
- 10.Chatterjee S. Artefacts in histopathology. J Oral Maxillofac Pathol JOMFP. 2014. September;18(Suppl 1):S111–6. 10.4103/0973-029X.141346 [DOI] [PMC free article] [PubMed] [Google Scholar]
- 11.Mushtaq Z, Choudhury SD, Gangwar SK, Orso G, Kumar V. Human Senataxin Modulates Structural Plasticity of the Neuromuscular Junction in Drosophila through a Neuronally Conserved TGFβ Signalling Pathway. Neurodegener Dis. 2016;16(5–6):324–36. 10.1159/000445435 [DOI] [PubMed] [Google Scholar]
- 12.Orso G, Martinuzzi A, Rossetto MG, Sartori E, Feany M, Daga A. Disease-related phenotypes in a Drosophila model of hereditary spastic paraplegia are ameliorated by treatment with vinblastine. J Clin Invest. 2005. November 1;115(11):3026–34. 10.1172/JCI24694 [DOI] [PMC free article] [PubMed] [Google Scholar]
- 13.Kuraishi T, Kenmoku H, Kurata S. From mouth to anus: Functional and structural relevance of enteric neurons in the Drosophila melanogaster gut. Insect Biochem Mol Biol. 2015. December;67:21–6. 10.1016/j.ibmb.2015.07.003 [DOI] [PubMed] [Google Scholar]
- 14.Lemaitre B, Miguel-Aliaga I. The Digestive Tract of Drosophila melanogaster. Annu Rev Genet. 2013;47(1):377–404. [DOI] [PubMed] [Google Scholar]
- 15.Limmer S, Weiler A, Volkenhoff A, Babatz F, Klämbt C. The Drosophila blood-brain barrier: development and function of a glial endothelium. Front Neurosci. 2014. November;8. [DOI] [PMC free article] [PubMed] [Google Scholar]
- 16.Meltola NJ, Wahlroos R, Soini AE. Hydrophilic Labeling Reagents of Dipyrrylmethene-BF2 Dyes for Two-Photon Excited Fluorometry: Syntheses and Photophysical Characterization. J Fluoresc. 2004. September 1;14(5):635–47. [DOI] [PubMed] [Google Scholar]
- 17.Rennison D, Laita O, Conole D, Jay-Smith M, Knauf J, Bova S, et al. Prodrugs of N-dicarboximide derivatives of the rat selective toxicant norbormide. Bioorg Med Chem. 2013. September 15;21(18):5886–99. 10.1016/j.bmc.2013.06.071 [DOI] [PubMed] [Google Scholar]
- 18.Orso G, Pendin D, Liu S, Tosetto J, Moss TJ, Faust JE, et al. Homotypic fusion of ER membranes requires the dynamin-like GTPase atlastin. Nature. 2009. August 20;460(7258):978–83. 10.1038/nature08280 [DOI] [PubMed] [Google Scholar]
- 19.Kassan A, Herms A, Fernández-Vidal A, Bosch M, Schieber NL, Reddy BJN, et al. Acyl-CoA synthetase 3 promotes lipid droplet biogenesis in ER microdomains. J Cell Biol. 2013. December 23;203(6):985–1001. 10.1083/jcb.201305142 [DOI] [PMC free article] [PubMed] [Google Scholar]
- 20.Kim D, Alvarez M, Lechuga LM, Louis M. Species-specific modulation of food-search behavior by respiration and chemosensation in Drosophila larvae. eLife. 2017. September 5;6:e27057 10.7554/eLife.27057 [DOI] [PMC free article] [PubMed] [Google Scholar]
- 21.Kaun KR, Riedl CAL, Chakaborty-Chatterjee M, Belay AT, Douglas SJ, Gibbs AG, et al. Natural variation in food acquisition mediated via a Drosophila cGMP-dependent protein kinase. J Exp Biol. 2007. October 15;210(20):3547–58. [DOI] [PubMed] [Google Scholar]
- 22.Schindelin J, Arganda-Carreras I, Frise E, Kaynig V, Longair M, Pietzsch T, et al. Fiji: an open-source platform for biological-image analysis. Nat Methods. 2012. July;9(7):676–82. 10.1038/nmeth.2019 [DOI] [PMC free article] [PubMed] [Google Scholar]
- 23.Vanni S. Intracellular Lipid Droplets: From Structure to Function. Lipid Insights [Internet]. 2017. December 13 [cited 2018 Nov 15];10 Available from: https://www.ncbi.nlm.nih.gov/pmc/articles/PMC5731618/ [DOI] [PMC free article] [PubMed] [Google Scholar]
- 24.Papadopoulos C, Orso G, Mancuso G, Herholz M, Gumeni S, Tadepalle N, et al. Spastin binds to lipid droplets and affects lipid metabolism. PLoS Genet. 2015. April;11(4):e1005149 10.1371/journal.pgen.1005149 [DOI] [PMC free article] [PubMed] [Google Scholar]
- 25.Wang Z-H, Clark C, Geisbrecht ER. Analysis of mitochondrial structure and function in the Drosophila larval musculature. Mitochondrion. 2016. January;26:33–42. 10.1016/j.mito.2015.11.005 [DOI] [PMC free article] [PubMed] [Google Scholar]
- 26.Kreipke RE, Kwon Y V., Shcherbata HR, Ruohola-Baker H. Drosophila melanogaster as a Model of Muscle Degeneration Disorders. Curr Top Dev Biol. 2017;121:83–109. 10.1016/bs.ctdb.2016.07.003 [DOI] [PubMed] [Google Scholar]
- 27.Beckett K, Baylies MK. The Development of The Drosophila Larval Body Wall Muscles In: International Review of Neurobiology. Academic Press; 2006. p. 55–70. (The Fly Neuromuscular Junction: Structure and Function Second Edition; vol. 75). [DOI] [PubMed] [Google Scholar]
- 28.Hirth F. Drosophila melanogaster in the Study of Human Neurodegeneration. CNS Neurol Disord Drug Targets. 2010. August;9(4):504–23. 10.2174/187152710791556104 [DOI] [PMC free article] [PubMed] [Google Scholar]
- 29.McGurk L, Berson A, Bonini NM. Drosophila as an In Vivo Model for Human Neurodegenerative Disease. Genetics. 2015. October;201(2):377–402. 10.1534/genetics.115.179457 [DOI] [PMC free article] [PubMed] [Google Scholar]
- 30.Rossetto MG, Zanarella E, Orso G, Scorzeto M, Megighian A, Kumar V, et al. Defhc1.1, a homologue of the juvenile myoclonic gene EFHC1, modulates architecture and basal activity of the neuromuscular junction in Drosophila. Hum Mol Genet. 2011. November 1;20(21):4248–57. 10.1093/hmg/ddr352 [DOI] [PubMed] [Google Scholar]
- 31.Yamaguchi M, Takashima H. Drosophila Charcot-Marie-Tooth Disease Models In: Yamaguchi M, editor. Drosophila Models for Human Diseases [Internet]. Singapore: Springer Singapore; 2018. [cited 2018 Nov 5]. p. 97–117. (Advances in Experimental Medicine and Biology). Available from: 10.1007/978-981-13-0529-0_7 [DOI] [PubMed] [Google Scholar]
- 32.Ozdowski EF, Baxter SL, Sherwood NT. Chapter 73—Drosophila Models of Hereditary Spastic Paraplegia In: LeDoux MS, editor. Movement Disorders (Second Edition) [Internet]. Boston: Academic Press; 2015. [cited 2018 Nov 5]. p. 1103–22. Available from: http://www.sciencedirect.com/science/article/pii/B9780124051959000731 [Google Scholar]
- 33.Nakhro K, Park J-M, Choi B-O, Chung KW. Missense mutations of mitofusin 2 in axonal Charcot–Marie–Tooth neuropathy: polymorphic or incomplete penetration? Anim Cells Syst. 2013. August;17(4):228–36. [Google Scholar]
- 34.Debattisti V, Pendin D, Ziviani E, Daga A, Scorrano L. Reduction of endoplasmic reticulum stress attenuates the defects caused by Drosophila mitofusin depletion. J Cell Biol. 2014. February;204(3):303–12. 10.1083/jcb.201306121 [DOI] [PMC free article] [PubMed] [Google Scholar]
- 35.Apidianakis Y, Rahme LG. Drosophila melanogaster as a model for human intestinal infection and pathology. Dis Model Mech. 2011. January;4(1):21–30. 10.1242/dmm.003970 [DOI] [PMC free article] [PubMed] [Google Scholar]
- 36.Storelli G, Strigini M, Grenier T, Bozonnet L, Schwarzer M, Daniel C, et al. Drosophila Perpetuates Nutritional Mutualism by Promoting the Fitness of Its Intestinal Symbiont Lactobacillus plantarum. Cell Metab. 2018. February 6;27(2):362–377.e8. 10.1016/j.cmet.2017.11.011 [DOI] [PMC free article] [PubMed] [Google Scholar]
- 37.Gasque G, Conway S, Huang J, Rao Y, Vosshall LB. Small molecule drug screening in Drosophila identifies the 5HT2A receptor as a feeding modulation target. Sci Rep. 2013;3:srep02120 10.1038/srep02120 [DOI] [PMC free article] [PubMed] [Google Scholar]
- 38.Caputi V, Marsilio I, Filpa V, Cerantola S, Orso G, Bistoletti M, et al. Antibiotic-induced dysbiosis of the microbiota impairs gut neuromuscular function in juvenile mice. Br J Pharmacol. 2017. October 1;174(20):3623–39. 10.1111/bph.13965 [DOI] [PMC free article] [PubMed] [Google Scholar]
- 39.Antonioli L, Pellegrini C, Fornai M, Tirotta E, Gentile D, Benvenuti L, et al. Colonic motor dysfunctions in a mouse model of high-fat diet-induced obesity: an involvement of A2B adenosine receptors. Purinergic Signal. 2017. December 1;13(4):497–510. 10.1007/s11302-017-9577-0 [DOI] [PMC free article] [PubMed] [Google Scholar]
Associated Data
This section collects any data citations, data availability statements, or supplementary materials included in this article.
Supplementary Materials
Zeiss LSM800 Axio Observer Z1 inverted microscope and Nikon D-Eclipse C1 confocal microscope settings used (A). Summary table of laser intensity (%) and pinhole size (μm) used to capture NRBMC009 and NRBZLW0047 in each tissue considered in the study (B).
(TIF)
Confocal live cell images of unlabeled (A) leg imaginal disc, (B) muscles, (C) trachea, (D) oenocytes, (E) hindgut, (F) midgut, (G) fat body, (H) epidermis, (I) salivary gland, and (J) ring gland; magnification 40x; scale bars 20 μm. TL: transmitted light; green AF: autofluorescence using BODIPY-FL laser settings; red AF: autofluorescence using BODIPY-TMR laser settings. Quantification of NRBMC009 (K) and NRBZLW0047 (L) fluorescence intensity without (dark bars) or with (light bars) autofluorescence subtraction in different larval tissues. Data are expressed as mean ± SEM, n≥5; significance was calculated using unpaired t test; n.s. p > 0.05.
(TIF)
Fluorescence intensity of NRBMC009 and NRBZLW0047 internalization in dissected w[1118] larval muscles, extrapolated from a time-lapse image taken every 5 seconds for about 5 minutes. Data are expressed as mean ± SEM, n≥10.
(TIF)
Confocal live imaging of w[1118] larval (A) peripodal membrane cells of a leg imaginal disc, (B) salivary gland, (C) fat body, and (D) central nervous system labeled with NRBMC009 500 nM (green) and CellMask Orange (cell membrane marker) 1 μM (red). Magnification 60x, scale bars 10 μm (A-C); magnification 40x, scale bar 100 μm (D). N: nucleus, G: ganglion, Nv: nerves. Summary table of Pearson’s correlation coefficients between NRBMC009 and CellMask in the evaluated tissues (E). Data are expressed as mean ± SEM, n≥10. Confocal live imaging of UAS-mCD8-GFP/Tubulin-Gal4 (cell membrane marker) larval (F) peripodal membrane cells of a leg imaginal disc, (G) salivary gland, (H) fat body, and (I) central nervous system labeled with NRBZLW0047 1 μM (red). Magnification 60x, scale bars 10 μm (A-C); magnification 40x, scale bar 100 μm (D). N: nucleus, G: ganglion, Nv: nerves. Summary table of Pearson’s correlation coefficients between NRBZLW0047 and mCD8-GFP signal in the evaluated tissues (L). Data are expressed as mean ± SEM, n≥10.
(TIF)
Scale bar 20 μm.
(AVI)
Scale bar 20 μm.
(AVI)
Data Availability Statement
All relevant data are within the manuscript and its Supporting Information files.


