Abstract
Background
Caffeine is reported to be the most widely used pharmacologically active substance. It causes mental stimulation and increases blood pressure. Acute systolic and diastolic blood pressure response to caffeine attenuates in the course of regular caffeine use; tolerance to cardiovascular responses develops in some people. For some hypertension-prone people coffee ingestion may be harmful, and for others it may be beneficial. The aim of our work was to evaluate the effect of caffeine on postocclusive reactive hyperaemia (PORH), a test of microvascular function, and at the same time to monitor the central effects of caffeine on blood pressure and heart rate.
Methods
Heart rate, arterial pressure, and cutaneous laser-Doppler (LD) flux were monitored in 32 healthy volunteers (aged 25.2 ± 4.3 years) before and after they ingested 200 mg of caffeine. LD flux was measured on a finger at rest and after the release of an 8-minute occlusion of digital arteries above the place of LD flux measurement. All parameters obtained after the ingestion of caffeine were compared to the values obtained before caffeine and to the values obtained after a placebo.
Results
We found slightly increased arterial pressure as well as decreased heart rate and resting LD flux (Dunnett’s test, p<0.05) after the ingestion of caffeine. Caffeine significantly reduced the PORH response (Dunnett’s test, p<0.01). The power of the low-frequency oscillations (0.06–0.15 Hz) of LD flux, representing vascular myogenic activity, increased significantly after the ingestion of caffeine at rest and during the PORH response. A correlation was found between the number of cups of coffee regularly consumed and resting LD flux values (R = 0.492, p = 0.00422), peak LD flux values during PORH (R = 0.458, p = 0.00847), and the PORH area (R = 0.506, p = 0.00313) after caffeine consumption.
Conclusions
From the results, we can conclude that caffeine affects cutaneous microvascular function during rest and during a PORH response, and that it increases blood pressure and decreases heart rate.
Introduction
Caffeine is reported to be the most widely used pharmacologically active substance in the world and is found in a variety of foods, beverages, and medicinal preparations. There are many studies on the cardiovascular effects of acute caffeine intake in humans, but the results are controversial. Caffeine causes mental stimulation and increases blood pressure. The increase in blood pressure in males is mainly due to its effect on systemic vascular resistance [1–3]. The acute blood pressure response to caffeine is attenuated by regular caffeine use; in some people, even tolerance to cardiovascular responses develops. However, regular coffee ingestion may be harmful to some hypertension-prone people [4]. Some researchers report that caffeine increases heart rate variability (HRV) as a consequence of enhanced parasympathetic activity along with a concomitant reduction in sympathetic activity [1,5]. In contrast, other studies conclude that it can have the opposite effect on HRV [3] or that modest amounts of caffeine were found to have neither negative nor positive effects in young, healthy, habitual caffeine consumers [3,6].
Caffeine is a member of the group of methylxanthines, chemicals that have diverse mechanisms of action, including adenosine receptor antagonism, inhibition of cyclic nucleotide phosphodiesterases and mobilization of intracellular calcium through ryanodine receptors [7–9]. Caffeine is generally believed to act only on the adenosine A1 and A2A receptors in the concentration range reached after regular coffee consumption [10]. Several studies argue that the most important mechanism of caffeine action on the cardiovascular system in vivo in humans is adenosine receptor antagonism [11,12].
There are not enough data on the effect of caffeine on microcirculation in humans. Studying cutaneous microvascular reactivity is noninvasive and harmless. Various vasoreactivity tests have been used to study cutaneous microvascular reactivity. To detect overall changes in microvascular function, we used a test of postocclusive reactive hyperaemia (PORH) [13]. PORH is considered to be a locally mediated rise in muscle and skin blood flow that can be measured after the release of an arterial occlusion. The detailed mechanism of PORH remains inadequately explained, but factors that contribute to PORH are numerous: myogenic [14], flow-dependent and local vasoactive substances, e.g. prostaglandins, nitric oxide (NO), adenosine, endothelium-derived hyperpolarizing factor (EDHF), and local concentration of potassium [15]. A number of studies have been focused on the possibility that coffee may increase the risk of heart disease. The results were inconsistent. Since some recent epidemiological studies have demonstrated that coffee drinking is associated with reduced mortality due to cardiovascular disease [16–20], it would be interesting to clarify the detailed mechanism of caffeine action on microvessels during PORH, which is at least partially dependent on adenosine. To our knowledge, there have been only two studies testing the influence of acute caffeine consumption on the cutaneous microvascular response to PORH in humans. The results of the study by Noguchi and colleagues are interesting and in part unexpected [21]. Caffeine elevated blood pressure and decreased finger blood flow and at the same time enhanced the PORH of finger blood flow. In contrast, the study by Tesselaar and co-workers reported no change in blood pressure, heart rate, or PORH [22].
The aim of the present study was to evaluate the effect of a single dose of caffeine on the PORH response, a test of microvascular function, and at the same time to determine the central effects of caffeine on blood pressure and heart rate in young, healthy volunteers.
Subjects and methods
Subjects
Thirty-two, young, healthy volunteers (14 males and 18 females) with a mean age of 25.2 ± 4.2 years and a mean body mass index of 21.7 ± 2.2 were recruited for the present study. None of the subjects used any medication or had a history of any diseases that involve even mild Raynaud’s phenomenon. The National Ethics Committee approved the study, and informed consent was obtained from each subject.
Methods
The subjects were asked not to drink coffee or tea for at least 7 days before the experiment. Three of the subjects were smokers. They were not allowed to smoke at least 8 hours before the experiment. All subjects who did not follow the protocol were excluded from the study. The measurements were performed at room temperature kept between 23 and 25°C, 30 minutes after acclimatization. The subjects lay in a supine position and were instructed not to move during the measurements in order to avoid movement artifacts as much as possible.
Heart rate and arterial blood pressure
Heart rate and arterial blood pressure were measured at the forearm by the Riva-Rocci method.
Cutaneous microvascular blood flow
Cutaneous microvascular blood flow was assessed by Laser-Doppler (LD) fluxmetry. The LD flux was measured with Periflux P4001 Master/4002 Satellite LD monitors (Perimed, Sweden). With this technique, a laser light is used to transilluminate proximally one cubic millimeter of skin tissue, and the Doppler principle is adopted to measure the velocity of the red blood cells in skin microvasculature. The LD flux signal is a stochastic representation of the number of moving cells in the tissue volume multiplied by their velocities. The principle governing the measurement of skin perfusion with this technique has been described elsewhere [23]. The LD probes (PF401) were attached to the nailfold of one index finger. Power spectral analysis of the LD flux was performed by the Fast Fourier Transform method using Nevrokard software (Medistar, Slovenia) for the analysis of the LD flux signal.
Protocol
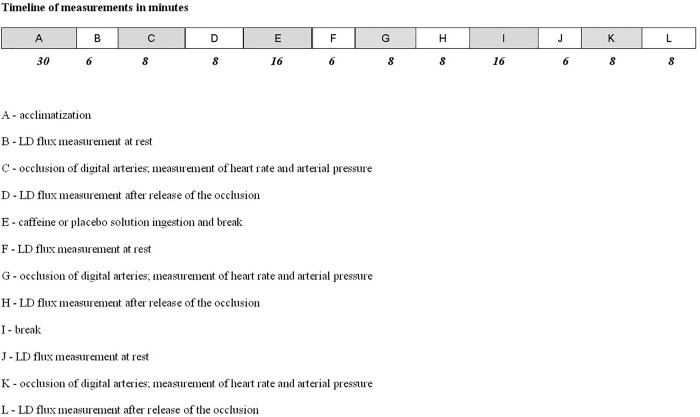
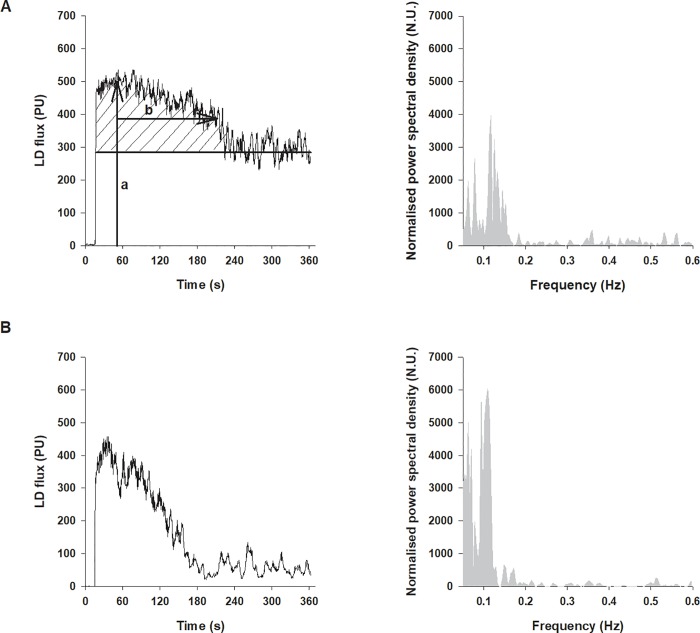
Each subject was measured on two separate occasions. The measurement protocol was the same each time with the exception of the ingested substance, which was caffeine on one occasion and a placebo on the other. The timeline of the experimental protocol is presented in Fig 1. LD flux, heart rate, and arterial blood pressure were measured. LD flux was measured at the nailfold. The nailfold was chosen for measurement because it involves only nutritional circulation. Other places accessible for measuring blood flow involve both nutritional and thermoregulatory circulation. The measuring periods were 6 minutes at rest and 6 minutes after the release of an 8-minute digital arteries occlusion (PORH response), i.e., until the LD flux returned to the pre-occlusion value, thus enabling the measurement of the area under the flux curve during the PORH response above resting values (area under the curve), Fig 2. An occlusion period of 8 minutes was chosen because a shorter time would have caused a smaller PORH peak flow, and prolongation of occlusion over 8 minutes would cause no further increase in PORH peak flow [24,25]. A miniature cuff was placed around the proximal phalange and inflated to 300 mmHg to ensure that digital arteries were occluded in all subjects [24,25]. Measurements were repeated 30 and 60 minutes after the ingestion of 200 mg of caffeine dissolved in 100 mL of water or 100 mL of a placebo solution. Values obtained before ingestion were used as the reference values. We calculated the following indices of the PORH response: the mean LD flux before the onset of arterial occlusion (pre-occlusive LD flux value), the peak LD flux value during hyperaemia, the time elapsed to the peak value (time-to-peak), the time from arterial occlusion release to the return of LD flux to its pre-occlusive value (PORH duration), the time for LD flux to decline to 50% of its peak response value (half recovery time—T/2), and the area under the flux curve during the PORH response above resting values (area under the curve) [13, 25,26]. In accord with the studies by Noguchy and co-workers [21] and Yvonne-Tee and co-workers [26], the relative reactive hyperaemia value was calculated thus: 100x(peak LD flux–resting LD flux)/resting LD flux.
Fig 1. Timeline of the experimental protocol.
Fig 2.
Typical LD flux PORH response and its power spectral density before (A) and after ingestion of caffeine (B). Indices of the response measured: peak LD flux (a), T/2 (b), and area under the LD flux curve (dashed area).
Statistics
Heart rate, systolic and diastolic arterial pressure, and mean resting LD flux values obtained 30 and 60 min after caffeine or placebo ingestion were compared to values obtained before ingestion by a one-way repeated measures ANOVA (Dunnett’s test). We also compared the values of PORH indices before and after the ingestion of caffeine or placebo solution by a one-way repeated measures ANOVA (Dunnett’s test).
The correlations between the quantity of coffee regularly consumed by each subject and each of the factors—heart rate, systolic and diastolic arterial pressure, resting LD flux, and PORH parameters in response to caffeine ingestion—were determined by linear regression (Pearson correlation coefficient test).
For a spectral analysis of the LD flux signal, the Fast Fourier transform (Hanning window; normalized power spectral density) was used. The 360 seconds recording was sampled at 500 samples/s and then downsampled to a total of 512 samples (points). In accord with the research of Stefanovska and co-workers (1999), oscillations of the LD flux signal were divided into five frequency bands: ultra-low, 0.0095–0.02 Hz, endothelium-related metabolic frequency band; very-low, 0.02–0.06 Hz, frequency interval of neural activity; low, 0.06–0.15 Hz, representing vascular myogenic activity; high frequency, 0.15–0.4 Hz, representing respiration; and very-high frequency; 0.4–1.6 Hz, representing heart rate [27,28]. Since PORH responses are relatively short, recordings longer than 360 seconds were not appropriate. Thus, the ultra-low frequency band is still represented in the spectrum, although not very accurately. The very-high frequency band, which corresponds to heart rate, was determined separately.
The term “normalized power spectral density” was calculated as:
absolute power of given component/[sum of absolute powers of all components-F*] x 100
F* = adjustable low frequency limit for n.u. calculation. All results are expressed in mean values and standard errors of the means (SE).
Results
Resting values
Compared to resting values, i.e., those before caffeine ingestion, increases in systolic and diastolic arterial pressure as well as decreases in heart rate and resting LD flux were statistically significantly at both 30 and 60 minutes after caffeine ingestion (Dunnett’s test, p<0.01) (Table 1). In contrast, heart rate, arterial pressure and resting LD flux did not change after ingestion of the placebo solution.
Table 1. Heart rate, arterial pressure and LD flux values before and after caffeine ingestion at 30- and 60-minute intervals.
| Before caffeine | 30 minutes | 60 minutes | |
|---|---|---|---|
| Heart rate (beats/min) | 62.8 ± 1.3 | 59.9 ± 1.2* | 61.3 ± 1.5* |
| Systolic pressure (mmHg) | 109.4 ± 1.3 | 113.1 ± 1.5* | 114.8 ± 1.5* |
| Diastolic pressure (mmHg) | 64.5 ± 1.0 | 69.2 ± 1.1* | 70.1 ± 1.3* |
| Resting LD flux (PU) | 149.1 ± 24.6 | 80.0 ± 13.3* | 71.0 ± 10.8* |
Data are shown as means ± SE.
(*-statistically significant difference to the control value before caffeine ingestion at p<0.01).
The PORH indices
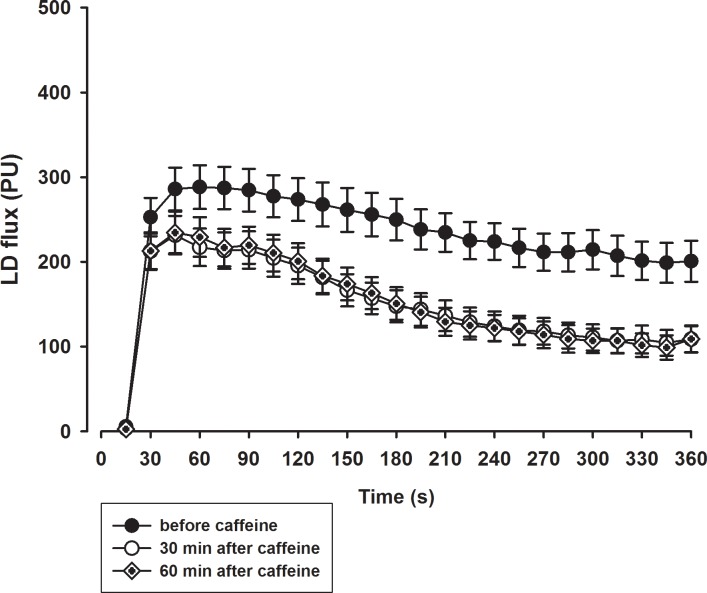
The typical PORH response and power spectral density before and after caffeine ingestion are presented in Fig 2. The mean PORH response 30 and 60 minutes after the ingestion of caffeine was significantly attenuated compared to the response prior to ingestion (Fig 3 and Fig 4). The peak LD flux during PORH (Fig 4A), the PORH duration (Fig 4B), and the area under the LD flux curve (Fig 4C) were significantly reduced after the ingestion of caffeine (Dunnett’s test, p<0.01). In addition, there was a significant decrease in T/2 and an increase in the relative reactive hyperaemia value (Fig 5) but no change in time-to-peak value after the ingestion of caffeine. In contrast, there were no significant differences in obtained values after ingestion of the placebo solution.
Fig 3. Mean PORH response before ingestion of caffeine and 30 and 60 minutes after ingestion of caffeine.
Fig 4.
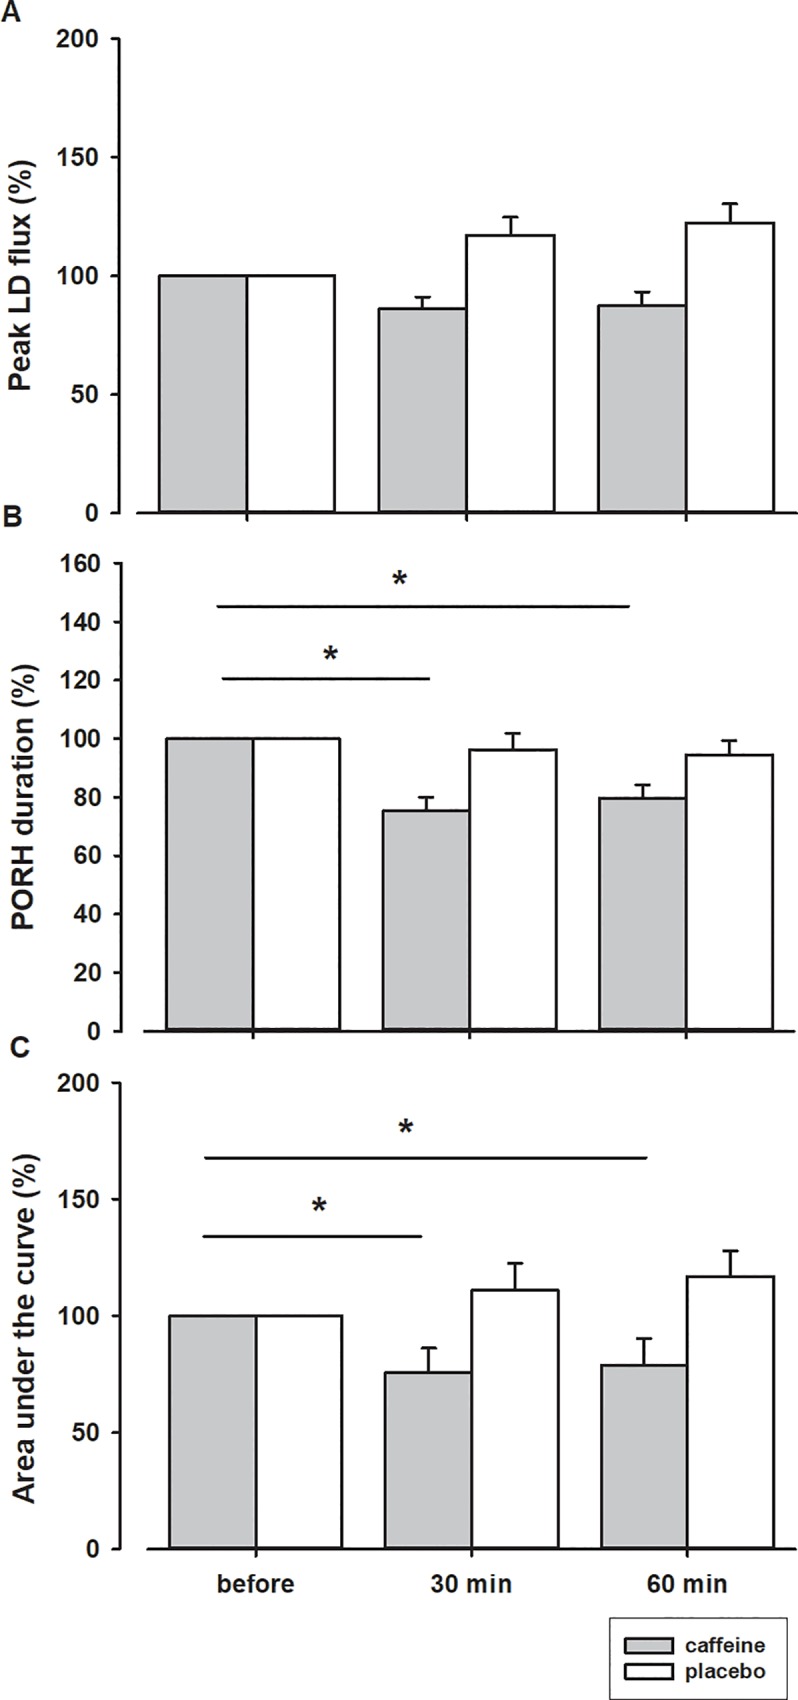
Peak LD flux (A), duration (B) and area under the LD flux curve (C) after ingestion of caffeine or placebo, expressed as percentage of values obtained before ingestion. *–statistically significant difference before and after ingestion of caffeine (p < 0.05).
Fig 5.
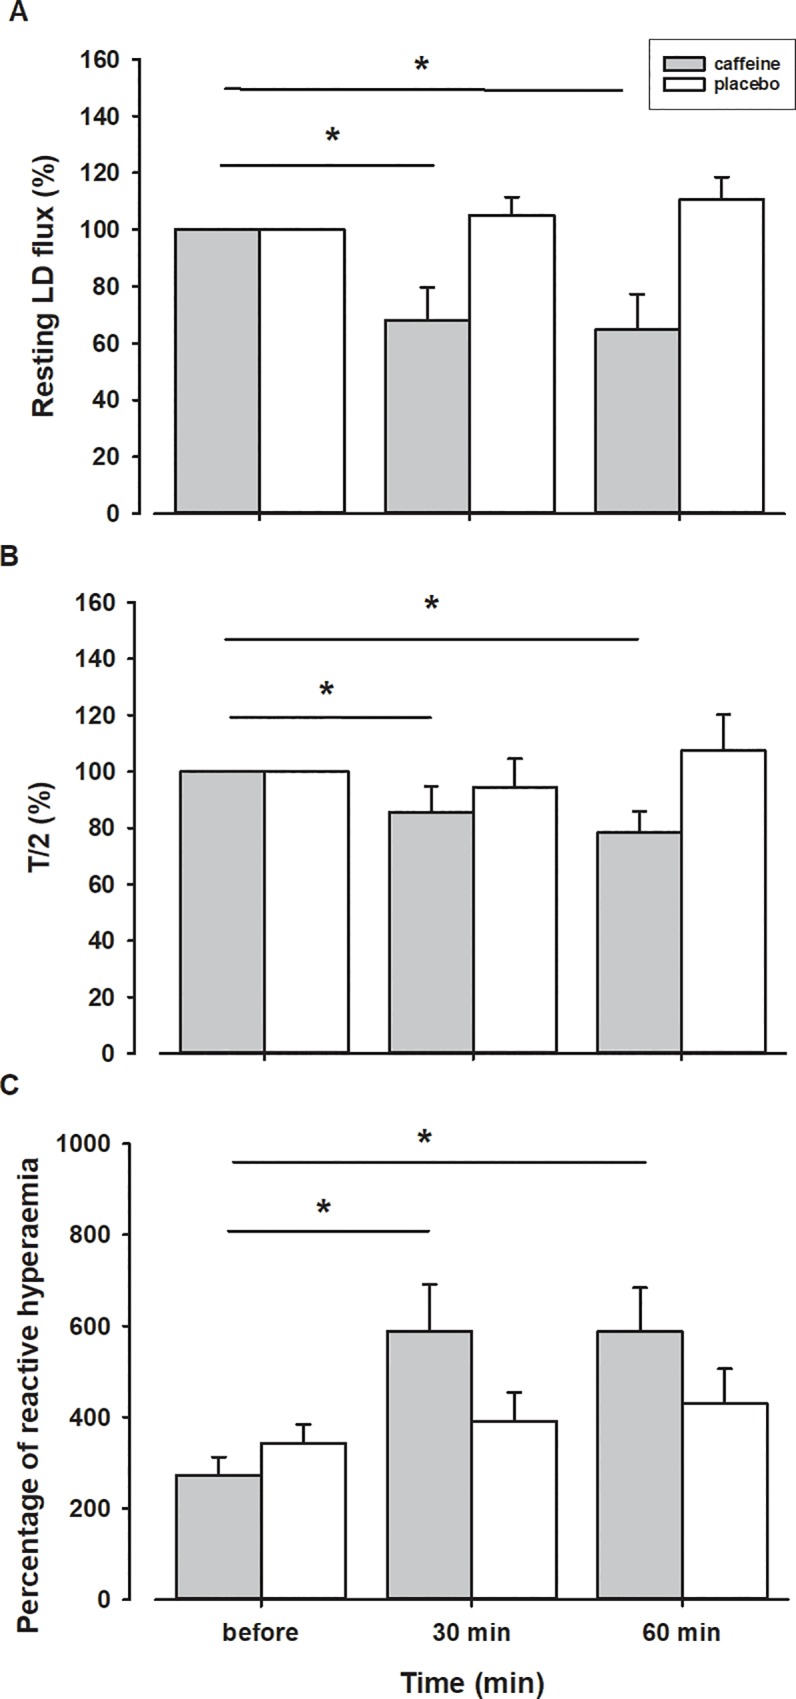
Resting LD flux (A) and half recovery time—T/2 (B) after ingestion of caffeine or placebo expressed as percentage of values obtained before ingestion. Percentage of reactive hyperaemia (C) before and after ingestion of caffeine or placebo. *–statistically significant difference before and after ingestion of caffeine (p < 0.05).
Spectral analysis of LD flux
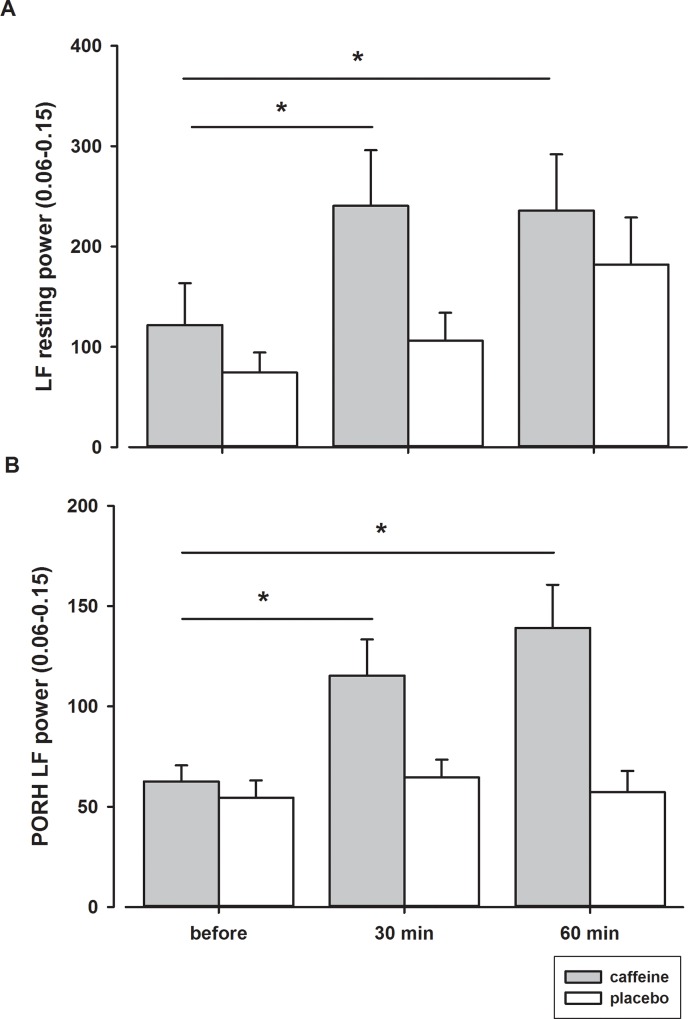
The power of the low frequency band oscillations increased significantly 30 minutes after the ingestion of caffeine at rest and during the PORH response and remained higher for another 30 minutes (Fig 6 and Table 2). In contrast, the power of the ultra-low frequency, very-low frequency, and high frequency bands of the spectrum did not change after the ingestion of caffeine.
Fig 6.
Power of LF oscillations at rest (A) and during PORH response (B) before and after ingestion of caffeine or placebo. *–statistically significant difference before and after ingestion of caffeine (p < 0.05).
Table 2. Spectral analysis of LD signal during PORH response.
| ULF power 0.0095–0.02 Hz [n.u.] |
VLF power 0.02–0.06 Hz [n.u.] | LF power 0.06–0.15 Hz [n.u.] | HF power 0.15–0.6 Hz [n.u.] | |
|---|---|---|---|---|
| Before ingestion | 24.5 ± 3.4 | 22.3 ± 2.2 | 19.2 ± 2.0 | 11.4 ± 0.8 |
| 30 min after caffeine | 26.6 ± 4.2 | 25.6 ± 2.6 | 27.0 ± 3.7* | 11.0 ± 1.5 |
| 60 min after caffeine | 20.9 ± 3.2 | 23.4 ± 1.9 | 28.8 ± 3.0* | 13.1 ± 1.8 |
ULF–ultra-low frequency; VLF–very-low frequency; LF–low frequency; HF–high frequency; n.u.–normalized units
*–statistically significant difference before and after ingestion of caffeine (p < 0.05).
Data are expressed as means ± SE.
Correlations
A correlation between the PORH area decrease and the heart rate decrease was observed 30 min (R = 0.415, p = 0.0181) and 60 min (R = 0.494, p = 0.0041) after caffeine consumption. There was also a correlation between the number of cups of coffee regularly consumed by test subjects and individual resting LD flux values (R = 0.492, p = 0.00422), peak LD flux values during PORH (R = 0.458, p = 0.00847), and PORH area (R = 0.506, p = 0.00313) after caffeine consumption. In contrast, there were no correlations between the number of cups of coffee regularly consumed and changes in blood pressure or heart rate after caffeine consumption.
Discussion
The main findings of the present study are that ingestion of a modest amount of caffeine reduces resting cutaneous LD flux and increases low frequency oscillations of postocclusive LD flux. Caffeine also affects the cutaneous microvascular PORH response by diminishing peak LD flux, PORH duration, and consequently the area under the PORH flux curve. To our knowledge this is the first study measuring the direct effect of caffeine ingestion on microcirculation. Two other studies measuring the microcirculatory response to caffeinated or decaffeinated coffee were performed differently and hence are not comparable to ours.
The effect of caffeine on blood pressure and heart rate
The effect of caffeine on blood pressure was a slight but significant increase in systolic and diastolic blood pressure due to the direct effects of caffeine on vascular tone, on myocardial contractility and conduction, and on the autonomic (sympathetic and parasympathetic) nervous system. However, heart rate decreased. These results were as expected [2,29–31], although in many studies heart rate did not change [21,22,32–34] or even increased [35]. Studies differ in doses of caffeine, time interval after caffeine ingestion, time after the most recent meal, and the number of participants.
The cardiovascular effects of caffeine in concentrations ordinarily achieved after drinking coffee are primarily due to the antagonism of adenosine A(1) and A(2A) receptors. The inhibition of phosphodiesterases or the mobilization of intracellular calcium requires a much higher concentration of caffeine [36].
The effect of caffeine on PORH
In our study, the PORH response (peak LD flux, PORH duration, T/2, and the area under the PORH LD flux curve) after caffeine ingestion decreased. There are many factors involved in the skin PORH response: the accumulation of vasodilator metabolites (e.g. adenosine); substances released from the endothelium in response to increased shear stress (prostaglandins, EDHF, NO); vascular smooth muscle relaxation in response to reduced transmural pressure in resistance vessels distal to the site of circulatory arrest [15,37,38]. Caffeine, through the antagonism of adenosine receptors, decreased the PORH response.
The study by Noguchi and co-workers [21] presented the “percentage of reactive hyperaemia”, calculated as 100x(peak hyperaemic flow–resting flow)/resting flow. In their and in our study, the so-calculated “relative reactive hyperaemia” increased after caffeine ingestion.
In contrast to the results of the present study, where caffeine reduced the PORH response after the release of the digital arteries occlusion, the study of Tesselaar and co-workers showed that caffeinated coffee did not affect the PORH response after 5-minutes of forearm arterial occlusion [22]. The absence of the effect might be due to the different mechanisms involved in skin PORH after a release of a digital arteries occlusion compared to the PORH response after the release of a forearm occlusion. The postocclusive increase of shear stress releases more NO in the large, conductive arteries and more EDHF in the small, resistance vessels. In addition, a significant dependence of peak flow amplitude on arterial pressure and time of occlusion were reported [24]. Therefore, the mechanisms involved in the PORH response after an occlusion of the brachial artery differ from that of digital arteries. The methodology of the study by Noguchi and co-workers as well as that by Tesselaar and co-workers differs from ours. Time and place of occlusion, quantity and form of caffeine ingestion, and number of participants are different. Therefore, the results of these studies do not exclude one another but are complementary.
The postocclusive reactive hyperaemic response after the release of a digital arteries occlusion consists of two independent parts: 1) peak flow, reflecting a sudden increase of blood flow in the skin microvessels after the removal of the occlusion (an indicator of the increased shear stress) [39,40] and 2) a more prolonged hyperaemic phase, reflecting metabolic debt repayment to the tissue [41]. This second part of PORH, consisting of vasomotion of myogenic origin, independently affects the post-peak-flow re-perfusion and can increase mean blood flow up to 40–60% [42]. An increase in blood flow due to oscillations in the arteriolar diameter depends on the initial smooth muscle cell tone [42]. Additionally, blood flow distribution at bifurcations depends on the oscillation waveforms [42,43].
Our results also confirm that regular caffeine consumption leads to lessened difference in the resting LD flux and the PORH response before and after ingestion of a single dose of caffeine, as represented by the correlation between the amount of regular caffeine consumption and the PORH response to the single dose of caffeine.
The effect of caffeine on vasomotion
In our study the overall effect of caffeine on the cutaneous vessel wall was vasoconstriction, indicated by elevated blood pressure and decreased resting cutaneous LD flow. At the same time, the power of the low-frequency interval, 0.06–0.15 Hz, of PORH oscillations increased after caffeine consumption.
Microvascular vasomotion is defined as the spontaneous rhythmic contraction and dilatation of the smooth muscles in the walls of small blood vessels [43,44]. There is some evidence indicating that vasomotion may be involved in the regulation of microvascular blood flow distribution and oxygen delivery to tissues [45,46] and two theoretical modeling studies [47,48] suggest that vasomotion may improve oxygen delivery in some cases.
Caffeine acts on the smooth muscular cells through different mechanisms with an opposite effect. Through direct action caffeine activates the ryanodine channels in the endoplasmic reticulum, activates the nonselective channel for cations, inhibits the cAMP phosphodiesterase, inhibits the inositol trisphosphate receptor, inhibits myosin light chain kinase, increases Ca2+ concentration in a region distant from the contractile apparatus, inhibits voltage-dependent Ca2+ channels, and blocks adenosine receptors. Through indirect action, caffeine increases the production of nitric oxide, increases the production of renin, and stimulates the sympathetic system [49,50]. It seems that in our experimental setting the mechanisms that cause an increase in vascular smooth muscle activity prevailed.
Study limitations
For the spectral analysis of the LD flux signal we used 6-minute recordings. Due to the short length of the recordings, we cannot be certain that the ultra-low frequency oscillations after caffeine did not change.
Both habitual and nonhabitual coffee drinkers were among the subjects in the present study. Some of the nonhabitual coffee drinkers reported concern about consuming 200 mg of caffeine. Nevertheless, all participants in the study consumed 200 mg of caffeine. However, given the concern reported by some nonhabitual coffee drinkers, we cannot be certain that those participants were calm after the caffeine ingestion. This fact could have influenced individual resting LD flux values. However, since resting LD flux values and heart rate decreased after caffeine consumption, we believe that any resultant anxiety had only a minor effect on the results obtained in the present study.
Conclusions
The results of our study demonstrate for the first time that caffeine affects cutaneous microcirculation by increasing low frequency oscillations of resting and postocclusive LD flux, which is related to spontaneous myogenic activity. The impact on the PORH response is the diminishment of peak LD flux, PORH duration, and consequently the area under the PORH flux curve. In addition, the results confirm that the ingestion of a modest amount of caffeine increases blood pressure, while at the same time reduces heart rate and resting cutaneous LD flux in young, healthy individuals.
Supporting information
(XLSX)
Data Availability
All relevant data are within the paper.
Funding Statement
This work was supported by: SRA program No.: P3-0019, Slovenian research agency, Slovenia.
References
- 1.Waring WS, Goudsmit J, Marwick J, Webb DJ, Maxwell SR. Acute caffeine intake influences central more than peripheral blood pressure in young adults. Am J Hypertens. 2003;16: 919–924. [DOI] [PubMed] [Google Scholar]
- 2.Hartley TR, Lovallo WR, Whitsett TL. Cardiovascular effects of caffeine in men and women. Am J Cardiol. 2004;93: 1022–1026. 10.1016/j.amjcard.2003.12.057 [DOI] [PubMed] [Google Scholar]
- 3.Sondermeijer HP, van Marle AG, Kamen P, Krum H. Acute effects of caffeine on heart rate variability. Am J Cardiol. 2002;90: 906–907. [DOI] [PubMed] [Google Scholar]
- 4.Mahmud A, Feely J. Acute effect of caffeine on arterial stiffness and aortic pressure waveform. Hypertension. 2001;38: 227–231. [DOI] [PubMed] [Google Scholar]
- 5.Richardson T, Rozkovec A, Thomas P, Ryder J, Meckes C, Kerr D. Influence of caffeine on heart rate variability in patients with long-standing type 1 diabetes. Diabetes Care. 2004;27: 1127–1131. [DOI] [PubMed] [Google Scholar]
- 6.Rauh R, Burkert M, Siepmann M, Mueck-Weymann M. Acute effects of caffeine on heart rate variability in habitual caffeine consumers. Clin Physiol Funct Imaging. 2006;26: 163–166. 10.1111/j.1475-097X.2006.00663.x [DOI] [PubMed] [Google Scholar]
- 7.Fredholm BB, Bättig K, Holmén J, Nehlig A, Zvartau EE. Actions of caffeine in the brain with special reference to factors that contribute to its widespread use. Pharmacol Rev. 1999;51: 83–133. [PubMed] [Google Scholar]
- 8.McPherson PS, Kim YK, Valdivia H, Knudson CM, Takekura H, Franzini-Armstrong C et al. The brain ryanodine receptor: a caffeine-sensitive calcium release channel. Neuron. 1991;7: 17–25. [DOI] [PubMed] [Google Scholar]
- 9.Sattin A, Rall TW. The effect of adenosine and adenine nucleotides on the cyclic adenosine 3’, 5’-phosphate content of guinea pig cerebral cortex slices. Molecular Pharmacology. 1970;6: 13–23. [PubMed] [Google Scholar]
- 10.Fredholm BB, IJzerman AP, Jacobson KA, Klotz KN, Linden J. International Union of Pharmacology. XXV. Nomenclature and classification of adenosine receptors. Pharmacol Rev. 2001;53: 527–552. [PMC free article] [PubMed] [Google Scholar]
- 11.Fredholm BB, Sydbom A. Are the anti-allergic actions of theophylline due to antagonism at the adenosine receptor. Agents Actions. 1980;10: 145–147. [DOI] [PubMed] [Google Scholar]
- 12.Fredholm BB, Irenius E, Kull B, Schulte G. Comparison of the potency of adenosine as an agonist at human adenosine receptors expressed in Chinese hamster ovary cells. Biochem Pharmacol. 2001;61: 443–448. [DOI] [PubMed] [Google Scholar]
- 13.Roustit M, Cracowski JL. Non-invasive assessment of skin microvascular function in humans: an insight into methods. Microcirculation. 2012;19: 47–64. 10.1111/j.1549-8719.2011.00129.x [DOI] [PubMed] [Google Scholar]
- 14.Björnberg J, Albert U, Mellander S. Resistance responses in proximal arterial vessels, arterioles and veins during reactive hyperaemia in skeletal muscle and their underlying regulatory mechanisms. Acta Physiol Scand. 1990;139: 535–550. 10.1111/j.1748-1716.1990.tb08957.x [DOI] [PubMed] [Google Scholar]
- 15.Medow MS, Taneja I, Stewart JM. Cyclooxygenase and nitric oxide synthase dependence of cutaneous reactive hyperemia in humans. Am J Physiol Heart Circ Physiol. 2007;293: H425–432. 10.1152/ajpheart.01217.2006 [DOI] [PMC free article] [PubMed] [Google Scholar]
- 16.Freedman ND, Park Y, Abnet CC, Hollenbeck AR, Sinha R. Association of coffee drinking with total and cause-specific mortality. N Engl J Med. 2012;366: 1891–904. 10.1056/NEJMoa1112010 [DOI] [PMC free article] [PubMed] [Google Scholar]
- 17.Crippa A, Discacciati A, Larsson SC, Wolk A, Orsini N. Coffee consumption and mortality from all causes, cardiovascular disease, and cancer: a dose-response meta-analysis. Am J Epidemiol. 2014;180: 763–75. 10.1093/aje/kwu194 [DOI] [PubMed] [Google Scholar]
- 18.Turnbull D, Rodricks JV, Mariano GF, Chowdhury F. Caffeine and cardiovascular health. Regul Toxicol Pharmacol. 2017;89: 165–185. 10.1016/j.yrtph.2017.07.025 [DOI] [PubMed] [Google Scholar]
- 19.Gunter MJ, Murphy N, Cross AJ, Dossus L, Dartois L, Fagherazzi G, et al. Coffee Drinking and Mortality in 10 European Countries: A Multinational Cohort Study. Ann Intern Med. 2017;167: 236–247. 10.7326/M16-2945 [DOI] [PMC free article] [PubMed] [Google Scholar]
- 20.Voskoboinik A, Kalman JM, Kistler PM. Caffeine and Arrhythmias: Time to Grind the Data. JACC Clin Electrophysiol. 2018;4: 425–432. 10.1016/j.jacep.2018.01.012 [DOI] [PubMed] [Google Scholar]
- 21.Noguchi K, Matsuzaki T, Sakanashi M, Hamadate N, Uchida T, Kina-Tanada M et al. Effect of caffeine contained in a cup of coffee on microvascular function in healthy subjects. J Pharmacol Sci. 2015;127: 217–222. 10.1016/j.jphs.2015.01.003 [DOI] [PubMed] [Google Scholar]
- 22.Tesselaar E, Nezirevic Dernroth D, Farnebo S. Acute effects of coffee on skin blood flow and microvascular function. Microvasc Res. 2017;114: 58–64. 10.1016/j.mvr.2017.06.006 [DOI] [PubMed] [Google Scholar]
- 23.Yvonne-Tee GB, Rasool AH, Halim AS, Rahman AR. Noninvasive assessment of cutaneous vascular function in vivo using capillaroscopy, plethysmography and laser-Doppler instruments: its strengths and weaknesses. Clin Hemorheol Microcirc 2006;34: 457–473. [PubMed] [Google Scholar]
- 24.Strucl M, Peterec D, Finderle Z, Maver J. Pressure sensitivity of flow oscillations in postocclusive reactive skin hyperemia. Am J Physiol. 1994;266: H1762–1768. 10.1152/ajpheart.1994.266.5.H1762 [DOI] [PubMed] [Google Scholar]
- 25.Cankar K, Finderle Z, Strucl M. The effect of alpha-adrenoceptor agonists and L-NMMA on cutaneous postocclusive reactive hyperemia. Microvasc Res. 2009;77: 198–203. 10.1016/j.mvr.2008.10.004 [DOI] [PubMed] [Google Scholar]
- 26.Yvonne-Tee GB, Rasool AH, Halim AS, Rahman AR. Reproducibility of different laser Doppler fluximetry parameters of postocclusive reactive hyperemia in human forearm skin. J Pharmacol Toxicol Methods. 2005;52: 286–92. 10.1016/j.vascn.2004.11.003 [DOI] [PubMed] [Google Scholar]
- 27.Stefanovska A, Bracic M, Kvernmo HD. Wavelet analysis of oscillations in the peripheral blood circulation measured by laser Doppler technique. IEEE Trans Biomed Eng. 1999;46: 1230–9. [DOI] [PubMed] [Google Scholar]
- 28.Jan YK, Brienza DM, Geyer MJ, Karg P. Wavelet-based spectrum analysis of sacral skin blood flow response to alternating pressure. Arch Phys Med Rehabil. 2008;89: 137–45. 10.1016/j.apmr.2007.07.046 [DOI] [PubMed] [Google Scholar]
- 29.Myers MG, Reeves RA. The effect of caffeine on daytime ambulatory blood pressure. Am j Hypertens. 1991;4: 427–431. [DOI] [PubMed] [Google Scholar]
- 30.Nurminen ML, Niittynen L, Korpela R, Vapaatalo H. Coffee, caffeine and blood pressure: a critical review. Eur J Clin Nutr. 1999;53: 831–839. [DOI] [PubMed] [Google Scholar]
- 31.Kennedy MD, Galloway AV, Dickau LJ, Hudson MK. The comulative effect of caffeine and a mental stress task on heart rate, blood pressure, and mental alertness is similar in caffeine-naive and caffeine-habituated females. Nutrition Research. 2008;28: 609–614. 10.1016/j.nutres.2008.06.003 [DOI] [PubMed] [Google Scholar]
- 32.Sudano I, Spieker L, Binggeli C, Ruschitzka F, Lüscher TF, Noll G et al. Coffee blunts mental stress-induced blood pressure increase in habitual but not in nonhabitual coffee drinkers. Hypertension. 2005;46: 521–526. 10.1161/01.HYP.0000177448.56745.c7 [DOI] [PubMed] [Google Scholar]
- 33.Umemura T, Ueda K, Nishioka K, Hidaka T, Takemoto H, Nakamura S et al. Effect of Acute Administration of Caffeine on Vascular Function. Am J Cardiol. 2006;98: 1538–1541. 10.1016/j.amjcard.2006.06.058 [DOI] [PubMed] [Google Scholar]
- 34.Karapetian GK, Engels HJ, Gretebeck KA, Gretebeck RJ. Effects of caffeine on LV, VT and HRVT. Int J Sports Med. 2012;33: 507–513. 10.1055/s-0032-1301904 [DOI] [PubMed] [Google Scholar]
- 35.Acheson KJ, Gremaud G, Meirim I, Montigon F, Krebs Y, Fay LB, et al. Metabolic effects of caffeine in humans: lipid oxidation or futile cycling? Am J Clin Nutr. 2004;79(1): 40–6. 10.1093/ajcn/79.1.40 [DOI] [PubMed] [Google Scholar]
- 36.Riksen NP, Smits P, Rongen GA. The cardiovascular effects of methylxanthines. Handb Exp Pharmacol. 2011; 413–437. 10.1007/978-3-642-13443-2_16 [DOI] [PubMed] [Google Scholar]
- 37.Patterson GC. The role of intravascular pressure in the causation of reactive hyperaemia in the human forearm. Clin Sci. 1956;15: 17–25. [PubMed] [Google Scholar]
- 38.Binggeli C, Spieker LE, Corti R, Sudano I, Stojanovic V, Hayoz D et al. Statins enhance postischemic hyperemia in the skin circulation of hypercholesterolemic patients. E monitoring test of endothelial dysfunction for clinical practise. JACC. 2003;42: 71–77. [DOI] [PubMed] [Google Scholar]
- 39.Paniagua OA, Bryant MB, Panza JA. Role of endothelial nitric oxide in shear-stress induced vasodilation of human microvasculature. Circulation. 2001;103: 1752–1758. [DOI] [PubMed] [Google Scholar]
- 40.Henrion D. Pressure and flow-dependent tone in resistance arteries. Arch Mal Coeur. 2005;98: 913–921. [PubMed] [Google Scholar]
- 41.Cracowski JL, Minson CT, Salvat-Melis M, Halliwill JR. Methodological issues in the assessment of skin microvascular endothelial function in humans. Trends Pharmacol Sci. 2006;27: 503–508. 10.1016/j.tips.2006.07.008 [DOI] [PubMed] [Google Scholar]
- 42.Ursino M, Cavalcanti S, Bertuglia S, Colantuoni A. Theoretical analysis of complex oscillations in multibranched microvascular networks. Microvasc Res. 1996;23: 229–249. [DOI] [PubMed] [Google Scholar]
- 43.Rossi M, Carpi A, Di Maria C, Franzoni F, Galetta F, Santoro G. Post-ischaemic peak flow and myogenic flowmotion component are independent variables for skin post-ischaemic reactive hyperaemia in healthy subjects. Microvasc Res. 2007;74: 9–14. 10.1016/j.mvr.2007.02.006 [DOI] [PubMed] [Google Scholar]
- 44.Nilsson H, Aalkjaer C. Vasomotion: mechanisms and physiological importance. Mol Interv. 2003;3: 79–89. 10.1124/mi.3.2.79 [DOI] [PubMed] [Google Scholar]
- 45.Thorn CE1, Kyte H, Slaff DW, Shore AC. An association between vasomotion and oxygen extraction. Am J Physiol Heart Circ Physiol. 2011;301(2): H442–9. 10.1152/ajpheart.01316.2010 [DOI] [PMC free article] [PubMed] [Google Scholar]
- 46.Waltz X1, Pichon A, Mougenel D, Lemonne N, Lalanne-Mistrih ML, Sinnapah S, et al. Hemorheological alterations, decreased cerebral microvascular oxygenation and cerebral vasomotion compensation in sickle cell patients. Am J Hematol. 2012;87(12): 1070–3. 10.1002/ajh.23318 [DOI] [PubMed] [Google Scholar]
- 47.Kislukhin VV. Stochasticity of flow through microcirculation as a regulator of oxygen delivery. Theor Biol Med Model. 2010;7: 29 10.1186/1742-4682-7-29 [DOI] [PMC free article] [PubMed] [Google Scholar]
- 48.Goldman D, Popel AS. A computational study of the effect of vasomotion on oxygen transport from capillary networks. J Theor Biol. 2001;209(2): 189–99. 10.1006/jtbi.2000.2254 [DOI] [PubMed] [Google Scholar]
- 49.Rembold CM, van Riper DA, Chen XL. Focal [Ca2+](i) increases detected by aequorin but not by fura-2 in histamine- and caffeine-stimulated swine carotid artery. Journal of Physiology. 1995;488: 549–564. [DOI] [PMC free article] [PubMed] [Google Scholar]
- 50.Echeverri D, Montes FR, Cabrera M, Galán A, Prieto A. Caffeine's Vascular Mechanisms of Action. Int J Vasc Med. 2010: 834060 10.1155/2010/834060 [DOI] [PMC free article] [PubMed] [Google Scholar]
Associated Data
This section collects any data citations, data availability statements, or supplementary materials included in this article.
Supplementary Materials
(XLSX)
Data Availability Statement
All relevant data are within the paper.


