. 2019 Mar 8;8:e43920. doi: 10.7554/eLife.43920

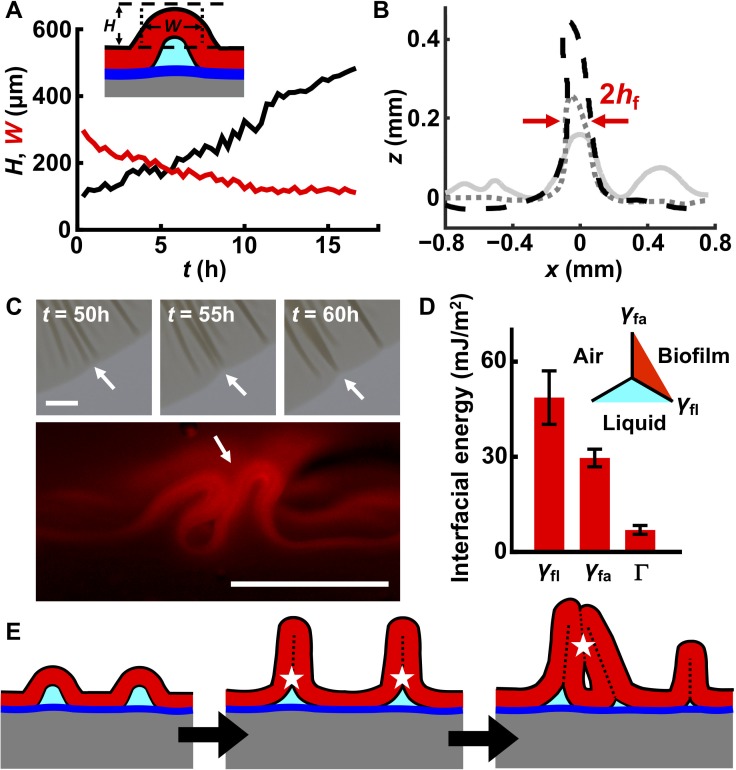
Figure 4. Interfacial energies control blister dynamics and interactions between blisters.

(A) Time evolution of the height H (black) and width W (red) of a representative biofilm blister. Inset: schematic representation of a blister; color code as in Figure 3D. (B) Developing profile of a single blister, extracted from side view images at successive time points after delamination. Profiles are shown at 2.5 hr (gray line), 10 hr (gray dotted line) and 17.5 hr (black dashed line) after the onset of delamination. The distance between the red arrows corresponds to W, which, over time, approaches twice the biofilm thickness (2hf). Regions near the blister become flatter as cell mass is pulled into the blister. Agar concentration: 0.4%. (C) Representative merging of adjacent blisters (white arrows) at specified times (top). Cross-section image from a biofilm producing fluorescent mKate2 reveals blister peak-to-peak contact (bottom; designated by the white arrow). Agar concentration: 0.7%. Scale bars: 1 mm (top) and 0.5 mm (bottom). (D) Interfacial energy of the biofilm–air interface γfa, biofilm–liquid interface γfl, and the adhesion energy between the biofilm and the substrate Γ for WT V. cholerae biofilms. Data are represented as mean ± std with n = 3. Inset: schematic of different interfaces. (E) Schematic of blister development in a WT V. cholerae biofilm. White stars and dashed black lines denote interface annihilation events. For panels (D) and (E), the color code is the same as that in Figure 3D.

Figure 4—source data 1. Blister formation and evolution dynamics and related interfacial energies in WT V. cholerae biofilms.
DOI: 10.7554/eLife.43920.027

Figure 4.

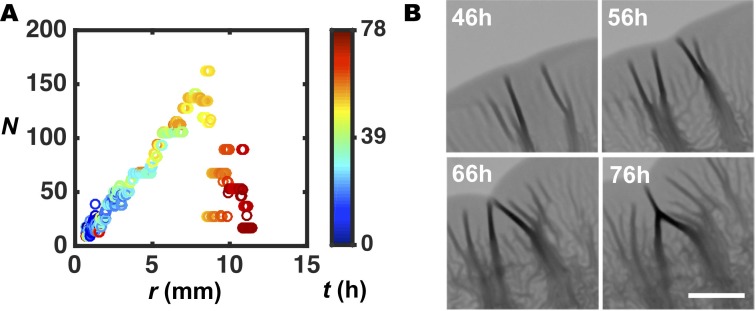
Figure 4—figure supplement 1. Characterization of pattern merging events.

Figure 4—figure supplement 1.

(A) Number of wrinkles or blisters versus radial coordinate r, for the biofilm shown in Figure 2A over a longer time interval. N sharply declines at the rim during the late stages of biofilm growth because of the merger of adjacent blisters, which eliminates biofilm–air interfaces (Figure 4C). (B) Representative images of the rim of a WT V. cholerae biofilm grown on 0.4% agar at the designated times. Neighboring blisters are pushed toward each other by the adjacent flat regions. Ultimately, the blisters merge. Scale bar: 2 mm.
Figure 4—figure supplement 1—source data 1. Wavelength analysis over three days of biofilm development.
DOI: 10.7554/eLife.43920.029
Figure 4—figure supplement 2. Analysis of the internal structures of biofilm blisters.

Figure 4—figure supplement 2.

(A) SEM image of a cross-section of an isolated blister from a 2-day-old biofilm grown on a 0.6% agar substrate. The two inner faces of the blister contact one another, and an empty space exists underneath the blister. Scale bar: 100 μm. (B) Images of a V. cholerae biofilm expressing mKate2 grown for 2 days on a 0.8% agar substrate containing SytoX Green. The top view (top) and the cross-sectional view (bottom) are shown. Top left: signal from the constitutive mKate2 transcriptional fusion that labels live cells. Top middle: signal from SytoX Green that stains dead cells. Top right: merged signals. Dashed lines and arrows in the top right panel indicate the annulus at the biofilm edge that contains a lower fraction of dead cells relative to the region internal to this annulus. The existence of such an annulus shows that cell growth occurs primarily at the edge of the biofilm. Bottom: cross-sectional view of biofilm blisters reveals stratification between live (red) and dead (green) cells. The sides of blisters contact one another via the dead cell layer. In panel (B), scale bars: 5 mm (top) and 500 μm (bottom).
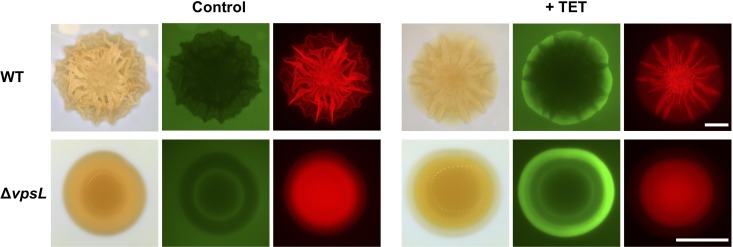
Figure 4—figure supplement 3. Bacterial cells residing in biofilm blisters are protected from antibiotics.

Figure 4—figure supplement 3.

Biofilms of cells constitutively expressing mKate2 were grown on semipermeable membranes on top of a 0.6% agar substrate for 2 days. The membranes were transferred to the surface of LB liquid medium containing SytoX Green without (left) or with (right) 50 μg/mL tetracycline (TET) overnight. For each condition, the left part shows the bright-field images, the middle part shows SytoX staining of dead cells, and the right part shows the mKate2 signal from live cells. In the absence of tetracycline, both WT and ΔvpsL mutant biofilms harbor few dead cells. In the presence of tetracycline, significant cell death occurs at the edges of both the WT and the ΔvpsL biofilms. However, WT cells in the biofilm regions containing blisters are less susceptible to the lethal effects of antibiotics than are cells in the intervening flat regions, presumably because cells residing in blisters are located further away from the antibiotic source than are cells that are not in blisters. Such variation in survival in the tangential direction does not occur in the ΔvpsL mutant biofilm, which possesses a smooth, blister-less morphology. Scale bars: 2 mm.