. 2019 Mar 11;8:e43630. doi: 10.7554/eLife.43630

Figure 1. Interactions between Imp9 and H2A-H2B in the cell and crystal structure of the Imp9 •H2A-H2B complex.

(A) Coimmunoprecipitation (CoIP) studies of H2BmCherry from whole cell, cytoplasmic and nuclear fractions of the lysates from HeLa cells stably expressing H2BmCherry, followed by immunoblots with Imp9, Ran, RFP antibodies. PCNA and MAb414 antibodies are used as loading control antibodies. 10 µg of 1.5 mg lysates are analyzed as CoIP input. Blots are representative of three identical experiments. (B) Subcellular localization of Imp9 and Ran in Hela::H2BmCherry cells. HeLa cells were fixed, permeabilized, incubated with affinity-purified rabbit polyclonal Imp9 antibody and mouse monoclonal anti–Ran antibody, and visualized by confocal microscopy. The secondary antibodies were Alexa 488 conjugated anti–rabbit and Alexa 405 conjugated anti-mouse, respectively. The column on the right contains two-color merge images. (C). The crystal structure of human Imp9 (blue) in complex with X. laevis H2A (yellow)-H2B (red).

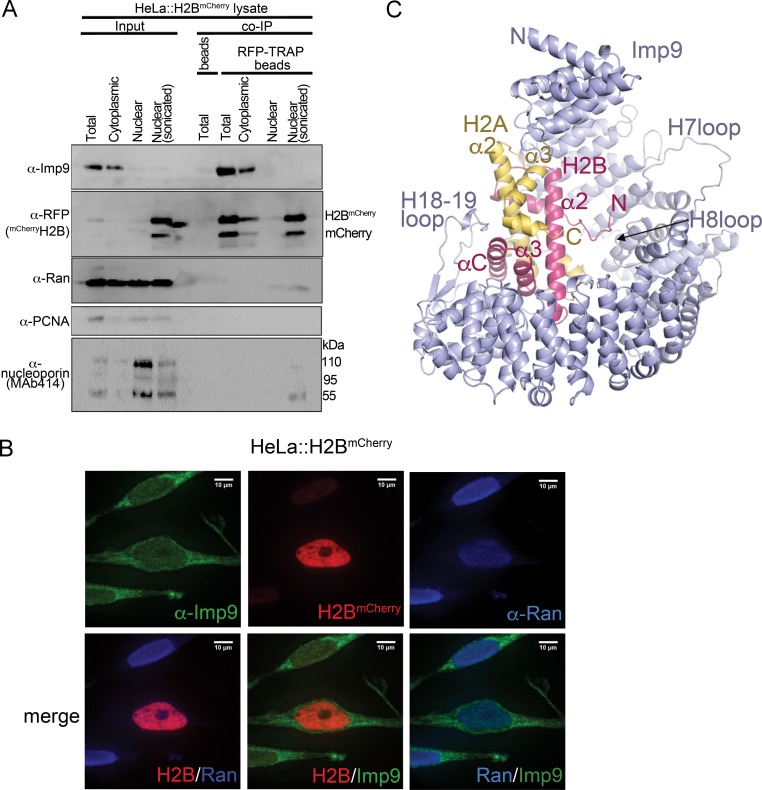
Figure 1—source data 1. Data collection and refinement statistics, Imp9•H2A-H2B structure.
DOI: 10.7554/eLife.43630.006

Figure 1.

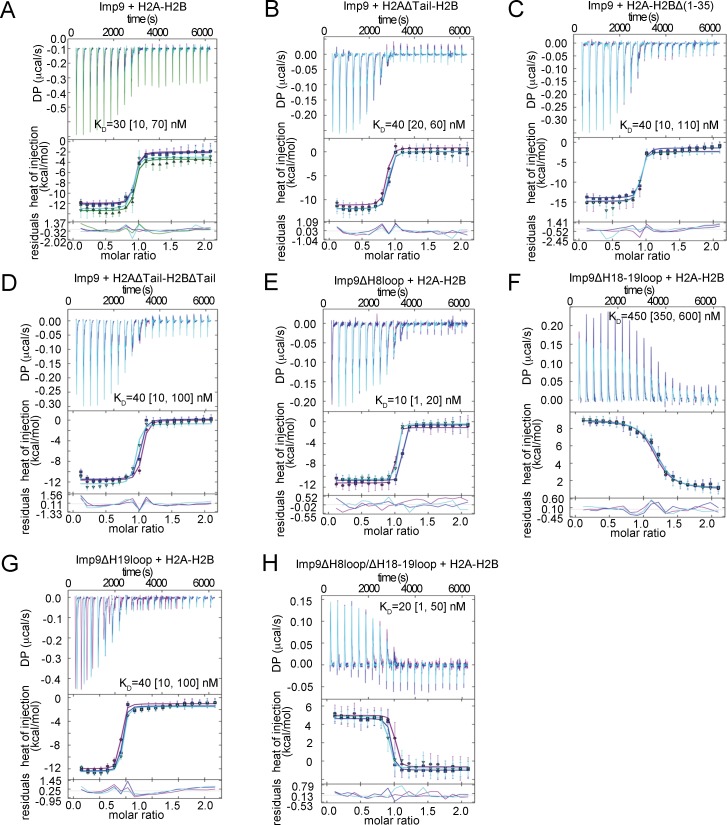
Figure 1—figure supplement 1. ITC analysis of Imp9 binding to H2A-H2B.

Figure 1—figure supplement 1.

(A-H) The GUSSI output for global analysis of each experiment (binding proteins mentioned above the panel) carried out in triplicates. The top panel shows the SVD-reconstructed thermogram provided by NITPIC, the middle panel shows the isotherms and the bottom panel shows the residuals. Individual experiments in the triplicate sets are differently color-coded. DP - differential power.
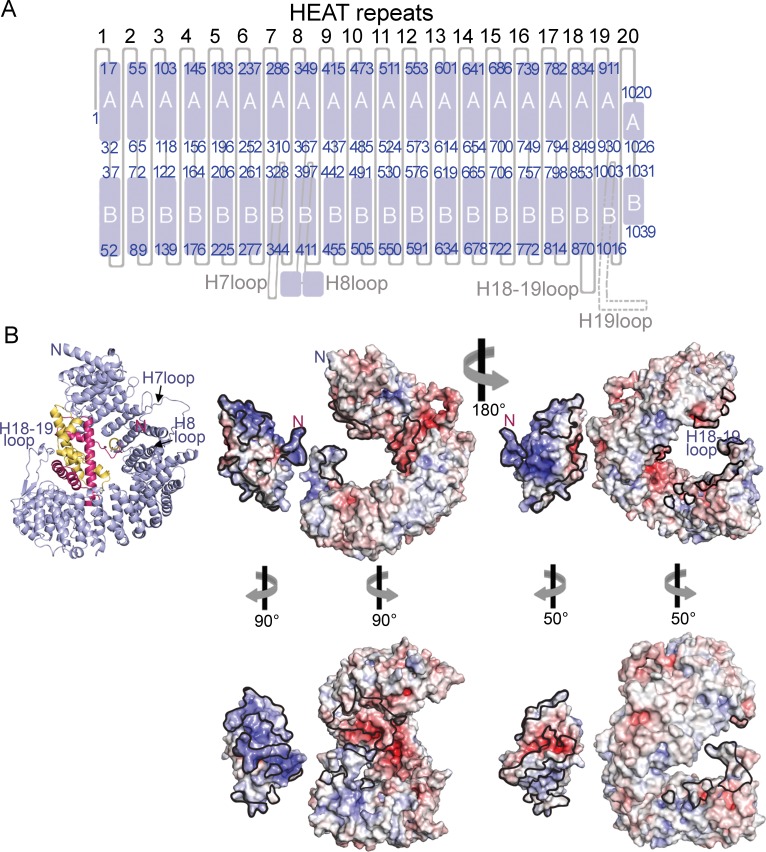
Figure 1—figure supplement 2. HEAT repeat organization of Imp9 and electrostatic surface potential of Imp9 and H2A-H2B.

Figure 1—figure supplement 2.

(A) Organization of the 20 HEAT repeats of Imp9. The H19loop, which is not modeled, is shown with a dashed line. (B) Structure of the Imp9•H2A-H2B complex shown in cartoon representation, for comparison with the surface representations. Two views (180° rotation about the vertical axis) of the electrostatic surface potential (from −8 kV to +8 kV) of H2A-H2B and Imp9. The left view is the same as the cartoon representation, with the two proteins separated for viewing of the surfaces. The structures in the panel below show approximate open-book views. Interfaces on Imp9 and H2A-H2B are outlined in black. The electrostatic surface was generated in PyMol using APBS plugin (Baker et al., 2001).