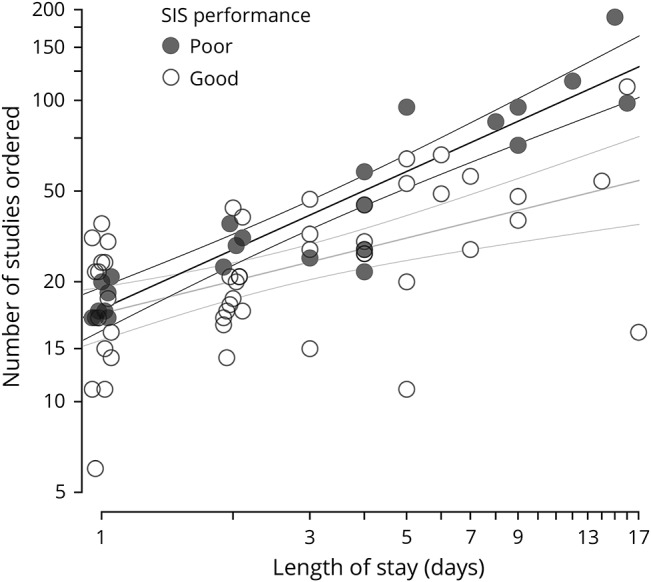
Figure. Six-Item Screener (SIS) performance predicts the number of diagnostic studies ordered during hospitalization.

The number of studies is the sum of laboratory and imaging orders during an admission. For example, a patient receiving a chest x-ray, basic metabolic panel, and serum lactate would be counted as having 3 studies. In these analyses of patients admitted to the hospital, the number of studies increases with length of stay (LOS), and is predicted by SIS performance. To help visualize overlapping points on LOS of 1 and 2 days, points are jittered slightly around their integer x-axis value. The final model displayed here included the interaction between SIS performance and LOS (p = 0.012): the intercept for both best-fit lines (shown with ± 95% confidence interval) is nearly identical, but poor performers have a steeper slope (ln[studies] = 0.65 * ln[LOS] + 3.0 vs ln[studies] = 0.36 * ln[LOS] + 3.0) (p = 0.012 for LOS × performance interaction). The full model of ln(LOS) + SIS performance + the interaction explains 55% of the variance in ln(studies) (R2 = 0.553). Based on the best-fit lines, ∼40% more studies will be ordered on a poor performer than on a good performer during a 3-day hospitalization.
