

Abstract
Active listening involves dynamically switching attention between competing talkers and is essential to following conversations in everyday environments. Previous investigations in human listeners have examined the neural mechanisms that support switching auditory attention within the acoustic featural cues of pitch and auditory space. Here, we explored the cortical circuitry underlying endogenous switching of auditory attention between pitch and spatial cues necessary to discern target from masker words. Because these tasks are of unequal difficulty, we expected an asymmetry in behavioral switch costs for hard-to-easy versus easy-to-hard switches, mirroring prior evidence from vision-based cognitive task-switching paradigms. We investigated the neural correlates of this behavioral switch asymmetry and associated cognitive control operations in the present auditory paradigm. Behaviorally, we observed no switch-cost asymmetry, i.e., no performance difference for switching from the more difficult attend-pitch to the easier attend-space condition (P→S) versus switching from easy-to-hard (S→P). However, left lateral prefrontal cortex activity, correlated with improved performance, was observed during a silent gap period when listeners switched attention from P→S, relative to switching within pitch cues. No such differential activity was seen for the analogous easy-to-hard switch. We hypothesize that this neural switch asymmetry reflects proactive cognitive control mechanisms that successfully reconfigured neurally-specified task parameters and resolved competition from other such “task sets,” thereby obviating the expected behavioral switch-cost asymmetry. The neural switch activity observed was generally consistent with that seen in cognitive paradigms, suggesting that established cognitive models of attention switching may be productively applied to better understand similar processes in audition.
Keywords: auditory attention, active listening, neural switch asymmetry, dorsolateral prefrontal cortex (DLPFC), MEG, EEG
Introduction
Human listeners are faced daily with the challenge of dynamically following conversations in noisy, multi-talker settings. Auditory science has increasingly recognized that everyday listening in such acoustically adverse and informationally complex environments depends not only on the listener’s hearing capacity, but also on the interaction between suprathreshold auditory processes and cognitive allocation of limited attentional resources (Pichora-Fuller et al. 2016). In terms of dynamically tracking conversations (i.e., “active listening”), success depends crucially on the ability to proactively switch attention to various acoustic features to enhance focus on relevant speakers (Shinn-Cunningham et al. 2017). To better understand the neural systems that support active listening, prior research in normal-hearing listeners has mapped neural activity associated with switching endogenous attention within the acoustic featural cues of pitch and auditory space (Shomstein and Yantis 2006; Salmi et al. 2009; Ahveninen et al. 2013; Larson and Lee 2013a, 2014; Alho et al. 2015), which are known to facilitate speech understanding in multi-talker environments (Kidd et al. 2005; reviewed in Bronkhorst 2015). Here, we extend this line of research by investigating the neural mechanisms that underlie switching attention between acoustic features, again utilizing pitch and spatial cues.
An extensive body of cognitive science research has employed cued task-switching paradigms to explicitly probe cognitive control processes supporting the ability to adjust behavior dynamically (reviewed in Kiesel et al. 2010), which is hypothesized to depend on the rapid reconfiguration of “task set” (i.e., neurally-specified task-relevant sensory and motor parameters) in response to changing environmental or task demands (Rogers and Monsell 1995; Meiran 2010). Data based on these paradigms, in which subjects are cued in advance which competing stimulus features to attend (or motor responses to make) to perform a given task (Meiran 1996; Monsell 2003), consistently shows slower and/or less accurate task performance for task switches as opposed to repeats (reviewed in Wylie and Allport 2000; Vandierendonck et al. 2010). Such “switch costs” are hypothesized to reflect the involvement of neurocognitive operations required to reconfigure the newly relevant task set and resolve interference from competing task sets (Allport et al. 1994; Rogers and Monsell 1995). Switch costs can be reduced by increasing the duration of the pre-stimulus switch interval (reviewed in Ruge et al. 2013), which suggests the involvement of proactive, pre-stimulus task set mechanisms. An additional finding is that these pre-stimulus processes are affected by task difficulty; that is, performance decrements are observed for switching from harder, less dominant tasks to those that are easier or prepotent—as opposed to switching in the opposite direction, from easy to hard (Allport et al. 1994; Allport and Wylie 2000; Yeung et al. 2006). Cognitive models account for these somewhat counterintuitive “switch-cost asymmetries” by positing the involvement of mechanisms that resolve competition from previously-activated, differentially-potent task sets to facilitate successful activation of the currently relevant set (Allport et al. 1994; Gilbert and Shallice 2002; Yeung and Monsell 2003).
Cognitive task-switching research has typically employed paradigms based on visual or visuospatial stimuli. In the present study, we examined the pre-stimulus neural mechanisms that support switching attention between acoustic features which presumably involves task set mechanisms similar to those posited in cognitive models. Our use of pitch- and space-dependent attentional conditions—previously observed to differentially affect task performance (Shomstein and Yantis 2006; Lee et al. 2013)—allowed us to interrogate the presence of switch-cost asymmetries in a feature-based auditory attention paradigm. This use of featural cues of unequal difficulty represents an ecologically valid approach to studying active listening, as differences in “task difficulty” in attentional switching are highly likely to occur in natural conversational settings.
In addition to assessing the presence of behavioral switch-cost asymmetries in audition, we investigated the neural correlates related to this effect using combined magneto-(MEG) and electro-encephalography (EEG) measures (together, M-EEG). We constrained analysis of the M-EEG data to a silent pre-stimulus gap period between two auditory stimulus presentation intervals in which pairs of simultaneous spoken target and masker digits with either competing pitch or spatial features were presented. Initial visual cues instructed subjects to listen in the first stimulus interval for either the high- or low-pitched digit (or that located virtually in left or right auditory space), and then, after the gap, to either maintain attention to the same feature for the second interval or switch attention between (or within) features. At the end of each trial, subjects reported via button press the target digit from both stimulus intervals. This design allowed for measurement of cortical activity uniquely associated with pre-stimulus task set mechanisms underlying the proactive switching between feature-based auditory attention that is essential to active listening.
Materials and Methods
Subjects
Sixteen healthy, normal-hearing adult subjects participated in the experiment. All participants had hearing thresholds within normal range (≤ 20 dB HL between 250 and 8000 Hz), with no more than 10 dB difference in thresholds between the two ears at any frequency tested, and eyesight correctable to 20/20 with MEG-compatible glasses or contact lenses. Two of the subjects were excluded due to an absence of reliably localized auditory N100 responses (collapsed across all trials) in primary auditory cortex according to manual visual inspection. Of the 14 subjects whose data were analyzed (21–35 years of age, eight females), 13 were right-handed as assessed by the Edinburgh Handedness Inventory (Oldfield 1971; scores ranged from 55 to 100, while the left-handed subject scored a − 95). Subjects gave informed consent according to procedures approved by the University of Washington.
Experimental Design and Statistical Analysis
Behavioral Task and Stimuli
The experimental protocol required listeners to selectively direct their attention to one of two simultaneous competing auditory stimuli (Fig. 1). Each trial began with a sequence of two visual-cue intervals, each comprising a center fixation dot and an arrow cue instructing subjects which acoustic feature—high or low pitch (up or down arrows), or left or right spatial location (left or right arrows)—to attend. These cues served to direct subjects’ attention in each of the two subsequent stimulus intervals to a spoken target digit (1, 2, 3, or 4) which was presented simultaneously with a competing masker digit (also 1, 2, 3, or 4, but always different from the target digit within each interval). Thus, in each trial, depending on the pair of arrow cues, subjects were directed to either:
-
i.
maintain attention within an acoustic feature: e.g., interval 1 = attend high pitch [∧] and interval 2 = maintain attention to high pitch [∧], resulting in [∧/∧] (maintain pitch: P→P); or alternatively, e.g., attend left/maintain left, resulting in [</<] (maintain space: S→S),
-
ii.
switch attention within the features of pitch and space: e.g., interval 1 = attend high pitch [∧] and interval 2 = switch attention to low pitch [∨], resulting in [∧/∨] (switch within pitch: P→P†); or alternatively, e.g., attend left/switch right, resulting in [</>] (switch within space: S→S†), or
-
iii.
switch attention between the features of pitch and space: e.g., interval 1 = attend high pitch [∧] and interval 2 = switch attention to left spatial location [<], resulting in [∧/<] (switching from pitch to space: P→S); or alternatively, e.g., attend right/switch to low pitch, resulting in [>/∨] (switching from space to pitch: S→P).
Fig. 1.

Stimulus presentation paradigm, showing an example trial of switching attention between acoustic features, here from auditory space to pitch (S→P). Two visual cues began each trial and directed the listener which auditory features—either left or right spatial location (< or >; with spoken digits spatially separated by Δx =± 50° azimuth) or high or low pitch (∧ or ∨; with spoken digits separated by ΔF0 = 8.5 semitones)—to attend in two subsequent stimulus intervals in order to select the target as opposed to the masker digit. Listeners were instructed to wait for the visual cue at the end of the trial (circle around center fixation dot) to report the two target digits via right-handed button press. Cortical activity during the switch gap (1.95–2.75 s from the beginning of each trial), as assessed with M-EEG, was examined for this analysis
Cortical activation associated with maintaining attention to pitch and to auditory space (Item i above) was addressed previously by Lee et al. (2013), as were cortical systems associated with switching attention within pitch and space (Item ii above, Larson and Lee 2013a, 2014). In the present analysis, the focus is on Item iii, switching attention between pitch and auditory spatial featural cues.
Target and masker digit stimuli did not differ except for either an imposed pitch difference of 8.5 semitones or a virtual spatial shift from center of ± 50°, simulated using head-related transfer functions (HRTFs; see “Stimulus Generation” below). At the end of each trial, following the two auditory stimulus intervals, a visual cue (circle around center fixation dot) prompted subjects to report via button press the target digits presented in the two auditory intervals. Delaying responses until the end of trials reduced the influence of confounding activity associated with motor task preparation. In addition to the conditions in which auditory attention was manipulated, there was also a control condition in which subjects performed a visual spatial attention task—counting dots in locations indicated by the arrow cues—while passively listening to sound stimuli. The purpose of the visual control task was to mimic the amount of working memory (i.e., remembering what to report in the two intervals) required to perform the auditory task, and thus provide a control condition for future baseline contrasts in connectivity analyses (not analyzed here).
Overall, each trial took 6.5 s (Fig. 1), proceeding from two 200-ms-visual-cue intervals (separated from one another by 600 ms), then the first auditory stimulus presented 600 ms after the second visual-cue interval, followed by a gap (hereafter referred to as the “switch gap”) beginning 1.95 s after the start of the trial, then the second stimulus interval presented 800 ms later at 2.75 s. Near the end of the trial at 3.6 s, a response period was cued by a circle during which subjects responded using right-handed button box press (buttons ranging from 1 to 4) to identify the spoken digits (or number of visual dots) presented during each stimulus interval. The response period lasted 1.5 s, after which the response circle disappeared and the screen returned to a presentation of the fixation dot (1.4 s) before the onset of the next trial. The duration of the switch gap was set at 800 ms based on prior evidence suggesting that attentional switching mechanisms in audition require 300–800 ms (Larson and Lee 2013b). Critically, the use of the switch gap served to isolate neural activity associated with preparing to either maintain or switch attention; there were no auditory stimuli during this period, the fixation dot was the sole visual input consistent across conditions, and all motor responses were delayed until the end of each trial.
Subjects were instructed to attend to the center fixation dot throughout the experiment to reduce eye-related artifacts and to control for any effect of potential eye movement on auditory processing. Prior to scanning, subjects practiced the task, including maintaining center fixation and responding only when the response circle appeared. Target features (left versus right virtual auditory spatial location, high versus low pitch), attentional conditions (maintain, switch within, or switch between), and visual control conditions were randomized across trials. Subjects performed ten 4-min behavioral runs while in the MEG scanner. This totaled to 384 trials, with an equal distribution of left, right, high-pitch, and low-pitch targets among the 320 auditory trials (plus 64 dot-counting visual control trials), resulting in 80 maintain-attention, 80 switch-within, and 160 switch-between-feature trials.
Stimulus Generation
Auditory digit stimuli (“1, 2, 3, 4”) were generated using tokens from a single female talker. Each digit token was trimmed of leading and trailing silence, resampled to 24.4 kHz, monotonized, matched in intensity (presentation level: 75 dB SPL), and amplitude-modulated at either 36 or 44 Hz to facilitate a complementary phase-locking analysis (the results of which are not reported here due to insufficient signal-to-noise in the data). For the stimuli modulated by pitch, the pitch of the target and the masker was shifted up and down using Praat software (Boersma and Weenik 2009) to create competing tokens at 185 Hz ± 4.25 semitones, while the spatial location of each token was held constant at ± 0° azimuth. Conversely, for the stimuli modulated by auditory space, non-individualized HRTFs were imposed (Shinn-Cunningham et al. 2005) to differentially evoke a spatial percept of ± 50° azimuth (left or right), while pitch was held constant across tokens at 185 Hz. This design, in which only one acoustic feature was manipulated in each stimulus interval, ensured that listeners were never presented with competing pitch and spatial stimuli simultaneously so that the neural signal measured during the switch gap reflected controlled switching from the first acoustic feature to the second.
Auditory stimuli were presented in the MEG scanner using Tucker-Davis Technologies amplification hardware (RZ6 and HB7) and sound-isolating tubal insertion earphones (Nicolet Biomedical Instruments) with digital-to-analog conversion. Since the MEG room is magnetically but not acoustically shielded, auditory stimuli were presented against a constant Gaussian white noise background (20 dB SNR) to mask ambient noise; this noise was also inverted at one ear to generate interaural differences that caused it to “fill the head,” instead of having a distinct location. Visual stimuli were presented using Psychtoolbox (https://psychtoolbox.org; Brainard 1997) and back-projected onto a screen 1 m in front of subjects using a PT-D7700U-K (Panasonic) projector.
M-EEG and MRI Data Acquisition
Consistent with established practice (Lee et al. 2012; Liu et al. 2010), simultaneous M-EEG data were collected from each subject in order to assess cortical activity associated with the behavioral task. MEG and EEG measurements capture complementary aspects of cortical activity such that combining these measures improves localization of the signal over that of either technique in isolation (Molins et al. 2008; Sharon et al. 2007). Spatial localization was further improved by anatomically constraining the M-EEG data for each subject using that individual’s separately acquired MRI structural data (3 T Philips scanner)—comprising one standard structural multi-echo magnetization-prepared rapid gradient echo (MPRAGE) scan and two multi-echo multi-flip angle (5° and 30°) fast low-angle shot (FLASH) scans—in order to provide the necessary tissue contrast for individualized boundary-element models that accurately characterize MEG and EEG forward field patterns.
M-EEG data were recorded inside a magnetically shielded room (IMEDCO) using a 306-channel dc-SQUID VectorView system (Elekta-Neuromag) equipped with EEG amplifiers and a 60-channel MEG-compatible EEG cap (Brain Products). After fitting the subject with an EEG cap, face and chest electrodes were attached to measure electro-oculograms (EOG) and electro-cardiograms (ECG), respectively, for purposes of artifact removal in subsequent data processing stages. Five head-position indicator (HPI) coils were attached to the EEG cap to continuously record the subject’s head position relative to the MEG sensors. In order to facilitate co-registration of the M-EEG signal detectors with individualized structural MRIs in data processing/analysis stages, the locations of cardinal anatomical landmarks (nasion, left/right periauriculars), EEG electrodes, HPI coils, and at least 100 additional scalp points were recorded using a 3Space Fastrak (Polhemus) prior to placing the subject in the MEG scanner.
Data Processing
The M-EEG data were analyzed using MNE (http://www.nmr.mgh.harvard.edu/mne; see Lee et al. 2012; Gramfort et al. 2013, 2014). Data were first processed using temporal signal space separation (Taulu and Kajola 2005) to suppress environmental noise and translate the MEG coordinate frame for each subject to a common frame. For each subject, data for each condition were averaged and low-passed (55 Hz), and signal space projection was used to exclude heartbeat and blink artifacts identified using ECG and EOG data (Uusitalo and Ilmoniemi 1997). Noisy M-EEG channels were manually excluded from subsequent processing based on visual inspection (e.g., flat channels or those with flux jumps), an action presumed to have minimal impact on localization due to the spatial redundancy of M-EEG measurements (Nenonen et al. 2007). Trials were rejected for incorrect button presses in response to stimuli in either or both stimulus intervals, and for suprathreshold EEG (> 150 μV) or MEG (> 15 pT for magnetometers, > 5.0 pT/cm for gradiometers) signals.
A cortical M-EEG source space was constructed using 4096 dipoles per hemisphere, determined by a recursively subdivided octahedron. These were constrained to be normal to the cortical surface located along the gray/white matter boundary segmented from each individual’s structural MRI (Dale et al. 1999) using Freesurfer (http://surfer.nmr.mgh.harvard.edu/). Dipole currents in this whole-brain source space were then estimated from the preprocessed M-EEG data. To do this, an anatomically constrained minimum-norm linear estimation approach (Hämäläinen and Sarvas 1989; Hämäläinen and Ilmoniemi 1994; Dale et al. 1999) was employed, with sensor noise covariance estimated from 200 ms epochs prior to each trial onset while subjects were not engaged in a behavioral task (i.e., data captured in this window reflect sensor noise and brain activity not related to the auditory attention task). Source localization data were then mapped to an average brain (“fsaverage,” http://surfer.nmr.mgh.harvard.edu/) using a non-linear spherical morphing procedure (25 smoothing steps) that optimally aligns individual sulcal/gyral patterns (Fischl et al. 1999). The data were then temporally binned into 100-ms averaged windows.
M-EEG Analysis
A comparison of the spatiotemporal patterns of M-EEG activity elicited during the pre-stimulus switch gap for switching between—versus within—features was performed for the hard-to-easy featural switch (contrasting P→S > P → P† and P→S > S→S†; with the feature fixed in the first and second intervals, respectively) and the easy-to-hard switch (contrasting S→P > S→S† and S→P > P→P†). A direct comparison between P→S and S→P was not made because it would involve contrasting neural activity associated with switching attention to and from acoustic features that were different from each other in both intervals. These contrasts were performed using a pairwise t test across subjects corrected for the familywise error in multiple comparisons using a non-parametric resampling test with spatio-temporal clustering (Maris and Oostenveld 2007; Larson and Lee 2014), treating adjacent time samples and cortical vertices within 5 mm as neighbors. Briefly, this test corrects for multiple comparisons by constructing a null distribution of maximum cluster sizes using exchangeability under the null hypothesis that the (spatio-temporal) data from two conditions are drawn from the same underlying distribution. Under each permutation, (1) the pairwise spatio-temporal difference between the conditions for each subject is randomly sign flipped (or not); (2) a 1-sample t test is performed with a “hat” variance correction of 0.001 (Ridgway et al. 2012); (3) a preliminary threshold of 0.05 is applied; (4) points surviving the threshold are clustered based on t test sign and sufficient spatio-temporal proximity; and (5) the size (sum of absolute value of constituent t values) of the largest cluster is recorded. This procedure was repeated n = 8192 times (to do an exact/resampling test) to form the null distribution of cluster sizes. If any clusters from the veridical distribution were smaller than at most the α = 0.05 proportion of maximal distribution clusters, we rejected the null hypothesis that the data from the two given conditions were not drawn from the same underlying distribution. The spatio-temporal clusters allowing us to reject the null hypothesis, referred to simply as “differentially active clusters,” can be visualized by collapsing across time (coloring vertices by duration active) or spatially (by a weighted sum across vertices, with weights corresponding to duration activity).
The areas involved in the differentially active clusters were quantified by computing the percentage of cluster vertices contained within the 44-label (combined from an original set of 360 labels) version of the Glasser parcellation based on Human Connectome Project data (Glasser et al. 2016). Although a given brain area may have been activated strongly in connection with both tasks in a given contrast, this within-subjects analysis only measured the differences in activity elicited by the two attentional conditions, thereby disregarding overall activation levels in the conditions to reduce potential measurement bias.
Results
Behavioral Results: Target Accuracy
Behavioral performance in the first and second intervals was analyzed using two two-way Greenhouse-Geisser corrected repeated measures ANOVAs, manipulating stimulus type (space or pitch) in the given interval and attentional condition (maintain-attention, switch-within, or switch-between features) (Fig. 2). We found performance differences in the first interval in relation to stimulus type, with performance accuracy better when based on spatial as opposed to pitch cues (F(1,15) = 19.43, P = 0.001, ηp2 = 0.56), but no significant differences by attentional condition (F(1.86,27.88) = 3.37, P = 0.052) and no interaction (F(2,30) = 1.73, P = 0.20). In the second interval, we found a significant effect of stimulus type (F(1,15) = 26.38, P = 0.0001, ηp2 = 0.64) and also attentional condition (F(1.64,24.59) = 8.72, P = 0.001, ηp2 = 0.37), but no interaction (F(1.81,27.17) = 0.990, P = 0.38). Post-hoc t tests of attentional condition in the second interval (Bonferroni corrected) showed a significant difference only between maintain- and switch-within (t(15) = 3.73, P = 0.006) attentional conditions. Maintain versus switch-between (t(15) = 2.42, P = 0.086) and switch-within versus switch-between (t(15) = − 1.91, P = 0.23) contrasts were not significant.
Fig. 2.

Behavioral performance for the first stimulus (Interval 1; left) and the second stimulus (Interval 2; right), grouped by stimulus type during that interval (space or pitch). The maintain-attention conditions are shown with hatched bars; switch-attention (within-feature and between-feature) are shown with plain bars. Note that the y-axis starts at 75 % (to show detail) even though chance level is 25 %, indicating that subjects were in general good at all tasks
We then collapsed behavioral performance across both intervals in order to perform post-hoc tests that more closely mirror the neural contrasts made:
-
i.
P→S versus P→P† (t(15) = 1.16, P = 0.263): Hard-to-easy switch-between features versus switch-within pitch. In this contrast, the first interval—switching away from pitch—is fixed. (See Fig. 3 for differential cortical activation related to this contrast.)
-
ii.
P→S versus S→S† (t(15) = 1.13, P = 0.274): Hard-to-easy switch-between features versus switch-within space. In this contrast, the second interval—switching to space—is fixed. (See Fig. 4 for differential cortical activation related to this contrast.)
-
iii.
S→P versus P→P† (t(15) = 2.05, P = 0.058): Easy-to-hard analog of contrast i above.
-
iv.
S→P versus S→S† (t(15) = 0.64, P = 0.534): Easy-to-hard analog of contrast ii above.
Fig. 3.
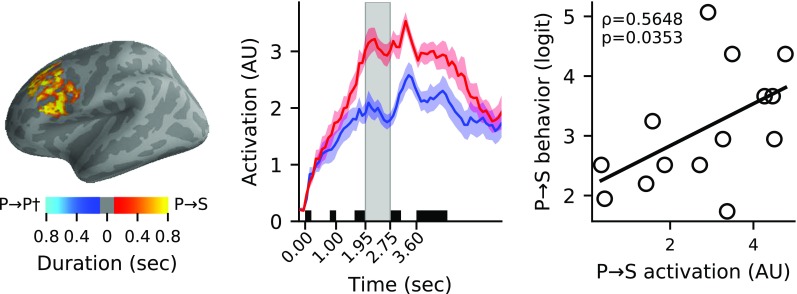
Left: The differentially active left frontal cluster for switch-between vs switch-within-pitch (P→S > P→P†) conditions is shown (P = 0.011), with cluster vertices color-coded by the duration for which they were included in the cluster. Middle: The activation time-courses of the clusters—normalized by dividing by the mean value across time for each subject and averaged together for display (yielding arbitrary units/AU for the axes)—are shown for the P→S (red) and P→P† (blue) conditions (area: ± 1 SEM across subjects). Shaded black boxes represent visual cue and auditory stimulation periods, and the gray box highlights the switch gap period. Right: The time-averaged activation in this cluster was significantly correlated with subject behavioral performance (logit-transformed percent correct across trials) in the P→S condition (P = 0.035, Bonferroni corrected)
Fig. 4.

Left: The differentially active left temporal cluster in the switch-between vs switch-within-space (P→S > S→S†) condition is shown (P = 0.033), with cluster vertices color-coded by the duration for which they were included in the cluster. Middle: The activation time-courses of the clusters—normalized by dividing by the mean value across time for each subject and averaged together for display (yielding arbitrary units/AU for the axes)—are shown for the P→S (red) and P→P† (blue) conditions (area: ± 1 SEM across subjects). Shaded black boxes represent visual cue and auditory stimulation periods, and the gray box highlights the switch gap period
In addition, we separately looked at two more post-hoc tests that v) assess whether there is an asymmetric switch cost in behavioral performance and vi) verify that attend-space is an easier task than attend-pitch, based on the present stimulus parameters:
-
v.
P→S versus S→P (t(15) = 0.56, P = 0.578): Hard-to-easy switch-between features versus easy-to-hard switch-between features.
-
vi.
S→S versus P→P (t(15) = 5.72, P = 0.00004): Maintain-space versus maintain-pitch conditions (i.e., easy versus hard).
Cortical Activity Related to Switching Attention Between Features
We found significant differences in the data distributions of cortical activations during the switch gap associated with the hard-to-easy attention switch between features, i.e., into auditory space from pitch, versus that associated with switching within pitch (P→S > P→P†; permutation test P = 0.011). The differentially active cluster that allowed us to conclude this is shown in Fig. 3, and consisted primarily of vertices in left dorsolateral prefrontal cortex (55.8 %) and inferior frontal cortex (33.3 %), with the remainder in premotor cortex (10.9 %). We then examined how the normalized average activation within this cluster during the switch gap was correlated with subject behavioral performance. A weighted average of activation within the cluster (weighted by duration each vertex was included in the cluster) was taken, and a Spearman rank-order correlation (ρ) across subjects of the time-averaged neural activation with the overall response accuracy (logit transformed percent correct) in each condition was performed. A significant positive correlation was observed for the P→S condition (ρ(12) = 0.57, P = 0.035, Bonferroni corrected) but not the P→P† condition or the differential activation (P > 0.05).
We also found significant differences in the data distributions of cortical activations comparing the hard-to-easy switch from pitch to space and switching within space (P→S > S→S†; permutation test P = 0.033). The differentially active cluster that allowed us to conclude this is shown in Fig. 4, and includes vertices from auditory association cortex (58.5 %), insular and frontal opercular cortex (19.7 %), early auditory cortex (17.5 %), lateral temporal cortex (2.1 %), and the temporo-parietal-occipital junction (2.1 %). No significant correlations between neural activity and behavior were found for P→S, S→S†, or their difference (P > 0.05). Notably, no significant differences in the cortical activation data distributions were observed when comparing the easy-to-hard switch-between condition with either of the switch-within conditions (S→P > S→S† and S→P > P→P†).
Discussion
Neural—but Not Behavioral—Switch Cost Asymmetry Observed
As expected, behavioral switch costs were observed, i.e., target accuracy for speech tokens in the second interval was reduced for trials involving switching attention within feature (e.g., high to low pitch) relative to maintaining attention to the same featural exemplar (high to high pitch). This is consistent with robust evidence reporting switch costs in visual/visuospatial paradigms (reviewed in Monsell 2003; Vandierendonck et al. 2010) and, to a lesser extent, auditory paradigms, with the latter showing costs for switching within acoustic space and within pitch or gender (Koch et al. 2011; Larson and Lee 2013b; Lawo et al. 2014; McCloy et al. 2017). Figure 2 indicates that much of the difference observed herein between switching and maintaining attention was driven by the relatively large performance benefit derived from maintaining attention to the exact same stimulus in each of the two intervals. No significant behavioral switch cost was found when comparing switching attention between features versus maintaining attention, but Fig. 2 suggests that the relationship is in the same direction as the switch cost observed for switching within feature; that is, a performance advantage is gained by repeating the task, primarily when the attended stimuli are identical across intervals, but not (or less so) when attended feature identity or feature valence differ across intervals. Consistent with prior evidence, task performance was better when spatial as opposed to pitch cues were present (Shomstein and Yantis 2006; Lee et al. 2013), confirming that the auditory space-based task was more readily or easily performed with the stimulus parameters tested here.
Performance differences between P→S and S→P attentional conditions—i.e., behavioral switch cost asymmetries—were not observed in the present data. This stands in contrast to previous results showing performance asymmetries (Allport and Wylie 2000; Yeung et al. 2006; Phillip et al. 2007), viz., slower and/or less accurate performance when switching out of a less-automatic or more difficult task condition into one that is easier or prepotent (here, P→S), as opposed to the reverse easy-to-hard switch (here, S→P). Though the precise details are disputed, cognitive models generally suggest that such switch cost asymmetries arise during the course of preparatory task set operations when the tasks employed are of unequal difficulty, and reflect in part an extended timecourse due to “proactive interference,” or persisting priming (differentially negative or positive) of task sets due to prior task instances, which ultimately results in performance decrements for the easier task (see Allport et al. 1994; Allport and Wylie 2000; Gilbert and Shallice 2002; Yeung and Monsell 2003; Yeung et al. 2006). Based on the observed performance advantage for auditory spatial as opposed to pitch-based cues, such models would predict that switching attention from P→S should yield greater behavioral switch costs than S→P; however, no such switch cost asymmetry was observed.
Importantly though, prior evidence suggests that if enough preparatory time is allowed, neurocognitive task set control mechanisms can be mobilized to counteract these disadvantageous priming effects (i.e., to “resolve the proactive interference”) related to switching into the easier task. At longer preparatory cue-stimulus intervals (here analogous to the switch gap between stimulus intervals), switch cost asymmetries have been shown to be eliminated or reversed (Yeung and Monsell 2003; Barton et al. 2006; Mueller et al. 2009). The present lack of observed behavioral switch cost asymmetry is thus unsurprising; by the time the sound stimuli with competing spatial cues were presented in P→S trials, proactive task set mechanisms in play during the relatively long 800 ms switch gap had presumably resolved the circumstances impeding activation of the auditory spatial task set, thereby resulting in improved performance for P→S and eliminating the predicted behavioral switch cost asymmetry.
Lateral Prefrontal Neural Switch Asymmetry Related to Proactive Task Set Mechanisms
Differential cortical activity during the switch gap was observed in relation to switching attention from hard-to-easy tasks based on acoustic features when compared to within-feature switches of equal difficulty with both preceding (P→S > P→P†) and ensuing tasks (P→S > S→S†) fixed. No such differential activity was observed for either of the analogous comparisons related to the easy-to-hard switch between features (S→P > S→S†, S→P > P→P†). We hypothesize that aspects of this “neural switch asymmetry” are related to compensatory proactive task set mechanisms.
Specifically, when comparing preparatory activity related to P→S versus P→P†—a contrast in which the feature the listener is switching attention out of is fixed (here, pitch) but the feature the listener is switching into differs across conditions—differential activity was observed in the dorsolateral prefrontal cortex (DLPFC), inferior frontal junction (IFJ), and premotor cortex. These regions are generally consistent with the areas of activity typically observed in visual or visuo-spatial task switching (reviewed in Kim et al. 2012; Ruge et al. 2013; Phillip et al. 2013; De Baene and Brass 2014), as well as in other auditory task-switching studies (Salmi et al. 2009; Alho et al. 2015). We further observed that the switch gap activity in left lateral prefrontal cortex associated with P→S predicted improved target accuracy performance for P→S, suggesting that preparatory task set mechanisms in left lateral prefrontal cortex compensated for task priming effects that would have been expected to result in P→S performance decrements. This is reinforced by data from fMRI studies that have implicated lateral prefrontal cortex (particularly DLPFC and IFJ) in task set operations (Derrfuss et al. 2005; Stelzel et al. 2011; Kim et al. 2012; De Baene et al. 2012), in particular, resolution of proactive interference (Konishi et al. 2003; Badre and Wagner 2005; reviewed in De Baene and Brass 2014). Consistent with this proposition, Hyafil et al. (2009) manipulated congruency to show that DLPFC responded uniquely (in comparison to other areas) to switch trials in which it was necessary to resolve competition from a previously implemented task set, leading investigators to conclude that DLPFC activity was associated with resolution of proactive interference.
Moreover, a robust literature based on EEG data—which, like the present M-EEG data, is temporally precise and can therefore disambiguate the pre-stimulus signal presumably related to cognitive control mechanisms from stimulus-related activity during or subsequent to stimulus presentation—has identified multiple event-related potential components that index advance task set control processes (reviewed in Karayanidis et al. 2010). These include a posterior positivity/anterior negativity component observed to be correlated with a behavioral reduction in switch costs and potentially generated by left lateral prefrontal sources (Lavric et al. 2008). Consistent with the present results, Mueller et al. (2009) observed a late frontal negativity (LFN) asymmetric switch component only when subjects were preparing to switch to a dominant/easier prosaccade task as opposed to a non-dominant/difficult antisaccade task, and only for trials with relatively long switch gap intervals that showed no behavioral switch cost asymmetry. Mueller and colleagues likewise concluded that the LFN indexes neural mechanisms, presumably related to resolution of proactive interference, that operated to counteract disadvantageous priming effects and thereby eliminate behavioral switch cost asymmetries. Based on the enhanced spatial resolution afforded by M-EEG inverse imaging techniques, the present study was further able to localize the preparatory asymmetric switch activity potentially associated with resolving priming effects specifically to the left lateral prefrontal cortex.
In contrast, when comparing preparatory activity related to P→S versus S→S†, differential pre-stimulus switch activity was observed in left temporal cortex, including auditory-related areas in superior temporal sulcus (STS), and in insular and frontal opercular areas. Because the task that varies in this contrast is the first-interval task involving the feature the listener is switching out of (the second task involving the feature switched into is fixed), it follows that it is switching out of pitch that drives this activation. Lee et al. (2013) previously showed that attending to pitch as opposed to spatial cues in spoken stimuli is associated with differential preparatory activity in STS, suggesting that in the present paradigm, activity in this region may be related to persisting activation of the more difficult pitch-based task set. Note that the activation observed in insular and frontal opercular regions is more posterior than the dorsal anterior insula and inferior frontal opercular areas that are part of a typical cingulo-opercular performance monitoring response (reviewed in Dosenbach et al. 2006, 2008; Power and Petersen 2013; Eckert et al. 2016).
Implications and Future Directions
The results of this study, along with other neural switch asymmetry literature, should serve as a cautionary tale with respect to interpreting results from dual-task paradigms that probe how individuals perform challenging listening tasks. In a classic dual-task paradigm (see Gange et al. 2017 for a review), listeners are often asked to switch their attention between a primary and a secondary task, with the difference in performance of the secondary task between the baseline single-task and the dual-task condition indexing listening effort, based on the theoretical assumption that the total processing resources a person has available to perform tasks are limited in capacity and speed (Kahneman 1973). However, there is no consensus on choosing an appropriate secondary task. As a result, the two tasks employed in a dual-task paradigm are often of unequal difficulty. Therefore, researchers using dual-task paradigms must be cognizant of the effect of switching attention across two tasks that are potentially of unequal difficulty and how switch-cost asymmetry results highlighted in this study could impact interpretations of listening effort.
The findings from the present study show pre-stimulus left lateral prefrontal activity, correlated with task performance, related to hard-to-easy acoustic feature-based task switches. We hypothesize that this activity is reflective of proactive cognitive task control operations. Broadly, we observed that auditory feature-based task switching recruits the frontoparietal network generally observed in visual/visuo-spatial task switching paradigms (Corbetta et al. 2008; Kim et al. 2012). This suggests that cognitive models derived from visually-based paradigms can be productively extended to investigate auditory cognition, here the switching of auditory attention fundamental to active listening. This provides an opportunity to apply the present experimental paradigm and cognitive models to investigate auditory cognitive processing in clinical populations, such as individuals with fetal alcohol spectrum disorder, for whom social communication and active listening are difficult, potentially due to impaired frontoparietal processing (O’Conaill et al. 2015; Ware et al. 2015; Kodali et al. 2017).
Funding Information
This research was supported by National Institutes of Health Grant R01 DC013260 to AKCL.
Compliance with Ethical Standards
Conflict of Interest
The authors declare that they have no conflict of interest.
Footnotes
Publisher’s note
Springer Nature remains neutral with regard to jurisdictional claims in published maps and institutional affiliations.
Contributor Information
Susan A. McLaughlin, Email: smcl@uw.edu
Eric Larson, Email: larsoner@uw.edu.
Adrian K. C. Lee, Phone: 206-616-0102, Email: akclee@uw.edu
References
- Ahveninen J, Huang S, Belliveau JW, Chang W-T, Hämäläinen M. Dynamic oscillatory processes governing cued orienting and allocation of auditory attention. J Cogn Neurosci. 2013;25(11):1926–1943. doi: 10.1162/jocn_a_00452. [DOI] [PMC free article] [PubMed] [Google Scholar]
- Alho K, Salmi J, Koistinen S, Salonen O, Rinne T. Top-down controlled and bottom-up triggered orienting of auditory attention to pitch activate overlapping brain networks. Brain Res. 2015;1626(c):136–145. doi: 10.1016/j.brainres.2014.12.050. [DOI] [PubMed] [Google Scholar]
- Allport A, Wylie G. Task switching, stimulus-response bindings, and negative priming. In: Monsell SS, Diver J, editors. Control of cognitive processes: attention and performance XVIII. Cambridge: MIT Press; 2000. pp. 35–70. [Google Scholar]
- Allport A, Styles EA, Hsieh S. Shifting intentional set: exploring the dynamic control of tasks. In: Umilta C, Moscovitch M, editors. Attention and performance XV: conscious and nonconscious information processing. Cambridge: MIT Press; 1994. pp. 421–452. [Google Scholar]
- Badre D, Wagner AD. Frontal lobe mechanisms that resolve proactive interference. Cereb Cortex. 2005;15(12):2003–2012. doi: 10.1093/cercor/bhi075. [DOI] [PubMed] [Google Scholar]
- Barton JJS, Greenzang C, Hefter R, Edelman J, Manoach DS. Switching, plasticity, and prediction in a saccadic task-switch paradigm. Exp Brain Res. 2006;168:76–87. doi: 10.1007/s00221-005-0091-1. [DOI] [PubMed] [Google Scholar]
- Boersma P, Weenik D. Praat: doing phonetics by computer, version 5.1.05. Amsterdam: University of Amsterdam; 2009. [Google Scholar]
- Brainard DH. The psychophysics toolbox. Spat Vis. 1997;10(4):433–436. [PubMed] [Google Scholar]
- Bronkhorst AW. The cocktail-party problem revisited: early processing and selection of multi-talker speech. Atten Percept Psychophysiol. 2015;77(5):1465–1487. doi: 10.3758/s13414-015-0882-9. [DOI] [PMC free article] [PubMed] [Google Scholar]
- Corbetta M, Patel G, Shulman GL. The reorienting system of the human brain: from environment to theory of mind. Neuron. 2008;58(3):306–324. doi: 10.1016/j.neuron.2008.04.017. [DOI] [PMC free article] [PubMed] [Google Scholar]
- Dale AM, Fischl B, Sereno MI. Cortical surface-based analysis: I. Segmentation and surface reconstruction. NeuroImage. 1999;9(2):179–194. doi: 10.1006/nimg.1998.0395. [DOI] [PubMed] [Google Scholar]
- De Baene W, Brass M. Dissociating strategy-dependent and independent components in task preparation. Neuropsychologia. 2014;62:331–340. doi: 10.1016/j.neuropsychologia.2014.04.015. [DOI] [PubMed] [Google Scholar]
- De Baene W, Albers AM, Brass M. The what and how components of cognitive control. Neuroimage. 2012;63(1):203–211. doi: 10.1016/j.neuroimage.2012.06.050. [DOI] [PubMed] [Google Scholar]
- Derrfuss J, Brass M, Neumann J, von Cramon DY. Involvement of the inferior frontal junction in cognitive control: meta-analyses of switching and Stroop studies. Hum Brain Mapp. 2005;25(1):22–34. doi: 10.1002/hbm.20127. [DOI] [PMC free article] [PubMed] [Google Scholar]
- Dosenbach NUF, Visscher KM, Plamer ED, Miezin FM, Wenger KK, Kang HC, Burgund ED, Grimes AL, Schlagger BL, Petersen SE (2006) A core system for the implementation of task sets. Neuron 50:799–812 [DOI] [PMC free article] [PubMed]
- Dosenbach NUF, Fair DA, Cohen AL, Schlagger BL, Petersen SE (2008) A dual-networks architecture of top-down control. Trens Cogn Sci 12(3):99–105 [DOI] [PMC free article] [PubMed]
- Eckert MA, Teubner-Rhodes S, Vaden KI. Is listening in noise worth it? The neurobiology of speech recognition in challenging listening conditions. Ear Hear. 2016;37(Suppl 1):101S–110S. doi: 10.1097/AUD.0000000000000300. [DOI] [PMC free article] [PubMed] [Google Scholar]
- Fischl B, Sereno MI, Tootell RB, Dale AM. High-resolution intersubject averaging and a coordinate system for the cortical surface. Hum Brain Mapp. 1999;8(4):272–284. doi: 10.1002/(SICI)1097-0193(1999)8:4<272::AID-HBM10>3.0.CO;2-4. [DOI] [PMC free article] [PubMed] [Google Scholar]
- Gange JP, Besser J, Lemke U. Behavioral assessment of listening effort using a dual-task paradigm. Trends Hear. 2017;21:1–25. doi: 10.1177/2331216516687287. [DOI] [PMC free article] [PubMed] [Google Scholar]
- Gilbert SJ, Shallice T. Task switching: a PDP model. Cogn Psychol. 2002;44(3):297–337. doi: 10.1006/cogp.2001.0770. [DOI] [PubMed] [Google Scholar]
- Glasser MF, Coalson TS, Robinson EC, Hacker CD, Harwell J, Yacoub E, Ugurbil K, Andersson J, Beckmann CF, Jenkinson M, Smith SM, Van Essen DC. A multi-modal parcellation of human cerebral cortex. Nature. 2016;536(7615):171–178. doi: 10.1038/nature18933. [DOI] [PMC free article] [PubMed] [Google Scholar]
- Gramfort A, Luessi M, Larson E, Engemann DA, Strohmeier D, Brodbeck C, Goj R, Jas M, Brooks T, Parkkonen L, Hämäläinen M. MEG and EEG data analysis with MNE-python. Front Neurosci. 2013;7:267. doi: 10.3389/fnins.2013.00267. [DOI] [PMC free article] [PubMed] [Google Scholar]
- Gramfort A, Luessi M, Larson E, Engemann DA, Strohmeier D, Brodbeck C, Parkkonen L, Hämäläinen M. MNE software for processing MEG and EEG data. Neuroimage. 2014;86:446–460. doi: 10.1016/j.neuroimage.2013.10.027. [DOI] [PMC free article] [PubMed] [Google Scholar]
- Hämäläinen MS, Ilmoniemi RJ. Interpreting magnetic fields of the brain: minimum norm estimates. Med Biol Eng Comput. 1994;32(1):35–42. doi: 10.1007/BF02512476. [DOI] [PubMed] [Google Scholar]
- Hämäläinen MS, Sarvas J. Realistic conductivity geometry model of the human head for interpretation of neuromagnetic data. IEEE Trans Biomed Eng. 1989;36(2):165–171. doi: 10.1109/10.16463. [DOI] [PubMed] [Google Scholar]
- Hyafil A, Summerfield C, Koechlin E. Two mechanisms for task switching in the prefrontal cortex. J Neurosci. 2009;29(16):5135–5142. doi: 10.1523/JNEUROSCI.2828-08.2009. [DOI] [PMC free article] [PubMed] [Google Scholar]
- Kahneman D. Attention and effort. Englewood Cliffs: Prentice-Hall; 1973. [Google Scholar]
- Karayanidis F, Jamadar S, Ruge H, Phillips N, Heathcote A, Forstmann BU. Advance preparation in task-switching: converging evidence from behavioral, brain activation, and model-based approaches. Front Psychol. 2010;1:1–13. doi: 10.3389/fpsyg.2010.00025. [DOI] [PMC free article] [PubMed] [Google Scholar]
- Kidd G, Jr, Arbogast TL, Mason CR, Gallun FJ. The advantage of knowing where to listen. J Acoust Soc Am. 2005;118(6):3804–3815. doi: 10.1121/1.2109187. [DOI] [PubMed] [Google Scholar]
- Kiesel A, Steinhauser M, Wendt M, Falkenstein M, Jost K, Philipp AM, Koch I. Control and interference in task switching–a review. Psychol Bull. 2010;136(5):849–874. doi: 10.1037/a0019842. [DOI] [PubMed] [Google Scholar]
- Kim C, Cilles SE, Johnson NF, Gold BT. Domain general and domain preferential brain regions associated with different types of task switching: a meta-analysis. Hum Brain Mapp. 2012;33(1):130–142. doi: 10.1002/hbm.21199. [DOI] [PMC free article] [PubMed] [Google Scholar]
- Koch I, Lawo V, Fels J, Vorländer M. Switching in the cocktail party: exploring intentional control of auditory selective attention. J Exp Psychol Hum Percept Perform. 2011;37(4):1140–1147. doi: 10.1037/a0022189. [DOI] [PubMed] [Google Scholar]
- Kodali VN, Jacobson JL, Lindinger NM, Dodge NC, Molteno CD, Meintjes EM, Jacobson SW. Differential recruitment of brain regions during response inhibition in children prenatally exposed to alcohol. Alcohol Clin Exp Res. 2017;41(2):334–344. doi: 10.1111/acer.13307. [DOI] [PMC free article] [PubMed] [Google Scholar]
- Konishi S, Jimura K, Asari T, Miyashita Y. Transient activation of superior prefrontal cortex during inhibition of cognitive set. J Neurosci. 2003;23(21):7776–7782. doi: 10.1523/JNEUROSCI.23-21-07776.2003. [DOI] [PMC free article] [PubMed] [Google Scholar]
- Larson E, Lee AKC. The cortical dynamics underlying effective switching of auditory spatial attention. Neuroimage. 2013;64:365–370. doi: 10.1016/j.neuroimage.2012.09.006. [DOI] [PMC free article] [PubMed] [Google Scholar]
- Larson E, Lee AKC. Influence of preparation time and pitch separation in switching of auditory attention between streams. J Acoust Soc Am. 2013;134(2):EL165–EL171. doi: 10.1121/1.4812439. [DOI] [PMC free article] [PubMed] [Google Scholar]
- Larson E, Lee AKC. Switching auditory attention using spatial and non-spatial features recruits different cortical networks. Neuroimage. 2014;84:681–687. doi: 10.1016/j.neuroimage.2013.09.061. [DOI] [PMC free article] [PubMed] [Google Scholar]
- Lavric A, Mizon GA, Monsell S. Neurophysiological signature of effective anticipatory task-set control: a task-switching investigation. Eur J Neurosci. 2008;28(5):1016–1029. doi: 10.1111/j.1460-9568.2008.06372.x. [DOI] [PubMed] [Google Scholar]
- Lawo V, Fels J, Oberem J, Koch I. Intentional attention switching in dichotic listening: exploring the efficiency of nonspatial and spatial selection. Q J Exp Psychol (Hove) 2014;67(10):2010–2024. doi: 10.1080/17470218.2014.898079. [DOI] [PubMed] [Google Scholar]
- Lee AKC, Larson E, Maddox RK (2012) Mapping cortical dynamics using simultaneous MEG/EEG and anatomically-constrained minimum-norm estimates: an auditory attention example. J Vis Exp (68):e4262. 10.3791/4262 [DOI] [PMC free article] [PubMed]
- Lee AKC, Rajaram S, Xia J, Bharadwaj H, Larson E, Hämäläinen MS, Shinn-Cunningham BG. Auditory selective attention reveals preparatory activity in different cortical regions for selection based on source location and source pitch. Front Neurosci. 2013;6:190. doi: 10.3389/fnins.2012.00190. [DOI] [PMC free article] [PubMed] [Google Scholar]
- Liu H, Tanaka N, Stufflebeam S, Ahlfors S, Hämäläinen M (2010) Functional mapping with simultaneous MEG and EEG. J Vis Exp (40):1668. 10.3791/1668 [DOI] [PMC free article] [PubMed]
- Maris E, Oostenveld R. Nonparametric statistical testing of EEG- and MEG-data. J Neurosci Methods. 2007;164(1):177–190. doi: 10.1016/j.jneumeth.2007.03.024. [DOI] [PubMed] [Google Scholar]
- McCloy DR, Lau BK, Larson E, Pratt KAI, Lee AKC. Pupillometry shows the effort of auditory attention switching. J Acoust Soc Am. 2017;141(4):2440–2451. doi: 10.1121/1.4979340. [DOI] [PMC free article] [PubMed] [Google Scholar]
- Meiran N. Reconfiguration of processing mode prior to task performance. J Exp Psychol Learn Mem Cogn. 1996;22(6):1423–1442. [Google Scholar]
- Meiran N. Task switching: mechanisms underlying rigid vs. flexible self-control. In: Hassin RR, Ochsner KN, Trope Y, editors. Self-control in society, mind, and brain, XII. Oxford: Oxford University Press; 2010. pp. 202–220. [Google Scholar]
- Molins A, Stufflebeam SM, Brown EN, Hämäläinen MS. Quantification of the benefit from integrating MEG and EEG data in minimum L2-norm estimation. Neuroimage. 2008;42(3):1069–1077. doi: 10.1016/j.neuroimage.2008.05.064. [DOI] [PubMed] [Google Scholar]
- Monsell S. Task switching. Trends Cogn Sci. 2003;7(3):134–140. doi: 10.1016/s1364-6613(03)00028-7. [DOI] [PubMed] [Google Scholar]
- Mueller SC, Swainson R, Jackson GM. ERP indices of persisting and current inhibitory control: a study of saccadic task switching. Neuroimage. 2009;45(1):191–197. doi: 10.1016/j.neuroimage.2008.11.019. [DOI] [PubMed] [Google Scholar]
- Nenonen J, Taulu S, Kajola M, Ahonen A. Total information extracted from MEG measurements. Int Congr Ser. 2007;1300:245–248. [Google Scholar]
- O’Conaill CR, Malisza KL, Buss JL, Bolster RB, Clancy C, de Gervai PD, Chudley AE, Longstaffe S. Visual search for feature conjunctions: an fMRI study comparing alcohol-related neurodevelopmental disorder (ARND) to ADHD. J Neurodev Disord. 2015;7(1):10. doi: 10.1186/s11689-015-9106-9. [DOI] [PMC free article] [PubMed] [Google Scholar]
- Oldfield RC. The assessment and analysis of handedness: the Edinburgh inventory. Neuropsychologia. 1971;9:97–113. doi: 10.1016/0028-3932(71)90067-4. [DOI] [PubMed] [Google Scholar]
- Phillip AM, Gade M, Koch I. Inhibitory processes in language switching? Evidence from switching language-defined response sets. Eur J Cogn Psychol. 2007;19:395–416. [Google Scholar]
- Phillip AM, Weidner R, Koch I, Fink GR. Differential roles of inferior frontal and inferior parietal cortex in task switching: evidence from stimulus-categorization switching and response-modality switching. Hum Brain Mapp. 2013;34(8):1910–1920. doi: 10.1002/hbm.22036. [DOI] [PMC free article] [PubMed] [Google Scholar]
- Pichora-Fuller MK, Kramer SE, Eckert MA, Edwards B, Hornsby BWY, Humes LE, Lemke U, Lunner T, Matthen M, Mackersie CL, Naylor G, Phillips NA, Richter M, Rudner M, Sommers MS, Tremblay KL, Wingfield A. Hearing impairment and cognitive energy: the framework for understanding effortful listening (FUEL) Ear Hear. 2016;37(Suppl1):5S–27S. doi: 10.1097/AUD.0000000000000312. [DOI] [PubMed] [Google Scholar]
- Power JD, Petersen SE. Control-related systems in the human brain. Curr Opin Neurobiol. 2013;23(2):223–228. doi: 10.1016/j.conb.2012.12.009. [DOI] [PMC free article] [PubMed] [Google Scholar]
- Ridgway R, Litvak V, Flandin G, Friston KJ, Penny WD. The problem of low variance voxels in statistical parametric mapping; a new hat avoids a 'haircut. Neuroimage. 2012;59(3):2131–2141. doi: 10.1016/j.neuroimage.2011.10.027. [DOI] [PMC free article] [PubMed] [Google Scholar]
- Rogers RD, Monsell S. Costs of a predictable switch between simple cognitive tasks. J Exp Psychol Gen. 1995;124:207–231. [Google Scholar]
- Ruge H, Jamadar S, Zimmermann U, Karayanidis F. The many faces of preparatory control in task switching: reviewing a decade of fMRI research. Hum Brain Mapp. 2013;34(1):12–35. doi: 10.1002/hbm.21420. [DOI] [PMC free article] [PubMed] [Google Scholar]
- Salmi J, Rinne T, Koistinen S, Salonen O, Alho K. Brain networks of bottom-up triggered and top-down controlled shifting of auditory attention. Brain Res. 2009;1286:155–164. doi: 10.1016/j.brainres.2009.06.083. [DOI] [PubMed] [Google Scholar]
- Sharon D, Hämäläinen MS, Tootell RBH, Halgren E, Belliveau JW. The advantage of combining MEG and EEG: comparison to fMRI in focally stimulated visual cortex. Neuroimage. 2007;36(4):1225–1235. doi: 10.1016/j.neuroimage.2007.03.066. [DOI] [PMC free article] [PubMed] [Google Scholar]
- Shinn-Cunningham BG, Kopco N, Martin T. Localizing nearby sound sources in a classroom: binaural room impulse response. J Acoust Soc Am. 2005;117(5):3100–3115. doi: 10.1121/1.1872572. [DOI] [PubMed] [Google Scholar]
- Shinn-Cunningham BG, Best V, Lee AKC. Auditory object formation and selection. In: Middlebrooks JC, Simon JZ, Popper AN, Fay RR, editors. The auditory system at the cocktail party. Berlin: Springer International Publishing; 2017. pp. 7–40. [Google Scholar]
- Shomstein S, Yantis S. Parietal cortex mediates voluntary control of spatial and nonspatial auditory attention. J Neurosci. 2006;26(2):435–439. doi: 10.1523/JNEUROSCI.4408-05.2006. [DOI] [PMC free article] [PubMed] [Google Scholar]
- Stelzel C, Basten U, Fiebach CJ. Functional connectivity separates switching operations in the posterior lateral frontal cortex. J Cogn Neurosci. 2011;23(11):3529–3539. doi: 10.1162/jocn_a_00062. [DOI] [PubMed] [Google Scholar]
- Taulu S, Kajola M. Presentation of electromagnetic multichannel data: the signal space separation method. J Appl Phys. 2005;97:124905. [Google Scholar]
- Uusitalo MA, Ilmoniemi RJ. Signal-space projection method for separating MEG or EEG into components. Med Biol Eng Comput. 1997;35(2):135–140. doi: 10.1007/BF02534144. [DOI] [PubMed] [Google Scholar]
- Vandierendonck A, Liefooghe B, Verbruggen F. Task switching: interplay of reconfiguration and interference control. Psychol Bull. 2010;136(4):601–626. doi: 10.1037/a0019791. [DOI] [PubMed] [Google Scholar]
- Ware AL, Infante MA, O’Brien JW, Tapert SF, Jones KL, Riley EP, Mattson SN. An fMRI study of behavioral response inhibition in adolescents with and without histories of heavy prenatal alcohol exposure. Behav Brain Res. 2015;278:137–146. doi: 10.1016/j.bbr.2014.09.037. [DOI] [PMC free article] [PubMed] [Google Scholar]
- Wylie G, Allport A. Task switching and the measurement of ‘switch costs’. Psychol Res. 2000;63(3–4):212–233. doi: 10.1007/s004269900003. [DOI] [PubMed] [Google Scholar]
- Yeung N, Monsell S. Switching between tasks of unequal familiarity: the role of stimulus-attribute and response-set selection. J Exp Psychol Hum Percept Perform. 2003;29(2):455–469. doi: 10.1037/0096-1523.29.2.455. [DOI] [PubMed] [Google Scholar]
- Yeung N, Nystrom LE, Aronson JA, Cohen JD. Between-task competition and cognitive control in task switching. J Neurosci. 2006;26(5):1429–1438. doi: 10.1523/JNEUROSCI.3109-05.2006. [DOI] [PMC free article] [PubMed] [Google Scholar]