

Abstract
Poor spectral resolution contributes to the difficulties experienced by cochlear implant (CI) users when listening to speech in noise. However, correlations between measures of spectral resolution and speech perception in noise have not always been found to be robust. It may be that the relationship between spectral resolution and speech perception in noise becomes clearer in conditions where the speech and noise are not spectrally matched, so that improved spectral resolution can assist in separating the speech from the masker. To test this prediction, speech intelligibility was measured with noise or tone maskers that were presented either in the same spectral channels as the speech or in interleaved spectral channels. Spectral resolution was estimated via a spectral ripple discrimination task. Results from vocoder simulations in normal-hearing listeners showed increasing differences in speech intelligibility between spectrally overlapped and interleaved maskers as well as improved spectral ripple discrimination with increasing spectral resolution. However, no clear differences were observed in CI users between performance with spectrally interleaved and overlapped maskers, or between tone and noise maskers. The results suggest that spectral resolution in current CIs is too poor to take advantage of the spectral separation produced by spectrally interleaved speech and maskers. Overall, the spectrally interleaved and tonal maskers produce a much larger difference in performance between normal-hearing listeners and CI users than do traditional speech-in-noise measures, and thus provide a more sensitive test of speech perception abilities for current and future implantable devices.
Keywords: masking release, current spread, spectral separation, speech in noise
INTRODUCTION
The cochlear implant (CI) has been an extremely effective auditory solution for many individuals with severe to profound hearing loss (e.g., Zeng et al. 2008). Despite the success of the device, a major challenge for CI users remains the difficulty of understanding speech in the presence of background noise. One factor believed to be critical in limiting CI performance is poor spectral resolution, produced by the limited number of electrodes in the CI array, and by the extensive overlap in the electrical fields produced by neighboring electrodes. The overlap or spread of current means that increasing the number of electrodes does not necessarily increase the effective number of independent frequency channels, and so performance does not generally improve with increasing number of electrodes beyond about eight or ten (Friesen et al. 2001). Studies with normal-hearing (NH) listeners have successfully simulated the effects of current spread by implementing different forms of spectral smearing within noise- or tone-excited envelope vocoder schemes (Fu and Nogaki 2005; Bingabr et al. 2008; Crew et al. 2012; Oxenham and Kreft 2014; Mesnildrey and Macherey 2015; Grange et al. 2017).
Despite the intuitively obvious connection between speech perception in noise and spectral resolution, the relationship between the two measures has not always been clear at the level of individual listeners. Although a number of studies have reported correlations between spectral ripple discrimination thresholds (i.e., the highest spectral ripple rate, in ripples per octave, at which a phase reversal can be detected) and speech perception in quiet (Henry et al. 2005; Anderson et al. 2011; Won et al. 2011; Drennan et al. 2014), results have been more mixed for speech perception in noise, with some studies finding a significant correlation (Won et al. 2011; Jeon et al. 2015; Holden et al. 2016; Zhou 2017) and others not (Anderson et al. 2011). Other measures, involving spectral ripple detection, have often found correlations between the minimum detectable ripple depth and speech perception in noise (Litvak et al. 2007; Saoji et al. 2009; Anderson et al. 2012). However, these correlations tend to be significant at low ripple rates (such as 0.25 or 0.5 ripples per octave, rpo) but not at higher ripple rates (such as 1 or 2 rpo), which is the opposite of what would be expected if spectral resolution, rather than intensity resolution, were limiting speech perception in noise (Anderson et al. 2012). A more recent measure of spectral and/or intensity resolution that is most similar to spectral ripple detection (Azadpour and Mckay 2012) was also found not to be significantly correlated with speech perception in noise. Interestingly, a recent publication by Gifford et al. (2018) found correlations between spectral modulation detection thresholds at 0.5 and 1 rpo and speech perception in both quiet and noise for adult but not pediatric CI users.
One reason for the lack of robust correlations between measures of spectral resolution and speech perception in noise may be the use of noise that is spectrally matched to the speech. Spectral resolution is likely to be most important when the speech and noise are not spectrally matched, so that better spectral resolution can help segregate speech from noise. Recent studies have shown that spectrally separating speech and noise leads to increased speech intelligibility for NH listeners, compared to performance when speech and noise overlap in the frequency domain (Kidd et al. 2005; Apoux and Healy 2010). It is already known that CI users are not able to take as much advantage of spectral gaps in a masker as NH listeners. For instance, Oxenham and Kreft (2014) found that a spectrally sparse masker, consisting of 16 logarithmically spaced pure tones, produced as much speech masking in CI users as a speech-shaped noise with the same overall level and spectral envelope, whereas NH listeners exhibited a large release from masking. These findings suggest that conditions in which the masker and speech do not completely spectrally overlap may provide a more sensitive test of the effects of spectral resolution, and so may provide measures of speech recognition that correlate more closely with measures of spectral resolution than more typical measures of speech perception in spectrally overlapping noise.
The aim of this study was to test the prediction that measures of speech intelligibility in spectrally unmatched noise should be more sensitive to differences in spectral resolution in CI users than traditional speech-in-noise tests. Conditions in which the speech and masker were presented to the same CI electrodes were compared with conditions in which the speech and masker were presented to different (interleaved) electrodes. This same paradigm was also implemented using the virtual channels that were used in the processing schemes of the CI users. Both noise and tones were used as maskers (experiments 1 and 2), and the results were compared to more direct measures of spectral resolution using spectral ripple discrimination (experiment 3). In all cases, the results from CI users were compared with results from NH listeners using tone-excited envelope vocoders to simulate various degrees of current spread (Crew et al. 2012; Oxenham and Kreft 2014).
EXPERIMENT 1: SPEECH PERCEPTION IN SPECTRALLY INTERLEAVED OR OVERLAPPED MASKERS
Methods
Listeners
A total of 13 post-lingually deafened CI users and 24 NH listeners (3 groups of 8 participants) were tested. All participants were native speakers of American English. Individual details for the CI users are provided in Table 1. To take part in the study, CI users were required to obtain at least 40 % of keywords correct in sentences from the IEEE corpus (IEEE 1969) in quiet. The eight CI users who met this criterion are indicated in Table 2. Among the NH listeners tested, 15 were male and 9 were female, with ages ranging from 18 to 32 years. Normal hearing was defined as having pure-tone audiometric thresholds less than 20 dB hearing level (HL) at all octave frequencies between 250 and 8000 Hz with no reported history of hearing disorders. All experimental protocols were approved by the Institutional Review Board of the University of Minnesota, and all listeners provided written informed consent prior to participating.
Table 1.
Individual subject information for CI users
| Subject code | Gender | Age (years) | CI use (years) | Etiology | HL prior to implant (years) | Speech processing strategy |
|---|---|---|---|---|---|---|
| C16 | F | 63 | 16 | Unknown | 1 | MPS |
| D02 | F | 67 | 15 | Unknown | 1 | HiRes Optima-P; ClearVoice MED |
| D10 | F | 63 | 14 | Unknown | 8 | HiRes-S w/Fidelity 120; ClearVoice HIGH |
| D25 | F | 53 | 10 | Meniere’s disease | 33 | HiRes Optima-S;ClearVoice LOW |
| D26 | F | 57 | 8 | Unknown | 11 | HiRes Optima-S; ClearVoice OFF |
| D27 | F | 65 | 7 | Otosclerosis | 13 | HiRes-S w/Fidelity 120; ClearVoice OFF |
| D28 | F | 68 | 14 | Familial progressive SNHL | 7 | HiRes Optima-S; ClearVoice MED |
| D35 | F | 57 | 6 | High fever | ? | HiRes Optima-S; ClearVoice MED |
| D39 | M | 69 | 8 | Unknown | 7 | HiRes Optima-S; ClearVoice MED |
| D41 | F | 68 | 4 | Familial progressive SNHL | 41 | HiRes-S w/Fidelity 120; ClearVoice MED |
| D42 | M | 61 | 3 | Familial progressive SNHL | 2 | HiRes Optima-S; ClearVoice MED |
| D44 | F | 70 | 9 | Familial progressive SNHL | 18 | HiRes Optima-P; ClearVoice HIGH |
| D46 | F | 60 | 4 | Meniere’s disease | 13 | HiRes-S w/Fidelity 120; ClearVoice MED |
| D47 | F | 59 | 4 | Unknown | < 1 | HiRes Optima-P; ClearVoice MED |
| D52 | F | 60 | 14 | High fever | 4 | HiRes Optima-S; ClearVoice MED |
| D55 | F | 58 | 7 | Familial progressive SNHL | ? | HiRes Optima-S; ClearVoice OFF |
Table 2.
Experiments completed by each CI user included in the study
| Subject code | Experiment 1 | Experiment 2 | Experiment 3 |
|---|---|---|---|
| C16 | * | X | |
| D02 | * | X | |
| D10 | X | X | X |
| D25 | X | ||
| D26 | X | X | X |
| D27 | * | X | |
| D28 | X | X | |
| D35 | * | X | |
| D39 | X | X | X |
| D41 | X | X | X |
| D42 | * | X | |
| D44 | X | X | |
| D46 | X | X | |
| D47 | X | X | X |
| D52 | X | ||
| D55 | X |
* = attempted but did not pass screening
X = successfully completed
Stimuli
The speech materials were comprised of sentences taken from the IEEE speech corpus (IEEE 1969), recorded by a single female talker. The sentences were presented in either a noise or tonal masker, or in quiet. The Gaussian noise was spectrally shaped to match the long-term spectrum of the IEEE speech corpus. The tone frequencies were selected to match the center frequencies of the CI electrodes of each individual CI user tested, and the amplitudes were equated in terms of their rms to produce the same output level from each channel of the CIs as the noise masker. The 16 center frequencies from the standard clinical map for Advanced Bionics CIs were used to generate the stimuli for the NH listeners. The center frequencies for the individual CI users and for the standard clinical map are shown in Table 3.
Table 3.
Center frequencies (CFs) of each CI user’s clinical map, as well as those used for the NH listeners that were used for the implementation of the vocoding
| Subject code | 1 | 2 | 3 | 4 | 5 | 6 | 7 | 8 | 9 | 10 | 11 | 12 | 13 | 14 | 15 | 16 |
|---|---|---|---|---|---|---|---|---|---|---|---|---|---|---|---|---|
| All NH | 333 | 455 | 540 | 642 | 762 | 906 | 1076 | 1278 | 1518 | 1803 | 2142 | 2544 | 3022 | 3590 | 4264 | 6665 |
| C16 | 434 | 644 | 954 | 1414 | 2096 | 3108 | 6206 | OFF | NA | NA | NA | NA | NA | NA | NA | NA |
| D02 | 333 | 455 | 540 | 642 | 762 | 906 | 1076 | 1278 | 1518 | 1803 | 2142 | 2544 | 3022 | 3590 | 4264 | 6665 |
| D10 | 333 | 455 | 540 | 642 | 762 | 906 | 1076 | 1278 | 1518 | 1803 | 2142 | 2544 | 3022 | 3590 | 4264 | 6665 |
| D25 | 333 | 455 | 540 | 642 | 762 | 906 | 1076 | 1278 | 1518 | 1803 | 2142 | 2544 | 3022 | 3590 | 4264 | 6665 |
| D26 | OFF | 386 | 463 | 556 | 668 | 804 | 965 | 1160 | 1394 | 1674 | 2012 | 2417 | 2904 | 3490 | 4193 | 6638 |
| D27 | 386 | 463 | 556 | 668 | 804 | 965 | 1160 | 1394 | 1674 | 2012 | 2417 | 2904 | 3490 | 4193 | 6638 | OFF |
| D28 | 333 | 455 | 540 | 642 | 762 | 906 | 1076 | 1278 | 1518 | 1803 | 2142 | 2544 | 3022 | 3590 | 4264 | 6665 |
| D35 | 333 | 455 | 540 | 642 | 762 | 906 | 1076 | 1278 | 1518 | 1803 | 2142 | 2544 | 3022 | 3590 | 4264 | 6665 |
| D39 | 386 | 463 | 556 | 668 | 804 | 965 | 1160 | 1394 | 1674 | 2012 | 2417 | 2904 | 3490 | 4193 | 6638 | OFF |
| D41 | 333 | 455 | 540 | 642 | 762 | 906 | 1076 | 1278 | 1518 | 1803 | 2142 | 2544 | 3022 | 3590 | 4264 | 6665 |
| D42 | 338 | 472 | 576 | 700 | 852 | 1038 | 1264 | 1538 | 1872 | 2280 | 2776 | 3380 | 4114 | 6609 | OFF | OFF |
| D44 | 333 | 455 | 540 | 642 | 762 | 906 | 1076 | 1278 | 1518 | 1803 | 2142 | 2544 | 3022 | 3590 | 4264 | 6665 |
| D46 | 333 | 455 | 540 | 642 | 762 | 906 | 1076 | 1278 | 1518 | 1803 | 2142 | 2544 | 3022 | 3590 | 4264 | 6665 |
| D47 | 333 | 455 | 540 | 642 | 762 | 906 | 1076 | 1278 | 1518 | 1803 | 2142 | 2544 | 3022 | 3590 | 4264 | 6665 |
| D52 | 333 | 455 | 540 | 642 | 762 | 906 | 1076 | 1278 | 1518 | 1803 | 2142 | 2544 | 3022 | 3590 | 4264 | 6665 |
| D55 | 333 | 455 | 540 | 642 | 762 | 906 | 1076 | 1278 | 1518 | 1803 | 2142 | 2544 | 3022 | 3590 | 4264 | 6665 |
The speech and masker were then passed through a tone-excited envelope vocoder (Dorman et al. 1998; Whitmal et al. 2007). The stimulus was divided into 16 frequency subbands (with the exception of those CI users who had fewer than 16 active channels) with cutoff frequencies and center frequencies of each subband made equal to those in the clinical maps of the individual CI users. For the NH listeners, the standard Advanced Bionics clinical map was used to set the subband frequencies (see Table 3). The bandpass filters used to generate the subbands were high-order (947) FIR filters, generated with Matlab’s fir1 function, producing very little overlap between the spectral content of adjacent subbands and a flat frequency response (± 0.05 dB) within the entire passband. The impulse responses from the filters were time-aligned, reaching their peaks at a delay of approximately 20 ms, independent of filter center frequency. Two conditions were generated, one termed “interleaved” and one termed “overlapping.” In the overlapping condition, both the speech and the masker were mixed at the appropriate signal-to-masker ratio (SMR) and then passed through the even-numbered vocoder channels (i.e., 2, 4, … 16), resulting in eight equally spaced frequency subbands (top panel Fig. 1). In the interleaved condition, the speech was passed through the even-numbered channels (as before), but the masker was passed through the odd-numbered channels, resulting in spectral separation between the speech and the masker (bottom panel Fig. 1). In both cases, the temporal envelope from each subband was extracted using a Hilbert transform, and the resulting envelope was lowpass filtered using a fourth-order Butterworth filter with a cutoff frequency of 50 Hz. This cutoff frequency was chosen to reduce possible voicing periodicity cues and to reduce the possibility (for NH listeners) that the vocoder produced spectrally resolved components via the amplitude modulation of the tonal carriers. The resulting temporal envelopes were used to modulate pure-tone carriers with frequencies corresponding to the center frequencies of each channel, which were then presented to the CI users and to the group of eight NH listeners who were assigned to the “no spread” conditions. Electrodograms (generated with software supplied by Advanced Bionics) showing the stimulation applied to each electrode for both the overlapping and interleaved conditions are shown in Fig. 2 using the Optima stimulation strategy and the tone maskers. Since all but one of the CI participants used processing strategies that included some form of current steering (Fidelity 120 or Optima), there was some degree of cross-talk between channels in both conditions. Most cross-talk is observed with the Optima strategy, which has a maximum assignment to one electrode of 75 % of the current (with the other 25 % to the other member of each electrode pair that constitute a virtual channel). The effects of cross-talk (as well as the limited filter resolution) can be seen most clearly in the overlapping condition, where some stimulus can be observed in the odd electrodes, despite no intended stimulation of these electrodes. However, despite some interaction between channels, the electrodograms show that the two configurations resulted in very different stimulation patterns (compare top and bottom panels of Fig. 2). In particular, in the interleaved condition (bottom panel), the speech envelope is observed only in the even channels. In the odd channels, the current level representing the tone maskers is suppressed during the high-amplitude portions of the speech, presumably due to a combination of automatic gain control, compression, and current steering. No attempt was made to simulate this effect in the vocoder. For the other two groups of NH listeners, the effects of current spread were simulated via the vocoder in the same way as in Oxenham and Kreft (2014): each carrier was modulated by the weighted sum of the intensity envelopes from all 16 channels. The weights used in this sum were selected to produce slopes of either 24 dB/oct or 12 dB/oct to simulate different degrees of spectral smearing or current spread.
Fig. 1.
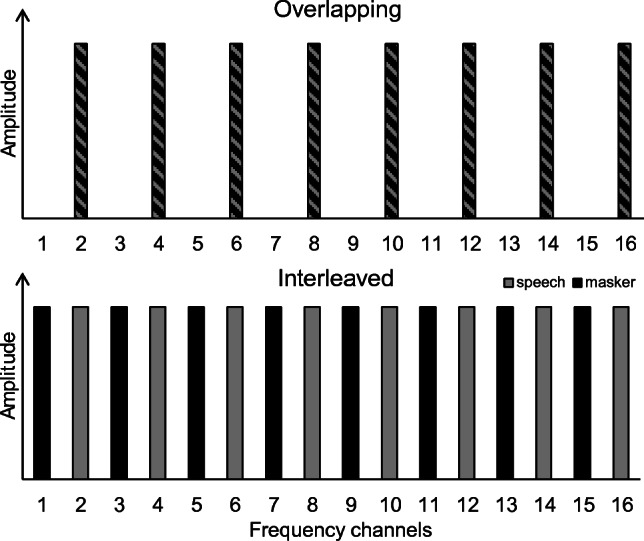
Schematic diagram of the two masker configurations used in experiment 1. The top panel shows the condition in which speech and masker are overlapping in the even channels, and the bottom panel shows the condition in which speech and masker are interleaved with speech in the even channels and masker in the odd channels
Fig. 2.

Electrodograms of the two masker configurations used in the present study. The top panel shows the condition in which speech and masker are overlapping in the even channels, and the bottom panel shows the condition in which speech and masker are interleaved with speech in the even channels and masker in the odd channels. The first sentence of the IEEE corpus and a tone masker with SMR of 5, processed by the Optima strategy, is shown in both panels
The level of the speech after filtering was 51 dB SPL for the CI users and was between 51 and 56 dB SPL for the NH listeners, depending on the degree of spectral smearing, as measured 1 m from the loudspeaker, corresponding to the position of the participant’s head. The masker level was adjusted to produce the desired SMR, referring to the levels of the speech and masker before filtering. The masker was gated on 1 s before the beginning of each sentence and was gated off 1 s after the end of each sentence. The SMRs were selected in advance, based on pilot data, to span a range of performance between 0 and 100 % word recognition for each condition. The resulting range was −15 to 10 dB SMR for the no spread and 24 dB/oct spread NH groups and 0 to 20 dB SMR for the 12 dB/oct spread NH group and for the CI group.
Procedure
The stimuli were generated and processed using MATLAB (The Mathworks, Natick, MA). The sounds were converted via a 24-bit digital-to-analog converter (L22, LynxStudio, Costa Mesa, CA) at a sampling rate of 22,050 Hz, and were presented via an amplifier and a single loudspeaker, placed approximately 1 m from the listener at 0° azimuth and level with the listener’s head. The listeners were seated individually in a double-walled, sound-attenuating booth with approximate interior dimensions of 6′8″ × 7′10″ × 6′6″. Bilateral CI users were instructed to use whichever processor they thought gave them better speech perception and to remove the other processor. One participant with a hearing aid in the ear contralateral to her CI was also instructed to remove it before beginning the experiment. The hearing provided by this contralateral ear without the hearing aid was deemed negligible, as a recent audiogram showed a flat severe sensorineural hearing loss with audiometric thresholds at octave frequencies between 250 and 8000 Hz of between 65 and 75 dB HL. Thus, the speech presented at an overall level of 51 dB SPL was inaudible without the hearing aid.
Listeners responded to sentences by typing what they heard on a computer keyboard. They were encouraged to guess individual words, even if they had not heard or understood the entire sentence. Sentences were scored for keywords correct as a proportion of the total number of keywords presented. Initial scoring was automatic, with each error then checked manually for potential spelling errors. Before the actual experiment took place, listeners were presented with two sentence lists (of ten sentences each) of the HINT speech corpus (Nilsson et al. 1994) to acclimate them to the stimuli before the scored sentences were presented. This procedure was repeated for each new masker type (noise or tone) and configuration (spectrally overlapping or interleaved).
In the actual experiment, two sentence lists of ten sentences each were completed for each combination of masker type, SMR, and configuration (overlapping and interleaved). Each NH listener completed the experiment using one of three simulated spread conditions (no spread, 24 dB/oct spread, or 12 dB/oct spread). The stimuli for CI users were processed using a vocoder with no spread, with the center frequencies of each subband matching the center frequencies of each active channel in their map. The proportions of correct scores were converted to rationalized arcsine units (RAU) (Studebaker 1985) to compensate for possible floor or ceiling effects before statistical analysis.
Results
The mean results from the three NH groups (no spread, 24 dB/oct spread, and 12 dB/oct spread) and the CI group are shown in the separate panels of Fig. 3. The results from tone and noise maskers are denoted by circles and triangles, respectively. The filled symbols represent data from the conditions in which the speech and masker overlapped in the same frequency bands, and the open symbols represent data from conditions in which the speech and masker were presented to different interleaved frequency bands.
Fig. 3.

Speech perception for the CI listeners and the three groups of NH listeners are shown in the four panels. The RAU-transformed proportion of keywords from sentences reported correctly is plotted as a function of signal-to-masker ratio for four different combinations of two maskers (tone and noise) and two spectral configurations (interleaved and overlapped). Note the different ranges of signal-to-masker ratio in the upper and lower panels. Error bars represent ± 1 standard error of the mean between listeners
As expected, increasing the amount of simulated spread in the NH listeners led to poorer speech perception. Also with increasing spread, the difference between the tone and noise maskers became less pronounced. This effect is expected, based on the results of Oxenham and Kreft (2014). They reasoned that the lack of difference at large spread values was due to the effective smoothing of the temporal envelope of the noise masker, due to the overlap between adjacent channels, making the noise masker more tone-like (Oxenham and Kreft 2014). The NH listeners also benefited less from the spectral separation of the speech and masker in the interleaved condition (i.e., difference between the overlapped and interleaved conditions) with increasing spread. For instance, with the no spread NH group, there was a clear separation in performance in conditions with the tone and noise maskers (compare circles and triangles) for all but the highest SMRs, and the difference in performance between the spectrally interleaved and overlapped maskers was very large, reaching a mean difference of about 60 RAU at the lowest SMRs. In contrast, with the 12 dB/oct spread group, performance was much poorer overall (note the different SMRs tested) and was very similar regardless of masker type or spectral overlap. Given the large differences between groups, in terms of pattern of results, the SMRs tested, and overall performance, separate repeated-measures ANOVAs were performed for each group.
For the no spread NH group, a three-way repeated-measures ANOVA on the RAU-transformed proportion of words correctly reported confirmed significant main effects of masker type (tone or noise) [F(1, 7) = 7.8, P = 0.027, partial η2 = 0.528], condition (overlapping vs interleaved) [F(1, 7) = 186, P < 0.001, partial η2 = 0.964], and SMR [F(3, 21) = 290, P < 0.001, partial η2 = 0.997]. There were also interactions between masker type and SMR [F(3, 21) = 5.5, P = 0.006, partial η2 = 0.715], and between condition and SMR [F(3, 21) = 46, P < 0.001, partial η2 = 0.966].
The NH group listening through the vocoder with the 24 dB/oct spread showed a similar pattern of statistical outcomes, with a significant effect of masker type [F(1, 7) = 61.0, P < 0.001, partial η2 = 0.897], condition [F(1, 7) = 174, P < 0.001, partial η2 = 0.961], and SMR [F(3, 21) = 357, P < 0.001, partial η2 = .981]. Results from this group also showed an interaction between condition and SMR [F(3, 21) = 10, P < 0.001, partial η2 = .877]. Although the effect of spectral condition was significant, it was smaller than in the no-spread group, especially at the lower SMRs. For instance, at − 5 dB SMR with the noise masker, the average increase in score from the overlapped to the interleaved condition was about 51 RAU in the no-spread group, whereas it was only 17 RAU in the 24 dB/oct spread group, despite similar levels of performance of both groups in the overlapped condition.
For the NH group listening through the vocoder with 12 dB/oct spread, there were only significant effects of condition [F(1, 7) = 8.8, P = 0.021, partial η2 = 0.556] and SMR [F(4, 28) = 66.6, P < 0.001, partial η2 = 0.982]; the effect of masker type was not significant [F(1, 7) = 0.62, P = 0.456, partial η2 = 0.082]. Similar to the other two NH groups, there was an interaction between condition and SMR [F(4, 28) = 3.7, P = 0.016, partial η2 = 0.690] but in contrast to the other two NH groups, there was also a three-way interaction between masker type, condition, and SMR [F(4, 28) = 3.5, P = 0.019, partial η2 = 0.751]. Again, although the effect of condition reached significance, it was small, with the mean difference rarely exceeding 10 RAU for either the noise or tone maskers.
The results from the eight CI users resemble most closely those of the NH group listening through the vocoder with the 12 dB/oct spread. Despite the apparent similarity of the results from the two groups, the statistical analysis resulted in slightly different outcomes. The same three-way repeated-measures ANOVA performed on the data from the CI users confirmed a significant effect of SMR [F(4, 28) = 76.1, P < 0.001, partial η2 = 0.989], but no significant main effect of masker type [F(1, 7) = 3.9, P = 0.089, partial η2 = 0.358], and no main effect of condition (interleaved vs. overlapped) [F(1, 7) = 0.8, P = 0.401, partial η2 = 0.102]. There was a significant interaction between masker type and SMR [F(4, 28) = 5.1, P = 0.003, partial η2 = 0.903] and between masker type and condition [F(1, 7) = 6.0, P = 0.044, partial η2 = 0.463]. The interactions with masker type presumably reflect the fact that scores with the tone masker appear higher than scores with the noise masker for the interleaved conditions at SMRs of 0 and 5 dB, but only for the overlapped conditions at an SMR of 0 dB.
The effects of the interleaved and overlapped conditions in the different groups can be seen more clearly in Fig. 4, which replots the data from Fig. 3, but with the data from the different groups shown in the same panel. Results using the tone masker are presented in the top panel and results using the noise masker are shown in the bottom panel. Mean data for the no spread, 24 dB/oct spread, 12 dB/oct spread, and CI groups are represented by circles, triangles, squares, and diamonds, respectively. As before, the filled symbols represent data from the overlapped conditions and the open symbols represent data from the interleaved conditions. As noted above, the benefit gained by listeners in the spectrally interleaved conditions decreased with increasing spread in the NH group, and was essentially absent in the CI group.
Fig. 4.

Results from Fig. 3, replotted to facilitate comparisons between the four groups. Performance in conditions with tone maskers are shown in the top panel and performance in conditions with speech-shaped noise maskers are shown in the bottom panel. Open symbols represent interleaved conditions and filled symbols represent overlapping conditions. Error bars represent ± 1 standard error of the mean between listeners
The results in quiet are shown at the right of each panel. Each participant completed two to four lists of ten sentences in the quiet condition to establish a baseline average. The average across trials for each participant was used to calculate a mean for each group, shown at the right of each panel. A between-subjects one-way ANOVA on the performance in quiet showed a significant effect of group [F(1,3) = 13.4, P < 0.001]. Post-hoc contrasts (with Bonferroni correction and six possible contrasts yielding a criterion value, α = 0.05/6 = 0.0083) revealed a significant difference between the 24 dB/oct spread group and the 12 dB/oct spread group (P = 0.001), but not between the no spread and 24 dB/oct spread groups (P = 0.836). The results from the CI group were significantly poorer than those of the no-spread and 24 dB/oct spread groups (P = 0.002 and P = 0.001, respectively) but were not significantly different from those of the 12 dB/oct group (P = 0.154).
Discussion
Benefit of Spectrally Interleaved Maskers
The difference in speech understanding between conditions with overlapped and interleaved maskers can be viewed as spectral masking release. To investigate the relationship between spectral resolution (as manipulated through varying amounts of spread) and spectral masking release, we subtracted speech recognition RAU scores in the spectrally overlapped condition from the RAU scores in the interleaved condition. The upper panels of Fig. 5 show this masking release for each group as a function of SMR. Considering the mean data from each NH group, the expected trend is clear: decreases in spectral resolution by increasing spread, from no spread to 24 dB/oct to 12 dB/oct (open circles, triangles, and squares, respectively), leads to less masking release. This is especially apparent at the lower SMRs, where performance is well below ceiling. As already observed in the raw data, the difference scores for the CI group are generally close to zero, indicating little or no spectral masking release.
Fig. 5.

Speech perception for the CI listeners and the three groups of NH listeners are shown in the four panels. The benefit gained, or difference in RAU-transformed proportion of keywords from sentences reported correctly, is plotted as a function of speech-to-masker ratio. The top two plots show the benefit in speech perception for the interleaved vs overlapping condition, for each masker (tone and noise), respectively. The bottom two plots show the benefit in speech perception for the tone masker over the noise masker, for each condition (interleaved and overlapped), respectively. Results from the no spread, 24 dB/oct spread, 12 dB/oct spread, and CI groups are represented by open circles, triangles, squares, and diamonds. Note the different ranges of speech-to-masker ratio across groups. Error bars represent ±1 standard error of the mean between listeners
Benefit of Tone over Noise Maskers
Earlier studies have found that inherent temporal-envelope fluctuations in steady-state noise can account for a substantial proportion of the masking of speech in NH listeners (Stone et al. 2011, 2012; Stone and Moore 2014). A more recent study found that the same was not true for CI users, who exhibited as much masking with tone maskers that had no inherent fluctuations as they did with noise maskers (Oxenham and Kreft 2014). The difference appeared to be due to the loss of spectral resolution leading to interactions between the temporal envelopes from neighboring channels, which in turn resulted in an effective smoothing of the temporal-envelope fluctuations. If spectral resolution limits the effect of inherent masker fluctuations, then we may expect a relationship between spectral spread and the benefit of tone over noise maskers. This relationship is shown in the lower panels of Fig. 5, where speech scores with the noise masker are subtracted from speech scores with the tone masker.
The results from the no spread and 24 dB/oct NH groups (circles and triangles) show modest benefits of the tone over noise maskers, particularly at the lower SMRs, where performance is well below ceiling. There is also increased benefit for the no-spread group, over the 24 dB/oct spread and 12 dB/oct spread groups, when speech and masker were overlapping. The CI group showed a modest benefit of the tone over the noise masker at lower SMRs in the interleaved condition, but when performance is considered across all conditions, no benefit of tone over noise maskers was observed, consistent with results from an earlier study that used all channels and only spectrally overlapped maskers (Oxenham and Kreft 2014).
EXPERIMENT 2: SPEECH PERCEPTION IN SPECTRALLY INTERLEAVED OR OVERLAPPED MASKERS WITH VIRTUAL CHANNELS
Rationale
All eight CI users from experiment 1 used processing strategies that involved current steering (see Table 1). This implies that although each electrode is assigned to the frequencies listed in Table 3, the virtual channels produced by simultaneous stimulation of adjacent electrodes actually have center frequencies at the midpoints between the listed frequencies. In other words, by stimulating at the electrode frequencies, we were actually stimulating at the corner frequencies of the virtual channels. Theoretically and empirically, our approach seemed most appropriate, in terms of stimulating the actual electrodes present in the device. Nevertheless, it is possible that by bypassing the virtual-channel design of the CIs, we may have inadvertently lost some of the spectral resolution capabilities of the device. For this reason, we repeated critical conditions from experiment 1 with a map that was based on the center frequencies of the virtual channels rather than the electrodes.
Methods
Participants
A total of eight CI users completed this experiment, with five of the eight having also participated in experiment 1 (see Table 2). The other three CI users who completed experiment 1 were not able to return and participate in this experiment, so three different CI users were recruited. As shown in Table 1, the CIs of all eight participants in this experiment used a current steering stimulation strategy. All participants were native speakers of American English. Individual details for the CI users are provided in Table 1.
Stimuli
The speech materials consisted of different lists of sentences from the same IEEE corpus (IEEE 1969) used in experiment 1. The sentences were presented in a noise masker or in quiet. The tone masker from experiment 1 was not included, since the results showed no difference in performance between tone and noise maskers for CI users (see Fig. 3). The Gaussian noise was again spectrally shaped to match the long-term spectrum of the IEEE speech corpus.
The speech and the noise masker were then passed through the same tone-excited envelope vocoder used in experiment 1 (Dorman et al. 1998; Whitmal et al. 2007). In one case, the same channel frequencies were used as in experiment 1; in the other case, the center frequencies of each channel corresponded to the midpoint between the center frequencies of each pair of active electrodes. In this way, the tone frequencies were placed at the center frequencies of virtual channels of each device. For CI users who had all 16 electrodes active in their clinical maps, 15 midpoint center frequencies were calculated and used to create the two different conditions, interleaved and overlapping, tested in experiment 1. In the overlapping condition, both the speech and the masker were mixed at the appropriate SMR before filtering and were then passed through the even-numbered “virtual” channels (i.e., 2, 4, … 14), resulting in seven equally spaced frequency subbands. In the interleaved condition, the speech was passed through the same even-numbered virtual channels, but the noise masker was passed through the odd-numbered virtual channels (i.e., 1, 3, … 15), resulting in spectral separation between the speech and the masker. Electrodograms showing the stimulation applied to each electrode for both conditions (overlapping and interleaved) and channel manipulations (virtual and standard) are shown in Fig. 6 using the Optima stimulation strategy and the noise masker. As expected, the difference between interleaved and overlapping stimulation is much less clear, because all stimuli are presented to all electrodes. However, the fine timing of the electrical pulses are such that, in the interleaved condition, the masker is distributed between half the electrode pairs (i.e., electrodes 1 and 2, 3, and 4, etc.), whereas the speech is distributed between the other half of the electrode pairs (i.e., 2 and 3, 4 and 5, etc.).
Fig. 6.

Electrodograms of the two masker and two channel configurations used in the experiment 2. The top two plots show the condition in which speech and masker are overlapping in the same channels, and the bottom two plots show the condition in which speech and masker are interleaved in alternating channels. The plots on the left show the standard channel configuration in which stimuli is presented to center frequencies of actual electrodes, and the plots on the right show the virtual channel configuration in which stimuli is presented to the midpoint frequency between electrodes. The first sentence of the IEEE corpus and a noise masker with SMR of 5, processed by the Optima strategy, is shown in all plots
The level of the speech after filtering was 51 dB SPL, as measured 1 m from the loudspeaker, corresponding to the position of the participant’s head. The noise level was adjusted to produce the desired SMR, referring to the levels of the speech and noise before filtering. The noise was gated on 1 s before the beginning of each sentence and was gated off 1 s after the end of each sentence. We tested SMRs of 5 and 15 dB and quiet to replicate a representative sample of SMRs used in experiment 1.
Procedure
The stimuli were generated, processed, and presented using the same procedure as in experiment 1. The listeners were seated individually in a single-walled, sound-attenuating booth, with approximate interior dimensions of 6′ × 5′4″ × 6′6″, located in a quiet room. The CI users who had previously participated were instructed to use the same processor they had used in experiment 1 and to remove the other processor (if applicable). The new participants used the CI that they felt gave them better speech perception and were asked to remove the other processor. One participant with a hearing aid in the ear contralateral to her CI was also instructed to remove it before beginning the experiment and insert an ear plug in that ear, to avoid any possible influence of residual hearing.
As in experiment 1, participants were asked to type what they heard and to guess if they were unsure. Scoring was conducted in the same way as in experiment 1 and the percentage of correctly identified keywords was similarly transformed into RAU for statistical analysis.
Results and Discussion
Mean results for the CI users are shown in Fig. 7. The results from virtual and standard channel configurations are denoted by squares and triangles, respectively. The filled symbols represent data from the conditions in which the speech and masker were overlapping in the same frequency bands, and the open symbols represent data from conditions in which the speech and masker were presented to different interleaved frequency bands.
Fig. 7.
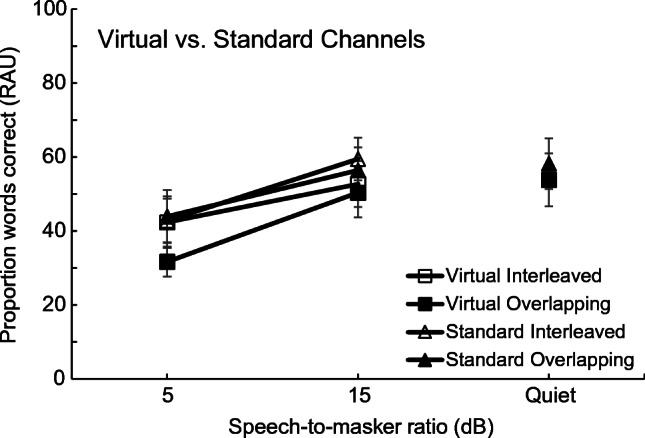
Speech perception for CI listeners is shown. The RAU-transformed proportion of keywords from sentences reported correctly is plotted as a function of signal-to-masker ratio for four different combinations of two channel configurations (virtual and standard) and two spectral configurations (interleaved and overlapped). Error bars represent ± 1 standard error of the mean between listeners
As expected, based on data from experiment 1, results from the interleaved and overlapping conditions were very similar in both the virtual and standard channel configurations. A repeated-measures ANOVA on data from the noise conditions (excluding measurements in quiet) showed a significant main effect of channel configuration (virtual vs. standard) [F(1,7) = 18.01, P = 0.004] and SMR [F(1,7) = 31.76, P = 0.001], but no main effect of condition (interleaved vs. overlapping) [F(1,7) = 4.62, P = 0.069]. Performance with virtual channels was overall poorer than performance using standard channels, which was expected, given that the virtual channel configuration contained only 7 active speech channels, compared to the 8 channels used in the standard channel configuration, in both interleaved and overlapping conditions. Overall performance also decreased with decreasing SMR, as anticipated.
The same ANOVA revealed no significant interactions between channel configuration, condition, or SMR (P > 0.1 in all cases). Since there was no significant benefit to speech perception of the spectrally interleaved masker and no interactions between channel configuration and either condition or SMR (or both), it seems that the results and conclusions from experiment 1 were not substantively affected by the current steering strategies inherent to the CI processors. Overall, the results from this experiment confirm that the methodology used for CI users in experiment 1 was not confounded by the current steering strategies active in the processors of the participants. Based on this finding, all subsequent experiments in this study use only the standard channel configuration, as shown in Table 3.
EXPERIMENT 3: SPECTRAL RIPPLE DISCRIMINATION
Rationale
Simulated decreases in spectral resolution led to decreased speech intelligibility, decreased difference between tone and noise maskers, and decreased release from masking when the masker was spectrally interleaved rather than overlapping with the target speech. In this experiment, we provided a direct measure of spectral resolution by measuring thresholds for spectral ripple discrimination in the CI users, as well as in the NH listeners through the same vocoders that were used in experiment 1. Spectral ripples have been used to measure auditory spectral resolution for several decades (Wilson and Evans 1971; Houtgast 1977; Supin et al. 1994; Henry and Turner 2003; Anderson et al. 2012). Spectral ripple discrimination provides a rapid estimate of spectral resolution, which has been shown to correlate well with the more time-consuming psychophysical spatial tuning curves in CI users, when targeting the same spectral region (Anderson et al. 2011). Its estimates also match well with those from spectral ripple detection thresholds at comparable ripple rates, without being susceptible to the same temporal-envelope confounds at high ripple rates (Anderson et al. 2012). Thus, it remains a relatively well-validated measure of spectral resolution in both acoustic and electric hearing.
Methods
Participants
The same 13 CI users who completed the screening for experiment 1 also took part in this experiment (see Table 2). The same 24 NH listeners were tested in conditions corresponding to their assigned groups from experiment 1 (no spread, 24 dB/oct spread, and 12 dB/oct spread).
Stimuli
Spectrally rippled noise was generated using MATLAB (Mathworks, Natick, MA). Gaussian broadband (350–5600 Hz) noise was spectrally modulated, with sinusoidal variations in level (dB) on a log-frequency axis (as in Litvak et al. 2007) using the equation:
Where X(f) is the amplitude at frequency f (in Hz), D is the spectral depth or peak-to-valley ratio (in dB), L is the lower cut-off frequency of the noise pass band (350 Hz in this case), fs is the spectral modulation frequency (in ripples per octave), and θ is the starting phase of the ripple function. Logarithmic frequency and intensity units were used as these are generally considered to be more perceptually relevant than linear units. Sinusoidal modulation was used, as this lends itself to linear systems analysis and has been used in a number of studies of spectral modulation perception in normal (acoustic) hearing (Eddins and Bero 2007; Saoji and Eddins 2007). The peak-to-valley ratio of the stimuli was held constant at 30 dB. This large peak-to-valley ratio provides a large spectral contrast in the stimulus, so that perceptual performance is most likely to be determined by the spectral resolution of the listener, just as the “notched-noise” method (Patterson 1976; Glasberg and Moore 1990) uses an “infinite” peak-to-valley ratio between the passband and stopband of the noise to probe frequency selectivity. The stimulus duration was 400 ms, including 20-ms raised-cosine onset and offset ramps. For NH listeners, the stimulus was either left unaltered or was passed through one of the same tone-excited envelope vocoders used in experiment 1, with 16 frequency channels that had effectively no spectral spread, or that produced spectral spread equivalent to 24 or 12 dB/oct. The CI users were presented with the stimulus unaltered in one condition and passed through the same vocoder, without spread, in another condition.
The stimuli were presented using the same setup as in experiment 1, via a loudspeaker positioned at approximately head height and about 1 m from the participant in a double-walled, sound-attenuating booth. The average sound level of the noise was set to 60 dBA when measured at the location corresponding to the participant’s head. In order to reduce any possible cues related to loudness, the noise level was roved across intervals within each trial by ± 3 dB. The starting phase of the spectral modulation was selected at random with uniform distribution for each trial to reduce the potential for any consistent local intensity cues that fixed-phase stimuli might create.
Procedure
Bilateral CI users were instructed to use the same processor they chose to use in experiment 1 (or in the screening for experiment 1 if they failed to meet the speech perception requirements) and to remove the other processor. As in experiment 1, one participant with a hearing aid in the ear contralateral to her CI was asked to remove it before beginning the experiment. All CI users were asked to use processor settings (volume, sensitivity, program) typical of everyday use. A three-interval, three-alternative forced-choice procedure was used. All three intervals contained spectrally rippled noise. In each trial, two intervals contained spectral ripples that had the same starting phase (selected at random from a uniform distribution on each trial), and in the remaining interval the phase of the ripple was reversed (180° phase shift). The order of the three intervals (two same, one reversed) was randomized on every trial. Listeners were instructed to select the interval that sounded different from the other two. Correct-answer feedback was provided after each trial. The first trial of each run started at a ripple rate of 0.25 ripples per octave (rpo), corresponding to a single ripple across the 4-octave passband. In each successive trial, the ripple rate was varied adaptively using a 2-up, 1-down rule, with rpo initially increasing (following two consecutive correct responses) or decreasing (following every incorrect response) by a factor of 1.41. After the first two reversals, the step size changed to a factor of 1.19 and decreased again to a factor of 1.09 after two more reversals. Each run was considered complete after a total of ten reversals, and the geometric mean ripple rate at the last six reversal points were used to determine the threshold. The adaptive procedure allowed for ripple rates below 0.25 rpo, but such low rates were never needed by the participants. Each CI user completed six runs under non-vocoded conditions and six runs using a vocoder without any additional spread (same as the no-spread NH group). Each NH listener completed six runs under non-vocoded conditions and six runs in their respective vocoded condition (depending on the group to which they were assigned). In each condition, the first two runs for each participant were considered practice, and the last four thresholds were used to compute a geometric mean threshold for each individual participant.
Results and Discussion
Individual thresholds for the 13 CI users, and mean thresholds for all groups from experiment 1 (NH and CI) are shown in Fig. 8. Thresholds for individual CI users are represented by gray bars and group averages are shown in black. The pattern of thresholds using the unprocessed stimuli were similar, but somewhat higher overall [mean of 1.9 vs. 1.4 ripples/oct; paired t test: t(12) = 3.76, P = 0.003]. Individual gray bars with a diagonal pattern represent CI users who did not have speech perception scores high enough to participate in experiment 1. Error bars represent one standard deviation (not standard error) of the mean of the group averages to provide a sense of the spread of the individual thresholds.
Fig. 8.

Individual spectral ripple discrimination thresholds for the CI users, along with mean thresholds for the CI group and the three NH groups. The gray bars represent individual ripple discrimination thresholds for CI users. Those with diagonal shading represent CI users who did not achieve high enough speech performance to participate in experiment 1. The black bars represent mean ripple discrimination thresholds for each group tested in experiment 1. Error bars represent 1 standard deviation above the mean between listeners for each group tested in experiment 1
Interestingly, CI users who had speech perception scores too poor to be included in experiment 1 did not have noticeably poorer spectral ripple thresholds when compared to the CI users who were included. A two-sample t test (equal variances assumed) found no significant difference in the mean ripple rate at threshold between the two groups [t(11) = 0.97, P = 0.104].
To confirm the apparent differences between the groups, a between-subjects one-way ANOVA was conducted on the log-transformed ripple thresholds with the CI group that completed the speech experiment and the three normal-hearing groups under vocoded conditions. There was a significant effect of group [F(3,28) = 17.6, P < 0.001]. Contrast analysis (with Bonferroni correction and six possible contrasts yielding a criterion value, α = 0.05/6 = 0.0083) revealed that the mean threshold for the CI group was significantly different from that of the no-spread (P < 0.001) groups but not significantly different from that of the 24 dB/oct spread group (P = 0.156) or the 12 dB/oct spread group (P = 0.016). Considering only the NH groups, a separate ANOVA revealed a significant linear trend (P < 0.001), confirming the systematic improvement in thresholds as spectral resolution improved from 12 to 24 dB/oct to the no-spread condition.
Finally, to determine the extent to which ripple discrimination thresholds reflect underlying spectral resolution, the performance of the NH group in the no spread condition was compared with that expected from ideal analysis. With 16 channels, logarithmically spaced from 333 to 6665 Hz (4.3 octaves), each filter has a bandwidth of 0.27 octaves. Ripples should no longer be reliably discriminable when the ripple period (1/ripple rate) is less than or equal to the filter bandwidth, or when the ripple rate is 1/0.27 or 3.7 ripples per octave. As can be seen in our data, the no-spread condition has a mean threshold of 3.73 ripples per octave, which corresponds well to the theoretically predicted threshold of 3.7 ripples per octave. In summary, the ripple discrimination measure appears to provide an accurate assessment of underlying spectral resolution, at least in the NH groups.
COMPARING SPEECH PERCEPTION AND SPECTRAL RESOLUTION
As outlined in the introduction, our prediction was that speech perception should be related to spectral resolution, and that the relationship between speech perception in noise and spectral resolution should be stronger when the speech and noise are not spectrally matched (e.g., when they are spectrally interleaved). This section considers the various hypothesized relationships in light of the current data.
Speech Perception in Quiet and Ripple Discrimination Thresholds
The relationship between spectral resolution and speech perception in quiet can be seen in Fig. 4. The RAU-transformed proportion of keywords reported correctly in quiet are shown on the far right of the panels in Fig. 4. As expected, speech perception improved for the NH listeners as the spectral spread was reduced from 12 to 24 dB/oct, but there was no further improvement between the 24 dB/oct condition and the no spread condition. In contrast, spectral ripple discrimination thresholds improved steadily from the 12 dB/oct through the 24-dB/oct to the no spread condition (Fig. 8). Thus, speech perception in quiet appeared to reach a plateau in performance in the 24 dB/oct condition, whereas spectral ripple discrimination continued to improve. This outcome is consistent with earlier studies showing that relatively few independent spectral channels are required for speech perception in quiet (e.g., Shannon et al. 1995). However, the fact that performance was still well below perfect (less than 85 RAU) suggests that was not solely a ceiling effect, and may reflect unfamiliarity with vocoded stimuli.
Masked Speech Perception with Spectrally Overlapped and Interleaved Maskers
Summary speech recognition scores with spectrally matched (overlapped) maskers are represented by filled symbols in Fig. 4. The data from the three NH groups showed improved speech perception as spectral resolution was increased by reducing spread from 12 to 24 dB/oct, but no further improvement was observed as the spread was reduced from 24 dB/oct to no spread for either the tone or noise maskers, in line with the results in quiet.
Speech recognition scores for spectrally interleaved maskers are represented by open symbols in Fig. 4. Considering the mean data from the three NH groups, a lawful relationship can be observed, which appears stronger than that found for the spectrally overlapped maskers. In particular, speech perception continued to improve with increased spectral resolution from 12 to 24 dB/oct to the no spread condition. Considering just the three NH groups at a common SMR of 0 dB, a between-subjects, one-way ANOVA showed a significant interaction [F(2,21) = 9.9, P = 0.001] between condition (interleaved vs overlapping) and the amount of spread (no spread, 24 dB/oct spread, and 12 dB/oct spread), confirming that speech perception was more strongly affected by the amount of spread used in the NH vocoder simulations in the interleaved than in the overlapped conditions.
For CI users, the results were very similar for the overlapped and interleaved conditions (Fig. 4), mirroring speech perception results for the 12 dB/oct spread NH group. This lack of benefit of spectral separation is somewhat unexpected, given that ripple discrimination thresholds for CI users were comparable to those of the 24 dB/oct spread NH group, which saw a marked improvement in speech perception in the interleaved over the overlapped condition.
DISCUSSION
Spectral Resolution and Spectral Release from Masking
The aim of this study was to test whether speech perception in spectrally unmatched maskers (in this case interleaved maskers) would provide a more sensitive test of spectral resolution than the more traditional tests of speech perception in spectrally matched maskers. This hypothesis was supported by the results from the NH listeners under the different vocoder conditions. For instance, as shown most clearly in Fig. 4, changing from the 24-dB/oct spread to the no-spread condition produced essentially no change in performance in the overlapped conditions (compare filled circles and triangles), but resulted in a substantial improvement in performance in the interleaved conditions (compare open circles and triangles), suggesting that the interleaved conditions were more sensitive to changes in spectral resolution. Stated another way, changing from the overlapped to the interleaved masker configuration resulted in a much smaller spectral release from masking with 24 dB/oct slopes than in the no spread condition. The trend continued, with the 12 dB/oct slopes showing even less spectral masking release. Because spectral ripple discrimination thresholds showed the same trend of improvement with increasing spectral resolution, there was a strong relationship between the amount of spectral masking release and spectral ripple discrimination, when observed at a group level.
The speech perception results from the CI users most closely resembled those of the NH listeners in the 12 dB/oct spread condition, with little or no spectral release from masking on average. Therefore, although spectrally interleaved maskers provide a more sensitive measure of spectral resolution overall, the spectral resolution observed with current CI users appears to be too poor to take advantage of the interleaving. Thus, a key hypothesis of our study, that spectrally unmatched maskers would provide a more sensitive test of spectral resolution in CI users, was not supported. It is possible that greater physical separation between speech and masker channels (by, for instance, stimulating only every third or fourth electrode with speech) would lead to larger effects of interleaving; however, this approach would also further decrease the number of active speech channels and thus further degrade overall performance.
Spectral Ripple Discrimination as a Measure of Spectral Resolution
Spectral ripple discrimination has been used as a measure of spectral resolution for several decades, and the current results support its use, by showing that spectral ripple discrimination thresholds in the NH groups decrease with progressively decreasing spectral resolution from the no spread to the 24 dB/oct and to 12 dB/oct spread conditions. There has been some consideration of the potential perceptual cues associated with detection a change in the spectral ripple phase. For instance, Anderson et al. (2011) tested whether the spectral edge of the stimulus could provide an additional cue, and found no significant difference in thresholds with spectrally smoothed edges. Introspection suggests that it involves a timbral cue similar to brightness, as a change in the spectral centroid may occur, which may also be perceived as pitch (Allen and Oxenham 2014). Regardless of the particular cue, any change that is discriminable suggests that at least one place along the cochlear partition responds differently to the two stimuli, which in turn suggests that the stimuli can be spectrally distinguished or resolved to some extent. Note, of course, that the detection of a change in ripple phase does not imply a full reconstruction of the ripple, which would require spatial sampling at a density that exceeds twice the maximum ripple rate. Consequently, ripple discrimination thresholds may not directly reflect the spectral resolution needed to perceive speech, since speech covers a wide range of frequencies. Thus, as suggested by Anderson et al. (2011), broadband spectral ripple discrimination likely reflects the best spectral resolution found within the cochlea, whereas speech perception is more likely to reflect an aggregate of resolution along the length of the cochlea.
There was also considerable individual variability in thresholds among the NH listeners, as shown by the between-subjects standard deviations in Fig. 8, despite the fact that the spectral resolution was held constant within each group of NH listeners. As with spectral ripple detection thresholds (Anderson et al. 2011), and spectrotemporal ripple detection or discrimination thresholds (Aronoff and Landsberger 2013; Bernstein et al. 2013), spectral ripple discrimination thresholds depend not only on spectral resolution but also on intensity resolution, or the ability to detect intensity differences between channels after filtering (Anderson et al. 2012). The potential conflating of spectral resolution with “detection efficiency” in such measures has also been pointed out for earlier measures of spectral resolution, such as the critical ratio (Patterson et al. 1982). Thus, some of the variability between NH listeners, as well as between CI users, may reflect differences in intensity processing rather than spectral resolution (Azadpour and Mckay 2012). Because the individual differences between NH listeners are of a similar magnitude as the individual differences between CI users, our results suggest that differences in ripple discrimination thresholds between CI users are unlikely to be due solely to differences in spectral resolution.
Individual Differences in CI Users and NH Listeners
Many studies have noted high levels of inter-individual variability in CI users when performing speech tasks (e.g., Henry and Turner 2003; Fu and Nogaki 2005; Fu et al. 2013). Indeed, much effort has gone into attempts to account for individual differences in terms of perceptual and physiological measures of factors such as spectral resolution (affected by the electrode-neural interface) and neural survival. However, few studies have considered the variance within the NH population when performing equally challenging auditory tasks.
In the speech perception tasks, our results appear to support this emphasis on individual variability within the CI population. Inspection of Fig. 3 reveals generally larger between-subjects variability in the CI group than in any of the NH groups. To quantify this difference, the mean estimated variance from each of the conditions was pooled across all conditions. The mean variance in the CI group was 543.8, compared with 196.8, 55.2, and 116.9 in the NH groups with the no spread, 24 dB/oct spread, and 12 dB/oct spread, respectively. Thus, the variance of the CI was considerably larger. However, because our CI group was also considerably older on average than our NH groups, we cannot rule out the possibility that the larger variance in the CI group was due to age, rather than anything specific to CI processing (Landsberger et al. 2017).
In contrast, the between-subject variance in the spectral ripple discrimination task was similar across all four groups, as indicated by the similar size of the error bars in Fig. 8. This outcome is particularly surprising, as differences in spectral resolution between individual CI users have been postulated to play an important role in predicting speech perception in quiet and in noise (Henry and Turner 2003; Henry et al. 2005; Won et al. 2007). Yet in the three NH groups, the spectral resolution of listeners within each of the NH groups was held constant via the vocoder signal processing, but the amount of between-subject variability was similar to that found among the CI users.
Another interesting outcome is that the inter-individual variability is similar across the CI and NH groups in the differences between various speech perception measures. For instance, as shown by the error bars in Fig. 5, variability in the benefit of interleaved over overlapped maskers (upper plots), or in the benefit of tone over noise maskers (lower plots), is again quite similar between the groups. This observation suggests it is unlikely that physiological factors, such as differences in effective current spread or neural survival, dominate individual differences in measures such as speech masking release in CI users. Further research with groups that are matched for age and cognitive function will be required to determine the extent to which inter-individual variability in CI users is quantitatively different from that observed in the NH population.
CONCLUSIONS
Speech perception in spectrally overlapped and interleaved tone or noise maskers was measured in CI users, and the results were compared with those from NH participants listening through tone-excited vocoders designed to simulate various degrees of current spread or channel interaction. The main findings can be summarized as follows:
In the NH groups, decreasing spectral resolution led to decreasing speech perception in quiet and in the presence of maskers. The effect of decreased spectral resolution was greater for the spectrally interleaved maskers than for the spectrally overlapped maskers, resulting in increased spectral masking release with increased spectral resolution.
The CI users on average showed little or no spectral masking release from the spectrally interleaved maskers, similar to the findings from the NH group with the simulated 12 dB/oct spectral spread. This outcome was not affected by whether the frequency channels were selected based on the frequencies allocated to each electrode or on the processors’ virtual channel center frequencies, based on the CI’s current-steering algorithms.
Spectrally interleaved and tonal maskers provide greater sensitivity to improvements in spectral resolution than do spectrally matched noise maskers. Although the resolution of current CIs is not sufficient to take advantage of this sensitivity, such measures may be useful in testing future generations of CIs, as well as testing listeners with hearing loss, whose spectral resolution may be intermediate to that of normal-hearing listeners and CI users.
Acknowledgments
This research was supported by NIDCD Grant R01 DC012262. The authors wish to extend special thanks to the participants in this study.
Compliance with Ethical Standards
Conflict of Interest
The authors declare that they have no conflict of interest.
Contributor Information
Erin R. O’Neill, Email: oneil554@umn.edu
Heather A. Kreft, Email: plumx002@umn.edu
Andrew J. Oxenham, Email: oxenham@umn.edu
References
- Allen EJ, Oxenham AJ. Symmetric interactions and interference between pitch and timbre. J Acoust Soc Am. 2014;135:1371–1379. doi: 10.1121/1.4863269. [DOI] [PMC free article] [PubMed] [Google Scholar]
- Anderson ES, Nelson DA, Kreft H, Nelson PB, Oxenham AJ. Comparing spatial tuning curves, spectral ripple resolution, and speech perception in cochlear implant users. J Acoust Soc Am. 2011;130:364–375. doi: 10.1121/1.3589255. [DOI] [PMC free article] [PubMed] [Google Scholar]
- Anderson ES, Oxenham AJ, Nelson PB, Nelson DA. Assessing the role of spectral and intensity cues in spectral ripple detection and discrimination in cochlear-implant users. J Acoust Soc Am. 2012;132:3925–3934. doi: 10.1121/1.4763999. [DOI] [PMC free article] [PubMed] [Google Scholar]
- Apoux F, Healy EW. Relative contribution of off- and on-frequency spectral components of background noise to the masking of unprocessed and vocoded speech. J Acoust Soc Am. 2010;128:2075–2084. doi: 10.1121/1.3478845. [DOI] [PMC free article] [PubMed] [Google Scholar]
- Aronoff JM, Landsberger DM. The development of a modified spectral ripple test. J Acoust Soc Am. 2013;134:EL217–EL222. doi: 10.1121/1.4813802. [DOI] [PMC free article] [PubMed] [Google Scholar]
- Azadpour M, Mckay CM. A psychophysical method for measuring spatial resolution in Cochlear implants. J Assoc Res Otolaryngol. 2012;13:14–157. doi: 10.1007/s10162-011-0294-z. [DOI] [PMC free article] [PubMed] [Google Scholar]
- Bernstein JGW, Mehraei G, Shamma S, Gallun FJ, Theodoroff SM, Leek MR. Spectrotemporal modulation sensitivity as a predictor of speech intelligibility for hearing-impaired listeners. J Am Acad Audiol. 2013;24:293–306. doi: 10.3766/jaaa.24.4.5. [DOI] [PMC free article] [PubMed] [Google Scholar]
- Bingabr M, Espinoza-Varas B, Loizou PC. Simulating the effect of spread of excitation in cochlear implants. Hear Res. 2008;241:73–79. doi: 10.1016/j.heares.2008.04.012. [DOI] [PMC free article] [PubMed] [Google Scholar]
- Crew JD, Galvin JJ, Fu QJ. Channel interaction limits melodic pitch perception in simulated cochlear implants. J Acoust Soc Am. 2012;132:EL429–EL435. doi: 10.1121/1.4758770. [DOI] [PMC free article] [PubMed] [Google Scholar]
- Dorman MF, Loizou PC, Fitzke J, Tu Z. The recognition of sentences in noise by normal-hearing listeners using simulations of cochlear-implant signal processors with 6-20 channels. J Acoust Soc Am. 1998;104:3583–3585. doi: 10.1121/1.423940. [DOI] [PubMed] [Google Scholar]
- Drennan WR, Anderson ES, Won JH, Rubinstein JT. Validation of a clinical assessment of spectral-ripple resolution for cochlear implant users. Ear Hear. 2014;35:e92–e98. doi: 10.1097/AUD.0000000000000009. [DOI] [PMC free article] [PubMed] [Google Scholar]
- Eddins DA, Bero EM. Spectral modulation detection as a function of modulation frequency, carrier bandwidth, and carrier frequency region. J Acoust Soc Am. 2007;121:363–372. doi: 10.1121/1.2382347. [DOI] [PubMed] [Google Scholar]
- Friesen LM, Shannon RV, Baskent D, Wang X. Speech recognition in noise as a function of the number of spectral channels: comparison of acoustic hearing and cochlear implants. J Acoust Soc Am. 2001;110:1150–1163. doi: 10.1121/1.1381538. [DOI] [PubMed] [Google Scholar]
- Fu QJ, Nogaki G. Noise susceptibility of cochlear implant users: the role of spectral resolution and smearing. J Assoc Res Otolaryngol. 2005;6:19–27. doi: 10.1007/s10162-004-5024-3. [DOI] [PMC free article] [PubMed] [Google Scholar]
- Fu QJ, Shannon RV, Wang X. Effects of noise and spectral resolution on vowel and consonant recognition: acoustic and electric hearing. J Acoust Soc Am. 2013;104:3586–3596. doi: 10.1121/1.423941. [DOI] [PubMed] [Google Scholar]
- Gifford RH, Noble JH, Camarata SM, et al. The relationship between spectral modulation detection and speech recognition: adult versus pediatric cochlear implant recipients. Trends Hear. 2018;22:1–14. doi: 10.1177/2331216518771176. [DOI] [PMC free article] [PubMed] [Google Scholar]
- Glasberg BR, Moore BCJ. Derivation of auditory filter shapes from notched-noise data. Hear Res. 1990;47:103–138. doi: 10.1016/0378-5955(90)90170-t. [DOI] [PubMed] [Google Scholar]
- Grange JA, Culling JF, Harris NSL, Bergfeld S. Cochlear implant simulator with independent representation of the full spiral ganglion. J Acoust Soc Am. 2017;142:484–489. doi: 10.1121/1.5009602. [DOI] [PubMed] [Google Scholar]
- Henry BA, Turner CW. The resolution of complex spectral patterns by cochlear implant and normal-hearing listeners. J Acoust Soc Am. 2003;113:2861–2873. doi: 10.1121/1.1561900. [DOI] [PubMed] [Google Scholar]
- Henry BA, Turner CW, Behrens A. Spectral peak resolution and speech recognition in quiet: normal hearing, hearing impaired, and cochlear implant listeners. J Acoust Soc Am. 2005;118:1111–1121. doi: 10.1121/1.1944567. [DOI] [PubMed] [Google Scholar]
- Holden LK, Firszt JB, Reeder RM, Uchanski RM, Dwyer NY, Holden TA. Factors affecting outcomes in cochlear implant recipients implanted with a perimodiolar electrode array located in scala tympani. Otol Neurotol. 2016;37:1662–1668. doi: 10.1097/MAO.0000000000001241. [DOI] [PMC free article] [PubMed] [Google Scholar]
- Houtgast T. Auditory-filter characteristics derived from direct-masking data and pulsation-threshold data with a rippled-noise masker. J Acoust Soc Am. 1977;62:409–415. doi: 10.1121/1.381541. [DOI] [PubMed] [Google Scholar]
- IEEE IEEE recommended practices for speech quality measurements. IEEE Trans Audio Electroacoust. 1969;17:227–246. [Google Scholar]
- Jeon EK, Turner CW, Karsten SA, Henry BA, Gantz BJ. Cochlear implant users’ spectral ripple resolution. J Acoust Soc Am. 2015;138:2350–2358. doi: 10.1121/1.4932020. [DOI] [PMC free article] [PubMed] [Google Scholar]
- Kidd G, Jr, Mason CR, Gallun FJ. Combining energetic and informational masking for speech identification. J Acoust Soc Am. 2005;118:982–992. doi: 10.1121/1.1953167. [DOI] [PubMed] [Google Scholar]
- Landsberger DM, Padilla M, Martinez AS, Eisenberg LS. Spectral-temporal modulated ripple discrimination by children with Cochlear implants. Ear Hear. 2017;39:60–68. doi: 10.1097/AUD.0000000000000463. [DOI] [PMC free article] [PubMed] [Google Scholar]
- Litvak LM, Spahr AJ, Saoji AA, Fridman GY. Relationship between perception of spectral ripple and speech recognition in cochlear implant and vocoder listeners. J Acoust Soc Am. 2007;122:982–991. doi: 10.1121/1.2749413. [DOI] [PubMed] [Google Scholar]
- Mesnildrey Q, Macherey O. Simulating the dual-peak excitation pattern produced by bipolar stimulation of a cochlear implant: effects on speech intelligibility. Hear Res. 2015;319:32–47. doi: 10.1016/j.heares.2014.11.001. [DOI] [PubMed] [Google Scholar]
- Nilsson M, Soli SD, Sullivan JA. Development of the hearing in noise test for the measurement of speech reception thresholds in quiet and in noise. J Acoust Soc Am. 1994;95:1085–1099. doi: 10.1121/1.408469. [DOI] [PubMed] [Google Scholar]
- Oxenham AJ, Kreft HA. Speech perception in tones and noise via cochlear implants reveals influence of spectral resolution on temporal processing. Trends Hear. 2014;18:1–14. doi: 10.1177/2331216514553783. [DOI] [PMC free article] [PubMed] [Google Scholar]
- Patterson RD. Auditory filter shapes derived with noise stimuli. J Acoust Soc Am. 1976;59:640–654. doi: 10.1121/1.380914. [DOI] [PubMed] [Google Scholar]
- Patterson RD, Nimmo-Smith I, Weber DL, Milroy R. The deterioration of hearing with age: frequency selectivity, the critical ratio, the audiogram, and speech threshold. J Acoust Soc Am. 1982;72:1788–1803. doi: 10.1121/1.388652. [DOI] [PubMed] [Google Scholar]
- Saoji AA, Eddins DA. Spectral modulation masking patterns reveal tuning to spectral envelope frequency. J Acoust Soc Am. 2007;122:1004–1013. doi: 10.1121/1.2751267. [DOI] [PubMed] [Google Scholar]
- Saoji AA, Litvak L, Spahr AJ, Eddins DA. Spectral modulation detection and vowel and consonant identifications in cochlear implant listeners. J Acoust Soc Am. 2009;126:955–958. doi: 10.1121/1.3179670. [DOI] [PubMed] [Google Scholar]
- Shannon RV, Zeng FG, Kamath V, Wygonski J, Ekelid M. Speech recognition with primarily temporal cues. Science. 1995;270:303–304. doi: 10.1126/science.270.5234.303. [DOI] [PubMed] [Google Scholar]
- Stone MA, Moore BCJ. On the near non-existence of “pure” energetic masking release for speech. J Acoust Soc Am. 2014;135:1967–1977. doi: 10.1121/1.4868392. [DOI] [PubMed] [Google Scholar]
- Stone MA, Füllgrabe C, Mackinnon RC, Moore BCJ. The importance for speech intelligibility of random fluctuations in “steady” background noise. J Acoust Soc Am. 2011;130:2874–2881. doi: 10.1121/1.3641371. [DOI] [PubMed] [Google Scholar]
- Stone MA, Füllgrabe C, Moore BCJ. Notionally steady background noise acts primarily as a modulation masker of speech. J Acoust Soc Am. 2012;132:317–326. doi: 10.1121/1.4725766. [DOI] [PubMed] [Google Scholar]
- Studebaker GA. A “rationalized” arcsine transform. J Speech Hear Res. 1985;28:455–462. doi: 10.1044/jshr.2803.455. [DOI] [PubMed] [Google Scholar]
- Supin AY, Popov VV, Milekhina ON, Tarakanov MB. Frequency resolving power measured by rippled noise. Hear Res. 1994;78:31–40. doi: 10.1016/0378-5955(94)90041-8. [DOI] [PubMed] [Google Scholar]
- Whitmal NA, Poissant SF, Freyman RL, Helfer KS. Speech intelligibility in cochlear implant simulations: effects of carrier type, interfering noise, and subject experience. J Acoust Soc Am. 2007;122:2376–2388. doi: 10.1121/1.2773993. [DOI] [PubMed] [Google Scholar]
- Wilson JP, Evans EF (1971) Grating acuity of the ear: psychophysical and neurophysiological measures of frequency resolving power. Proc 7th Int Congr Acoust
- Won JH, Drennan WR, Rubinstein JT. Spectral-ripple resolution correlates with speech reception in noise in cochlear implant users. J Assoc Res Otolaryngol. 2007;8:384–392. doi: 10.1007/s10162-007-0085-8. [DOI] [PMC free article] [PubMed] [Google Scholar]
- Won JH, Clinard CG, Kwon S, Dasika VK, Nie K, Drennan WR, Tremblay KL, Rubinstein JT. Relationship between behavioral and physiological spectral-ripple discrimination. J Assoc Res Otolaryngol. 2011;12:375–393. doi: 10.1007/s10162-011-0257-4. [DOI] [PMC free article] [PubMed] [Google Scholar]
- Zeng FG, Rebscher S, Harrison W, et al. Cochlear implants: system design, integration, and evaluation. IEEE Rev Biomed Eng. 2008;1:115–142. doi: 10.1109/RBME.2008.2008250. [DOI] [PMC free article] [PubMed] [Google Scholar]
- Zhou N. Deactivating stimulation sites based on low-rate thresholds improves spectral ripple and speech reception thresholds in cochlear implant users. J Acoust Soc Am. 2017;141:243–248. doi: 10.1121/1.4977235. [DOI] [PMC free article] [PubMed] [Google Scholar]