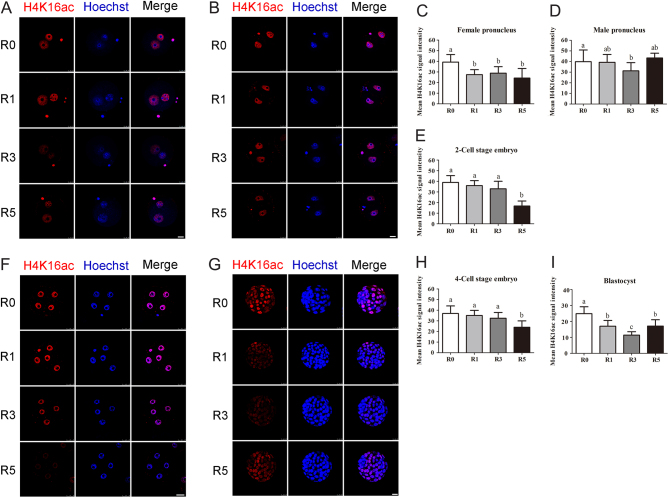
Figure 4.
Acetylation levels of H4K16 in the early embryos. Fluorescence intensity of H4K16ac in early embryos was tested using confocal microscopy. (A) Pronuclear embryos at the PN4 phase, n = 44 (R0), n = 43 (R1), n = 42 (R3), n = 42 (R5); (B and C) average fluorescence intensity of pronucleus. (D) two-cell stage embryos, n = 50 (R0), n = 55 (R1), n = 52 (R3), n = 53 (R5); (E) average fluorescence intensity of two-cell stage embryos; (F) four-cell stage embryos, n = 37 (R0), n = 44 (R1), n = 50 (R3), n = 47 (R5); (H) blastocyst embryos, n = 50 (R0), n = 46 (R1), n = 47 (R3), n = 50; (G and I) average fluorescence intensity of four-cell stage embryos and blastocysts. Scale bars = 25 μm. Data present as mean ± s.d. Different letters indicate P < 0.05 between groups.

 This work is licensed under a