

Abstract
High-throughput transcriptomic (HTTr) technologies are increasingly being used to screen environmental chemicals in vitro to identify molecular targets and provide mechanistic context for regulatory testing. Here, we describe the development and validation of a novel gene expression biomarker to identify androgen receptor (AR)-modulating chemicals using a pattern matching method. Androgen receptor biomarker genes were identified by their consistent expression after exposure to 4 AR agonists and 4 AR antagonists and included only those genes that were regulated by AR. The 51 gene biomarker was evaluated as a predictive tool using the fold-change, rank-based Running Fisher algorithm. Using 158 comparisons from cells treated with 95 chemicals, the biomarker gave balanced accuracies for prediction of AR activation or AR suppression of 97% or 98%, respectively. The biomarker correctly classified 16 out of the 17 AR reference antagonists including those that are “weak” and “very weak”. Predictions based on microarray profiles from AR-positive LAPC-4 cells treated with 28 chemicals in antagonist mode were compared with those from an AR pathway model which used 11 in vitro HT assays. The balanced accuracy for suppression was 93%. Using our approach, we identified conditions in which AR was modulated in a large collection of microarray profiles from prostate cancer cell lines including (1) constitutively active mutants or knockdown of AR, (2) decreases in availability of androgens by castration or removal from media, and (3) exposure to chemical modulators that work through indirect mechanisms including suppression of AR expression. These results demonstrate that the AR gene expression biomarker could be a useful tool in HTTr to identify AR modulators.
Keywords: androgen receptor, gene expression profiling, prostate cancer cell line, biomarker, toxicogenomics, LAPC-4 cell line
High-throughput screening (HTS) assays are an important component of chemical safety evaluation programs carried out by the EPA ToxCast screening program (http://epa.gov/ncct/toxcast/; last accessed August 10, 2018) and the cross-agency Tox21 program (http://www.ncats.nih.gov/tox21; last accessed August 10, 2018). There are approximately 700 HTS Tier 1 assays representing approximately 350 molecular targets that have been used to screen more than 1800 chemicals (Judson et al. 2014). Although the data have proven useful in prioritizing chemicals for further testing, it is recognized that the assays do not sufficiently cover all potentially important pathways that could be perturbed by environmental chemicals (Cox et al. 2014; Filer et al. 2014). High-throughput transcriptomic (HTTr) technologies have the potential to examine many more pathways simultaneously and in the near future could be used in testing programs as “Tier 0” assays defined as assays that are carried out prior to Tier 1 screening. The putative chemical targets identified could then be validated by selected in vitro HTS assays. Ideally, the assays would assess both the parent chemical and metabolites.
For HTTr screening to become practical, there needs to be a shift from the use of conventional microarrays to new methods that can be adapted to HTS. These include emerging technologies that can assess the expression of most, if not all, of the protein coding genes from chemically treated cells. A number of promising techniques are now available that have been adapted to HTS to allow measurement of expression of targeted genes from lysates of treated cells (Larman et al. 2014; Yeakley et al. 2017). Parallel computational methods need to be developed to simultaneously predict modulation of molecular targets that can be linked to the network of adverse outcome pathways (AOPs) relevant to chemical-induced toxicity (Edwards et al. 2015). Machine learning methods have been used to predict phenotypic endpoints such as cancer (Waters et al. 2010), but rarely have they been used to predict chemical-induced effects on specific targets (eg, Kleinstreuer et al. 2014; Oshida et al.2015a,c). Methods that evaluate pathway level perturbations are generally useful for hypothesis generation, but none appear to have been validated as tools for prediction. Gene set enrichment analysis has been used with some success both in relation to identification of potential drugs to treat diseases (Lamb et al. 2006) and to toxicology (Smalley et al. 2010), but the approach has not been fully exploited in terms of prediction of modulation of specific targets.
Exposure to endocrine disrupting chemicals (EDCs) is a risk factor for oncogenesis and disruption of the development of many organ systems in humans and wildlife (Diamanti-Kandarakis et al. 2009). Increased recognition in the 1990s that man-made chemicals may interfere with endocrine functions in wildlife and humans led to legislation in the United States, eventually resulting in a mandate that the US EPA develop a screening program for potential EDCs. In this program, approximately 10,000 existing chemicals would be evaluated for their potential to disrupt the estrogen, androgen, and thyroid signaling systems (The Endocrine Disruptor Screening Program [EDSP]). Under these guidelines, a battery of Tier 1 in vitro and short-term in vivo screening assays, including those that assess nuclear receptor activity, were developed for chemical hazard screening, to be followed by longer term, more definitive in vivo Tier 2 tests for endocrine disrupting activity. One mechanism by which potential EDCs can interfere with normal endocrine signaling is via inappropriate activation or repression of a subgroup of nuclear receptors for androgen, estrogen, and thyroid hormones. These receptors include 2 estrogen receptors (ERα and ERβ), the androgen receptor (AR), and 2 thyroid hormone receptors (TRα, TRβ). The receptors act as ligand-binding transcription factors that can be activated or repressed by xenobiotic chemicals, resulting in altered gene expression in susceptible tissues. The EPA’s vision for the EDSP in the 21st Century (EDSP21) includes utilization of in vitro HTS assays, coupled with computational modeling, to prioritize chemicals and to eventually replace or provide alternatives to some or all of the current EDSP Tier 1 screening assays (https://www.federalregister.gov/articles/2015/06/19/2015-15182/use-of-high-throughput-assays-and-computational-tools-endocrine-disruptor-screening-program-notice; last accessed August 10, 2018). Within the ToxCast battery, there are 18 and 11 HTS assays that have been used to evaluate the ability of chemicals to modulate ER and AR, respectively. Computational models based on the results of these assays have been developed to allow accurate prediction of chemicals that target ER (Judson et al. 2015) and AR (Kleinstreuer et al. 2017).
In a previous study (Ryan et al. 2016), we developed methods for the accurate identification of ER agonists and antagonists in microarray profiles from human breast cancer cell lines. Here, we determined if this same approach could be used to identify chemicals that modulate the activity of AR. A biomarker of AR-regulated genes was built from a set of experiments applying chemical and genetic perturbations known to affect AR. The 51 AR biomarker genes, used in the context of a pattern matching algorithm, were found to be accurate at identifying both AR agonists and antagonists in a large gene expression compendium developed from microarray profiles generated in human prostate cancer cell lines. We found that our AR biomarker could accurately predict the antiandrogenicity of the same compounds when compared with the AR pathway model that may be used to assess antiandrogenicity of compounds through HTS screening programs (Judson et al. 2015; Rotroff et al. 2014).
MATERIALS AND METHODS
Culture and treatment of LAPC-4 cells
The LAPC-4 cell line expresses a wild-type AR that is not amplified (Klein et al. 1997; Watson et al. 2015). LAPC-4 cells were cultured in IMDM media (GIBCO) supplemented with 5% FBS (Omega Scientific) and 1× penicillin/streptomycin/glutamine (GIBCO). An initial range finding experiment (data not shown) was conducted to determine the optimal concentration of the positive control compound, R-1881 (also called metribolone; Sigma Chemicals), to allow detection of both agonism and antagonism. Cells were plated at 7.5× 10⁵ cells per well in 1 ml media in 24-well plates. After 48 h, media was replaced with dosing solutions containing DMSO (0.05%), R-1881 (0.16, 0.33, or 0.50 nM) alone or with 1 µM cyproterone acetate, 0.5 µM androstenedione, 5 µM bicalutamide, or 10 µM flutamide. After 6 h of exposure, media were removed; cells were rinsed with PBS and frozen in Buffer RLT (Qiagen). (It should be noted that the range finding microarray comparisons were not used to build the biomarker.) In a second experiment, cells were exposed, as described above, to 28 chemicals (see Table 1 for exposure conditions) in the presence of R-1881 (0.33 nM). Both experiments were conducted in triplicate (3 individual experiments performed on separate days). Chemical concentrations were selected based on observed activity in the ToxCast AR pathway assays (Kleinstreuer et al. 2017) and to minimize cytotoxicity (Judson et al. 2015). In general, concentrations were chosen that were above predicted AC50 values for agonism or antagonism (when available) and below any predicted cytotoxicity levels. Exposure to the strongest agonists (AC50 values in sub micromolar range) were at 0.5 µM, whereas others were at 10 µM. Antagonist exposures were performed at 10 or 20 µM. Concentrations for non-AR modulators were selected to be below the predicted cytotoxicity threshold (based on ToxCast data; Judson et al. 2016) and to be similar to those of the AR modulators (10–20 µM). All chemicals came from the ToxCast chemical inventory (kindly provided by Dr Ann Richard).
Table 1.
Exposure Conditions for LAPC-4 Cells Examined in Antagonist Mode
| Chemical Name | CASRN | Dose (µM) | Classificationa |
|---|---|---|---|
| 4-Androstenedione | 63-05-8 | 10 | Agonist |
| Apigenin | 520-36-5 | 20 | Antagonist |
| Atrazine | 1912-24-9 | 20 | Inactive |
| Bicalutamide | 90357-06-5 | 20 | Antagonist |
| Bisphenol A | 80-05-7 | 20 | Antagonist |
| Cyproterone acetate | 427-51-0 | 20 | Both |
| p,p′-DDE | 72-55-9 | 20 | Antagonist |
| Dehydroepiandrosterone | 53-43-0 | 20 | Antagonist |
| Dexamethasone sodium phosphate | 2392-39-4 | 10 | Agonist |
| 5α-Dihydrotestosterone | 521-18-6 | 0.5 | Agonist |
| Fenitrothion | 122-14-5 | 20 | Antagonist |
| Finasteride | 98319-26-7 | 20 | Inactive |
| Flutamide | 13311-84-7 | 20 | Antagonist |
| Hydroxyflutamide | 52806-53-8 | 20 | Antagonist |
| Iprodione | 36734-19-7 | 20 | Inactive |
| Linuron | 330-55-2 | 20 | Antagonist |
| Methyl testosterone | 58-18-4 | 0.5 | Agonist |
| Mifepristone (RU-486) | 84371-65-3 | 10 | Antagonist |
| Norethindrone | 68-22-4 | 0.5 | Agonist |
| Prochloraz | 67747-09-5 | 20 | Antagonist |
| Procymidone | 32809-16-8 | 20 | Antagonist |
| Progesterone | 57-83-0 | 10 | Agonist |
| Spironolactone | 52-01-7 | 20 | Antagonist |
| Tebuconazole | 107534-96-3 | 20 | Antagonist |
| Testosterone propionate | 57-85-2 | 0.5 | Agonist |
| 17β-Trenbolone | 10161-33-8 | 0.5 | Agonist |
| Triticonazole | 131983-72-7 | 10 | Antagonist |
| Vinclozolin | 50471-44-8 | 20 | Antagonist |
All exposure conditions were carried out in the presence of 0.33 nM metribolone (R1881).
Classification was based on the AR pathway model.
Gene expression microarrays
Global gene expression was evaluated by microarray analysis (Figure 1A). Total RNA was isolated and purified with the RNeasy MinElute column protocol (Qiagen GmbH, Hilden, Germany), evaluated for integrity using an Agilent RNA 6000 Nano chip on an Agilent 2100 Bioanalyzer (Agilent Technologies GmbH, Berlin, Germany), and quantitated using the NanoDrop spectrophotometer (NanoDrop Technologies, Wilmington, Delaware). After randomization, samples were hybridized in a blinded manner onto Human HT-12 v4 Expression BeadChip arrays (Illumina, San Diego, California) in the NHEERL Genomics Research Core Laboratory using standard Illumina protocols. Arrays were scanned, and raw data (.idat files) were obtained using Illumina iScan software (v3.3.28) and analyzed using Illumina GenomeStudio and Partek Genomics Suite Software. Array data are publicly available at Gene Expression Omnibus (GEO), accession number GSE109021.
Figure 1.

Assembly, characterization, and testing of the AR biomarker. A, AR biomarker development and characterization. Experiments used to identify AR-regulated genes included 4 biosets from agonist exposed cells, 4 biosets from antagonist exposed cells, 3 biosets from cells expressing constitutively active AR mutants (caAR), and 3 biosets from cells in which AR expression was knocked down by siRNA. See Table 2 for description of the individual biosets used. Differentially expressed genes were identified as described in the Methods. Biomarker genes were identified from the differentially expressed genes after applying several filtering steps. Post hoc analysis on genes in the biomarker was performed by IPA for canonical pathway enrichment and potential transcription factor regulators. Identification of primary targets of AR was supported through queries of chromatin immunoprecipitation coupled with DNA sequencing (ChIP-seq) datasets and by examining expression of the biomarker genes following genetic perturbation. B, Biomarker testing and screening. The AR biomarker was imported into the BSCE database, in which internal protocols rank-ordered the genes based on their average fold-change. Screening of a human prostate tissue compendium was carried out by comparison of the biomarker to each bioset in the BSCE database using a pair-wise rank-based algorithm (the Running Fisher test). The results of the test, including the direction of correlation and p-value for each bioset in the compendium, were exported and used to populate a master table containing bioset experimental details. A test of the accuracy of the biomarker predictions was carried out using treatments that are known agonists and antagonists for AR. The figure was adapted from Ryan et al. (2016).
Identification of differentially expressed genes in the LAPC-4 experiment
Raw gene expression intensities were quantile-normalized using Illumina GenomeStudio. ANOVA analysis was performed in Partek Genomics Suite, with a p ≤ .05 for significance. All filtered gene lists were uploaded into BaseSpace Correlation Engine (BSCE). Heat maps were generated using Eisen Lab Treeview software (http://rana.lbl.gov/EisenSoftware.htm; last accessed August 10, 2018).
Identification of differentially expressed genes in BSCE microarray datasets
All differentially regulated genes that were part of each bioset were identified using the criteria in the data analysis pipeline in BSCE (https://www.illumina.com/products/by-type/informatics-products/basespace-correlation-engine.html; last accessed August 10, 2018; previously called NextBio) and are described in detail in Kupershmidt et al. (2010) and Ryan et al. (2016).
Assembly of a compendium of microarray experiments carried out in prostate cancer cell lines
Information in the BSCE database was used to build an annotated compendium of gene expression biosets derived from experiments carried out in human prostate tissue, including prostate cancer cell lines. The BSCE database contains over approximately 21,600 highly curated, publically available, omic-scale studies across 15 species including approximately 134,000 lists of statistically filtered genes (as of October 2017). Annotated information from BSCE about human-derived biosets was used to populate a master file with information about each bioset including Biodesign, Biosource, Chemical Name, Gene, Gene Mode, Phenotype, Tissue, and Study ID (last update, August 17, 2017). The table was then filtered for biosets derived from prostate cancer cell lines or prostate tissue, and these biosets were used to populate a separate table. Each bioset was annotated for category and name of the perturbant examined based on the name of the bioset. For example, the bioset called “LNCaP cells +RTI-6413-018 6 hr_vs_ vehicle 6 hr” is in the category “Chemical” and the specific perturbant is “RTI-6413-018”. The bioset called “Prostate cancer VCaP cells—androgen receptor siRNA_vs_ control siRNA” is in the category “Gene” and the specific perturbant is “AR”. Biosets that examined more than 2 perturbants at 1 time (eg, exposure to 3 chemicals vs control) or that could not be interpreted were not used in any further analyses. The final compendium contained approximately 2510 biosets. Information about the biosets examined in the study is found in Supplementary File 1.
Identification of AR biomarker genes
Lists of statistically filtered genes were used to derive a consensus gene expression biomarker for AR (Figs. 1 and 2A). Biosets in BSCE database used to create the biomarker included those from cells treated with 4 agonists (R-1881, androstenedione, dexamethasone, RTI-6413-018) or 4 antagonists (bicalutamide, triticonazole, tubuconazole, vinclozalin) or from cells either expressing a constitutively active form of AR or in which AR expression was knocked down by shRNA or siRNA (Table 2). Biosets were selected because they exhibited robust gene expression changes (>210 statistically altered genes for each bioset), the chemicals were structurally diverse, at least for the antagonists and included both well-known agonists and antagonists. Although all of the agonists are considered strong or moderately potent, antagonists were classified as strong (bicalutamide), moderate/weak (vinclozolin), or weak (triticonazole, tebuconazole) (Kleinstreuer et al. 2017). Genetic biosets were selected because of well characterized effects on AR. The AR (F876L/T877A) and AR (W741C/T877A) mutants each contain 2 amino acid changes in the ligand-binding domain (LBD) of AR; the F876L mutation was isolated from the AR in LNCaP cells resistant to the growth inhibition effects of the AR antagonist enzalutamide (Korpal et al. 2013). The W741C mutant was shown to confer an agonist switch specific for bicalutamide (Hara et al. 2003). The T877A mutation is found in LNCaP cells and confers resistance to hydroxyflutamide (Veldscholte et al. 1992). The V7 mutant lacks the LBD due to splicing of “intronic” cryptic exons to the upstream exons encoding the AR DNA-binding domain (Cottard et al. 2013; Hu et al. 2009). All 3 mutants confer androgen-independent AR activation (Cottard et al. 2013; Korpal et al. 2013; Veldscholte et al. 1992). The 3 experiments consisting of siRNA or shRNA against AR versus controls resulted in decreases in the expression of the AR protein (Gonit et al. 2011; Li et al. 2014; Zhu et al. 2012).
Figure 2.

Weight of evidence approach to identify AR-regulated genes. A, Filters used to identify biomarker genes. Biomarker genes were identified using 2 chemical filters and 1 genetic filter: Genes (1) were consistently regulated by 4 AR agonists from 3 studies, (2) were consistently regulated in an opposite manner by 4 antagonists from 2 studies, and (3) exhibited dependence on AR by selecting genes responsive to perturbations of AR gene activity in 3 biosets in which mutations in the ligand-binding domain result in constitutive activation and/or in 3 biosets in which AR expression was decreased by shRNA or siRNA targeting AR. The genes in the biomarker are shown. B, (Top) Heat map of the fold-change expression of 51 biomarker genes across the biosets used to make the biomarker. (Bottom) Correlation between the AR biomarker and the biosets. The AR biomarker was compared with the biosets using the Running Fisher test. The significance of the correlation is indicated by the –log(p-value). Biosets with positive or negative correlation to the biomarker are indicated as positive or negative numbers, respectively. The name of the compounds used in the treatments or the type of AR modulation is shown.
Table 2.
Biosets Used to Create the AR Biomarker
| Bioset Name | Mode | Perturbant | Exposure Time | Cell Line | Study |
|---|---|---|---|---|---|
| LNCaP androgen receptor positive prostate cancer cells 1nM R1881 treated 24hr _vs_ EtOH | Agonist | R1881 | 24 h | LNCaP | GSE50936 |
| LNCaP cells + RTI-6413-018 6hr _vs_ vehicle 6hr | Agonist | RTI-6413-018 | 6 h | LNCaP | GSE4636 |
| Androstenedione (10uM) versus DMSO | Agonist | Androstenedione | 6 h | LAPC-4 | Present study |
| Dexamethasone (10uM) versus DMSO | Agonist | Dexamethasone | 6 h | LAPC-4 | Present study |
| DHT-stimulated LNCaP cells + bicalutamide _vs_ DHT-stimulated control | Antagonist | Bicalutamide | 18 h | LNCaP | GSE7708 |
| R1881+Triticonazole (10 µM) versus R1881 | Antagonist | Triticonazole | 6 h | LAPC-4 | Present study |
| R1881+Vinclosalin (20 µM) versus R1881 | Antagonist | Vinclosalin | 6 h | LAPC-4 | Present study |
| R1881+Tebuconazole (20 µM) versus R1881 | Antagonist | Tebuconazole | 6 h | LAPC-4 | Present study |
| Prostate cancer LnCaP cells control (DMSO) 24 h—overexpressing AR (F876L/T877A) _vs_ empty vector | Genetic | AR (F876L/T877A) | NA | LNCaP | GSE44924 |
| Prostate cancer LnCaP cells control (DMSO) 24 h—overexpressing AR (W741C/T877A) _vs_ empty vector | Genetic | AR (W741C/T877) | NA | LNCaP | GSE44924 |
| Prostate adenocarcinoma LNCaP cells transduced 72 h with ligand-independent AR-V7_vs_ AR-wildtype | Genetic | AR-V7 | NA | LNCaP | GSE71334 |
| LNCaP prostate cancer cells−AR shRNA transfected+vehicle treated _vs_ control shRNA+vehicle | Genetic | AR shRNA | NA | LNCaP | GSE22483 |
| Prostate cancer VCaP cells−androgen receptor siRNA _vs_ control siRNA | Genetic | AR siRNA | NA | VCaP | GSE32892 |
| Prostate cancer LNCaP cells grown in regular media−AR siRNA for 48hr_vs_ control siRNA | Genetic | AR siRNA | NA | LNCaP | GSE49287 |
NA, not applicable.
The top 5000 genes with the greatest degree of overlap between all biosets were identified by the “meta-analysis” function in BSCE database, and all data were exported. There were 3 filters that were manually implemented (Figure 2A). First, genes which exhibited consistent expression behavior across the 4 agonists were selected, ie, genes had to consistently exhibit either up or down regulation in at least 2 of 4 comparisons. Second, genes which exhibited opposite regulation by antagonists were selected and had to consistently exhibit either up or down regulation by at least 2 of the 4 comparisons. Thus, genes with increased expression after chemical exposure by agonists were decreased by antagonists, and genes with decreased expression after agonist exposure were increased by antagonists. In the genetic filter, genes were selected that exhibited features of AR dependence by responding in the predicted direction by either expression of a constitutively active AR or by knocking down expression with siRNA or shRNA targeted against AR. To pass this filter, the gene needed to be altered by the constitutive AR in the same direction as an AR agonist and/or altered by the AR knockdown in the same direction as an AR antagonist in at least 1 out of the 6 comparisons. Genes with inconsistent regulation were removed. Genes which did not exhibit robust expression across the agonist treatments (ie, absolute fold-change <1.5) were removed. The final list consisted of 51 genes. An average fold-change across all agonist treatments was calculated for each gene. The average fold-change values and gene abbreviations were imported into BSCE database without any further filtering. Pathway analysis was performed on the biomarker genes using ingenuity pathway analysis (IPA) (Qiagen Bioinformatics, Redwood City, California).
Identification of AR target genes
To determine putative target genes that may be directly regulated by AR in our biomarker gene list, we analyzed chromatin immunoprecipitation coupled with DNA sequencing (ChIP-seq) datasets derived from multiple human prostate cell lines including LNCaP, VCaP, and PC3 expressing wild-type AR under a CMV promoter (Chng et al. 2012; Guseva et al. 2012; Lin et al. 2009; Massie et al. 2011; Wilson et al. 2016; Zhu et al. 2012). Genomic coordinates derived from these datasets were updated to human genome build GRCh38/hg38 using LiftOver (performed October 17, 2017; https://genome.ucsc.edu/cgi-bin/hgLiftOver; last accessed August 10, 2018). Coordinates were annotated by closest gene feature using the R Bioconductor 3.6 package function “ChIPpeakAnno” (Zhu et al. 2012). To increase the likelihood of selecting regions that were AR bound, we further searched these bound regions for the presence of an androgen responsive element (ARE; Supplementary File 1) previously defined by a position site specific model using AR ChIP-seq data (AR 2.0) (Wilson et al. 2016). These regions were evaluated using the R BioStrings v2.40.2 package function “matchPWM” (https://www.rdocumentation.org/packages/Biostrings/versions/2.40.2/topics/matchPWM; last accessed August 10, 2018). Matches were based on a minimum of 80% relatedness (defined as min.score). The evaluation of evidence for linkage of AR binding in association with target genes was a post hoc analysis and served to support, but not develop, the composition of the biomarker.
Comparison of the AR biomarker to biosets in the compendium
The strategy for comparison of a biomarker to collections of biosets has been described in previous studies (Oshida et al. 2015a,b,c). Using the Running Fisher algorithm, the AR biomarker was compared with each derived bioset in the BSCE database. The method allows an assessment of the overlap in regulated genes between the biomarker and each bioset, and whether those overlapping genes are significantly regulated in a similar or opposite manner. Biosets which exhibited expression of biomarker genes that were significantly positively correlated with the biomarker would be predicted to exhibit AR activation. The activation could be due to direct agonism or occur through other mechanisms. Biosets which exhibited expression of biomarker genes that were significantly negatively correlated to the biomarker would be predicted to exhibit AR suppression through direct or indirect mechanisms. The p-value and direction of the correlation were exported. p-Values were converted to −log(p-value)s, and those with negative correlations were converted to negative numbers. The final list of −log(p-value)s were used to populate the table containing the study characteristics of each bioset. This final master table enabled the determination of effects on AR by categories of perturbants (eg, chemical) as well as individual perturbants (eg, atrazine). To determine if the level of AR expression affects the expression of biomarker genes, biosets from experiments involving AR modulation in prostate cancer cell lines were examined. Specifically, the expression level (fold change) of the 51 biomarker genes was determined in the 6 biosets used to derive the biomarker, as well as biosets described below.
Predictive accuracy of AR function
Predictive accuracy was carried out with 2 datasets. The first set consisted of 158 biosets, all from prostate cancer cell lines, including well characterized AR agonists and antagonists (Supplementary File 1). The number of agonist and antagonist biosets was matched with an equal number of biosets from chemically treated AR-negative PC3 cells, which are not responsive to AR modulators. The dataset consisted of 95 chemicals from 39 studies and included a set of 18 antagonists from our study (Table 1). Some of the other biosets of antagonists were run in antagonist mode with either R-1881 or DHT as the AR agonist. Biosets used to create the biomarker were not included in this analysis. The second dataset consisted of 28 chemicals run in antagonist mode in LAPC-4 cells and is described below in comparison to the AR pathway model. All statistically filtered gene lists were examined for statistically significant correlation to the AR biomarker genes using the Running Fisher algorithm in BSCE database. Prior studies with gene expression biomarkers for xenobiotic receptors showed that a cutoff p-value ≤10−4 after a Benjamini Hochberg correction of α = 0.001 resulted in a balanced accuracy for activation of 95%, 97%, and 98% for AhR, CAR, and PPARα, respectively (Oshida et al. 2015a,b,c). The values for predictive accuracy were calculated as follows: Sensitivity (true positive rate) =TP/(TP + FN); specificity (true negative rate) =TN/(FP + TN); positive predictive value (PPV) =TP/(TP + FP); negative predictive value (NPV) =TN/(TN + FN); balanced accuracy =(sensitivity + specificity)/2.
Comparison of biomarker predictions to the AR pathway model
Comparisons were made between the predictions using the AR biomarker and predictions from the AR pathway model (Kleinstreuer et al. 2017) in which the results of 11 in vitro HTS assays were used to score chemicals for AR agonism or antagonism. These 11 assays included endpoints for receptor binding, receptor dimerization, reporter gene assays, and cell growth, implemented in a variety of cell types and assay readout formats. The rationale for using this battery of assays was to account for a variety of assay artifacts and assay interference issues that can arise when screening a diverse set of chemicals, as well as testing chemicals up to concentrations at which cell stress and cytotoxicity can occur. A mathematical model was used to derive pathway-level concentration-response profiles for either agonism or antagonism. Efficacy values were normalized to antagonist activity of hydroxyflutamide. Agonist and antagonist scores were calculated as the area under the concentration-response curves (AUC) for the chemical relative to the positive control. Thus, the higher the AUC, the higher was the predicted AR activity (combined potency and efficacy) for that chemical. Assay interference (eg, technological, cytotoxicity-driven) was considered when evaluating the HTS data. Assay results were compared with the results of 35 cytotoxicity assays by the calculation of a Z-score, ie, the number of median absolute deviations between AR pathway activity and the median cytotoxic concentration (Kleinstreuer et al. 2017). For the comparisons in this paper, chemicals were classified as active if their AUC ≥0.1. Of the 1855 chemicals examined in the Kleinstreuer et al. (2017) study 28 chemicals were evaluated in antagonist mode by transcript profiling in LAPC-4 cells described above. Predictive accuracy was calculated with and without the 3 biosets used to create the biomarker.
RESULTS
Assembly and Functional Characterization of an AR Biomarker
To assemble a biomarker predictive of AR modulation, gene expression comparisons (called biosets) were utilized from chemically treated prostate cancer cell lines (Figure 1). As described in Materials and Methods section, the biomarker was built from biosets known to perturb AR activity in 3 steps (Figure 2A). First, genes which exhibited consistent regulation by 4 AR agonists were identified. Genes were then filtered for those that only exhibited opposite regulation by 4 AR antagonists. Finally, a genetic filter was used to exclude those genes that were not also regulated by modulation of AR activity. The genetic filter used biosets from cells expressing constitutively active mutants of AR or those in which the expression of AR was knocked down. A total of 51 genes (39 with increased expression and 12 with decreased expression) were identified. Figure 2B (top) shows the consistent expression of the genes in the biomarker across the chemical and genetic perturbations. The full list of genes in the biomarker is found in Supplementary File 1.
The biomarker genes were examined for evidence that they are direct targets of AR regulation, using published chromatin immunoprecipitation coupled with DNA sequencing (ChIP-Seq) experiments. Of the 51 AR biomarker genes, 46 of these were associated with the AR-bound ChIP-seq regions in at least 1 dataset, with an average of 3 datasets per gene (Supplementary File 1). To strengthen the evidence that AR likely directly binds these regions, we scanned for AREs (based on previously published ChIP-seq analysis (Wilson et al. 2016) in silico. We observed 17 biomarker genes associated with AR ChIP-seq regions that contained this motif (bolded entries in Supplementary File 1), and all 17 genes were upregulated in the biomarker. Direct gene targets of AR were expected given that we selected genes exhibiting regulation consistent with either constitutive activation or suppression of AR. Overall, the results of the ChIP-Seq indicate that most (46/51) of the genes in the AR biomarker are likely under direct transcriptional control of AR.
The 51 AR biomarker genes were examined for functional class enrichment by IPA. No canonical pathways were significantly enriched based on overlap of 3 or more genes in a pathway. The upstream analysis function of IPA identified 2 transcription factors predicted to regulate the biomarker genes with significant Z-scores (≥2.0). AR was the top hit (Z-score =2.7) and the glucocorticoid receptor (GR) was the other hit (Z-score =2.4). The results are consistent with AR and GR being structurally similar members of the nuclear-receptor super family, sharing recognition of similar DNA-response elements, and recruiting the same coactivators to their target genes (Claessens et al. 2017).
Behavior of the Biomarker in a Prostate Cancer Cell Line Compendium
The ability of the 51-gene biomarker to identify chemicals that modulate AR was examined in a compendium of biosets derived from prostate cancer cell lines assembled as described in Materials and Methods section. The compendium contains approximately 2510 biosets of gene expression differences between control and experimental states. There are 1610 biosets from cells treated with 1152 chemicals. Most chemical treatments came from the Broad Connectivity Map 2.0 dataset in which screening was carried out in the AR-negative PC3 cell line.
The Running Fisher algorithm (Kupershmidt et al. 2010), a fold-change rank-based pattern matching strategy, was used to identify chemicals that modulate AR. The algorithm calculates the significance of the correlation between the biomarker and individual biosets in the database. By way of demonstration, Figure 2B, bottom shows the −Log(p-value)s of the correlations between the AR biomarker and the biosets used to build the biomarker. As expected, the biosets from agonist treated cells exhibited statistically significant positive correlation to the biomarker (p-values ≤10−20), and the biosets from treatments with the antagonists exhibited significant negative correlation to the biomarker (p-values ≤10−22). The biosets from cells with constitutive activation of AR exhibited significant positive correlation (p-values ≤10−10), and biosets from cells in which AR expression was knocked down exhibited significant negative correlation (p-values ≤10−5).
We surveyed the ability of different prostate cancer cell lines to serve as potential screening models for the identification of AR modulating chemicals. Cell lines were divided into those that express an active or inactive AR. The active cell lines included LAPC-4, LNCaP, and VCaP; the 1 AR negative cell line was PC3, which represented the majority of the biosets. Figure 3A shows the distribution of −Log(p-value)s for each of the chemically treated cell lines. The AR active cell lines exhibited a wide distribution of −Log(p-value)s including many >|4|, the cutoff for significance. These results indicate that the 3 cell lines are responsive to both AR activators and suppressors, as expected. In contrast, the PC3 cell line −Log(p-value)s were mostly between 4 and −4. There were 2 instances in which chemical treatment appeared to lead to activation of AR in PC3 cells (ie, −Log(p-value) ≥ 4; Figure 3A, inset). One was from PC3 cells stably expressing an exogenous wild-type AR and exposed to R-1881 (from GSE54104). The other was a false positive from cells exposed to the antihistamine drug chloropyramine (from the CMAP dataset). None of the other approximately 1300 chemicals in the PC3 CMAP dataset had significant effects on AR. Cell lines derived from tissues other than prostate were examined in a human compendium of approximately 37,000 biosets as potential screening models. However, due to lack of biosets in which cells were exposed to AR agonists and antagonists, the usefulness of the cell lines for screening could not be evaluated (data not shown). However, the biomarker appears to be useful as a screening tool in AR-positive prostate cancer cell lines.
Figure 3.

Biomarker behavior in a prostate cancer cell line compendium. A, (Upper) Biosets from chemically treated AR-positive cell lines and 1 AR-negative cell line were examined for responsiveness using the biomarker. The biosets from each cell line were rank-ordered based on −Log(p-value)s. Inset shows 5 biosets with the highest −Log(p-value)s from chemically treated PC3 cells. The top 2 biosets passed the cutoff for significance. (Lower) Heat map showing the fold-change expression of genes in the AR biomarker. B, biomarker. B, Effects of prototypical AR agonists and antagonists on biomarker activity. (Upper) −Log(p-values) of correlations between the AR biomarker and biosets from AR-positive cell lines treated with the agonists R-1881 or dihydrotestosterone or the antagonists bicalutamide or enzalutamide (MDV3100). Cells were exposed to antagonists either by themselves or in antagonist mode. The GEO accession numbers from which the biosets were derived are indicated. (Lower) Expression of the biomarker genes is shown. B, biomarker.
We next determined if the biomarker could be used to show consistent activation or suppression by prototypical agonists or antagonists of AR across multiple studies. There were 30 or 24 biosets from AR-positive cells treated with DHT or R-1881, respectively. Almost all of the biosets exhibited positive correlation to the biomarker and all but 8 exhibited significant (−Log(p-value) ≥4) positive correlation to the biomarker (Figure 3B). There were no obvious reasons why those treatments that did not achieve significance did not modulate the biomarker genes. In 1 bioset, treatment was for only 3 h which may not be long enough to trigger a full AR-dependent response. There were 5 or 15 biosets from cells treated with the antagonists bicalutamide or enzalutamide (MDV3100), respectively, treated by themselves or examined in antagonist mode. All biosets exhibited significant (−Log(p-value) ≤ −4). Overall, treatment with these reference compounds across multiple studies generated gene expression responses consistent with the biomarker for activation or suppression of AR.
The Biomarker Accurately Predicts Chemical Modulation of AR
To determine if our microarray approach could be used as an alternative Tier 0 screening model to identify AR modulators, a classification analysis was performed on 158 biosets from prostate cancer cells that were treated with 95 chemicals with known effects on AR based on the literature and AR pathway model, including those discussed above. Classification of activation or suppression required a threshold p-value ≤10−4. For prediction of activation, the AR biomarker had a sensitivity of 94% and a specificity of 100%, with a balanced accuracy of 97% (Figure 4; Table 3). For prediction of suppression, the AR biomarker had a sensitivity of 96% and a specificity of 100%, with a balanced accuracy of 98%.
Figure 4.

The biomarker accurately predicts AR modulation. A total of 95 chemicals in 158 biosets with known AR activity based on the literature and the AR pathway model were examined for correlation to the AR biomarker. The chemicals present in both agonist and antagonist analyses were rank ordered by −log(p value)s. In the online version, the color bar indicates the following: True positives for agonists (red), true negatives for agonists and antagonists (black), true positives for antagonism (green), false negatives for agonists (blue), and a false negative for antagonism (CPA, cyproterone acetate; yellow). The fold-changes of the biomarker genes are shown below.
Table 3.
Summary of the Sensitivity and Specificity of the AR Biomarker
| Activation | Suppression | |
|---|---|---|
| True positives | 49 | 20 |
| True negatives | 106 | 137 |
| False positives | 0 | 0 |
| False negatives | 3 | 1 |
| Sensitivity | 0.942 | 0.952 |
| Specificity | 1 | 1 |
| Positive predictive value | 1 | 1 |
| Negative predictive value | 0.973 | 0.993 |
| Balanced accuracy | 0.971 | 0.976 |
The biomarker was compared with biosets that are known positives or negatives for AR activation. Separate tests for AR activation (androgenicity) and AR suppression (antiandrogenicity) were carried out. Biosets used in the analysis are found in Supplementary File 1.
Behavior of the Biomarker Genes Upon Perturbation of AR Gene Activity or Androgen Depletion
We determined the extent to which expression of the biomarker genes was influenced by the level of AR activation. Gene expression was examined in cells which either express 1 of the 4 mutants of AR from 1 study that exhibited constitutive chemical-independent activation, or 5 comparisons from 3 studies in which the expression of the endogenous AR gene was knocked down by siRNA or shRNA. It should be noted that these biosets do not include those that were used to construct the biomarker. Figure 5A (left) shows that constitutive activation of AR leads to consistent effects on the AR biomarker genes, similar to chemical treatment with strong agonists. Knockdown of AR showed generally consistent effects on the biomarker genes with decreased expression of the up-regulated genes and increased expression of the down-regulated genes, similar to antagonist exposures (Figure 5A, right). There were 2 biosets after knockdown of AR which did not result in a significant biomarker p-value for unknown reasons (GSE40050, GSE11428); the cell lines used (C4-2B, LNCaP) are AR-positive. The GSE11428 study but not the other study demonstrated decreases in AR protein expression. Overall, the biomarker could be used to identify conditions that affect AR activity by gene perturbation.
Figure 5.

Behavior of the biomarker genes by genetic perturbation of AR or androgen depletion. A, Effects of chemical-independent genetic AR modulation. Biosets from comparisons between AR constitutive activation mutants versus wild-type AR (left) or biosets from comparisons between AR knockdown versus scrambled controls (right) are shown. The names of the mutant AR indicate the mutation(s) examined versus wild-type AR, whether the comparisons were performed in the background of exposure to enzalutamide (MDV) or DMSO, and the GEO accession number. All AR knockdown experiments are AR-specific siRNA or shRNA versus control siRNA or shRNAs; GEO accession numbers of the studies are indicated. B, Effects of androgen depletion. Comparisons are shown between the AR biomarker and biosets from 4 types of experiments in which androgens were depleted: (1) prostate cancer cell line xenografts in castrated mice versus intact mice (xenografts), (2) cells under extended (up to 12 months) androgen deprivation versus untreated, (3) cells grown in charcoal stripped serum (CSS) in which steroids were depleted versus regular media (CSS media), and (4) human prostate tissue from patients undergoing androgen ablation therapy in which patients were treated with AR antagonists and androgen synthesis inhibitors versus before ablation therapy (androgen ablation). The heat map shows the expression of genes in the biomarker. GEO accession numbers of the studies are indicated.
We hypothesized that the biomarker would be able to identify biosets in which there were differences in the levels of androgens. The hypothesis was tested by examining comparisons between (1) prostate cancer cell line xenografts in castrated mice versus intact mice, (2) cells grown under androgen deprivation for up to 12 months versus no deprivation, (3) cells grown in charcoal stripped media in which steroids were depleted versus regular media, and (4) human prostate tissue from patients undergoing androgen ablation therapy consisting of AR antagonists and androgen synthesis inhibitors versus before ablation therapy. In each case, all biosets exhibited suppression of AR with most of them achieving significance (Figure 5B). These results indicate that the biomarker can detect perturbation of AR by androgen depletion.
Comparison of AR Biomarker Predictions With AR Reference Chemicals
An earlier study found that environmental chemicals were more likely to be AR antagonists than agonists (Kleinstreuer et al. 2017). To generate an appropriate microarray dataset to compare to reference chemicals and the AR pathway model, LAPC-4 cells were exposed to 28 chemicals in antagonist mode. Preliminary experiments identified a concentration of 0.33 nM of R-1881 that could be used to identify antagonists (data not shown). Testing conditions are found in Table 1. Biosets were compared with the biomarker and evaluated in the context of annotated reference chemicals.
Biomarker predictions were compared with classifications of OECD AR reference chemicals as summarized in Lynch et al. (2017). None of the 6 agonists were classified as antagonists using the biomarker (Table 4). There were 13 overlapping chemicals classified as antagonists and all but 2 were correctly identified using the biomarker. The 2 antagonists not identified, progesterone and cyproterone acetate, were marginally active as antagonists (−Log(p-value)s =−3 or −3.7). Apigenin and atrazine were the only reference chemicals negative for AR modulation. Using the biomarker, atrazine was negative for AR activity, and apigenin was classified as an AR antagonist. Apigenin was found to be an AR antagonist in the Kleinstreuer et al. (2017) study. In summary, 18 out of 21 OECD classifications (86%) were correctly classified by the biomarker with the 2 false negatives marginally active.
Table 4.
Comparison of Biomarker Predictions to AR Reference Chemicals
| Chemical | CAS No. | OECD Classification from Lynch et al. (2017) | Potency—Reference Antagonist Classification From Kleinstreuer et al. (2017) | AR Biomarker −Log(p-value)s for Chemicals Run in Antagonist Mode | AR Classification Based on Biomarker |
|---|---|---|---|---|---|
| 17-β-Trenbolone | 10161-33-8 | Agonist | 0 | Inactive | |
| Androstenedione | 63-05-8 | Agonist | Negative | 0.761452 | Inactive |
| Dexamethasone | 50-02-2 | Agonist | 4.886057 | Agonist | |
| 5-α-Dihydrotestosterone | 521-18-6 | Agonist | 4 | Agonist | |
| Methyl testosterone | 58-18-4 | Agonist | Negative | 1.138466 | Inactive |
| Testosterone propionate | 58-22-0 | Agonist | Negative | 1.924453 | Inactive |
| Bicalutamide | 90357-06-5 | Antagonist | Strong | −37.9208 | Antagonist |
| Bisphenol A | 80-05-7 | Antagonist | Moderate/weak | −38.0458 | Antagonist |
| Finasteride | 98319-26-7 | Antagonist | −24.0706 | Antagonist | |
| Flutamide | 13311-84-7 | Antagonist | Moderate/weak | −28.7447 | Antagonist |
| Linuron | 330-55-2 | Antagonist | Moderate/weak | −23.5229 | Antagonist |
| Prochloraz | 67747-09-5 | Antagonist | Moderate/weak | −32.2924 | Antagonist |
| Procymidone | 32809-16-8 | Antagonist | Very Weak | −40.2147 | Antagonist |
| Progesterone | 57-83-0 | Antagonist | −3.69897 (*) | Inactive | |
| Vinclozolin | 50471-44-8 | Antagonist | Moderate/weak | −52.699 | Antagonist |
| Cyproterone acetate | 427-51-0 | Both | Moderate | −3 (#) | Inactive |
| Hydroxyflutamide | 52806-53-8 | Both | Strong | −16.0605 | Antagonist |
| Mifepristone | 84371-65-3 | Both | Strong/Moderate | −10.5686 | Antagonist |
| Spironolactone | 52-01-7 | Both | Strong/Moderate | −6.76955 | Antagonist |
| Apigenin | 520-36-5 | Negative | −18.4559 (*) | Antagonist | |
| Atrazine | 1912-24-9 | Negative | Negative | 0 | Inactive |
| Fenitrothion | 122-14-5 | Strong | −38.9586 | Antagonist | |
| p,p′-DDE | 72-55-9 | Weak | −15.699 | Antagonist |
Twenty-three reference chemicals with known AR activities were examined for correlation between the AR biomarker and biosets derived from LAPC-4 cells exposed in antagonist mode to the indicated chemicals. The OECD classifications refer simply to whether the chemical is an agonist, antagonist, both an agonist and antagonist, or negative for activity. Blank cells are chemicals that were not classified in the OECD analysis. The column for reference antagonists from the Kleinstreuer et al. (2017) analysis specifies the relative potencies. Chemical classifications based on the microarray experiment that do not agree with OECD classifications (*) or both OECD and Kleinstreuer et al. classifications (#) are indicated after the −Log(p-value)s.
Additional AR reference chemicals were classified based on a systematic literature review in the Kleinstreuer et al. study, a number of which overlapped with the chemicals examined in the LAPC-4 experiment (Table 4). There were 17 overlapping chemicals with antagonist classifications (active or inactive). All chemicals were correctly classified except the false negative cyproterone acetate which was marginally active as an antagonist (−Log(p-value) =−3). The chemicals correctly classified included “weak” (p,p′-DDE) and “very weak” (procymidone) antagonists. Overall, 16 out of the 17 reference chemicals (94%) from Kleinstreuer et al. were correctly classified.
Comparison of AR Biomarker Predictions With Those From an AR Pathway Model
We compared the predictions from an AR pathway model to predictions based on microarray profiles of environmental chemicals generated in our laboratory. The AR pathway model is based on the results of 11 in vitro HTS assays that examined activity at different points in the AR pathway (receptor binding, coregulator recruitment, gene transcription, and protein production); the model was used to predict AR modulation by 1855 chemicals (Kleinstreuer et al. 2017). Agonist and antagonist scores were calculated as the AUC for the chemical relative to the positive control. The higher the AUC, the greater the predicted AR activity (combined potency and efficacy) for that chemical.
Figure 6 shows a comparison of the antagonist predictions based on the –log(p-value)s from the LAPC-4 study and the AR AUC from the Kleinstreuer et al. study for the 28 overlapping chemicals. The –log(p-value)s of the biomarker predictions were rank ordered. Color bars show the classifications of each bioset for prediction of antagonism. There was 1 false positive and 1 false negative. The false negative, cyproterone acetate approached significance (−Log(p-value) =−3). The false positive was the 5-α-reductase inhibitor, finasteride. Using the AR pathway model as the reference dataset, the AR biomarker gave a balanced accuracy of 93% for prediction of suppression (Table 5). The predictive accuracy of the methods was similar (92%) when the 3 biosets used to create the biomarker were removed from the analysis.
Figure 6.

Comparison of AR biomarker predictions to those using high-throughput assays that evaluate AR activity. Predictions of suppression using the AR biomarker were compared with the AR pathway model antagonist activity from Kleinstreuer et al. (2017). The 28 chemicals present in both analyses were rank ordered based on –log(p-value)s. True positives (red), true negatives (black), a false positive (blue), and a false negative (yellow) classifications are indicated. (For interpretation of the references to color in this figure legend, the reader is referred to the web version of this article.)
Table 5.
Summary of the Sensitivity and Specificity of the AR Biomarker Predictions for Antagonism Compared With the AR Pathway Model
| Suppression-All Biosets | Suppression-Without Biomarker Biosets | |
|---|---|---|
| True positives | 16 | 13 |
| True negatives | 10 | 10 |
| False positives | 1 | 1 |
| False negatives | 1 | 1 |
| Sensitivity | 0.941 | 0.930 |
| Specificity | 0.909 | 0.909 |
| Positive predictive value | 0.941 | 0.929 |
| Negative predictive value | 0.909 | 0.909 |
| Balanced accuracy | 0.925 | 0.919 |
The biomarker-based predictions from LAPC-4 chemical treatment biosets were compared to the results of the AR pathway model for 28 or 25 chemicals (Kleinstreuer et al. 2017).
The Biomarker can Identify Chemicals That Suppress AR by Diverse Mechanisms
We examined additional chemicals not discussed above that had predicted effects on AR activity. A number of chemicals not commonly known as AR modulators were found to act as AR suppressors (Figure 7). Treatment by the HDAC inhibitor, trichostatin A, led to gene expression indicative of AR suppression in 2 studies carried out in LNCaP cells (GSE8645, GSE20433) but not in PC3 cells (GSE5258). Trichostatin A suppressed AR gene expression in prostate cancer cell lines (Rokhlin et al. 2006; Welsbie et al. 2009). Treatment with the HSP90 inhibitor 17-(allylamino)-17-demethoxygeldanamycin (also known as Tanespimycin; 17-AAG) was found to impair AR chromatin binding and nuclear localization of AR (Centenera et al. 2015). Treatment with the retinoic acid receptor–related orphan receptor (ROR) γ-specific antagonists, XY011 and SR2211, suppressed AR in C4-2B cells (GSE72483). These RORγ antagonists suppress the expression of AR and regulated genes in prostate cancer cell lines and tumors (Wang et al. 2016). Treatment of VCaP cells by “Compound 30” suppressed AR (from GSE32892). Compound 30 was found to be a potent AR antagonist (Zhu et al. 2012). Urolithin A, derived from walnut pedunculagin, was found to suppress AR at 24 h in LNCaP cells using the biomarker (GSE65527). In another study, urolithin A induced apoptosis in LNCaP cells, most likely through a p53-dependent response and decreased expression of AR mRNA and protein (Sanchez-Gonzalez et al. 2016). Finally, whereas not a chemical, the sequence-specific DNA binding “polyamine 1” which blocks the ability of AR to bind to AREs in target genes (Nickols and Dervan 2007) acted like an antagonist. We note the possibility that some of the compounds identified as putative AR modulators may be false positives due in part to the large number of gene expression changes induced upon exposure, especially for trichostatin A. Further work is needed to validate these findings.
Figure 7.
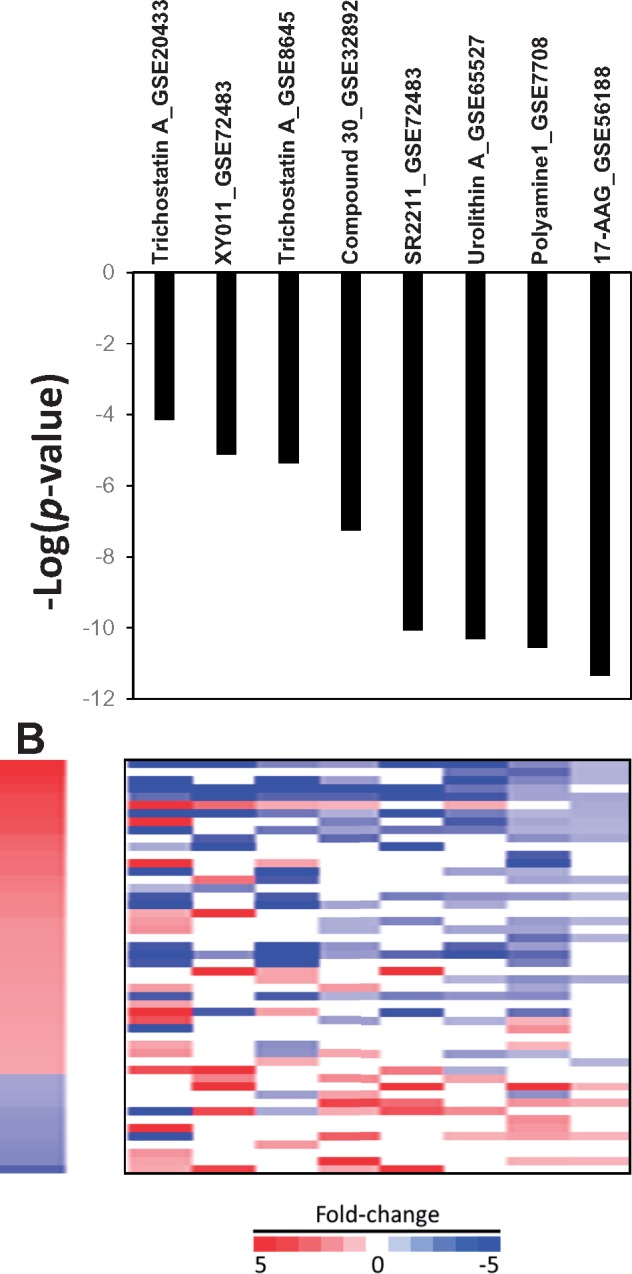
The biomarker correctly identifies treatments that indirectly affect AR activity. See text for descriptions of how the treatments suppress AR activity.
DISCUSSION
High-throughput transcriptomic (HTTr) technologies have the potential to identify EDCs in in vitro screens of environmental chemicals. Our group has previously determined that a biomarker approach can be used to accurately identify ER modulators in a large compendium of microarray profiles derived from chemically treated human breast cancer MCF-7 cells (Ryan et al. 2016). In the present study, we used similar computational methods to determine if our approach can also identify modulators of AR, one of the most important and well-studied EDC targets. A weight of evidence approach was taken to identify genes that were consistently regulated under chemical exposure and genetic modulation conditions expected to either activate or suppress AR activity. The 51-gene biomarker used in conjunction with a pattern matching approach could readily identify, in a large gene expression prostate cancer cell line compendium, chemical and genetic perturbation experiments known to modulate AR. These included (1) numerous comparisons in which cells were exposed to AR agonists (DHT, R-1881) or AR antagonists (bicalutamide, enzalutamide), (2) genetic modulation of the AR gene, and (3) depletion of androgens. The approach was found to be very predictive in identifying AR modulators with accuracies of 97% or 98% for activation or suppression, respectively. In independent experiments the AR-positive LAPC-4 cell line was exposed to 28 chemicals in antagonist mode to determine if we could replicate the predictions of an AR pathway model (Kleinstreuer et al. 2017). Our methods gave a balanced accuracy of 93% for suppression. The results indicate that our approach could be reliably used as a Tier 0 screen in the context of a larger HTTr profiling effort similar to those ongoing in the ToxCast screening program (Shah et al. 2018).
To provide an appropriate cellular context for chemical screening, a compendium of gene expression comparisons (also called biosets) was assembled from experiments carried out in human prostate cancer cell lines. More than 1500 biosets were identified and annotated from curated studies found in a commercially available gene expression database (BSCE). The final compendium contains over 1600 biosets from chemically treated cells, most of which came from the CMAP 2.0 study carried out in the AR-negative PC3 cell line (Lamb et al. 2006). Approximately 205 biosets came from studies using LNCaP and VCaP cell lines which have been extensively used as models for characterization of prostate cancer treatment strategies and to identify AR modulating chemicals. These cell lines are not ideal models for chemical screening. The LNCaP cell line expresses an AR that contains a mutation in the LBD leading to promiscuous activation by some chemicals (Veldscholte et al. 1992), and the VCaP cell line contains ≥10-fold receptor mRNA and protein than LNCaP cells because of amplification of the AR locus (Makkonen et al. 2011). For our chemical screening, we chose the LAPC-4 cell line which expresses a wild-type AR with no evidence of amplification (Watson et al. 2015). Prior to our study, only 1 chemical had been profiled in this cell line and found in our compendium (from GSE78201). We profiled 28 chemicals with known activities to AR in LAPC-4 cells and determined that our biological model and computational techniques were a useful combination for screening. To our knowledge, the present study is the first to utilize full genome arrays to identify AR modulators. A previous study used a targeted set of 27 genes to screen approximately 2500 chemicals in LNCaP cells to identify AR suppressors (Hieronymus et al. 2006). Our compendium will be a useful database for future studies to link chemical exposure to molecular initiating events and key events that can help to populate predictive models for adverse outcomes within a network of AOPs (Edwards et al. 2015). The development of methods to identify chemicals that modulate an important MIE linked to endocrine disruption and cancer is one application of this compendium.
Our biomarker selection procedures identified bona fide primary target genes of AR. The biomarker genes were selected in an unbiased manner using several filters (Figure 2A). These included a chemical filter that selected genes commonly regulated by 4 agonists. In addition to the well-known agonists R-1881, androstenedione and dexamethasone, we included the strong agonist RTI-6413-018 identified in a screen for compounds that induce an “activating” conformational change in the receptor structure but that do not facilitate a high-affinity intermolecular interaction between the amino and carboxyl termini; compounds identified in this manner behaved as partial agonists of AR-mediated transcription in a variety of assays (Sathya et al. 2003). The agonist screen was followed by selection of genes that were regulated in an opposite manner by 4 structurally diverse antagonists (bicalutamide, triticonazole, tubuconazole, and vinclozalin). A genetic filter was used to further filter genes that were the most likely targets of AR and would be less likely to be involved in secondary responses after AR modulation, eg, modulation of cell growth. The genetic filter capitalized on available biosets from chemical-independent comparisons either between mutants in the LBD of AR that exhibit constitutive activity versus wild-type AR or between knockdown of expression of AR versus controls. Most (90%) of the resulting 51 genes in the biomarker were found to be direct targets of AR as determined by ChIP-Seq experiments, with 42% of the associated ChIP-seq regions falling within 10 kb of the transcription start site of the biomarker genes (Supplementary File 1). Some of these regions bound by AR contain an ARE motif indicating this interaction is due to direct binding of AR to the promoter or enhancer regions (Supplementary File 1). Most of the genes exhibited altered expression in the expected direction when compared with additional biosets when AR expression or activity was genetically modulated (Figure 5A). The biomarker genes exhibited expected changes in expression after chemical exposure in 3 AR-positive cancer cell lines (LAPC-4, LNCaP, VCaP) but not in an AR-negative prostate cancer cell line (PC3). Taken together, our procedures identified AR-regulated genes that could be useful in classifying chemicals for AR modulation.
To screen for chemicals that modulate AR, the biomarker was compared with individual biosets in the prostate compendium using the fold-change, rank-based nonparametric Running Fisher algorithm (Kupershmidt et al. 2010). The approach finds, in an unsupervised manner, biosets with expression patterns of biomarker genes with statistically significant positive or negative correlation corresponding to activation or suppression of AR. Agonist activity can be detected in biosets from cells treated with DHT or R-1881 versus control cells (Figure 3B). Antagonist-like activity can be most reliably detected by examination of chemical effects in the presence of a strong AR agonist compared with agonist alone (antagonist mode). In our preliminary studies, exposure of LAPC-4 to antagonists by themselves did not affect the AR-dependent biomarker genes (data not shown). Rather, their detection required the assay to be run in antagonist mode. We had determined through a titration of R-1881 transcriptional effects that a concentration of 0.33 nM of R-1881 was sufficient to readily detect 3 known antagonists. In contrast, antagonist activity of bicalutamide or enzalutamide was often detectable in LNCaP or VCaP cells without running the assay in antagonist mode. This antagonism can be explained by their ability to suppress the background level of AR activation. We hypothesize that this background AR activation is due in part to the level of androgens in the media. LNCaP cells are typically cultured in 10% fetal calf serum supplemented media which contains 55−98 pM of total testosterone (Sedelaar and Isaacs 2009). LNCaP cells concentrate and metabolize testosterone to produce a physiological (ie, approximately 10 nM) level of intracellular DHT which stimulates the growth of these cells in vitro (Sedelaar and Isaacs 2009) and likely contributes to the background level of AR activation. Thus, LNCaP cells (but not LAPC-4 cells) might be useful to screen for both agonists and antagonists simultaneously (in the absence of the required exposure to a reference agonist), similar to what we showed for MCF-7 cells which when cultured in complete media can be used to simultaneously identify both agonists and antagonists of ER (Ryan et al. 2016).
The use of our methods resulted in excellent predictive accuracy to identify AR active compounds. Using 158 biosets from cells treated with 98 chemicals with known AR activity, a test for prediction of activation or suppression resulted in balanced accuracies of 97% or 98%, respectively (Figure 4). This high level of accuracy demonstrated the robustness of the computational procedures to identify AR modulators even though the biosets were derived from experiments with various exposure conditions carried out in different laboratories that queried gene expression using different microarray platforms (data not shown). The accuracy is consistent with our past experience identifying chemical modulators of other transcription factors in the mouse liver (Oshida et al. 2015a,b,c) and MCF-7 cells (Ryan et al. 2016). The computational approach used in these studies will be useful for the future assessment of chemical modulation of other transcription factors and could be adapted to predict key events downstream of MIE modulation such as cell proliferation.
The biomarker predictions were compared with the predictions from an AR pathway model based on 11 in vitro HTS assays which examined different endpoints of AR activity carried out as part of the EDSP HTS program (Kleinstreuer et al. 2017). Remarkably, accuracy tests for AR suppression gave a balanced accuracy of 93% (Figure 6). The biomarker was able to identify chemicals that were classified as “weak” (p,p′-DDE) or “very weak” (procymidone) antagonists. There was 1 false positive and 1 false negative. The false negative cyproterone acetate approached significance. The false positive was the 5α-reductase inhibitor finasteride. Finasteride is an OECD reference antagonist for the rodent Hershberger assay, and was identified as an antagonist in the 2 Tox21 AR antagonist assays (Lynch et al. 2017). Although further work is needed, the results indicate that under some screening conditions, blocking 5α-reductase activity may indirectly suppress AR by decreasing the levels of the more potent AR activator DHT compared with testosterone. If finasteride is considered a true positive for antagonism, then the balanced accuracy increases to 95%.
Examination of additional chemicals in the prostate cancer cell compendium indicated that our methods can identify chemicals that affect AR activity indirectly. Four chemicals (trichostatin A, XY011, SR2211, urolithin A) were identified as potential antagonists (Figure 7). All 4 were shown in previous studies to decrease the expression of the AR gene (Rokhlin et al. 2006; Sanchez-Gonzalez et al. 2016; Wang et al. 2016; Welsbie et al. 2009). XY011 and SR2211 are antagonists of RORγ which positively regulates AR expression (Wang et al. 2016). The mechanism by which trichostatin A suppresses AR expression is unknown (Rokhlin et al. 2006; Welsbie et al. 2009). Thus, our screening methods identified 4 conditions in which AR was modulated: Agonism, antagonism, suppression of AR expression, and depletion of androgens in the media. It should be noted that the ability of our methods to identify chemicals that modulate AR activity through other mechanisms such as inhibition of 5α-reductase and steroidogenesis remains to be determined.
In summary, we applied gene expression-based computational procedures to screen chemicals for AR activity that closely replicate the results of 11 HTS assays. High-throughput transcript profiling in an AR positive prostate cancer cell line such as LAPC-4 cells for AR modulators could complement the current screening paradigm by serving as a Tier 0 screen which could be followed by more targeted assays to uncover the underlying mechanism of action.
SUPPLEMENTARY DATA
Supplementary data are available at Toxicological Sciences online.
Supplementary Material
ACKNOWLEDGMENTS
This study was carried out as part of the EPA High Throughput Testing project within the chemical safety for sustainability (CSS) program. The information in this document has been funded in part by the U.S. Environmental Protection Agency. This research was supported in part by a postdoctoral appointment (for Rooney) to the Research Participation Program for the U.S. Environmental Protection Agency, Office of Research and Development, administered by the Oak Ridge Institute for Science and Education through an interagency agreement between the U.S. Department of Energy and EPA. The views expressed in this paper are those of the authors and do not necessarily reflect the statements, opinions, views, conclusions, or policies of the United States EPA. The authors declare they have no actual or potential competing financial interests. This study has been subjected to review by the National Health and Environmental Effects Research Laboratory and approved for publication. Approval does not signify that the contents reflect the views of the Agency, nor does mention of trade names or commercial products constitute endorsement or recommendation for use. We thank Dr Caitlin Lynch for the results from the Tox21 HTS AR assays, Mr Chuck Gaul for assistance in making the figures, the NHEERL Genomics Core for processing the Illumina arrays, Drs Chad Deisenroth and Keith Houck for critical review of the manuscript, Dr Ann Richard for the ToxCast chemicals, Drs James Flynn and Joe Delaney for assistance with BSCE, and Dr Robert Reiter for the LAPC-4 cells.
REFERENCES
- Centenera M. M., Carter S. L., Gillis J. L., Marrocco-Tallarigo D. L., Grose R. H., Tilley W. D., Butler L. M. (2015). Co-targeting AR and HSP90 suppresses prostate cancer cell growth and prevents resistance mechanisms. Endocr. Relat. Cancer 22, 805–818. [DOI] [PubMed] [Google Scholar]
- Chng K. R., Chang C. W., Tan S. K., Yang C., Hong S. Z., Sng N. Y., Cheung E. (2012). A transcriptional repressor co-regulatory network governing androgen response in prostate cancers. EMBO J. 31, 2810–2823. [DOI] [PMC free article] [PubMed] [Google Scholar]
- Claessens F., Joniau S., Helsen C. (2017). Comparing the rules of engagement of androgen and glucocorticoid receptors. Cell. Mol. Life Sci. 74, 2217–2228. [DOI] [PMC free article] [PubMed] [Google Scholar]
- Cottard F., Asmane I., Erdmann E., Bergerat J. P., Kurtz J. E., Ceraline J. (2013). Constitutively active androgen receptor variants upregulate expression of mesenchymal markers in prostate cancer cells. PLoS One 8, e63466.. [DOI] [PMC free article] [PubMed] [Google Scholar]
- Cox L. A., Popken D., Marty M. S., Rowlands J. C., Patlewicz G., Goyak K. O., Becker R. A. (2014). Developing scientific confidence in HTS-derived prediction models: Lessons learned from an endocrine case study. Regul. Toxicol. Pharmacol. 69, 443–450. [DOI] [PubMed] [Google Scholar]
- Diamanti-Kandarakis E., Bourguignon J. P., Giudice L. C., Hauser R., Prins G. S., Soto A. M., Zoeller R. T., Gore A. C. (2009). Endocrine-disrupting chemicals: An Endocrine Society scientific statement. Endocr. Rev. 30, 293–342. [DOI] [PMC free article] [PubMed] [Google Scholar]
- Edwards S. W., Tan Y. M., Villeneuve D. L., Meek M. E., McQueen C. A. (2015). Adverse outcome pathways-organizing toxicological information to improve decision making. J. Pharmacol. Exp. Ther. 356, 170–181. [DOI] [PubMed] [Google Scholar]
- Filer D., Patisaul H. B., Schug T., Reif D., Thayer K. (2014). Test driving ToxCast: Endocrine profiling for 1858 chemicals included in phase II. Curr. Opin. Pharmacol. 19, 145–152. [DOI] [PMC free article] [PubMed] [Google Scholar]
- Gonit M., Zhang J., Salazar M., Cui H., Shatnawi A., Trumbly R., Ratnam M. (2011). Hormone depletion-insensitivity of prostate cancer cells is supported by the AR without binding to classical response elements. Mol. Endocrinol. 25, 621–634. [DOI] [PMC free article] [PubMed] [Google Scholar]
- Guseva N. V., Rokhlin O. W., Bair T. B., Glover R. B., Cohen M. B. (2012). Inhibition of p53 expression modifies the specificity of chromatin binding by the androgen receptor. Oncotarget 3, 183–194. [DOI] [PMC free article] [PubMed] [Google Scholar]
- Hara T., Miyazaki J., Araki H., Yamaoka M., Kanzaki N., Kusaka M., Miyamoto M. (2003). Novel mutations of androgen receptor: A possible mechanism of bicalutamide withdrawal syndrome. Cancer Res. 63, 149–153. [PubMed] [Google Scholar]
- Hieronymus H., Lamb J., Ross K. N., Peng X. P., Clement C., Rodina A., Nieto M., Du J., Stegmaier K., Raj S. M., et al. (2006). Gene expression signature-based chemical genomic prediction identifies a novel class of HSP90 pathway modulators. Cancer Cell 10, 321–330. [DOI] [PubMed] [Google Scholar]
- Hu R., Dunn T. A., Wei S., Isharwal S., Veltri R. W., Humphreys E., Han M., Partin A. W., Vessella R. L., Isaacs W. B., et al. (2009). Ligand-independent androgen receptor variants derived from splicing of cryptic exons signify hormone-refractory prostate cancer. Cancer Res. 69, 16–22. [DOI] [PMC free article] [PubMed] [Google Scholar]
- Judson R., Houck K., Martin M., Knudsen T., Thomas R. S., Sipes N., Shah I., Wambaugh J., Crofton K. (2014). In vitro and modelling approaches to risk assessment from the U.S. Environmental Protection Agency ToxCast programme. Basic Clin. Pharmacol. Toxicol. 115, 69–76. [DOI] [PubMed] [Google Scholar]
- Judson R., Houck K., Martin M., Richard A. M., Knudsen T. B., Shah I., Little S., Wambaugh J., Setzer R. W., Kothiya P., et al. (2016). Analysis of the effects of cell stress and cytotoxicity on in vitro assay activity across a diverse chemical and assay space. Toxicol. Sci. 153, 409.. [DOI] [PMC free article] [PubMed] [Google Scholar]
- Judson R. S., Magpantay F. M., Chickarmane V., Haskell C., Tania N., Taylor J., Xia M., Huang R., Rotroff D. M., Filer D. L., et al. (2015). Integrated model of chemical perturbations of a biological pathway using 18 in vitro high-throughput screening assays for the estrogen receptor. Toxicol. Sci. 148, 137–154. [DOI] [PMC free article] [PubMed] [Google Scholar]
- Klein K. A., Reiter R. E., Redula J., Moradi H., Zhu X. L., Brothman A. R., Lamb D. J., Marcelli M., Belldegrun A., Witte O. N., et al. (1997). Progression of metastatic human prostate cancer to androgen independence in immunodeficient SCID mice. Nat. Med. 3, 402–408. [DOI] [PubMed] [Google Scholar]
- Kleinstreuer N. C., Ceger P., Watt E. D., Martin M., Houck K., Browne P., Thomas R. S., Casey W. M., Dix D. J., Allen D., et al. (2017). Development and validation of a computational model for androgen receptor activity. Chem. Res Toxicol. 30, 946–964. [DOI] [PMC free article] [PubMed] [Google Scholar]
- Kleinstreuer N. C., Yang J., Berg E. L., Knudsen T. B., Richard A. M., Martin M. T., Reif D. M., Judson R. S., Polokoff M., Dix D. J., et al. (2014). Phenotypic screening of the ToxCast chemical library to classify toxic and therapeutic mechanisms. Nat. Biotechnol. 32, 583–591. [DOI] [PubMed] [Google Scholar]
- Korpal M., Korn J. M., Gao X., Rakiec D. P., Ruddy D. A., Doshi S., Yuan J., Kovats S. G., Kim S., Cooke V. G., et al. (2013). An F876L mutation in androgen receptor confers genetic and phenotypic resistance to MDV3100 (enzalutamide). Cancer Discov. 3, 1030–1043. [DOI] [PubMed] [Google Scholar]
- Kupershmidt I., Su Q. J., Grewal A., Sundaresh S., Halperin I., Flynn J., Shekar M., Wang H., Park J., Cui W., et al. (2010). Ontology-based meta-analysis of global collections of high-throughput public data. PLoS One 5, e13066.. [DOI] [PMC free article] [PubMed] [Google Scholar]
- Lamb J., Crawford E. D., Peck D., Modell J. W., Blat I. C., Wrobel M. J., Lerner J., Brunet J. P., Subramanian A., Ross K. N., et al. (2006). The connectivity map: Using gene-expression signatures to connect small molecules, genes, and disease. Science 313, 1929–1935. [DOI] [PubMed] [Google Scholar]
- Larman H. B., Scott E. R., Wogan M., Oliveira G., Torkamani A., Schultz P. G. (2014). Sensitive, multiplex and direct quantification of RNA sequences using a modified RASL assay. Nucleic Acids Res. 42, 9146–9157. [DOI] [PMC free article] [PubMed] [Google Scholar]
- Li L., Chang W., Yang G., Ren C., Park S., Karantanos T., Karanika S., Wang J., Yin J., Shah P. K., et al. (2014). Targeting poly(ADP-ribose) polymerase and the c-Myb-regulated DNA damage response pathway in castration-resistant prostate cancer. Sci. Signal 7, ra47.. [DOI] [PMC free article] [PubMed] [Google Scholar]
- Lin B., Wang J., Hong X., Yan X., Hwang D., Cho J. H., Yi D., Utleg A. G., Fang X., Schones D. E., et al. (2009). Integrated expression profiling and ChIP-seq analyses of the growth inhibition response program of the androgen receptor. PLoS One 4, e6589.. [DOI] [PMC free article] [PubMed] [Google Scholar]
- Lynch C., Sakamuru S., Huang R., Stavreva D. A., Varticovski L., Hager G. L., Judson R. S., Houck K. A., Kleinstreuer N. C., Casey W., et al. (2017). Identifying environmental chemicals as agonists of the androgen receptor by using a quantitative high-throughput screening platform. Toxicology 385, 48–58. [DOI] [PMC free article] [PubMed] [Google Scholar]
- Makkonen H., Kauhanen M., Jaaskelainen T., Palvimo J. J. (2011). Androgen receptor amplification is reflected in the transcriptional responses of Vertebral-Cancer of the Prostate cells. Mol. Cell Endocrinol. 331, 57–65. [DOI] [PubMed] [Google Scholar]
- Massie C. E., Lynch A., Ramos-Montoya A., Boren J., Stark R., Fazli L., Warren A., Scott H., Madhu B., Sharma N., et al. (2011). The androgen receptor fuels prostate cancer by regulating central metabolism and biosynthesis. EMBO J. 30, 2719–2733. [DOI] [PMC free article] [PubMed] [Google Scholar]
- Nickols N. G., Dervan P. B. (2007). Suppression of androgen receptor-mediated gene expression by a sequence-specific DNA-binding polyamide. Proc. Natl. Acad. Sci. USA. 104, 10418–10423. [DOI] [PMC free article] [PubMed] [Google Scholar]
- Oshida K., Vasani N., Jones C., Moore T., Hester S., Nesnow S., Auerbach S., Geter D. R., Aleksunes L. M., Thomas R. S., et al. (2015a). Identification of chemical modulators of the constitutive activated receptor (CAR) in a gene expression compendium. Nucl. Recept. Signal 13, e002. [DOI] [PMC free article] [PubMed] [Google Scholar]
- Oshida K., Vasani N., Thomas R. S., Applegate D., Gonzalez F. J., Aleksunes L. M., Klaassen C. D., Corton J. C. (2015b). Screening a mouse liver gene expression compendium identifies modulators of the aryl hydrocarbon receptor (AhR). Toxicology 336, 99–112. [DOI] [PMC free article] [PubMed] [Google Scholar]
- Oshida K., Vasani N., Thomas R. S., Applegate D., Rosen M., Abbott B., Lau C., Guo G., Aleksunes L. M., Klaassen C., et al. (2015c). Identification of modulators of the nuclear receptor peroxisome proliferator-activated receptor alpha (PPARalpha) in a mouse liver gene expression compendium. PLoS One 10, e0112655.. [DOI] [PMC free article] [PubMed] [Google Scholar]
- Rokhlin O. W., Glover R. B., Guseva N. V., Taghiyev A. F., Kohlgraf K. G., Cohen M. B. (2006). Mechanisms of cell death induced by histone deacetylase inhibitors in androgen receptor-positive prostate cancer cells. Mol. Cancer Res. 4, 113–123. [DOI] [PubMed] [Google Scholar]
- Rotroff D. M., Martin M. T., Dix D. J., Filer D. L., Houck K. A., Knudsen T. B., Sipes N. S., Reif D. M., Xia M., Huang R., et al. (2014). Predictive endocrine testing in the 21st century using in vitro assays of estrogen receptor signaling responses. Environ. Sci. Technol. 48, 8706–8716. [DOI] [PubMed] [Google Scholar]
- Ryan N., Chorley B., Tice R. R., Judson R., Corton J. C. (2016). Moving toward integrating gene expression profiling into high-throughput testing: A gene expression biomarker accurately predicts estrogen receptor alpha modulation in a microarray compendium. Toxicol. Sci. 151, 88–103. [DOI] [PMC free article] [PubMed] [Google Scholar]
- Sanchez-Gonzalez C., Ciudad C. J., Izquierdo-Pulido M., Noe V. (2016). Urolithin A causes p21 up-regulation in prostate cancer cells. Eur. J. Nutr. 55, 1099–1112. [DOI] [PubMed] [Google Scholar]
- Sathya G., Chang C. Y., Kazmin D., Cook C. E., McDonnell D. P. (2003). Pharmacological uncoupling of androgen receptor-mediated prostate cancer cell proliferation and prostate-specific antigen secretion. Cancer Res. 63, 8029–8036. [PubMed] [Google Scholar]
- Sedelaar J. P., Isaacs J. T. (2009). Tissue culture media supplemented with 10% fetal calf serum contains a castrate level of testosterone. Prostate 69, 1724–1729. [DOI] [PMC free article] [PubMed] [Google Scholar]
- Shah I., Harrill J., Setzer R. W., Haggard D., Karmaus A., Martin M. T., Thomas R. S. (2018). Predicting chemical mechanisms of action using high-throughput transcriptomic data. Toxicologist 162, 1689. [Google Scholar]
- Smalley J. L., Gant T. W., Zhang S. D. (2010). Application of connectivity mapping in predictive toxicology based on gene-expression similarity. Toxicology 268, 143–146. [DOI] [PubMed] [Google Scholar]
- Veldscholte J., Berrevoets C. A., Ris-Stalpers C., Kuiper G. G., Jenster G., Trapman J., Brinkmann A. O., Mulder E. (1992). The androgen receptor in LNCaP cells contains a mutation in the ligand binding domain which affects steroid binding characteristics and response to antiandrogens. J. Steroid Biochem. Mol. Biol. 41, 665–669. [DOI] [PubMed] [Google Scholar]
- Wang J., Zou J. X., Xue X., Cai D., Zhang Y., Duan Z., Xiang Q., Yang J. C., Louie M. C., Borowsky A. D., et al. (2016). ROR-gamma drives androgen receptor expression and represents a therapeutic target in castration-resistant prostate cancer. Nat. Med. 22, 692–496. [DOI] [PubMed] [Google Scholar]
- Waters M. D., Jackson M., Lea I. (2010). Characterizing and predicting carcinogenicity and mode of action using conventional and toxicogenomics methods. Mutat. Res. 705, 184–200. [DOI] [PubMed] [Google Scholar]
- Watson P. A., Arora V. K., Sawyers C. L. (2015). Emerging mechanisms of resistance to androgen receptor inhibitors in prostate cancer. Nat. Rev. Cancer 15, 701–711. [DOI] [PMC free article] [PubMed] [Google Scholar]
- Welsbie D. S., Xu J., Chen Y., Borsu L., Scher H. I., Rosen N., Sawyers C. L. (2009). Histone deacetylases are required for androgen receptor function in hormone-sensitive and castrate-resistant prostate cancer. Cancer Res. 69, 958–966. [DOI] [PMC free article] [PubMed] [Google Scholar]
- Wilson S., Qi J., Filipp F. V. (2016). Refinement of the androgen response element based on ChIP-Seq in androgen-insensitive and androgen-responsive prostate cancer cell lines. Sci. Rep. 6, 32611.. [DOI] [PMC free article] [PubMed] [Google Scholar]
- Yeakley J. M., Shepard P. J., Goyena D. E., VanSteenhouse H. C., McComb J. D., Seligmann B. E. (2017). A trichostatin A expression signature identified by TempO-Seq targeted whole transcriptome profiling. PLoS One 12, e0178302.. [DOI] [PMC free article] [PubMed] [Google Scholar]
- Zhu Z., Shi M., Hu W., Estrella H., Engebretsen J., Nichols T., Briere D., Hosea N., Los G., Rejto P. A., et al. (2012). Dose-dependent effects of small-molecule antagonists on the genomic landscape of androgen receptor binding. BMC Genomics 13, 355. [DOI] [PMC free article] [PubMed] [Google Scholar]
Associated Data
This section collects any data citations, data availability statements, or supplementary materials included in this article.