Fig. 2.

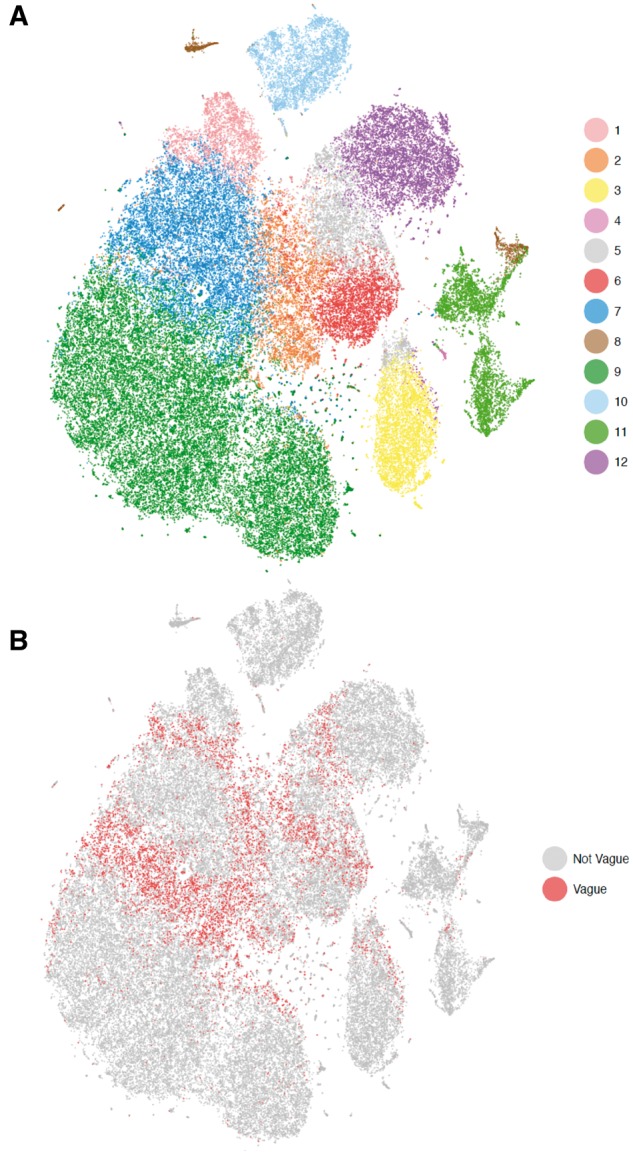
The t-SNE projection of 68K PBMCs, colored by the DIMM-SC clustering assignment (A) and the illustration of vague cells with the largest posterior probability <0.95 (B)

The t-SNE projection of 68K PBMCs, colored by the DIMM-SC clustering assignment (A) and the illustration of vague cells with the largest posterior probability <0.95 (B)