

ABSTRACT
Background
Even before the onset of age-related diseases, obesity might be a contributing factor to the cumulative burden of oxidative stress and chronic inflammation throughout the life course. Obesity may therefore contribute to accelerated shortening of telomeres. Consequently, obese persons are more likely to have shorter telomeres, but the association between body mass index (BMI) and leukocyte telomere length (TL) might differ across the life span and between ethnicities and sexes.
Objective
A collaborative cross-sectional meta-analysis of observational studies was conducted to investigate the associations between BMI and TL across the life span.
Design
Eighty-seven distinct study samples were included in the meta-analysis capturing data from 146,114 individuals. Study-specific age- and sex-adjusted regression coefficients were combined by using a random-effects model in which absolute [base pairs (bp)] and relative telomere to single-copy gene ratio (T/S ratio) TLs were regressed against BMI. Stratified analysis was performed by 3 age categories (“young”: 18–60 y; “middle”: 61–75 y; and “old”: >75 y), sex, and ethnicity.
Results
Each unit increase in BMI corresponded to a −3.99 bp (95% CI: −5.17, −2.81 bp) difference in TL in the total pooled sample; among young adults, each unit increase in BMI corresponded to a −7.67 bp (95% CI: −10.03, −5.31 bp) difference. Each unit increase in BMI corresponded to a −1.58 × 10⁻³ unit T/S ratio (0.16% decrease; 95% CI: −2.14 × 10⁻³, −1.01 × 10⁻³) difference in age- and sex-adjusted relative TL in the total pooled sample; among young adults, each unit increase in BMI corresponded to a −2.58 × 10⁻³ unit T/S ratio (0.26% decrease; 95% CI: −3.92 × 10⁻³, −1.25 × 10⁻³). The associations were predominantly for the white pooled population. No sex differences were observed.
Conclusions
A higher BMI is associated with shorter telomeres, especially in younger individuals. The presently observed difference is not negligible. Meta-analyses of longitudinal studies evaluating change in body weight alongside change in TL are warranted.
Keywords: BMI, telomere length, obesity, low-grade inflammation, meta-analysis, observational studies
INTRODUCTION
Telomeres, the nucleoprotein structures at the ends of chromosomes, shorten with each cell division in somatic cells (1). When telomere length (TL) reaches a critical value, cells either enter a state of senescence or undergo apoptosis (2). Oxidative stress and chronic inflammation are suggested to play a role in accelerated telomere attrition (3–5). Even before the onset of age-related diseases, obesity might be a contributing factor to the cumulative burden of oxidative stress and chronic inflammation throughout the life course, and obesity may therefore contribute to accelerated shortening of telomeres.
Obesity is a growing health problem, and worldwide its prevalence has more than doubled since 1980 (6). In addition, the burden of diabetes and cardiovascular disease is partly attributable to being overweight and obese (6). Tackling obesity might be a starting point to delay telomere shortening and the onset of age-related diseases. Although obesity is associated with shorter telomeres overall (7), studies in the elderly found no relation between TL and obesity and no relation between TL and mortality (8, 9). We hypothesized that obese persons will have shorter telomeres, compared with those of normal weight of the same chronological age, but that the association between obesity and TL will differ across the life span.
Sex and ethnicity may also influence the association between BMI and TL. On average, women have longer telomeres than men (10–12). However, published results on sex differences in associations between BMI and TL are inconsistent (13–15). African Americans and Native Americans have higher rates of obesity (16), and racial differences in TL have frequently been reported in adult African Americans who have longer telomeres than white individuals (17–21), but evidence is lacking with regard to whether the association between BMI and TL differs between ethnicities.
Two recent meta-analyses reported the negative association between BMI and TL on reported summary statistics in the literature, but they did not examine sex differences or the influence of age and ethnicity (7, 22). To further evaluate whether BMI is associated with TL, a large-scale, collaborative, cross-sectional meta-analysis was conducted across observational studies that collected information on BMI and TL of adult individuals. To avoid publication bias and maximize the data in the analyses, a consistent standardized analysis plan across studies was used and principal investigators (PIs) of published studies were contacted and asked to participate in the Telomere Maastricht collaborator (TELOMAAS) group. Because the relation between TL and BMI could be moderated by age, sex, and ethnicity, we completed additional analyses stratifying by these factors.
METHODS
Search strategy
We performed a broad literature search up until 10 November 2017 using PubMed (www.ncbi.nlm.nih.gov/pmc), EMBASE (ovidsp.tx.ovid.com), and the Cochrane (www.cochranelibrary.com) database without restrictions in language or publication date. Numerous studies have measured BMI and TL for purposes other than the association between TL and BMI as an outcome. Therefore, the search was rather broad and not narrowed to TL or BMI. On the basis of the existing relation between obesity, diabetes, and cardiovascular diseases, and because TL is related to aging, we completed a search in which terms related to these conditions were entered. In addition, search items related to study design were entered. The complete search criteria are listed in Supplemental Methods. Citation and reference tracking were performed until no new studies were found. One of the authors (MG) performed the literature search and selected potentially relevant publications. Titles and abstracts of potentially relevant studies were screened. In addition, when the abstract indicated that the article reported a study of diabetes or cardiovascular disease, the full text was screened. No additional restrictions for study design were applied.
Eligibility criteria
Studies were included if height and weight or BMI was collected. The corresponding author was invited to participate in the meta-analysis and identified additional unpublished studies. PIs of these unpublished studies were also invited to participate. Cohort studies in healthy individuals at baseline were included, and if the study design was a case-control study, only controls were included in the meta-analysis. In compiling the database, care was taken to exclude overlapping study cohorts. The study sample (abbreviated as “study”) was taken as the unit for this meta-analysis.
Data extraction
The detailed study protocol can be found in the Supplemental data (“Study Protocol for Participating PIs”). The PI of each study completed a questionnaire and additional information was extracted from the manuscript. The following data were collected: study name; study design (cohort or case-control); sample size (cohort size or control group size); presence of the variables age, sex, and ethnicity [when ≥70% of the individuals of a sample were of a single ethnicity (e.g., white, African American, Native American, Asian, Hispanic), the sample was classified as a sample of a particular ethnicity; when no ethnicity constituted 70% of the sample, the sample was classified as a mixed sample]; leukocyte TL; and BMI (kg/m2) and whether BMI was measured or self-reported; white blood cell types from which DNA was extracted for telomere measurements; and method of TL measurement and of DNA storage (Supplemental Material: Study Protocol for Participating PIs). Two metrics were used for TL: absolute TL in base pairs (bp) and relative TL based on telomere to single-copy gene ratio (T/S ratio) (23). A T/S ratio of 0.8 indicates a relative TL, which is 80% of the reference used (100%).
The PI was free to provide the de-identified raw data or to perform linear regression analyses and provide summary statistics. If the PI provided raw data, one of the authors (MG) conducted the linear regression analyses with TL (bp or T/S ratio) as the outcome and BMI as the independent variable to obtain the summary statistics. Three sex groups were defined: men, women, and a combined group of men and women; 4 age groups were defined: “young” (18–60 y), “middle” (61–75 y), and “old” (>76 y) and a combined group of all subjects regardless of their age. For each study, ≤12 stratified linear regression analyses were conducted (stratified by the 3 sex groups and 4 age groups). The analyses that included all subjects regardless of sex were adjusted for sex; similarly, the analyses that included all subjects regardless of age were adjusted for age.
If the T/S ratio was used to estimate absolute TL without the use of reference DNA with the known absolute TL, the PI was asked to provide new analyses with the T/S ratio as the outcome. If the PI did not respond to this request, absolute TL based on the T/S ratio was used for analyses and included in the analysis. The regression coefficients (β estimates) and SEs were then used in the meta-analyses. In the case of longitudinal data, one randomly selected measurement of TL along with the corresponding BMI and age for that time point were used in the analysis. The summary statistics thus included the results of 12 linear regression analyses, with TL (bp or T/S ratio) as the outcome and BMI as the independent variable.
Assessment of small study effects
To examine the potential presence of publication bias, visual inspection of funnel plots for asymmetry was performed, followed by the Egger and Begg's linear regression test for small study effects (24) and the Duval and Tweedie nonparametric “trim and fill” method (25).
Statistical analysis
Statistical pooling
The primary outcome of the meta-analysis was a pooled estimation of the difference in absolute TL in bp or relative TL (T/S ratio) per unit increase in BMI. Study-specific regression coefficients (β estimates) and SEs were combined by using random-effects pooling in 12 meta-analyses. The assumption of a linear association between BMI and TL was verified by using the raw data provided by the PIs (Supplemental Methods, Supplemental Results).
Assessment of heterogeneity
Details are given in Supplemental Methods. Statistical heterogeneity between studies was estimated by using I2 statistics (26, 27) for each of the 12 meta-analyses. Low heterogeneity was indicated by I2 ≤25%, medium heterogeneity by I2 of 25–50%, and high heterogeneity by I2 >50% (27). To investigate potential effect modification of age and sex, meta-regression analysis was performed with age and sex separately incorporated as covariates. Age was therefore categorized into 3 age categories [“young” (18–60 y), “middle” (61–75 y), and “old” (>75 y)] and also into 2 age categories [“young” (18–60 y) and “other” (>60 y)]. Other potential sources of heterogeneity at the study level (effect modifiers) were also investigated by meta-regression analysis (Supplemental Methods).
Sensitivity analyses
The following sensitivity analyses were performed: 1) outlier analyses by omitting one study at a time, 2) omitting studies with large sample sizes (n >5000), 3) omitting studies that used the relative TL to estimate the absolute TL, 4) stratification by method of measurement of TL [Southern blot compared with quantitative polymerase chain reaction (qPCR)], and 5) using a cutoff of 90% for defining ethnicity (Supplemental Methods).
Statistical analyses were performed with the use of Stata software version 12.0 (StataCorp). All of the statistical tests were 2-sided; P values <0.05 were considered significant, except where otherwise specified.
RESULTS
Search
The search (PubMed, EMBASE, and Cochrane) yielded 5021 publications, from which 173 potentially relevant publications were identified. Some authors contributed to >1 publication. As a result, 153 corresponding authors were identified and contacted. Seventy-five corresponding authors responded positively, 69 authors did not respond, 6 declined to participate, and 3 authors did not have the requested data. Because 1 publication could include multiple studies, the PIs (if not the same as corresponding authors) of the studies were contacted. Eight additional studies were identified by the corresponding authors and the PIs of these additional studies were contacted. We decided to exclude 9 studies that used 1) techniques other than Southern blots and qPCR or 2) did not report TL in bp or T/S ratio, because the regression coefficients (β estimates) may not be directly comparable.
In total, 87 unique studies were included in the meta-analyses. Twenty-nine studies measured absolute TL and 58 studies used the T/S ratio. A flow chart of the inclusion procedure is presented in Figure 1.
FIGURE 1.
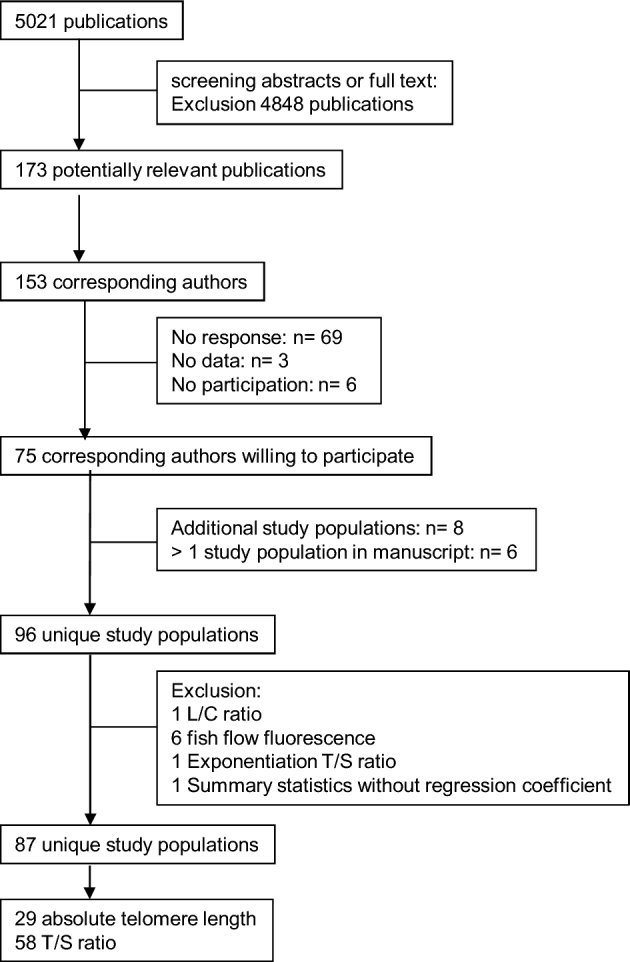
Study inclusion flow chart. L/C ratio, telomere/centromere ratio; T/S ratio, telomere to single-copy gene ratio.
Description of studies
The characteristics of the 87 studies included in this meta-analysis are provided in Table 1. Absolute TLs were obtained from 29 studies (3, 5, 13, 14, 17, 28–61; HyperGEN study, unpublished data S. Hunt, A. Aviv, R. Cawthon 2011), of which 4 studies estimated absolute TL on the basis of the T/S ratio (19, 22, 62–68). In 17 studies, Southern blots were used (3, 5, 13, 14, 17, 28–40, 44, 45, 48–52, 55, 56, 59, 61). Fifty-eight studies presented the relative TL (T/S ratio) (4, 15, 69–133; Utah Pedigree Study, unpublished data S. Hunt, A. Aviv, R. Cawthon 2011). One PI provided the data stratified by source of leukocytes (whole blood compared with buffy coat) (104). One PI provided longitudinal data (55).
TABLE 1.
Characteristics of included study samples1
| Age, n | ||||||||||||||
|---|---|---|---|---|---|---|---|---|---|---|---|---|---|---|
| Ref | Study name | All, n | Men, n | Women, n | 18–60 y | >60– 75 y | >75 y | Cell type | Telomere length measure | DNA | BMI | Data provided | design | Ethnicity (proportion white/ black/Asian/Hispanic/Native American) |
| Absolute telomere length measured in base pairs | ||||||||||||||
| (3, 28–31) | TwinsUK | 3236 | 286 | 2950 | 2630 | 574 | 32 | Leukocytes | Southern blot RF | Stored | Measured | Summary | Cohort | 1/0/0/0/0 |
| (17, 32–34) | Bogalusa | 635 | 635 | 0 | 635 | 0 | 0 | Leukocytes | Southern blot RF | Unknown | Measured | Raw data | Cohort | 0.71/0.29/0/0/0 |
| (147) | India CURES Study | 40 | 20 | 20 | 37 | 3 | 0 | Leukocytes | Southern blot RF | Stored | Measured | Raw data | Case-control | 0/0/1/0/0 |
| (36) | Campania | 528 | 251 | 277 | 320 | 100 | 108 | Leucocytes | Southern blot RF | Stored | Measured | Raw data | Cohort | 1/0/0/0/0 |
| (14, 37–39) | Asklepios | 2509 | 1218 | 1291 | 2509 | 0 | 0 | Leucocytes | Southern blot RF | Stored | Measured | Raw data | Cohort | 1/0/0/0/0 |
| (5, 13, 40) | Framingham | 1146 | 557 | 589 | 658 | 444 | 44 | Leukocytes | Southern blot RF | NA | Measured | Summary | Cohort | 1/0/0/0/0 |
| (42) | COPD | 178 | 89 | 89 | 113 | 60 | 5 | Leukocytes | Real-time PCR | NA | Measured | Raw data | Case-control | 1/0/0/0/0 |
| (43) | Crete | 109 | 109 | 0 | 0 | 0 | 109 | Leukocytes | Real-time PCR | NA | Measured | Raw data | Cohort | 1/0/0/0/0 |
| (41) | Zutphen | 189 | 189 | 0 | 0 | 68 | 121 | Leukocytes | Real-time PCR | NA | Measured | Raw data | Cohort | 1/0/0/0/0 |
| (17) | Family Heart, African American | 625 | 216 | 409 | 459 | 148 | 18 | Leukocytes | Southern blot RF | NA | Measured | Summary | Cohort | 0/1/0/0/0 |
| (17) | Family Heart, white | 2603 | 1170 | 1433 | 1419 | 997 | 187 | Leukocytes | Southern blot RF | NA | Measured | Summary | Cohort | 1/0/0/0/0 |
| Not published | HyperGEN, African American | 224 | 108 | 116 | 172 | 51 | 1 | Leukocytes | Southern blot RF | NA | Measured | Summary | Cohort | 0/1/0/0/0 |
| Not published | HyperGEN, white | 1240 | 612 | 628 | 799 | 426 | 15 | Leukocytes | Southern Blot RF | NA | Measured | Summary | Cohort | 1/0/0/0/0 |
| (44, 45) | LSADT | 525 | 171 | 354 | 0 | 82 | 443 | Leukocytes | Southern blot RF | NA | Measured | Summary | Cohort | 1/0/0/0/0 |
| (46, 47) | Heart and Soul | 954 | 777 | 177 | 274 | 451 | 229 | Leukocytes | Real-time PCR | Unknown | Measured | Summary | Cohort | 0.60/0.16/0.12/0.09/0.03 |
| (57, 58) | Lothian | 1057 | 530 | 527 | 0 | 1057 | 0 | Leucocytes | Real-time PCR | Stored | Measured | Summary | Cohort | 1/0/0/0/0 |
| (48, 49) | WarTwins | 639 | 639 | 0 | 0 | 86 | 553 | Leukocytes | Southern blot RF | Stored | Reported | Raw data | Cohort | 1/0/0/0/0 |
| (55) | Jerusalem LRC | 620 | 413 | 207 | 620 | 0 | 0 | Leukocytes | Southern blot RF | Buffy coat stored | Measured | Summary | Cohort | 1/0/0/0/0 |
| (56) | Jerusalem Palestinians | 939 | 498 | 441 | 336 | 306 | 0 | Leukocytes | Southern blot RF | Buffy coat stored | Measured | Summary | Cross-sectional | 1/0/0/0/0 |
| (50–52) | Helsinki Businessmen Study | 487 | 487 | 0 | 0 | 250 | 237 | Leukocytes | Southern blot RF | Stored | Reported | Raw data | Cohort | 1/0/0/0/0 |
| (53) | Copenhagen General Population Study | 45,069 | 20,422 | 24,647 | 26,040 | 14,525 | 4504 | Leukocytes | Real-time PCR | Stored | Measured | Summary | Cohort | 1/0/0/0/0 |
| (54) | SOLVABLE | 152 | 0 | 152 | 136 | 16 | 0 | PBMCs | Real-time PCR | Stored | Measured | Summary | Case-control | 0.70/0.22/0.03/0.05/0 |
| (59) | ZTL2008 | 25 | 17 | 8 | 24 | 1 | 0 | PBMCs | Southern blot RF | Stored | Measured | Raw data | Cohort | 1/0/0/0/0 |
| (60) | Venado Tuerto 2 | 401 | 0 | 401 | 325 | 63 | 0 | Leukocytes | Real-time PCR | Stored | Measured | Raw data | Cohort | 0/0/0/1/0 |
| (61) | NHSC | 672 | 333 | 339 | 534 | 138 | 0 | Leukocytes | Southern blot RF | Stored | Measured | Summary | Cohort | 0/0/1/0/0 |
| Absolute telomere length estimated from T/S ratio | ||||||||||||||
| (19, 62, 66, 67) | South Carolina | 323 | 145 | 178 | 305 | 18 | 0 | Leukocytes | Real-time PCR | Unknown | Measured | Summary | Cohort | 0.57/0.41/0.01/0.01/0 |
| (63, 64, 68) | Bruneck | 800 | 395 | 405 | 363 | 315 | 122 | Leukocytes | Real-time PCR | Stored | Measured | Summary | Cohort | 1/0/0/0/0 |
| (65) | RPCI | 174 | 0 | 174 | 111 | 47 | 16 | Leukocytes | Real-time PCR | Stored | Reported | Raw data | Case-control | 0.93/0.05/0/0/0.02 |
| (22) | ESTHER | 3559 | 1583 | 1976 | 1432 | 2127 | 0 | Leukocytes | Real-time PCR | Stored | Measured | Summary | Cohort | 1*/0/0/0/0 |
| Telomere length based on T/S ratio | ||||||||||||||
| (15) | MONICA | 511 | 183 | 328 | 419 | 92 | 0 | Leukocytes | Real-time PCR | NA | Measured | Raw data | Cohort | 1/0/0/0/0 |
| (15) | MDCC | 476 | 330 | 146 | 199 | 277 | 0 | Granulocytes | Real-time PCR | NA | Measured | Raw data | Cohort | 1/0/0/0/0 |
| Not published | Utah Pedigree Study | 964 | 493 | 471 | 725 | 183 | 56 | Leukocytes | Real-time PCR | NA | Measured | Summary | Cohort | 1/0/0/0/0 |
| (71, 72) | MESA, white | 182 | 89 | 93 | 80 | 80 | 22 | Leukocytes | Real-time PCR | Stored | Measured | Summary | Cohort | 1/0/0/0/0 |
| (71, 72) | MESA, African American | 278 | 125 | 153 | 141 | 109 | 28 | Leukocytes | Real-time PCR | Stored | Measured | Summary | Cohort | 0/1/0/0/0 |
| (71, 72) | MESA, Hispanic | 518 | 252 | 266 | 245 | 231 | 42 | Leukocytes | Real-time PCR | Stored | Measured | Summary | Cohort | 0/0/0/1/0 |
| (73) | EARSII | 395 | 395 | 0 | 395 | 0 | 0 | Leukocytes | Real-time PCR | Unknown | Measured | Raw data | Case-control | 1/0/0/0/0 |
| (74) | UCLA MacArthur | 233 | 115 | 118 | 0 | 144 | 89 | Leukocytes | Real-time PCR | NA | Reported | Summary | Cohort | 1/0/0/0/0 |
| (75) | Ashkenazi | 359 | 191 | 168 | 50 | 179 | 130 | Leukocytes | Real-time PCR | Stored | Measured | Raw data | Cohort | 1/0/0/0/0 |
| (76) | Warsaw | 714 | 246 | 468 | 235 | 411 | 68 | Leukocytes | Real-time PCR | Stored | Measured | Raw data | Case-control | 1/0/0/0/0 |
| (77) | Finland Health 2000 cohort | 938 | 350 | 588 | 754 | 137 | 47 | Leukocytes | Real-time PCR | Stored | Unknown | Summary | Cohort | 1/0/0/0/0 |
| (78) | Sister Study I (Vanguard sample) | 644 | 0 | 644 | 475 | 169 | 0 | Leukocytes | Real-time PCR | Stored | Measured | Summary | Cohort | 0.83/0.07/0.02/0.02/0.05 |
| (114) | Sister Study II (Genetic Study subcohort) | 734 | 0 | 734 | 548 | 186 | 0 | Leukocytes | Real-time PCR | Stored | Measured | Summary | Cohort | 0.92/0.04/0/0.02/0.02 |
| (79) | CAS | 183 | 96 | 87 | 112 | 53 | 18 | Leukocytes | Real-time PCR | Stored | Measured | Raw data | Case-control | 1/0/0/0/0 |
| (80) | PATH 40 | 331 | 151 | 180 | 331 | 0 | 0 | Leukocytes | Real-time PCR | Stored | Reported | Raw data | Cohort | 0.95/0/0.03/0/0.02 |
| (80) | PATH 60 | 294 | 157 | 137 | 0 | 294 | Leukocytes | Real-time PCR | Stored | Reported | Raw data | Cohort | 0.97/0/0.02/0/0.01 | |
| (81) | Italy alcohol controls | 258 | 258 | 0 | 255 | 3 | 0 | Leukocytes | Real-time PCR | Stored | Reported | Raw data | Case-control | 1/0/0/0/0 |
| (82) | Fels Longitudinal Study | 257 | 116 | 104 | 196 | 54 | 7 | Leukocytes | Real-time PCR | Stored | Measured | Summary | Cohort | 1/0/0/0/0 |
| (83, 84) | ECRAN | 188 | 38 | 150 | 121 | 41 | 26 | PBMCs | Real-time PCR | NA | Measured | Raw data | Cohort | 0/0/0/1/0 |
| (85, 86) | Heart Scan Study | 434 | 206 | 228 | 169 | 259 | 0 | Leukocytes | Real-time PCR | Stored | Measured | Summary | Cohort | 1/0/0/0/0 |
| (87, 88) | Boiler workers | 104 | 104 | 0 | 97 | 7 | 0 | Leukocytes | Real-time PCR | Stored | Measured | Summary | Cohort | 0.85/0.09/0.02/0.03/0 |
| (89, 90) | Mayo | 2886 | 1470 | 1416 | 2001 | 709 | 176 | Leukocytes | Real-time PCR | NA | Measured | Raw data | Case-control | 0.98/0/0.01/0.01/0 |
| (91, 92, 105, 108–111) | HBCS | 1962 | 911 | 1051 | 703 | 1259 | 0 | Leukocytes | Real-time PCR | NA | Measured | Raw data | Cohort | 1/0/0/0/0 |
| (93–95) | PREVEND | 7991 | 3994 | 3997 | 6094 | 1897 | 0 | Leukocytes | Real-time PCR | NA | Measured | Summary | Cohort | 0.96/0.01/0.02/0/0.01 |
| (96, 97, 106, 107) | Strong Heart Family Study | 3256 | 1315 | 1941 | 2834 | 340 | 82 | Leukocytes | Real-time PCR | NA | Measured | Summary | Cohort | 0/0/0/0/1 |
| (98) | PREDIMED-NAVARRA | 521 | 236 | 285 | 81 | 401 | 38 | Leukocytes | Real-time PCR | Stored | Measured | Summary | RCT | 1/0/0/0/0 |
| (99) | NHANES | 7349 | 3542 | 3807 | 5034 | 1564 | 751 | Leukocytes | Real-time PCR | Stored | Measured | Summary | Cohort | 0.52/0.18/0/0.30/0 |
| (100) | SWHS | 2912 | 0 | 2912 | 1812 | 1100 | 0 | Leukocytes | Real-time PCR | NA | Measured | Summary | Cohort | 0/0/1/0/0 |
| (101) | DHS, white | 1073 | 493 | 580 | 821 | 245 | 7 | Leukocytes | Real-time PCR | Stored | Measured | Summary | Cohort | 1/0/0/0/0 |
| (101) | DHS, black | 1667 | 606 | 1061 | 1348 | 317 | 17 | Leukocytes | Real-time PCR | Stored | Measured | Summary | Cohort | 0/1/0/0/0 |
| (101) | DHS, Hispanic | 464 | 194 | 270 | 412 | 51 | 1 | Leukocytes | Real-time PCR | Stored | Measured | Summary | Cohort | 0/0/0/1/0 |
| (102) | DALS | 734 | 401 | 333 | 268 | 366 | 100 | Leukocytes | Real-time PCR | Stored | Measured | Summary | Case-control | 0.96/0/0/0.03/0 |
| (105, 113) | FinnTwin study | 2096 | 1101 | 995 | 1589 | 385 | 122 | Leukocytes | Real-time PCR | NA | Measured | Summary | Cohort | 1/0/0/0/0 |
| (112) | Former Athletes Study | 586 | 586 | 0 | 1 | 376 | 209 | Leukocytes | Real-time PCR | Stored | Measured | Summary | Cohort | 1/0/0/0/0 |
| (104) | USKCS, whole blood | 765 | 442 | 323 | 395 | 320 | 50 | Leukocytes | Real-time PCR | Stored | Measured | Summary | Case-control | 0.61/0.39/0/0/0 |
| (104) | USKCS, buffy coat | 126 | 70 | 56 | 87 | 36 | 3 | Leukocytes | Real-time PCR | Stored | Measured | Summary | Case-control | 0.66/0.34/0/0/0 |
| (103) | Erasmus Rucphen Study | 2449 | 1082 | 1367 | 1900 | 499 | 50 | Leukocytes | Real-time PCR | Stored | Measured | Summary | Case-control | 1/0/0/0/0 |
| (103) | Rotterdam Study | 2231 | 944 | 1287 | 556 | 1272 | 404 | Leukocytes | Real-time PCR | Stored | Measured | Summary | Case-control | 1/0/0/0/0 |
| (103) | KORA F3 | 3113 | 1509 | 1604 | 1768 | 1051 | 294 | Leukocytes | Real-time PCR | Stored | Measured | Summary | Cohort | 1/0/0/0/0 |
| (103) | KORA F4 | 3014 | 1457 | 1557 | 1824 | 943 | 247 | Leukocytes | Real-time PCR | Stored | Measured | Summary | Cohort | 1/0/0/0/0 |
| (148) | CAVASIC | 315 | 315 | 155 | 160 | 0 | Leukocytes | Real-time PCR | Stored | Measured | Summary | Case-control | 1/0/0/0/0 | |
| (103, 149) | SAPHIR | 1681 | 1055 | 626 | 1586 | 95 | 0 | Leukocytes | Real-time PCR | Stored | Measured | Summary | Cohort | 1/0/0/0/0 |
| (115) | CLHNS | 3467 | 893 | 2574 | 3380 | 87 | 0 | Leukocytes | Real-time PCR | Stored | Measured | Summary | Cohort | 0/0/1/0/0 |
| (116) | NEW Study | 437 | 0 | 437 | 304 | 131 | 2 | Leukocytes | Real-time PCR | Stored | Measured | Raw data | Cohort | 0.85/0.08/0.02/0.03/0.02 |
| (117) | NESDO | 495 | 173 | 322 | 17 | 354 | 124 | Leukocytes | Real-time PCR | Stored | Measured | Summary | Cohort | 0.95/0.01/0.04/0/0 |
| (118) | NESDA | 2936 | 986 | 1950 | 2749 | 187 | 0 | Leukocytes | Real-time PCR | Stored | Measured | Summary | Cohort | 0.97/0.02/0.01/0/0 |
| (119) | PRT | 43 | 0 | 43 | 43 | 0 | 0 | Leukocytes | Real-time PCR | Stored | Measured | Raw data | Case-control | ** |
| (120, 121) | UMS | 67 | 67 | 0 | 65 | 1 | 1 | Leukocytes | Real-time PCR | Stored | Measured | Raw data | Cohort | 1/0/0/0/0 |
| (122) | YMCA | 1126 | 1126 | 0 | 1126 | 0 | 0 | Leukocytes | Real-time PCR | Stored | Measured | Raw data | Cohort | 1/0/0/0/0 |
| (123–125) | BASE-II | 1894 | 946 | 948 | 441 | 1409 | 44 | Leukocytes | Real-time PCR | Stored | Measured | Summary | Cohort | 1**/0/0/0/0 |
| (126) | Kyiv | 82 | 20 | 62 | 36 | 33 | 13 | Leukocytes | Real-time PCR | Stored | Measured | Raw data | Cohort | 1/0/0/0/0 |
| (127) | GAHR2 | 133 | 53 | 80 | 128 | 5 | 0 | Leukocytes | Real-time PCR | Stored | Measured | Raw data | Cohort | 0.93/0.01/0.01/0.05/0 |
| (128) | UMED telomere trial | 28 | 7 | 21 | 26 | 2 | 0 | PBMCs | Real-time PCR | Not stored | Measured | Raw data | Cohort | 1/0/0/0/0 |
| (129) | ACCT | 904 | 454 | 450 | 469 | 361 | 74 | Leukocytes | Real-time PCR | Stored | Measured | Summary | Cohort | 0.98/0.01/0.01/0/0 |
| (130) | RPE | 975 | 466 | 509 | 975 | 0 | 0 | Leukocytes | Real-time PCR | Stored | Reported | Raw data | Cohort | 0/0/1/0/0 |
| (131) | Sweden Mindfulness Study | 172 | 21 | 151 | 167 | 5 | 0 | Leukocytes | Real-time PCR | Stored | Reported | Raw data | RCT | 1/0/0/0/0 |
| (132) | EpiDREAM | 4205 | 1565 | 2640 | 3363 | 770 | 72 | Leukocytes | Real-time PCR | Stored | Reported | Summary | — | 0.61/0.08/0.21/0.09/0 |
| (133) | INTERHEART | 3306 | 2601 | 705 | 2092 | 997 | 217 | Leukocytes | Real-time PCR | Stored | Reported | Summary | Case-control | 0.27/0.08/0.44/0.21/0 |
1*Not measured, but all of Eurasian descent; **not measured. ACCT, Anglo-Cardiff Collaborative Trial; BASE-II, Berlin Aging Study; CAS, calcific aortic valve stenosis study; CAVASIC, Cardiovascular Disease in Intermittent Claudication; CLHNS, Cebu Longitudinal Health and Nutrition Survey; COPD, Chronic Obstructive Lung disease cohort; CURES, Chennai Urban Rural Epidemiology Study; DALS, Diet, Activity and Lifestyle Study; DHS, Dallas Heart Study; EARSII, European Atherosclerosis Study II; ECRAN, Envejecimiento y Enfermedades Crónicas Asociadas a Nutrición (Aging and Nutrition Associated Chronic Disease); EpiDREAM, Epidemiologic study of the Screenes for DREAM (Diabetes Reduction Assessment with Ramipril and Rosiglitazone Medication); ESTHER, Epidemiological Study on the Chances of Prevention, Early Recognition, and Optimised Treatment of Chronic Diseases in the Older Population; GAHR2, Prospective evaluation of Gender and Age differences in the impact of Hostility and Reactivity on intermediary coronary artery disease risk factors; HBCS, Helsinki Birth Cohort Study; HyperGEN, Hypertension Genetic Epidemiology Network study; KORA F3, Cooperative Health Research in the Region of Augsburg F3 (2004/2005) survey; KORA F4, Cooperative Health Research in the Region of Augsburg F4 (2006/2008) survey; LRC (Jerusalem), Lipid Research Clinic; LSADT, Longitudinal Study of Aging Danish Twins (https://www.icpsr.umich.edu/icpsrweb/NACDA/studies/21041); MDCC, Malmö Diet and Cancer Cohort; MESA, Multi-Ethnic Study of Atherosclerosis (https://www.mesa-nhlbi.org/); MONICA, Multinational Monitoring of Trends and Determinants in Cardiovascular Disease; NA, not available (data provided by principal investigator); NESDA, The Netherlands Study of Depression and Anxiety; NESDO, The Netherlands Study of Depression in older persons; NEW, Nutrition and Exercise for Women; NHSC, Nutrition and Health in Southwest China study; PATH 40, Personality and Total Health Through Life Project AGE 40-44; PATH 60, Personality and Total Health Through Life Project AGE 60–64; PBMC, peripheral blood mononuclear cell; PCR, polymerase chain reaction; PREDIMED, Prevención con Dieta Mediterránea; PREVEND, Prevention of Renal and Vascular End-stage Disease; PRT, Progressive Resistance Training; RCT, randomized controlled trial; Ref, reference; RF, restriction fragment; RPCI, Roswell Park Cancer Institute; RPE, Richard Paul Ebstein; SAPHIR, Salzburg Atherosclerosis Prevention program in subjects at High Individual Risk Study; SOLVABLE, Study of Lupus Vascular and Bone Longterm Endpoints; summary, summary statistics; SWHS, Shanghai Women's Health Study; T/S ratio, telomere to single-copy gene ratio; UMED, Uniwersytet MEDyczny w Łodzi (Medical University of Lodz (MUL)); UMS, ultra-marathon study; USKCS, US Kidney Cancer Study; YMCA, Young Men Cardiovascular Association; ZTL2008, Zannolli Telomere Length 2008.
The total pooled sample of this meta-analysis consisted of 146,114 adults (40% men), the “young” pooled sample (18–60 y) consisted of 81,446 adults (51% men), the “middle” pooled sample (61–75 y) consisted of 42,991 adults (41% men), and the “old” pooled sample (>75 y) consisted of 8495 adults (65% men). Overall, the majority of the adults were white (including Arab; 83%), followed by Asian (7%), African American (4%), and Hispanic and Native American (both 3%). Six studies provided data of mixed study populations stratified by ethnicity (17, 71, 72, 101, 132, 133; HyperGEN study, unpublished data S. Hunt, A. Aviv, R. Cawthon 2011). Sixty-five studies consisted of >70% white individuals (of which 60 had ≥90% white individuals) (3, 5, 13–15, 17, 22, 28–34, 36–45, 48–59, 63–65, 68, 71–95, 98, 100–103, 105, 108–114, 116–118, 120–129, 131; HyperGEN study, unpublished data S. Hunt, A. Aviv, R. Cawthon 2011; Utah Pedigree Study, unpublished data S. Hunt, A. Aviv, R. Cawthon 2011). Four studies consisted only of African Americans (17, 71, 72, 101; HyperGEN study, unpublished data S. Hunt, A. Aviv, R. Cawthon 2011), 5 only of Asians (35, 61, 100, 115, 130), 1 study only of Native Americans (96, 97, 106, 107), and 4 studies comprised only Hispanics (60, 71, 72, 83, 84, 101). One study could not provide information about ethnicity (119).
Assessment of small study effects
Visual inspection of the funnel plots for absolute TL and for relative TL yielded symmetric plots (Supplemental Figure 1, funnel plots). No publication bias was detected with the use of Egger's test or Begg's test. The “trim and fill” method added 1 hypothetical study to the meta-analysis for absolute TL. However, the recalculated summary estimate did not change and was still significant with its inclusion (β = −3.99; 95% CI: −5.16, −2.84; P < 0.001).
Statistical pooling
A summary of the β estimates of the meta-analysis is shown in Tables 2 and 3. An overview of the meta-analysis is shown Supplemental Tables 2 and 3 in which the β estimates of all meta-analyses for absolute TL as the outcome (Supplemental Table 2) and of all meta-analyses for relative TL as the outcome (Supplemental Table 3) are presented. The accompanying forest plots are presented in the Supplemental Figure 2.
TABLE 2.
Summary of the β estimates (regression coefficients) from the meta-analysis of the association between BMI and telomere length as the outcome and absolute telomere length (in base pairs) as the independent variable1
| Pooled sample3 | |||||||||||||||||
|---|---|---|---|---|---|---|---|---|---|---|---|---|---|---|---|---|---|
| All (total pooled sample)2 | “Young” (18–60 y old) | “Middle”-aged (61–75 y old) | “Old” (>75 y old) | ||||||||||||||
| Line | Ethnicity | n | Estimate | 95% CI | I 2, % | n | Estimate | 95% CI | I 2, % | n | Estimate | 95% CI | I 2, % | n | Estimate | 95% CI | I 2, % |
| 1 | Overall | 29 | −3.99* | −5.17, −2.81* | 0.6 | 23 | −7.67* | −10.03, −5.31* | 31.2 | 22 | −1.65 | −4.41, 1.11 | 19.7 | 16 | −5.89* | −10.41, −1.37* | 5.3 |
| 2 | White | 21 | −4.36* | −5.87, −2.85* | 11.3 | 15 | −8.77* | −10.42, −7.12* | 0.0 | 15 | −2.06* | −4.06, −0.06* | 0.0 | 13 | −6.97* | −12.29, −1.64* | 15.4 |
| 3 | African American | 2 | 0.86 | −4.75, 6.46 | 0.0 | 2 | 0.960 | −5.51, 7.43 | 1.2 | 2 | 4.36 | −7.25, 15.97 | 0.0 | 1 | 74.70 | −76.02, 225.42 | |
| 4 | Hispanic | 1 | 5.97 | −149.97, 161.91 | 1 | −45.64 | −216.24, 124.95 | 1 | 212.68 | −169.98, 595.34 | 0 | ||||||
| 5 | Asian | 2 | −7.65 | −27.20, 11.91 | 0.0 | 2 | −48.70 | −130.38, 32.99 | 10.8 | 1 | 90.00* | 27.28, 152.72* | 0 | ||||
1A random-effects model was used. Statistical heterogeneity was estimated by I2 statistics for each of the meta-analyses. *P < 0.05 or I2 >50%. “n” indicates number of studies.
2Adjusted for age and sex.
3Adjusted for sex.
TABLE 3.
Summary of the β estimates (regression coefficients) from the meta-analysis of the association between BMI and telomere length as the outcome and relative telomere length (T/S ratio) as the independent variable1
| Pooled sample3 | |||||||||||||||||
|---|---|---|---|---|---|---|---|---|---|---|---|---|---|---|---|---|---|
| All (total pooled sample)2 | “Young” (18–60 y old) | “Middle”-aged (61–75 y old) | “Old” (>75 y old) | ||||||||||||||
| Line | Ethnicity | n | Estimate | 95% CI | I 2, % | n | Estimate | 95% CI | I 2, % | n | Estimate | 95% CI | I 2, % | n | Estimate | 95% CI | I 2, % |
| 1 | Overall | 58 | −1.58* | −2.14, −1.01* | 32.7 | 55 | −2.58* | −3.92, −1.25* | 80.0* | 50 | −1.08* | −1.76, −0.39* | 0.0 | 29 | 0.20 | −1.40, 1.80 | 0.0 |
| 2 | White | 43 | −1.87* | −2.44, −1.31* | 8.1 | 40 | −2.80* | −4.77, −0.82* | 84.1* | 37 | −1.65* | −2.45, −0.86* | 0.0 | 21 | −0.28 | −2.29, 1.73 | 0.0 |
| 3 | African American | 2 | 5.66 | −6.60, 17.92 | 80.0* | 2 | 5.21 | −5.67, 16.08 | 68.7 | 2 | 0.08 | −6.20, 6.36 | 0.0 | 1 | −0.74 | −12.62, 11.14 | |
| 4 | Hispanic | 3 | 2.53 | −5.18, 10.25 | 17.7 | 3 | −0.42 | −4.19, 3.34 | 0.0 | 3 | 2.31 | −2.35, 6.97 | 0.0 | 2 | 27.29 | −40.32, 94.61 | 77.7* |
| 5 | Asian | 3 | −1.11 | −4.23, 2.02 | 60.4 | 3 | −4.50* | −5.75, −3.25* | 0.0 | 2 | 2.18 | −2.90, 7.27 | 0.0 | 0 | |||
| 6 | Native American | 1 | −2.64* | −3.60, −1.68* | 1 | −4.14* | −5.28, −3.00* | 1 | 2.23 | −1.00, 5.46 | 1 | 4.68 | −2.35, 11.71 | ||||
1The unit of the estimates and 95% CI of the T/S ratio is 10−3. A random-effects model was used. Statistical heterogeneity was estimated by I2 statistics for each of the meta-analyses. *P < 0.05 or I2 >50%.“n” indicates number of studies. T/S ratio, telomere to single-copy gene ratio.
2Adjusted for age and sex.
3Adjusted for sex.
We confirmed that age was an effect modifier. Because the associations between BMI and TL did not differ significantly between men and women, the results of the sex-specific meta-analyses are shown only in the Supplemental Results.
Overall meta-analysis
Overall, sex- and age-adjusted absolute TL was significantly associated with BMI (Table 2, line 1). Each unit increase in BMI corresponded to a −3.99 bp (95% CI: −5.17, −2.81 bp; I2 = 0.6%) difference in absolute TL (Table 2, line 1; Figure 2). For example, the estimated difference in TL between a normal-weight individual with a BMI of 25 and an obese individual with a BMI >30 is (rounded) >20.0 bp and, if a larger difference is used (BMI: 20 compared with >30), is >39.9 bp. The estimated difference between normal weight and morbid obesity (BMI >40) is >59.9 bp. Overall, each unit increase in BMI corresponded to a −1.58 × 10⁻³ unit T/S ratio (0.16% decrease; 95% CI: −2.14 × 10⁻³, −1.01 ×10⁻³; I2 = 41.1%) difference in age- and sex-adjusted relative TL (Table 3, line 1). The estimated difference in relative TL between normal weight and obesity is a ≥7.9 × 10⁻³ unit (0.79% difference) T/S ratio (Table 3, line 1; Figure 3) and between normal weight and morbid obesity is a ≥23.7 × 10⁻³ unit T/S ratio (2.37% difference).
FIGURE 2.

Forest plot of the β estimates (regression coefficients) from the meta-analysis of the association between BMI and absolute telomere length (base pairs) as the outcome in the total pooled population. Random effect model was used and adjusted for age and sex. Statistical heterogeneity was estimated by I2 statistics for each of the 12 meta-analyses. The shaded boxes indicate the inverse variance weighting of each estimate, and the size of the box indicates the weight. In case no shaded box is visible, the weight is very small. COPD, Chronic Obstructive Lung disease cohort; CURES, Chennai Urban Rural Epidemiology Study; ES, estimate; ESTHER, Epidemiological Study on the Chances of Prevention, Early Recognition, and Optimised Treatment of Chronic Diseases in the Older Population; HyperGEN, Hypertension Genetic Epidemiology Network study; LRC, Lipid Research Clinic; LSADT, Longitudinal Study of Aging Danish Twins (https://www.icpsr.umich.edu/icpsrweb/NACDA/studies/21041); NHSC, Nutrition and Health in Southwest China study; RPCI, Roswell Park Cancer Institute; SOLVABLE, Study of Lupus Vascular and Bone Longterm Endpoints; ZTL2008, Zannolli Telomere Length 2008.
FIGURE 3.

Forest plot of the β estimates (regression coefficients) from the meta-analysis of the association between BMI and relative telomere length (T/S ratio) as outcome in the total pooled population. The unit of the estimates and 95% CI is 10−3. A random-effects model was used and adjusted for age and sex. Statistical heterogeneity was estimated by I2 statistics for each of the 12 meta-analyses. The shaded boxes indicate the inverse variance weighting of each estimate, and the size of the box indicates the weight. In case no shaded box is visible, the weight is very small. ACCT, Anglo-Cardiff Collaborative Trial; BASE-II, Berlin Aging Study; CAS, calcific aortic valve stenosis study; CAVASIC, Cardiovascular Disease in Intermittent Claudication; DALS, Diet, Activity and Lifestyle Study; DHS, Dallas Heart Study; EARSII, European Atherosclerosis Study II; ECRAN, Envejecimiento y Enfermedades Crónicas Asociadas a Nutrición (Aging and Nutrition Associated Chronic Diseas); EPIDREAM, Epidemiologic study of the Screenes for DREAM (Diabetes Reduction Assessment with Ramipril and Rosiglitazone Medication); ES, estimate; GAHR2, Prospective evaluation of Gender and Age differences in the impact of Hostility and Reactivity on intermediary coronary artery disease risk factors; HBCS, Helsinki Birth Cohort Study; KORA F3, Cooperative Health Research in the Region of Augsburg F3 (2004/2005) survey; KORA F4, Cooperative Health Research in the Region of Augsburg F4 (2006/2008) survey; MDCC, Malmö Diet and Cancer Cohort; MESA, Multi-Ethnic Study of Atherosclerosis (https://www.mesa-nhlbi.org/); MONICA, Multinational Monitoring of Trends and Determinants in Cardiovascular Disease; NESDA, The Netherlands Study of Depression and Anxiety; NESDO, The Netherlands Study of Depression in older persons; NHANES, National Health and Nutrition Examination Survey; Not publ, not published; PATH 40, Personality and Total Health Through Life Project AGE 40-44; PATH 60, Personality and Total Health Through Life Project AGE 60-64; PREDIMED, Prevención con Dieta Mediterránea; PREVEND, Prevention of Renal and Vascular End-stage Disease; PRT, Progressive Resistance Training; Ref, reference; RPE, Richard Paul Ebstein; SAPHIR, Salzburg Atherosclerosis Prevention program in subjects at High Individual Risk Study; SWHS, Shanghai Women's Health Study; T/S ratio, telomere to single-copy gene ratio; UMED, Uniwersytet MEDyczny w Łodzi (Medical University of Lodz (MUL)); UMS, ultra-marathon study; USKCS, US Kidney Cancer Study; YMCA, Young Men Cardiovascular Association.
Meta-analysis stratified by age categories
Analysis stratified by age category showed that in “young” adults (18–60 y) a unit increase in BMI corresponded to a −7.67 bp (95% CI: −10.03, −5.31 bp; I2 = 31.2%) difference in absolute TL (Table 2, line 1; Figure 4).
FIGURE 4.

Forest plot of the β estimates (regression coefficients) from the meta-analysis of the association between BMI and absolute telomere length (base pairs) as outcome in the “young” pooled population (age ≥18 and ≤60 y). A random-effects model was used and adjusted for sex. Statistical heterogeneity was estimated by I2 statistics for each of the 12 meta-analyses. The shaded boxes indicate the inverse variance weighting of each estimate, and the size of the box indicates the weight. In case no shaded box is visible, the weight is very small. COPD, Chronic Obstructive Lung disease cohort; CURES, Chennai Urban Rural Epidemiology Study; ES, estimate; ESTHER, Epidemiological Study on the Chances of Prevention, Early Recognition, and Optimised Treatment of Chronic Diseases in the Older Population; HyperGEN, Hypertension Genetic Epidemiology Network study; LRC, Lipid Research Clinic; LSADT, Longitudinal Study of Aging Danish Twins (https://www.icpsr.umich.edu/icpsrweb/NACDA/studies/21041); NHSC, Nutrition and Health in Southwest China study; Not publ, not published; Ref, reference; RPCI, Roswell Park Cancer Institute; SOLVABLE, Study of Lupus Vascular and Bone Longterm Endpoints; ZTL2008, Zannolli Telomere Length 2008.
In “middle”-aged adults (61–75 y) the overall association between BMI and TL was −1.65 bp (95% CI: −4.41, 1.11 bp; I2 = 19.7) per unit increase in BMI. In “old” adults (>75 y) the overall association between BMI and TL was −5.89 bp (95% CI: −10.41, −1.37 bp; I2 = 5.3) per unit increase in BMI (Table 2, line 1).
For relative TL, each unit increase in BMI corresponded to a −2.58 × 10⁻³ unit T/S ratio (0.26% decrease; 95% CI: −3.92 × 10⁻³, −1.25 × 10⁻³; I2 = 80.0%) difference in relative TL in young adults (Table 3, line 1; Figure 5).
FIGURE 5.

Forest plot of the β estimates (regression coefficients) from the meta-analysis of the association between BMI and relative telomere length (T/S ratio) as the outcome in the “young” pooled population (age ≥18 y and ≤60 y). The unit of the estimates and 95% CI is 10−3. A random-effects model was used and adjusted for sex. Statistical heterogeneity was estimated by I2 statistics for each of the 12 meta-analyses. The shaded boxes indicate the inverse variance weighting of each estimate, and the size of the box indicates the weight. In case no shaded box is visible, the weight is very small. ACCT, Anglo-Cardiff Collaborative Trial; BASE-II, Berlin Aging Study; CAS, calcific aortic valve stenosis study; CAVASIC, Cardiovascular Disease in Intermittent Claudication; DALS, Diet, Activity and Lifestyle Study; DHS, Dallas Heart Study; EARSII, European Atherosclerosis Study II; ECRAN, Envejecimiento y Enfermedades Crónicas Asociadas a Nutrición (Aging and Nutrition Associated Chronic Diseas); EpiDREAM, Epidemiologic study of the Screenes for DREAM (Diabetes Reduction Assessment with Ramipril and Rosiglitazone Medication); ES, estimate; GAHR2, Prospective evaluation of Gender and Age differences in the impact of Hostility and Reactivity on intermediary coronary artery disease risk factors; HBCS, Helsinki Birth Cohort Study; KORA F3, Cooperative Health Research in the Region of Augsburg F3 (2004/2005) survey; KORA F4, Cooperative Health Research in the Region of Augsburg F4 (2006/2008) survey; MDCC, Malmö Diet and Cancer Cohort; MESA, Multi-Ethnic Study of Atherosclerosis (https://www.mesa-nhlbi.org/); MONICA, Multinational Monitoring of Trends and Determinants in Cardiovascular Disease; NESDA, The Netherlands Study of Depression and Anxiety; NESDO, The Netherlands Study of Depression in older persons; Not publ, not published; PATH 40, Personality and Total Health Through Life Project AGE 40–44; PREDIMED, Prevención con Dieta Mediterránea; PREVEND, Prevention of Renal and Vascular End-stage Disease; PRT, Progressive Resistance Training; Ref, reference; RPE, Richard Paul Ebstein; SAPHIR, Salzburg Atherosclerosis Prevention program in subjects at High Individual Risk Study; SWHS, Shanghai Women's Health Study; T/S ratio, telomere-to–single-copy gene ratio; UMED, Uniwersytet MEDyczny w Łodzi (Medical University of Lodz (MUL)); UMS, ultra-marathon study; USKCS, US Kidney Cancer Study; YMCA, Young Men Cardiovascular Association.
In “middle”-aged adults, the overall association between BMI and relative TL was found to be a −1.08 × 10⁻³ unit T/S ratio (0.1% decrease; 95% CI: −1.76 × 10⁻³, −0.39 × 10⁻³; I2 = 0.0) per unit increase in BMI. For “old” adults no significant association [0.20 × 10⁻³ unit T/S ratio (0.02%); 95% CI: −1.40 × 10⁻³, 1.80 × 10⁻³; I2 = 0.0] was found between BMI and relative TL (Table 3, line 1).
Meta-regression and sources of heterogeneity
Age and ethnicity were effect modifiers in the meta-regression analyses (Supplemental Results). Therefore, all of the analyses were stratified by ethnicity in addition to the originally planned analyses.
With absolute TL as the outcome, stratified analyses showed that all estimates were significant for the white pooled sample (Table 2, line 2) and also for the “middle” pooled Asian sample. However, the latter estimate was an outlier and based on just 1 study (Table 2, line 5).
With relative TL as the outcome, stratified analyses showed that the estimates (except for one estimate for the “old” pooled sample) were significant for the white pooled sample (Table 3, line 2). In addition, the estimates of the overall and “young” pooled Native American samples and the estimate of the “young” pooled Asian sample were significant (Table 3, lines 5 and 6).
Sensitivity analysis
None of the sensitivity analyses resulted in a substantial change in the summary estimate (Supplemental Results).
DISCUSSION
This cross-sectional meta-analysis of 87 observational studies of adult pooled populations confirmed previous observations that BMI is negatively associated with TL. After stratification for age and ethnicity, the negative association between BMI and TL appeared to be stronger in the “young” pooled population (18– 60 y) and in the white pooled population. Differences between men and women could not be confirmed.
On the basis of our estimates for absolute TL, an ∼5-unit higher BMI appears to be equivalent to a difference in TL of ∼20–38 bp or an ∼7.9 × 10⁻³ to 13 × 10−3 unit T/S ratio (0.79–1.3% difference). Compared with an estimated average yearly decrease (i.e., ∼25 bp/y or ∼0.01 T/S ratio/y) in leucocyte TL in adults based on cross-sectional data (3, 32, 134–136), this is equivalent to an increase in biological age of ∼1 y. A major disadvantage of cross-sectional analysis is the impossibility to infer causation. However, the robust association between higher BMI and lower TL found in this meta-analysis could highlight another potential area of concern for the obesity epidemic.
Because obesity and, more specifically, an increase in leptin and a decrease in adiponectin have been associated with low-grade inflammation and oxidative stress (137), the observed negative association between BMI and leukocyte TL may be due, in part, to the chronic inflammatory state associated with higher leptin. Recently, a negative association was observed between age-related relative TL and serum leptin in 7 cohorts of 11,448 participants, which remained significant after adjustment for BMI (103). These data suggest that, beyond a high BMI, inflammatory conditions, mediated via increase in leptin, likely contribute to telomere shortening. Because a longitudinal intervention study showed that a reduction in BMI was linked to increasing TL over a 5-y period (98), it is also suggested that a common factor, such as chronic inflammation, is associated both with leptin resistance and with TL.
The negative association between BMI and TL was most apparent in the younger pooled population, in whom a stronger association was found for TL than in the other age groups. Three possible explanations could explain this observation. First, BMI could be a better marker for adiposity in younger individuals aged <60 y than in older individuals (22). Above 65 y of age BMI may less consistently reflect obesity because of potential loss of muscle and bone mass and height (22). The fact that older men weighed less than the middle-aged men at a given height is attributed to older men having less lean tissue, and a lower BMI can actually reflect a higher fat mass (138). Second, selective survival might be one of the causes of the stronger association found in the younger age category. As Manson et al. (139) stated, “obesity in one's 40s contributes to the onset of type 2 diabetes in one's 50s, which leads to myocardial infarction (MI) in one's 60s, heart failure and weight loss due to debilitation and muscle wasting at age 70, and death at age 75”. People who suffered from age-related diseases may have died and those who survived may therefore differ from those who died (140). Third, older people are more likely to have chronic diseases that lead to weight loss and people with chronic diseases are probably less likely to participate in studies (139).
The magnitude of the negative association between BMI and leukocyte TL was found to be largest in the white pooled population. One possible explanation could be that TL differs between different cell types (141) and that leukocyte cell subpopulations (142) differ between whites and African Americans. However, because only 4 samples consisted of African Americans, more research is required to resolve whether this observation explains the racial differences in association between TL and BMI for white and African Americans or whether this is a false-positive finding. Second, it was reported that the estimation of visceral adipose tissue, the most relevant tissue that determines the risk of developing chronic metabolic diseases, was different in white and African American adults (143). At a higher BMI or increased waist circumference, white adults had higher amounts of visceral adipose tissue than African-American adults (137). Because the presence of leptin resistance or markers of inflammation was not included in these studies, it remains to be determined whether the relation between BMI, leptin resistance, inflammation, and telomere attrition is different for African Americans compared with whites. In addition, the one study sample consisting of 3256 mostly “young” Native Americans showed similar results as found for the white study population (107). The majority of this study sample was centrally obese, and leukocyte TL was negatively correlated with C-reactive protein.
One of the main strengths of this study is that we did not rely on publications only. Instead, we contacted PIs, which, in turn, pointed us toward important studies we may have missed to obtain the data used in the meta-analysis. In addition, we incorporated potential confounders (age and sex) and sources of heterogeneity (ethnicity and study design). The response rate of the originally contacted PIs was 55%, with a final count of 87 unique studies and >140,000 individuals. Although it is impossible to make a direct comparison with the unpublished β estimates of the nonresponders, we assume, also based on the absence of significant publication bias, that the studies in this meta-analysis are a random selection of all studies conducted and that we present a valid representation of the association between BMI and TL. Because of the large variation in adult TL, as well as biological and measurement variation (qPCR), large sample sizes are needed, especially in cross-sectional studies, to detect modest effects (30). In this meta-analysis we were able to detect a significant association of −3.99 bp or a −1.58 × 10⁻³ unit T/S ratio (0.16%) per unit increase in BMI. Because 36% of our meta-analyses showed a significant association with estimates in the same direction and of the same magnitude (except for 3 estimates of extreme magnitude of one Asian sample in the “middle”-aged population), we assume that false positive reporting is only of minor concern.
Two recent meta-analyses, which relied on published data, also reported negative associations between BMI and TL. The first smaller scale meta-analysis reported negative regression coefficients on the association between TL and BMI (22), of which 5 studies were also included in this meta-analysis (13, 14, 19, 82, 144). The larger-scale meta-analysis reported a weak negative correlation, a standardized mean difference of 0.84 (95% CI: 0.22, 1.46) between obese individuals and normal-weight individuals, and an OR of 1.39 (95% CI: 1.15, 1.69) (7). Of the 45 samples that met our inclusion criteria 33 collaborated in our analysis. This shows that the results between the meta-analyses are consistent and very robust.
Although age and ethnicity were taken into account, it should be mentioned that the older study sample was relatively small (∼8400 individuals) and that the majority of the individuals were white (83%). Unfortunately, we did not include smoking in the meta-analysis. Smoking is generally associated with a lower BMI and shorter TL (3, 139, 145), which may have caused an underestimation of the inverse association between BMI and TL. In addition, inflammation was not directly measured. We were also not able to measure telomere attrition because we did not incorporate longitudinal data, and reverse causation cannot be excluded. However, there are very few large-scale studies with repeated measures of TL.
The lengths of telomeres at different ages are highly correlated, and it has been suggested that most of the variation in leukocyte TL in adults is a result of TL at birth and that therefore the impact of environmental and lifestyle factors is rather small (145, 146). In addition, Benetos et al. (145) described that ranking of individuals into deciles according to their TL barely changes across adult life. Our meta-analysis shows that a 5-unit increase in BMI corresponds to a change of ∼20 bp or even ∼38 bp in the younger pooled population, which is equivalent to 1-y greater biological age, irrespective of ranking.
In summary, a higher BMI is associated with shorter telomeres, especially in the younger pooled population. Being aware of the fact that the association between BMI and TL differs across the life span can lead to further research. Although no causal inference can be drawn and residual confounding may exist, the results were robust across a variety of potential confounders. Given this, we could possibly infer that tackling the obesity epidemic might be a starting point to delay telomere shortening and the onset of age-related diseases, thereby contributing to slower biological aging of the population. However, meta-analyses of longitudinal studies that can evaluate change in body weight alongside change in TL are warranted.
Supplementary Material
Acknowledgements
The collaborators in the TELOMAAS group are as follows: Göran Roos (Department of Medical Biosciences, Umeå University, Umeå, Sweden); Birgitta Stegmayr (Department of Public Health and Clinical Medicine, Umeå University, Sweden); Peter Nilsson (Clinical Sciences Medicine, University Hospital, Malmö, Sweden); Mats Eliasson (Department of Medicine, Sunderbyn Hospital, Luleå, Sweden); Olle Melander (Department of Clinical Sciences Medicine, University Hospital, Malmö, Sweden); Tim Spector (Twin Research and Genetic Epidemiology, King's College London, United Kingdom); Abraham Aviv (Center of Human Development and Aging, New Jersey Medical School, University of Medicine and Dentistry of New Jersey, Rutgers The State University of New Jersey, Newark, NJ); Antonysunil Adaikalakoteswari (Division of Metabolic and Vascular Health, University of Warwick, Coventry, United Kingdom); Viswanathan Mohan (Department of Diabetology, Madras Diabetes Research Foundation and Dr Mohans’ Diabetes Specialities Center, Gopalapuram, Chennai, India); Sofie Bekaert (Bimetra Clinical Research Center Ghent, Ghent University Hospital, Ghent, Belgium); Denil Simon (Department of Mathematical Modeling, Statistics, and Bioinformatics, Ghent University, Ghent, Belgium); Ernst Rietzschel, Marc De Buyzere, Thierry Gillebert, and Caroline Van Daele (Department of Cardiovascular Diseases, Ghent University Hospital, Ghent, Belgium); Michel Langlois (Department of Clinical Chemistry, AZ St-Jan Brugge-Oostende AV, Bruges, Belgium); Patrick Segers (Institute Biomedical Technology, Ghent University, Ghent, Belgium); Gui De Backer and Dirk De Bacquer (Department of Public Health, Ghent University, Ghent, Belgium); Michael Fenech (Department of Animal Food and Health Sciences, CSIRO, Adelaide BC, Australia); David Hughes and Janet Cross (Institute of Food Research, Norwich, United Kingdom); Helen Murphey (Department of Diabetes and Endocrinology, Ipswich Hospital, Ipswich, United Kingdom); Rosemary C Temple (Elsie Bertram Diabetes Center, Norfolk and Norwich University Hospital NHS Trust, Norwich, United Kingdom); Duncan Fowler (Department of Diabetes and Endocrinology, Ipswich Hospital, Ipswich, United Kingdom); Nicoletta Dozio (Elsie Bertram Diabetes Center, Norfolk and Norwich University Hospital NHS Trust, Norwich, United Kingdom); Jackie Hughes and Mark Winterbone (Institute of Food Research, Norwich, United Kingdom); Shi-Jen Hwang and Daniel Levy [Population Sciences Branch of the National Heart, Lung, and Blood Institute (NHLBI), NIH, NHLBI's Framingham Heart Study, Framingham, MA]; Daan Kromhout (Division of Human Nutrition, Wageningen University, Wageningen, Netherlands); Anthony Kafatos (Department of Preventive Medicine and Nutrition Clinic, Medical School, University of Crete, Heraklion, Crete, Greece); Richard M Cawthon (Eccles Institute of Human Genetics, University of Utah, Salt Lake City, UT); Ana V Diez-Roux (Drexel University School of Public Health, Philadelphia, PA); Steve E Humphries (Department of Cardiovascular Genetics, Institute Cardiovascular Science, University College London, London, United Kingdom); Arch G Mainous III (Department of Health Services Research, Management, and Policy, University of Florida, Gainesville, FL); Marty S Player (Department of Family Medicine, Medical University of South Carolina, Charleston, SC); Charles J Everett (Ralph H Johnson VA Medical Center, Charleston, SC); Nir Barzilai (Department of Medicine and Genetics, Albert Einstein College of Medicine, Bronx, NY); Ian J Deary (Center for Cognitive Ageing and Cognitive Epidemiology and Department of Psychology, University of Edinburgh, Edinburgh, United Kingdom); John M Starr (Center for Cognitive Aging and Cognitive Epidemiology and Alzheimer Scotland Dementia Research Center, University of Edinburgh, Edinburgh, United Kingdom); Thomas von Zglinicki (Institute for Cell and Molecular Biosciences and Newcastle University Institute for Aging, Campus for Aging and Vitality, Newcastle upon Tyne, United Kingdom); Carmen Martin-Ruiz (NIHR Biomedical Research Center at Newcastle upon Tyne, Institute of Neuroscience and Newcastle University Institute for Aging, Campus for Aging and Vitality, Newcastle upon Tyne, United Kingdom); Nazmul Huda (Department of Medical and Molecular Genetics, Indiana University School of Medicine, Indianapolis, IN); Laura Kananen (Research Programs Unit, Biomedicum-Helsinki, University of Helsinki, Helsinki, Finland); Ronit Sinnreich (Epidemiology Unit, Hebrew University-Hadassah School of Public Health and Community Medicine, Jerusalem, Israel); Barbara Kloeckener-Gruissem (Institute of Medical Molecular Genetics, University of Zurich, Schlieren, Switzerland, and Department of Biology, ETHZ, Zurich); Simon Easteal and Peter J Milburn (John Curtin School of Medical Research, The Australian National University, Canberra, Australia); Stefan Kiechl and Johann Willeit (Department of Neurology, Medical University Innsbruck, Innsbruck, Austria); Julia Raschenberger (Division of Genetic Epidemiology, Department of Medical Genetics, Molecular and Clinical Pharmacology, Medical University of Innsbruck, Innsbruck, Austria); Susan McCann and Christine Ambrosone (Department of Cancer Prevention and Control, Roswell Park Cancer Institute, Buffalo, NY); Andrea Baccarelli (Department of Environmental Health Sciences, Columbia Mailman School of Public Health, New York, NY); Mirjam Hoxha (Department of Clinical Sciences and Community Health, EPIGET– Epidemiology, Epigenetics and Toxicology Lab, University of Milan, Milan, Italy); Pier Alberto Bertazzi (Department of Clinical Sciences and Community Health, University of Milan and IRCCS Ca Granda Maggiore Hospital Foundation, Milan, Italy); Santo Davide Ferrara and Massimo Montisci (Department of Cardiac, Thoracic, and Vascular Sciences, Unit of Legal Medicine and Forensic Toxicology, University of Padova, Padova, Italy); Miryoung Lee (Community Health, Lifespan Health Research Center, Wright State University Boonshoft School of Medicine, Dayton, OH); Stig E Bojesen and Børge G Nordestgaard (The Copenhagen General Population Study, Department of Clinical Biochemistry, Copenhagen University Hospital, Herlev and Gentofte Hospital, Copenhagen, Denmark); Gladys Barrera, Sandra Hirsch, and María Pía De la Maza (Institute of Nutrition and Food Technology, University of Chile, Chile); Halcyon Skinner (Truven Health, Durham, NC); Kristin Litzelman (National Cancer Institute, Division of Cancer Control and Population Sciences, Rockville, MD); Songwon Seo (Korea Institute of Radiological and Medical Sciences, National Radiation Emergency Medical Center, Seoul, South Korea); Sonia Garcia-Calzon (Department of Nutrition, Food Science, and Physiology, University of Navarra, Pamplona, Spain, and Instituto de Investigación Sanitaria de Navarra, Pamplona, Spain); Guillermo Zalba (Department of Biochemistry and Genetics, University of Navarra, Pamplona, Spain, and Instituto de Investigación Sanitaria de Navarra, Pamplona, Spain); J Alfredo Martinez and Miguel Angel Martinez-Gonzalez [Department of Nutrition, Food Science, and Physiology, University of Navarra, Pamplona, Spain, and Instituto de Investigación Sanitaria de Navarra, Pamplona, Spain, and CIBER Fisiopatología de la Obesidad y Nutrición, (CIBERobn), Instituto de Salud Carlos III, Madrid, Spain]; David Rehkopf (Department of General Medical Disciplines, Stanford University, Stanford, CA); Jue Lin (Department of Biochemistry and Biophysics, University of California, San Francisco, CA); Yu-Tang Gao (Department of Epidemiology, Shanghai Cancer Institute, Shanghai, China); Xiao-Ou Shu (Department of Medicine, Division of Epidemiology, Vanderbilt University Medical Center, Nashville, TN); Carly Skamra, Alexander Sandhu, and QiQuan Huang (Division of Rheumatology, Northwestern University Feinberg School of Medicine, Chicago, IL); Jungwha Lee (Department of Preventive Medicine, Northwestern University Feinberg School of Medicine, Chicago, IL); Richard Pope (Division of Rheumatology, Northwestern University Feinberg School of Medicine, Chicago, IL); Martha Slattery (Department of Medicine, University of Utah, Salt Lake City, UT); Merja K Laine (Department of General Practice and Primary Health Care, University of Helsinki, Helsinki, Finland, and Vantaa Health Center, Vantaa, Finland); Johan G Eriksson (Department of General Practice and Primary Health Care, University of Helsinki, Helsinki, Finland); Urho M Kujala (Department of Health Sciences, University of Jyväskylä, Jyväskylä, Finland); Rahul Raj (Department of Neurosurgery, Helsinki University Central Hospital, Helsinki, Finland); Heli M Bäckmand (City of Vantaa Health and Social Welfare Department, Vantaa, Finland); Markku Peltonen (Department of Health, National Institute for Health and Welfare, Helsinki, Finland); Seppo Sarna (Department of Public Health, University of Helsinki, Helsinki, Finland); Kendra Schwartz (Department of Family Medicine and Public Health Sciences, Wayne State University, Detroit, MI); Faith Davis (School of Public Health, University of Alberta, Alberta, Canada); Julie Ruterbusch (Department of Family Medicine and Public Health Sciences, Wayne State University, Detroit, MI); Mirjam Hoxha (Department of Occupational and Environmental Health, University of Milan, Milan, Italy); Bridget McCarthy (School of Public Health, University of Illinois at Chicago, Chicago, IL); Nathaniel Rothman and Joanne Colt (Division of Cancer Epidemiology and Genetics, National Cancer Institute, Bethesda, MD); Wong-Ho Chow (Department of Epidemiology, MD Anderson Cancer Center, Houston, TX); Mark Purdue (Division of Cancer Epidemiology and Genetics, National Cancer Institute, Bethesda, MD); Clemens Baumbach (Research Unit of Molecular Epidemiology and Institute of Epidemiology II, Helmholtz Zentrum München, German Research Center for Environmental Health, Neuherberg, Germany); Annette Peters (Institute of Epidemiology II, Helmholtz Zentrum München, German Research Center for Environmental Health, Neuherberg, Germany); Martina Müller-Nurasyid (Institute of Genetic Epidemiology, Helmholtz Zentrum München, German Research Center for Environmental Health, Neuherberg, Germany, and Department of Medicine I, Ludwig-Maximilians-University Munich, Munich, Germany, and DZHK (German Centre for Cardiovascular Research), partner site Munich Heart Alliance, Munich, Germany); Michelangela Barbieri (Department of Medical, Surgical, Neurological, Metabolic, and Geriatric Sciences, Second University of Naples, Naples, Italy); Kaare C Christensen (Department of Epidemiology, Biostatistics, and Biodemography, Institute of Public Health, University of Southern Denmark, Odense C, Denmark); Anu Loukola (Department of Public Health, University of Helsinki, Helsinki, Finland); Tellervo Korhonen (Department of Public Health, University of Helsinki, Finland, and University of Eastern Finland, Kuopio, Finland); Pamela AF Madden (Washington University School of Medicine, St. Louis, MO); Sharon Merkin (Department of Medicine, David Geffen School of Medicine at UCLA, Los Angeles, CA); Katri Räikkönen (Institute of Behavioural Sciences, University of Helsinki, Helsinki, Finland); Eero Kajantie (Department of General Practice and Primary Health Care, University of Helsinki, Helsinki, Finland); Johan Eriksson (Department of General Practice and Primary Health Care and Helsinki University Hospital, University of Helsinki, Helsinki, Finland); Pascal Arp (Department of Internal Medicine, Erasmus MC, Rotterdam, Netherlands); Albert Hofman and Cornelia M van Duijn (Department of Epidemiology, Erasmus MC, Rotterdam, Netherlands); André G Uitterlinden (Department of Internal Medicine, Erasmus MC, Rotterdam, Netherlands); Lyudmyla Kedenko and Bernhard Paulweber (Department of Internal Medicine I, Paracelsus Medical University, Salzburg, Austria); Margot Haun and(Division of Genetic Epidemiology, Department of Medical Genetics, Molecular and Clinical Pharmacology, Medical University of Innsbruck, Innsbruck, Austria); Barbara Rantner (Division of Genetic Epidemiology, Departments of Medical Genetics, Molecular and Clinical Pharmacology, and Vascular Surgery, Medical University of Innsbruck, Innsbruck, Austria); Angelika Hammerer-Lercher (Central Institute of Medical and Chemical Laboratory Diagnostics, University Hospital Innsbruck, Innsbruck, Austria); Gustav Fraedrich (Department of Vascular Surgery, Innsbruck Medical University, Innsbruck, Austria); Marietta Stadler (Third Medical Department of Metabolic Diseases and Nephrology, Hietzing Hospital, Vienna, Austria); Peter Klein-Weigel (Clinic for Angiology, HELIOS Klinikum Berlin-Buch, Berlin, Germany); M Geoffrey Hayes (Division of Endocrinology, Metabolism, and Molecular Medicine, Department of Medicine, and Center for Genetic Medicine, Feinberg School of Medicine, Northwestern University, Chicago, IL, and Department of Anthropology, Northwestern University, Evanston, IL); Christopher W Kuzawa (Department of Anthropology, Northwestern University, Evanston, IL, and Cells to Society (C2S), The Center on Social Disparities and Health, Institute for Policy Research, Northwestern University, Evanston, IL); Nanette Lee (Office of Population Studies Foundation, University of San Carlos, Cebu, Philippines); Caitlin Mason (Fred Hutchinson Cancer Research Center, Seattle, WA); Rosa-Ana Risques and Peter Rabinovitch (Department of Pathology, University of Washington, Seattle, WA); Ching-Yun Wang (Fred Hutchinson Cancer Research Center, Seattle, WA); Anne McTiernan (Fred Hutchinson Cancer Research Center, Seattle, WA, and Schools of Public Health and Medicine, University of Washington, Seattle, WA); Cristiana LMF Miranda-Furtado (Department of Gynecology and Obstetrics, Ribeirão Preto Medical School, University of São Paulo, Ribeirão Preto, São Paulo, Brazil); Hermann Brenner [Division of Clinical Epidemiology and Aging Research, German Cancer Research Center (DKFZ), Heidelberg, Germany, and Network Aging Research (NAR), University of Heidelberg, Heidelberg, Germany]; Antje Meyer [Center of Stroke Research Berlin (CSB) and Berlin-Brandenburg Center for Regenerative Therapies (BCRT), at Campus Virchow Klinikum, Charité Universitätsmedizin, Berlin, Germany]; Elisabeth Steinhagen-Thiessen (Charité–Universitätsmedizin Berlin, corporate member of Freie Universität Berlin, Humboldt-Universität zu Berlin, and Berlin Institute of Health, Lipid Clinic at the Interdisciplinary Metabolism Center, Germany); Julieta Panero and LaPatricia Carolina Dos Santos [Academia Nacional de Medicina (CONICET), Instituto de Medicina Experimental (IMEX), Laboratorio de Genética de Neoplasias Linfoides, Ciudad Autónoma de Buenos Aires, Argentina]; Claudio Daniel González (Universidad de Buenos Aires, Facultad de Medicina, Departamento de Farmacología, Ciudad Autónoma de Buenos Aires, Argentina); Jorge Vilariño (Hospital FLENI, Departamento de Cardiología, Ciudad Autonoma de Buenos Aires, Argentina); Martha Sereday (Hospital Fiorito, Servicio de Endocrinología, Buenos Aires, Argentina); Gloria Edith Cerrone (Universidad de Buenos Aires, Facultad de Farmacia y Bioquímica, Cátedra de Genética y Biología Molecular, Ciudad Autónoma de Buenos Aires, Argentina); Irma Slavutsky [Academia Nacional de Medicina (CONICET), Instituto de Medicina Experimental (IMEX), Laboratorio de Genética de Neoplasias Linfoides, Ciudad Autónoma de Buenos Aires, Argentina]; Gustavo Daniel Frechtel [CONICET-Universidad de Buenos Aires. Instituto de Inmunología, Genética y Metabolismo (INIGEM), Laboratorio de Diabetes y Metabolismo, Ciudad Autónoma de Buenos Aires, Argentina]; Dariusz Nowak (Department of Clinical Physiology, Medical University of Lodz, Lodz, Poland); Makandjou-Ola Eusebio and Miroslawa Pietruczuk (Department of Laboratory Diagnostics, II Department of Internal Medicine, Medical University of Lodz, Lodz, Poland); Yasmin (Division of Experimental Medicine and Immunotherapeutics, University of Cambridge, Cambridge, United Kingdom); Lee Butcher (Cardiff School of Sport and Health Sciences, Cardiff Metropolitan University, Cardiff, United Kingdom); John R Cockcroft (Division of Cardiology, New York–Presbyterian Hospital, Columbia University, New York, NY); Ian B Wilkinson (Division of Experimental Medicine and Immunotherapeutics, University of Cambridge, Cambridge, United Kingdom); Jorge D Erusalimsky (Cardiff School of Sport and Health Sciences, Cardiff Metropolitan University, Cardiff, United Kingdom); Carmel M McEniery (Division of Experimental Medicine and Immunotherapeutics, University of Cambridge, Cambridge, United Kingdom); Onn Siong Yim (Department of Psychology, National University of Singapore, Singapore); Xing Zhang (Singapore-ETH Center for Global Environmental Sustainability, Singapore); Idan Shalev (Department of Biobehavioral Health, Pennsylvania State University, University Park, PA); Mikhail Monakhov (UConn Health, Neuroscience, Farmington, CT); Songfa Zhong (Department of Economics, National University of Singapore, Singapore); Ming Hsu (University of California/Haas School of Business, Berkeley, CA); Soo Hong Chew (Department of Economics, National University of Singapore, Singapore); Poh San Lai (Department of Pediatrics, National University of Singapore, Singapore); Jan Sundquist and Xiao Wang (Center for Primary Health Care Research, Lund University, Region Skåne, Lund, Sweden); Salim Yusuf, Hertzel Gerstein, and Sonia Anand (Population Health Research Institute and McMaster University, Hamilton, Canada).
We thank the principal investigators of the Bogalusa Study, the Sister Study, the Strong Heart Family Study, and the Helsinki Birth Cohort Study (HBCS) for their willingness to share the data but with whom we lost contact despite our efforts.
The TwinsUK study was funded by the Wellcome Trust, European Community's Seventh Framework Programme (FP7/2007–2013). The study also receives support from the National Institute for Health Research (NIHR) BioResource Clinical Research Facility and Biomedical Research Centre based at Guy's and St. Thomas' NHS Foundation Trust and King's College London. The Dallas Heart Study (DHS) research reported in this publication was supported by the National Center for Advancing Translational Sciences of the NIH under award number UL1TR001105. We thank Drs. C Garcia and Kozlitina for sharing the data. The acquisition and analyses of the data from the Multi-Ethnic Study of Atherosclerosis (MESA) was funded by contracts N01-HC-95159 through N01-HC-95165 and N01-HC-95169 from the National Heart, Lung, and Blood Institute, by R01 HL076831 (PI: Diez Roux), and by funding from the MacArthur Foundation. Jennifer A Nettleton was funded by a career development award from the NIH, the National Institute of Diabetes and Digestive and Kidney Diseases (5K01DK082729-04). MESA thanks the investigators, staff, and participants of the MESA study for their valuable contributions. A full list of participating MESA investigators and institutions can be found at http://www.mesa-nhlbi.org. SE Humphries is a British Heart Foundation Professor and he and Klelia D Salpea are supported by the British Heart Foundation (RG008/08 and FS/06/053) and by the National Institute for Health Research University College London Hospitals Biomedical Research Centre. The EARSII study was funded by the EC Concerted Action BMH1 CT92-0206. Phenotype collection was supported by Age UK (The Disconnected Mind project). The work was undertaken by The University of Edinburgh Centre for Cognitive Ageing and Cognitive Epidemiology, which is part of the cross-council Lifelong Health and Wellbeing Initiative (MR/K026992/1). Funding from the Biotechnology and Biological Sciences Research Counci and Medical Research Council (MRC) is gratefully acknowledged. The Sister Study was supported by the Intramural Research Program of the NIH, National Institute of Environmental Health Sciences (Z01 ES 044005). The Jerusalem LRC study was funded by the Chief Scientist of the Israel Ministry of Health (300000-5352), the Israel Science Foundation (593/01), and the US-Israel Binational Science Foundation (87-00419). The Jerusalem Palestinians study was funded by the USAID MERC program (grant TA-MOU-01-M21–002) and by a research grant from DCURE Israel. The PATH study was supported by the Australian National Health and Medical Research Council program grant 17805 and project grant 418020. The Bruneck Study was supported by a grant from the “Tiroler Wissenschaftsfonds,” Austria, and the Dr Johannes and Hertha Tuba Foundation. The Fels Longitudinal Study, Research reported in this manuscript was supported by the NIH grants (R03AG023251, R01HD012252).
The authors thank the Indian Health Service facilities. The views expressed in this article are those of the authors and do not necessarily reflect those of the Indian Health Service. This study was supported by NIH grants R01DK091369, K01AG034259, R21HL092363, and cooperative agreement grants U01HL65520, U01HL41642, U01HL41652, U01HL41654, and U01HL65521.
SOLVABLE was supported by NIH/NIAMS T32AR07611, K24AR002138, and P60 AR30692, which is now updated as P60 AR064464, Kirkland Scholar Award, and the AFMR Summer Clinical and the Eleanor Wood-Prince grant: A Project of the Woman's Board of Northwestern Memorial Hospital. The Former Athletes study was funded by the Ministry of Education and Culture, the Juho Vainio Foundation, the Finnish Heart Research Foundation, Paavo Nurmi Foundation, the Finnish Cultural Foundation, and by a grant from Medical Society of Finland, Finska Läkaresällskapet. We thank National Institute for Health and Welfare, Department of Public Health, University of Helsinki, Sports and Exercise Medicine Department of Health Sciences, University of Jyväskylä, Paavo Nurmi Centre, Turku, and ORTON Research Institute, Invalid Foundation, Helsinki, for collaboration during the large epidemiological and clinical research program in the year 2008. The Finnish Twin Cohort data come primarily from the Nicotine Addictions Genetics family study of twins and their siblings. Data collection for this work was supported by Academy of Finland grants and NIH grant DA12854 (PAFM), and further support was from ENGAGE–European Network for Genetic and Genomic Epidemiology, FP7-HEALTH-F4-2007, grant agreement 201413; the Academy of Finland Center of Excellence in Complex Disease Genetics (grants 213506 and 129680; to J Kaprio), and the Academy of Finland (grants 141054, 265240, and 263278; to J Kaprio). The US Kidney Cancer Study (USKCS) was supported, in part, by the intramural research program of the Division of Cancer Epidemiology and Genetics, National Cancer Institute, NIH. The KORA study was initiated and financed by the Helmholtz Zentrum München– German Research Center for Environmental Health, which is funded by the German Federal Ministry of Education and Research (BMBF) and by the State of Bavaria. Furthermore, KORA research was supported within the Munich Center of Health Sciences (MC-Health), Ludwig-Maximilians-Universität, as part of LMUinnovativ. The Erasmus Rucphen Family (ERF) study was supported by grants from The Netherlands Organisation for Scientific Research (NWO), Erasmus MC, the Center for Medical Systems Biology (CMSB), the European Community's Seventh Framework Programme (FP7/2007-2013), the ENGAGE Consortium (grant HEALTH-F4-2007- 201413), and the Netherlands Consortium for Healthy Ageing (grant 050-060-810). We are grateful to all general practitioners for their contributions, to Petra Veraart for her help in genealogy, Jeannette Vergeer for the supervision of the laboratory work, and Peter Snijders for his help in data collection. The Rotterdam Study is supported by the Erasmus MC and Erasmus University Rotterdam; the Netherlands Organization for Scientific Research (NWO); the Netherlands Organization for Health Research and Development (ZonMw); the Research Institute for Diseases in the Elderly (RIDE); the Netherlands Genomics Initiative (NGI); the Ministry of Education, Culture, and Sciences; the Ministry of Health, Welfare, and Sports; the European Commission (DG XII); and the Municipality of Rotterdam. The analysis of data from the NHANES was funded by grant R01 AG033592 from the National Institute on Aging (PI: Elissa Epel). The Zutphen Elderly Study was supported by grants from The Netherlands Prevention Foundation (Preventiefonds) and the survey on Crete was financially supported by Danone. The RPCI study was supported by grants from Susan G Komen for the Cure (BCTR 0600562) and the US NIH Cancer Center Support Grant (P30 CA016056). The Heart Scan Study was funded by the British Heart Foundation (RG/10/005/28296) and the Medical Research Council, United Kingdom. A Steptoe is funded by the British Heart Foundation. The Helsinki Businessmen Study (HBS) was initially funded by the Academy of Finland and various foundations during the decades, most recently by the Sohlberg Foundation, the Jahnsson Foundation, and Gustav Voch Victoria Frimurarestiftelse. Funding has also been provided by the Helsinki University Central Hospital, the Oulu University Hospital (VTR/EVO-funding), and the Academy of Finland grants 286294 and 294154. Laboratory analysis of the Cebu Longitudinal Health and Nutrition Survey (CLHNS) was funded by NSF (Doctoral Dissertation Improvement grant BCS-0962282), the Wenner-Gren Foundation (grant 8111), and institutional support from Northwestern University; data and sample collection were funded by the NIH (grants RR20649 and ES10126). DNA extracts were provided by Karen Mohlke. Richard Cawthon, Justin Tackney, Katarina Nordfjäll, Klelia Salpea, Christine Ackerman, and Margrit Urbanek provided laboratory advice. We especially thank the many researchers at the Office of Population Studies, University of San Carlos, Cebu, the Philippines, for their central role in study design and data collection, and the Filipino participants who provided their time and samples for this study. NESDA is funded through the Geestkracht program of the Netherlands Organization for Health Research and Development (Zon-Mw, grant 10-000-1002) and is supported by participating universities and mental health care organizations. JE Verhoeven and telomere length assaying were supported through an NWO-VICI grant (91811602). The authors of PRT thank Gislaine Satyko Kogure and Rafael Costa Silva for personal guidance regarding progressive resistance training. We are grateful to the São Paulo Research Foundation (Fundação de Amparo à Pesquisa do Estado de São Paulo–FAPESP), for financial support with grants 2010/08800-8 and 2012/11566-2 (RMR) and fellowship 2012/11069-9 (CLMF). Fadi Charchar's work was supported by a National Health and Medical Research Council of Australia grant APP1123472. Maciej Tomaszewski's work on the Y chromosome was supported by British Heart Foundation project grants PG/16/49/32176 and PG/12/9/29376. The ESTHER study was funded by the Baden-Württemberg State Ministry of Science, Research, and Arts (Stuttgart, Germany); the Federal Ministry of Education and Research (Berlin, Germany); and the Federal Ministry of Family Affairs, Senior Citizens, Women, and Youth (Berlin, Germany). The Berlin Aging Study II (BASE-II) was supported by the German Federal Ministry of Education and Research (BMBF grants 16SV5536K, 16SV5537, 16SV5538, and 16SV5837; previously 01UW0808)). The study “Sex- and Gender-Sensitive Prevention of Cardiovascular and Metabolic Disease in Older Adults in Germany” (GendAge) includes analyses of BASE-II baseline data and follow-up analyses of BASE-II participants with a focus on sex and gender differences in cardiovascular and metabolic diseases. GendAge is also supported by the BMBF (grants 01GL1716A and 01GL1716B). Additional contributions (e.g., financial, equipment, logistics, personnel) were made from each of the other participating sites [i.e., the Max Planck Institute for Human Development (MPIB); Max Planck Institute for Molecular Genetics (MPIMG); Charite-Universiätsmedizin, University Medicine, German; Institute for Economic Research (DIW) Humboldt-Universität zu Berlin; all located in Berlin, Germany, and University of Lübeck in Lübeck, and University of Tübingen, Germany].
This study corresponds to a substudy of “Venado Tuerto 2.” The authors thank Hugo Grancelli, Dra Monica Damiano, Daniel Fox, and Carlos Ranalli; the Regional Centre for Development; School of Social Work of Venado Tuerto; Nutrition Society of Venado Tuerto; and the Department of Cardiology Hospital Alejandro Gutierrez of Venado Tuerto for their collaboration.
GAHR2 was supported by grants awarded to Dr. D'Antono by the Canadian Institutes of Health Research (CIHR; MOP 79456 and 111017) and the Montreal Heart Institute Foundation. The RPE study was funded by research grants from the Singapore Ministry of Education, the AXA Research Foundation, and the Templeton World Charity Foundation, Inc. The Sweden Mindfulness Study was supported by the Swedish Research Council and FORTE to Kristina Sundquist and Jan Sundquist and the National Heart, Lung, and Blood Institute of the NIH under award R01HL116381 to Kristina Sundquist. The Ukrainian part of the data of the Kyev study was completed within the framework of the “Research of anthropometric, biochemical and genetic risk factors of development of the glucose regulation disturbances and diabetes mellitus in Ukraine study” conducted at the Komisarenko Institute of Endocrinology and Metabolism (National Academy of Medical Sciences (grant 0116 U 002166).
The authors’ responsibilities were as follows—MG: wrote the manuscript, researched data, contributed to the design and discussion, and had responsibility for final content; GJH, EEA, and MPZ: contributed to the design and discussion and reviewed and edited the manuscript; KN, MM, MB, TdM, AEH, EJG, SCH, JAN, KDS, VAD, RF-F, GA, SEH, LH, DG, IH, JDK, HN, DJK, KAM, PW, Y-LZ, SP, EWD, LR, DB, AS, LB Boardman, AM, BN, WZ, RR-G, AJP, JK, JNH, CG, G Paolisso, JBHH, LM, TS, JW, KS, PvdH, LB Broer, FK, BK, TS, DTAE, CD, JEV, RS, RZ, RMRdR, FJC, MTT, UM, ID, AEIM, GC, DK, BD, MK, BJM, RPE, KS, G Pare, and MC: researched data and reviewed and edited the manuscript; and all authors: read and approved the final manuscript. None of the authors declared a conflict of interest.
Notes
The authors reported no funding received for this study.
Supplemental Methods, Supplemental Results, Supplemental Figures 1 and 2, Supplemental Tables 1–3, and Study Protocol for Participating PIs are available from the “Supplementary data” link in the online posting of the article and from the same link in the online table of contents at https://academic.oup.com/ajcn/.
Abbreviations used: bp, base pair; PI, principal investigator; qPCR, quantitative polymerase chain reaction; TL, telomere length; T/S ratio, telomere to single-copy gene ratio.
REFERENCES
- 1. Allsopp RC, Harley CB. Evidence for a critical telomere length in senescent human fibroblasts. Exp Cell Res 1995;219:130–6. [DOI] [PubMed] [Google Scholar]
- 2. Hayflick L. Mortality and immortality at the cellular level: a review Biochemistry (Mosc) 1997;62:1180–90. [PubMed] [Google Scholar]
- 3. Valdes AM, Andrew T, Gardner JP, Kimura M, Oelsner E, Cherkas LF, Aviv A, Spector TD. Obesity, cigarette smoking, and telomere length in women. Lancet 2005;366:662–4. [DOI] [PubMed] [Google Scholar]
- 4. Sampson MJ, Winterbone MS, Hughes JC, Dozio N, Hughes DA. Monocyte telomere shortening and oxidative DNA damage in type 2 diabetes. Diabetes Care 2006;29:283–9. [DOI] [PubMed] [Google Scholar]
- 5. Demissie S, Levy D, Benjamin EJ, Cupples LA, Gardner JP, Herbert A, Kimura M, Larson MG, Meigs JB, Keaney JF, et al. Insulin resistance, oxidative stress, hypertension, and leukocyte telomere length in men from the Framingham Heart Study. Aging Cell 2006;5:325–30. [DOI] [PubMed] [Google Scholar]
- 6. WHO Fact sheet 311. Obesity and overweight 2012. Available from: http://www.who.int/mediacentre/factsheets/fs311/en/index.htm2012. [Google Scholar]
- 7. Mundstock E, Sarria EE, Zatti H, Mattos Louzada F, Kich Grun L, Herbert Jones M, Guma FT, Mazzola (In Memoriam) J, Epifanio M, Stein RT, et al. Effect of obesity on telomere length: systematic review and meta-analysis. Obesity (Silver Spring) 2015;23:2165–74. [DOI] [PubMed] [Google Scholar]
- 8. Njajou OT, Cawthon RM, Blackburn EH, Harris TB, Li R, Sanders JL, Newman AB, Nalls M, Cummings SR, Hsueh WC. Shorter telomeres are associated with obesity and weight gain in the elderly. Int J Obes (Lond) 2012;36:1176–9. [DOI] [PMC free article] [PubMed] [Google Scholar]
- 9. Martin-Ruiz CM, Gussekloo J, van Heemst D, von Zglinicki T, Westendorp RG. Telomere length in white blood cells is not associated with morbidity or mortality in the oldest old: a population-based study. Aging Cell 2005;4:287–90. [DOI] [PubMed] [Google Scholar]
- 10. Benetos A, Okuda K, Lajemi M, Kimura M, Thomas F, Skurnick J, Labat C, Bean K, Aviv A. Telomere length as an indicator of biological aging: the gender effect and relation with pulse pressure and pulse wave velocity. Hypertension 2001;37:381–5. [DOI] [PubMed] [Google Scholar]
- 11. Gardner M, Bann D, Wiley L, Cooper R, Hardy R, Nitsch D, Martin-Ruiz C, Shiels P, Sayer AA, Barbieri M, et al. Gender and telomere length: systematic review and meta-analysis. Exp Gerontol 2014;51:15–27. [DOI] [PMC free article] [PubMed] [Google Scholar]
- 12. McGrath M, Wong JY, Michaud D, Hunter DJ, De Vivo I. Telomere length, cigarette smoking, and bladder cancer risk in men and women. Cancer Epidemiol Biomarkers Prev 2007;16:815–9. [DOI] [PubMed] [Google Scholar]
- 13. O'Donnell CJ, Demissie S, Kimura M, Levy D, Gardner JP, White C, D'Agostino RB, Wolf PA, Polak J, Cupples LA, et al. Leukocyte telomere length and carotid artery intimal medial thickness: the Framingham Heart Study. Arterioscler Thromb Vasc Biol 2008;28:1165–71. [DOI] [PMC free article] [PubMed] [Google Scholar]
- 14. Bekaert S, De Meyer T, Rietzschel ER, De Buyzere ML, De Bacquer D, Langlois M, Segers P, Cooman L, Van Damme P, Cassiman P, et al. Telomere length and cardiovascular risk factors in a middle-aged population free of overt cardiovascular disease. Aging Cell 2007;6:639–47. [DOI] [PubMed] [Google Scholar]
- 15. Nordfjall K, Eliasson M, Stegmayr B, Melander O, Nilsson P, Roos G. Telomere length is associated with obesity parameters but with a gender difference. Obesity (Silver Spring) 2008;16:2682–9. [DOI] [PubMed] [Google Scholar]
- 16. Story M, Evans M, Fabsitz RR, Clay TE, Holy Rock B, Broussard B. The epidemic of obesity in American Indian communities and the need for childhood obesity-prevention programs. Am J Clin Nutr 1999;69(Suppl):747S–54S. [DOI] [PubMed] [Google Scholar]
- 17. Hunt SC, Chen W, Gardner JP, Kimura M, Srinivasan SR, Eckfeldt JH, Berenson GS, Aviv A. Leukocyte telomeres are longer in African Americans than in whites: the National Heart, Lung, and Blood Institute Family Heart Study and the Bogalusa Heart Study. Aging Cell 2008;7:451–8. [DOI] [PMC free article] [PubMed] [Google Scholar]
- 18. Chen W, Kimura M, Kim S, Cao X, Srinivasan SR, Berenson GS, Kark JD, Aviv A. Longitudinal versus cross-sectional evaluations of leukocyte telomere length dynamics: age-dependent telomere shortening is the rule. J Gerontol A Biol Sci Med Sci 2011;66:312–9. [DOI] [PMC free article] [PubMed] [Google Scholar]
- 19. Diaz VA, Mainous AG, Player MS, Everett CJ. Telomere length and adiposity in a racially diverse sample. Int J Obes (Lond) 2010;34:261–5. [DOI] [PubMed] [Google Scholar]
- 20. Zhu H, Wang X, Gutin B, Davis CL, Keeton D, Thomas J, Stallmann-Jorgensen I, Mooken G, Bundy V, Snieder H, et al. Leukocyte telomere length in healthy Caucasian and African-American adolescents: relationships with race, sex, adiposity, adipokines, and physical activity. J Pediatr 2011;158:215–20. [DOI] [PMC free article] [PubMed] [Google Scholar]
- 21. Fitzpatrick AL, Kronmal RA, Kimura M, Gardner JP, Psaty BM, Jenny NS, Tracy RP, Hardikar S, Aviv A. Leukocyte telomere length and mortality in the Cardiovascular Health Study. J Gerontol A Biol Sci Med Sci 2011;66:421–9. [DOI] [PMC free article] [PubMed] [Google Scholar]
- 22. Muezzinler A, Zaineddin AK, Brenner H. Body mass index and leukocyte telomere length in adults: a systematic review and meta-analysis. Obes Rev 2014;15:192–201. [DOI] [PubMed] [Google Scholar]
- 23. Cawthon RM. Telomere measurement by quantitative PCR. Nucleic Acids Res 2002;30:e47. [DOI] [PMC free article] [PubMed] [Google Scholar]
- 24. Egger M, Davey Smith G, Schneider M, Minder C. Bias in meta-analysis detected by a simple, graphical test. BMJ 1997;315:629–34. [DOI] [PMC free article] [PubMed] [Google Scholar]
- 25. Duval S, Tweedie R. Trim and fill: a simple funnel-plot-based method of testing and adjusting for publication bias in meta-analysis. Biometrics 2000;56:455–63. [DOI] [PubMed] [Google Scholar]
- 26. Higgins JP, Thompson SG. Quantifying heterogeneity in a meta-analysis. Stat Med 2002;21:1539–58. [DOI] [PubMed] [Google Scholar]
- 27. Higgins JP, Thompson SG, Deeks JJ, Altman DG. Measuring inconsistency in meta-analyses. BMJ 2003;327:557–60. [DOI] [PMC free article] [PubMed] [Google Scholar]
- 28. Aviv A, Valdes A, Gardner JP, Swaminathan R, Kimura M, Spector TD. Menopause modifies the association of leukocyte telomere length with insulin resistance and inflammation. J Clin Endocrinol Metab 2006;91:635–40. [DOI] [PubMed] [Google Scholar]
- 29. Valdes AM, Richards JB, Gardner JP, Swaminathan R, Kimura M, Xiaobin L, Aviv A, Spector TD. Telomere length in leukocytes correlates with bone mineral density and is shorter in women with osteoporosis. Osteoporos Int 2007;18:1203–10. [DOI] [PubMed] [Google Scholar]
- 30. Richards JB, Valdes AM, Gardner JP, Kato BS, Siva A, Kimura M, Lu X, Brown MJ, Aviv A, Spector TD. Homocysteine levels and leukocyte telomere length. Atherosclerosis 2008;200:271–7. [DOI] [PubMed] [Google Scholar]
- 31. Cherkas LF, Hunkin JL, Kato BS, Richards JB, Gardner JP, Surdulescu GL, Kimura M, Lu X, Spector TD, Aviv A. The association between physical activity in leisure time and leukocyte telomere length. Arch Intern Med 2008;168:154–8. [DOI] [PubMed] [Google Scholar]
- 32. Gardner JP, Li S, Srinivasan SR, Chen W, Kimura M, Lu X, Berenson GS, Aviv A. Rise in insulin resistance is associated with escalated telomere attrition. Circulation 2005;111:2171–7. [DOI] [PubMed] [Google Scholar]
- 33. Aviv A, Chen W, Gardner JP, Kimura M, Brimacombe M, Cao X, Srinivasan SR, Berenson GS. Leukocyte telomere dynamics: longitudinal findings among young adults in the Bogalusa Heart Study. Am J Epidemiol 2009;169:323–9. [DOI] [PMC free article] [PubMed] [Google Scholar]
- 34. Chen W, Gardner JP, Kimura M, Brimacombe M, Cao X, Srinivasan SR, Berenson GS, Aviv A. Leukocyte telomere length is associated with HDL cholesterol levels: the Bogalusa Heart Study. Atherosclerosis 2009;205:620–5. [DOI] [PubMed] [Google Scholar]
- 35. Adaikalakoteswari A, Balasubramanyam M, Ravikumar R, Deepa R, Mohan V. Association of telomere shortening with impaired glucose tolerance and diabetic macroangiopathy. Atherosclerosis 2007;195:83–9. [DOI] [PubMed] [Google Scholar]
- 36. Barbieri M, Paolisso G, Kimura M, Gardner JP, Boccardi V, Papa M, Hjelmborg JV, Christensen K, Brimacombe M, Nawrot TS, et al. Higher circulating levels of IGF-1 are associated with longer leukocyte telomere length in healthy subjects. Mech Ageing Dev 2009;130:771–6. [DOI] [PubMed] [Google Scholar]
- 37. De Meyer T, Rietzschel ER, De Buyzere ML, De Bacquer D, Van Criekinge W, De Backer GG, Gillebert TC, Van Oostveldt P, Bekaert S. Paternal age at birth is an important determinant of offspring telomere length. Hum Mol Genet 2007;16:3097–102. [DOI] [PubMed] [Google Scholar]
- 38. De Meyer T, Rietzschel ER, De Buyzere ML, Langlois MR, De Bacquer D, Segers P, Van Damme P, De Backer GG, Van Oostveldt P, Van Criekinge W, et al. Systemic telomere length and preclinical atherosclerosis: the Asklepios Study. Eur Heart J 2009;30:3074–81. [DOI] [PubMed] [Google Scholar]
- 39. Rietzschel ER, De Buyzere ML, Bekaert S, Segers P, De Bacquer D, Cooman L, Van Damme P, Cassiman P, Langlois M, van Oostveldt P, et al. Rationale, design, methods and baseline characteristics of the Asklepios Study. Eur J Cardiovasc Prev Rehabil 2007;14:179–91. [DOI] [PubMed] [Google Scholar]
- 40. Vasan RS, Demissie S, Kimura M, Cupples LA, White C, Gardner JP, Cao X, Levy D, Benjamin EJ, Aviv A. Association of leukocyte telomere length with echocardiographic left ventricular mass: the Framingham Heart Study. Circulation 2009;120:1195–202. [DOI] [PMC free article] [PubMed] [Google Scholar]
- 41. Houben JM, Giltay EJ, Rius-Ottenheim N, Hageman GJ, Kromhout D. Telomere length and mortality in elderly men: the Zutphen Elderly Study. J Gerontol A Biol Sci Med Sci 2011;66:38–44. [DOI] [PubMed] [Google Scholar]
- 42. Houben JM, Mercken EM, Ketelslegers HB, Bast A, Wouters EF, Hageman GJ, Schols AM. Telomere shortening in chronic obstructive pulmonary disease. Respir Med 2009;103:230–6. [DOI] [PubMed] [Google Scholar]
- 43. Rius-Ottenheim N, Houben JM, Kromhout D, Kafatos A, van der Mast RC, Zitman FG, Geleijnse JM, Hageman GJ, Giltay EJ. Telomere length and mental well-being in elderly men from the Netherlands and Greece. Behav Genet 2012;42:278–86. [DOI] [PMC free article] [PubMed] [Google Scholar]
- 44. Jeanclos E, Schork NJ, Kyvik KO, Kimura M, Skurnick JH, Aviv A. Telomere length inversely correlates with pulse pressure and is highly familial. Hypertension 2000;36:195–200. [DOI] [PubMed] [Google Scholar]
- 45. Hjelmborg JV, Nzietchueng R, Kimura M, Gardner JP, Bladbjerg EM, Christensen K, Aviv A, Benetos A. Leukocyte telomere length is inversely correlated with plasma Von Willebrand factor. Thromb Res 2010;125:e339–42. [DOI] [PubMed] [Google Scholar]
- 46. Farzaneh-Far R, Lin J, Epel E, Lapham K, Blackburn E, Whooley MA. Telomere length trajectory and its determinants in persons with coronary artery disease: longitudinal findings from the heart and soul study. PLoS One 2010;5:e8612. [DOI] [PMC free article] [PubMed] [Google Scholar]
- 47. Farzaneh-Far R, Lin J, Epel ES, Harris WS, Blackburn EH, Whooley MA. Association of marine omega-3 fatty acid levels with telomeric aging in patients with coronary heart disease. JAMA 2010;303:250–7. [DOI] [PMC free article] [PubMed] [Google Scholar]
- 48. Huda N, Tanaka H, Herbert BS, Reed T, Gilley D. Shared environmental factors associated with telomere length maintenance in elderly male twins. Aging Cell 2007;6:709–13. [DOI] [PubMed] [Google Scholar]
- 49. Fitzpatrick AL, Reed T, Goldberg J, Buchwald D. The association between prolonged fatigue and cardiovascular disease in World War II veteran twins. Twin Res 2004;7:571–7. [DOI] [PubMed] [Google Scholar]
- 50. Strandberg TE, Kovanen PT, Eklund KK. Is the “lipid paradox” in rheumatoid arthritis really a paradox? Comment on the article by Bartels et al. Arthritis Rheum 2011;63:3644–5; author reply: 5–6. [DOI] [PubMed] [Google Scholar]
- 51. Strandberg TE, Saijonmaa O, Fyhrquist F, Tilvis RS, Strandberg AY, Miettinen TA, Pitkala KH, Salomaa V. Telomere length in old age and cholesterol across the life course. J Am Geriatr Soc 2011;59:1979–81. [DOI] [PubMed] [Google Scholar]
- 52. Strandberg TE, Saijonmaa O, Tilvis RS, Pitkala KH, Strandberg AY, Miettinen TA, Fyhrquist F. Association of telomere length in older men with mortality and midlife body mass index and smoking. J Gerontol A Biol Sci Med Sci 2011;66:815–20. [DOI] [PubMed] [Google Scholar]
- 53. Rode L, Nordestgaard BG, Weischer M, Bojesen SE. Increased body mass index, elevated C-reactive protein, and short telomere length. J Clin Endocrinol Metab 2014;99:E1671–5. [DOI] [PubMed] [Google Scholar]
- 54. Skamra C, Romero-Diaz J, Sandhu A, Huang Q, Lee J, Pearce W, McPherson DD, Sutton-Tyrrell K, Pope R, Ramsey-Goldman R. Telomere length in patients with systemic lupus erythematosus and its associations with carotid plaque. Rheumatology 2013;52:1101–8. [DOI] [PMC free article] [PubMed] [Google Scholar]
- 55. Kark JD, Goldberger N, Kimura M, Sinnreich R, Aviv A. Energy intake and leukocyte telomere length in young adults. Am J Clin Nutr 2012;95:479–87. [DOI] [PMC free article] [PubMed] [Google Scholar]
- 56. Kark JD, Nassar H, Shaham D, Sinnreich R, Goldberger N, Aboudi V, Bogot NR, Kimura M, Aviv A. Leukocyte telomere length and coronary artery calcification in Palestinians. Atherosclerosis 2013;229:363–8. [DOI] [PubMed] [Google Scholar]
- 57. Harris SE, Martin-Ruiz C, von Zglinicki T, Starr JM, Deary IJ. Telomere length and aging biomarkers in 70-year-olds: the Lothian Birth Cohort 1936. Neurobiol Aging 2012;33:1486, e3–8. [DOI] [PubMed] [Google Scholar]
- 58. Deary IJ, Gow AJ, Taylor MD, Corley J, Brett C, Wilson V, Campbell H, Whalley LJ, Visscher PM, Porteous DJ, et al. The Lothian Birth Cohort 1936: a study to examine influences on cognitive ageing from age 11 to age 70 and beyond. BMC Geriatr 2007;7:28. [DOI] [PMC free article] [PubMed] [Google Scholar]
- 59. Zannolli R, Mohn A, Buoni S, Pietrobelli A, Messina M, Chiarelli F, Miracco C. Telomere length and obesity. Acta Paediatr 2008;97:952–4. [DOI] [PubMed] [Google Scholar]
- 60. Iglesias Molli AE, Panero J, Dos Santos PC, Gonzalez CD, Vilarino J, Sereday M, Cerrone GE, Slavutsky I, Frechtel GD. Metabolically healthy obese women have longer telomere length than obese women with metabolic syndrome. PLoS One 2017;12:e0174945. [DOI] [PMC free article] [PubMed] [Google Scholar]
- 61. Xue HM, Liu QQ, Tian G, Quan LM, Zhao Y, Cheng G. Television watching and telomere length among adults in southwest China. Am J Public Health 2017;107:1425–32. [DOI] [PMC free article] [PubMed] [Google Scholar]
- 62. Diaz VA, Mainous AG III, Everett CJ, Schoepf UJ, Codd V, Samani NJ. Effect of healthy lifestyle behaviors on the association between leukocyte telomere length and coronary artery calcium. Am J Cardiol 2010;106:659–63. [DOI] [PubMed] [Google Scholar]
- 63. Willeit P, Willeit J, Brandstatter A, Ehrlenbach S, Mayr A, Gasperi A, Weger S, Oberhollenzer F, Reindl M, Kronenberg F, et al. Cellular aging reflected by leukocyte telomere length predicts advanced atherosclerosis and cardiovascular disease risk. Arterioscler Thromb Vasc Biol 2010;30:1649–56. [DOI] [PubMed] [Google Scholar]
- 64. Willeit P, Willeit J, Mayr A, Weger S, Oberhollenzer F, Brandstatter A, Kronenberg F, Kiechl S. Telomere length and risk of incident cancer and cancer mortality. JAMA 2010;304:69–75. [DOI] [PubMed] [Google Scholar]
- 65. Zheng YL, Ambrosone C, Byrne C, Davis W, Nesline M, McCann SE. Telomere length in blood cells and breast cancer risk: investigations in two case-control studies. Breast Cancer Res Treat 2010;120:769–75. [DOI] [PMC free article] [PubMed] [Google Scholar]
- 66. Mainous AG III, Codd V, Diaz VA, Schoepf UJ, Everett CJ, Player MS, Samani NJ. Leukocyte telomere length and coronary artery calcification. Atherosclerosis 2010;210:262–7. [DOI] [PubMed] [Google Scholar]
- 67. Mainous AG III, Everett CJ, Diaz VA, Baker R, Mangino M, Codd V, Samani NJ. Leukocyte telomere length and marital status among middle-aged adults. Age Ageing 2011;40:73–8. [DOI] [PMC free article] [PubMed] [Google Scholar]
- 68. Ehrlenbach S, Willeit P, Kiechl S, Willeit J, Reindl M, Schanda K, Kronenberg F, Brandstatter A. Influences on the reduction of relative telomere length over 10 years in the population-based Bruneck study: introduction of a well-controlled high-throughput assay. Int J Epidemiol 2009;38:1725–34. [DOI] [PubMed] [Google Scholar]
- 69. Bull CF, O'Callaghan NJ, Mayrhofer G, Fenech MF. Telomere length in lymphocytes of older South Australian men may be inversely associated with plasma homocysteine. Rejuvenation Res 2009;12:341–9. [DOI] [PubMed] [Google Scholar]
- 70. Cross JA, Brennan C, Gray T, Temple RC, Dozio N, Hughes JC, Levell NJ, Murphy H, Fowler D, Hughes DA, et al. Absence of telomere shortening and oxidative DNA damage in the young adult offspring of women with pre-gestational type 1 diabetes. Diabetologia 2009;52:226–34. [DOI] [PubMed] [Google Scholar]
- 71. Nettleton JA, Diez-Roux A, Jenny NS, Fitzpatrick AL, Jacobs DR Jr.. Dietary patterns, food groups, and telomere length in the Multi-Ethnic Study of Atherosclerosis (MESA). Am J Clin Nutr 2008;88:1405–12. [DOI] [PMC free article] [PubMed] [Google Scholar]
- 72. Roux AV, Ranjit N, Jenny NS, Shea S, Cushman M, Fitzpatrick A, Seeman T. Race/ethnicity and telomere length in the Multi-Ethnic Study of Atherosclerosis. Aging Cell 2009;8:251–7. [DOI] [PMC free article] [PubMed] [Google Scholar]
- 73. Salpea KD, Nicaud V, Tiret L, Talmud PJ, Humphries SE. The association of telomere length with paternal history of premature myocardial infarction in the European Atherosclerosis Research Study II. J Mol Med (Berl) 2008;86:815–24. [DOI] [PMC free article] [PubMed] [Google Scholar]
- 74. Puterman E, Lin J, Blackburn E, O'Donovan A, Adler N, Epel E. The power of exercise: buffering the effect of chronic stress on telomere length. PLoS One 2010;5:e10837. [DOI] [PMC free article] [PubMed] [Google Scholar]
- 75. Atzmon G, Cho M, Cawthon RM, Budagov T, Katz M, Yang X, Siegel G, Bergman A, Huffman DM, Schechter CB, et al. Evolution in health and medicine Sackler colloquium: genetic variation in human telomerase is associated with telomere length in Ashkenazi centenarians. Proc Natl Acad Sci USA 2010;107(Suppl 1):1710–7. [DOI] [PMC free article] [PubMed] [Google Scholar]
- 76. Hou L, Savage SA, Blaser MJ, Perez-Perez G, Hoxha M, Dioni L, Pegoraro V, Dong LM, Zatonski W, Lissowska J, et al. Telomere length in peripheral leukocyte DNA and gastric cancer risk. Cancer Epidemiol Biomarkers Prev 2009;18:3103–9. [DOI] [PMC free article] [PubMed] [Google Scholar]
- 77. Kananen L, Surakka I, Pirkola S, Suvisaari J, Lonnqvist J, Peltonen L, Ripatti S, Hovatta I. Childhood adversities are associated with shorter telomere length at adult age both in individuals with an anxiety disorder and controls. PLoS One 2010;5:e10826. [DOI] [PMC free article] [PubMed] [Google Scholar]
- 78. Kim S, Parks CG, DeRoo LA, Chen H, Taylor JA, Cawthon RM, Sandler DP. Obesity and weight gain in adulthood and telomere length. Cancer Epidemiol Biomarkers Prev 2009;18:816–20. [DOI] [PMC free article] [PubMed] [Google Scholar]
- 79. Kurz DJ, Kloeckener-Gruissem B, Akhmedov A, Eberli FR, Buhler I, Berger W, Bertel O, Luscher TF. Degenerative aortic valve stenosis, but not coronary disease, is associated with shorter telomere length in the elderly. Arterioscler Thromb Vasc Biol 2006;26:e114–7. [DOI] [PubMed] [Google Scholar]
- 80. Mather KA, Jorm AF, Milburn PJ, Tan X, Easteal S, Christensen H. No associations between telomere length and age-sensitive indicators of physical function in mid and later life. J Gerontol A Biol Sci Med Sci 2010;65:792–9. [DOI] [PubMed] [Google Scholar]
- 81. Pavanello S, Hoxha M, Dioni L, Bertazzi PA, Snenghi R, Nalesso A, Ferrara SD, Montisci M, Baccarelli A. Shortened telomeres in individuals with abuse in alcohol consumption. Int J Cancer 2011;129:983–92. [DOI] [PMC free article] [PubMed] [Google Scholar]
- 82. Lee M, Martin H, Firpo MA, Demerath EW. Inverse association between adiposity and telomere length: the Fels Longitudinal Study. Am J Hum Biol 2011;23:100–6. [DOI] [PMC free article] [PubMed] [Google Scholar]
- 83. Barrera G, Cases T, Bunout D, de la Maza MP, Leiva L, Rodriguez JM, Hirsch S. Associations between socioeconomic status, aging and functionality among older women. Geriatr Nurs 2017;38(4):347–51 [DOI] [PubMed] [Google Scholar]
- 84. Bunout D, Barrera G, de la Maza MP, Leiva L, Hirsch S. Effect of weight maintenance or gain in a 10 years period over telomere length, sirtuin 1 and 6 expression and carotid intima media thickness. J Hum Nutr Diet 2015;28:155–64. [DOI] [PubMed] [Google Scholar]
- 85. Jackowska M, Hamer M, Carvalho LA, Erusalimsky JD, Butcher L, Steptoe A. Short sleep duration is associated with shorter telomere length in healthy men: findings from the Whitehall II cohort study. PLoS One 2012;7:e47292. [DOI] [PMC free article] [PubMed] [Google Scholar]
- 86. Zalli A, Carvalho LA, Lin J, Hamer M, Erusalimsky JD, Blackburn EH, Steptoe A. Shorter telomeres with high telomerase activity are associated with raised allostatic load and impoverished psychosocial resources. Proc Natl Acad Sci USA 2014;111:4519–24. [DOI] [PMC free article] [PubMed] [Google Scholar]
- 87. Wong JY, De Vivo I, Lin X, Christiani DC. Cumulative PM(2.5) exposure and telomere length in workers exposed to welding fumes. J Toxicol Environ Health A 2014;77:441–55. [DOI] [PMC free article] [PubMed] [Google Scholar]
- 88. Wong JY, De Vivo I, Lin X, Grashow R, Cavallari J, Christiani DC. The association between global DNA methylation and telomere length in a longitudinal study of boilermakers. Genet Epidemiol 2014;38:254–64. [DOI] [PMC free article] [PubMed] [Google Scholar]
- 89. Boardman LA, Litzelman K, Seo S, Johnson RA, Vanderboom RJ, Kimmel GW, Cunningham JM, Gangnon RE, Engelman CD, Riegert-Johnson DL, et al. The association of telomere length with colorectal cancer differs by the age of cancer onset. Clin Transl Gastroenterol 2014;5:e52. [DOI] [PMC free article] [PubMed] [Google Scholar]
- 90. Skinner HG, Gangnon RE, Litzelman K, Johnson RA, Chari ST, Petersen GM, Boardman LA. Telomere length and pancreatic cancer: a case-control study. Cancer Epidemiol Biomarkers Prev 2012;21:2095–100. [DOI] [PMC free article] [PubMed] [Google Scholar]
- 91. Savolainen K, Eriksson JG, Kajantie E, Lahti M, Raikkonen K. The history of sleep apnea is associated with shorter leukocyte telomere length: the Helsinki Birth Cohort Study. Sleep Med 2014;15:209–12. [DOI] [PubMed] [Google Scholar]
- 92. Savolainen K, Raikkonen K, Kananen L, Kajantie E, Hovatta I, Lahti M, Lahti J, Pesonen AK, Heinonen K, Eriksson JG. History of mental disorders and leukocyte telomere length in late adulthood: the Helsinki Birth Cohort Study (HBCS). J Psychiatr Res 2012;46:1346–53. [DOI] [PubMed] [Google Scholar]
- 93. Hoen PW, Rosmalen JG, Schoevers RA, Huzen J, van der Harst P, de Jonge P. Association between anxiety but not depressive disorders and leukocyte telomere length after 2 years of follow-up in a population-based sample. Psychol Med 2013;43:689–97. [DOI] [PubMed] [Google Scholar]
- 94. Huzen J, Wong LS, van Veldhuisen DJ, Samani NJ, Zwinderman AH, Codd V, Cawthon RM, Benus GF, van der Horst IC, Navis G, et al. Telomere length loss due to smoking and metabolic traits. J Intern Med 2014;275:155–63. [DOI] [PubMed] [Google Scholar]
- 95. Kingma EM, de Jonge P, van der Harst P, Ormel J, Rosmalen JG. The association between intelligence and telomere length: a longitudinal population based study. PLoS One 2012;7:e49356. [DOI] [PMC free article] [PubMed] [Google Scholar]
- 96. Zhao J, Zhu Y, Lin J, Matsuguchi T, Blackburn E, Zhang Y, Cole SA, Best LG, Lee ET, Howard BV. Short leukocyte telomere length predicts risk of diabetes in American Indians: the Strong Heart Family Study. Diabetes 2014;63:354–62. [DOI] [PMC free article] [PubMed] [Google Scholar]
- 97. Zhu Y, Voruganti VS, Lin J, Matsuguchi T, Blackburn E, Best LG, Lee ET, MacCluer JW, Cole SA, Zhao J. QTL mapping of leukocyte telomere length in American Indians: the Strong Heart Family Study. Aging 2013;5:704–16. [DOI] [PMC free article] [PubMed] [Google Scholar]
- 98. Garcia-Calzon S, Gea A, Razquin C, Corella D, Lamuela-Raventos RM, Martinez JA, Martinez-Gonzalez MA, Zalba G, Marti A. Longitudinal association of telomere length and obesity indices in an intervention study with a Mediterranean diet: the PREDIMED-NAVARRA trial. Int J Obes (Lond) 2014;38:177–82. [DOI] [PubMed] [Google Scholar]
- 99. Needham BL, Adler N, Gregorich S, Rehkopf D, Lin J, Blackburn EH, Epel ES. Socioeconomic status, health behavior, and leukocyte telomere length in the National Health and Nutrition Examination Survey, 1999–2002. Soc Sci Med 2013;85:1–8. [DOI] [PMC free article] [PubMed] [Google Scholar]
- 100. Cui Y, Cai Q, Qu S, Chow WH, Wen W, Xiang YB, Wu J, Rothman N, Yang G, Shu XO, et al. Association of leukocyte telomere length with colorectal cancer risk: nested case-control findings from the Shanghai Women's Health Study. Cancer Epidemiol Biomarkers Prev 2012;21:1807–13. [DOI] [PMC free article] [PubMed] [Google Scholar]
- 101. Kozlitina J, Garcia CK. Red blood cell size is inversely associated with leukocyte telomere length in a large multi-ethnic population. PLoS One 2012;7:e51046. [DOI] [PMC free article] [PubMed] [Google Scholar]
- 102. Pellatt AJ, Wolff RK, Lundgreen A, Cawthon R, Slattery ML. Genetic and lifestyle influence on telomere length and subsequent risk of colon cancer in a case control study. Int J Mol Epidemiol Genet 2012;3:184–94. [PMC free article] [PubMed] [Google Scholar]
- 103. Broer L, Raschenberger J, Deelen J, Mangino M, Codd V, Pietilainen KH, Albrecht E, Amin N, Beekman M, de Craen AJ, et al. Association of adiponectin and leptin with relative telomere length in seven independent cohorts including 11,448 participants. Eur J Epidemiol 2014;29:629–38. [DOI] [PubMed] [Google Scholar]
- 104. Hofmann JN, Baccarelli A, Schwartz K, Davis FG, Ruterbusch JJ, Hoxha M, McCarthy BJ, Savage SA, Wacholder S, Rothman N, et al. Risk of renal cell carcinoma in relation to blood telomere length in a population-based case-control study. Br J Cancer 2011;105:1772–5. [DOI] [PMC free article] [PubMed] [Google Scholar]
- 105. Kajantie E, Pietilainen KH, Wehkalampi K, Kananen L, Raikkonen K, Rissanen A, Hovi P, Kaprio J, Andersson S, Eriksson JG, et al. No association between body size at birth and leucocyte telomere length in adult life—evidence from three cohort studies. Int J Epidemiol 2012;41:1400–8. [DOI] [PubMed] [Google Scholar]
- 106. Chen S, Lin J, Matsuguchi T, Blackburn E, Yeh F, Best LG, Devereux RB, Lee ET, Howard BV, Roman MJ, et al. Short leukocyte telomere length predicts incidence and progression of carotid atherosclerosis in American Indians: the Strong Heart Family Study. Aging 2014;6:414–27. [DOI] [PMC free article] [PubMed] [Google Scholar]
- 107. Chen S, Yeh F, Lin J, Matsuguchi T, Blackburn E, Lee ET, Howard BV, Zhao J. Short leukocyte telomere length is associated with obesity in American Indians: the Strong Heart Family Study. Aging 2014;6:380–9. [DOI] [PMC free article] [PubMed] [Google Scholar]
- 108. Savolainen K, Eriksson JG, Kajantie E, Lahti J, Raikkonen K. Telomere length and hypothalamic-pituitary-adrenal axis response to stress in elderly adults. Psychoneuroendocrinology 2015;53:179–84. [DOI] [PubMed] [Google Scholar]
- 109. Savolainen K, Eriksson JG, Kajantie E, Pesonen AK, Raikkonen K. Associations between the five-factor model of personality and leukocyte telomere length in elderly men and women: the Helsinki Birth Cohort Study (HBCS). J Psychosom Res 2015;79(3):233–8. [DOI] [PubMed] [Google Scholar]
- 110. Savolainen K, Eriksson JG, Kananen L, Kajantie E, Pesonen AK, Heinonen K, Raikkonen K. Associations between early life stress, self-reported traumatic experiences across the lifespan and leukocyte telomere length in elderly adults. Biol Psychol 2014;97:35–42. [DOI] [PubMed] [Google Scholar]
- 111. Tiainen AM, Mannisto S, Blomstedt PA, Moltchanova E, Perala MM, Kaartinen NE, Kajantie E, Kananen L, Hovatta I, Eriksson JG. Leukocyte telomere length and its relation to food and nutrient intake in an elderly population. Eur J Clin Nutr 2012;66:1290–4. [DOI] [PubMed] [Google Scholar]
- 112. Laine MK, Eriksson JG, Kujala UM, Raj R, Kaprio J, Backmand HM, Peltonen M, Sarna S. Effect of intensive exercise in early adult life on telomere length in later life in men. J Sports Sci Med 2015;14:239–45. [PMC free article] [PubMed] [Google Scholar]
- 113. Loukola A, Wedenoja J, Keskitalo-Vuokko K, Broms U, Korhonen T, Ripatti S, Sarin AP, Pitkaniemi J, He L, Happola A, et al. Genome-wide association study on detailed profiles of smoking behavior and nicotine dependence in a twin sample. Mol Psychiatry 2014;19:615–24. [DOI] [PMC free article] [PubMed] [Google Scholar]
- 114. Kim S, Sandler DP, Carswell G, De Roo LA, Parks CG, Cawthon R, Weinberg CR, Taylor JA. Telomere length in peripheral blood and breast cancer risk in a prospective case-cohort analysis: results from the Sister Study. Cancer Causes Control 2011;22:1061–6. [DOI] [PMC free article] [PubMed] [Google Scholar]
- 115. Eisenberg DT, Hayes MG, Kuzawa CW. Delayed paternal age of reproduction in humans is associated with longer telomeres across two generations of descendants. Proc Natl Acad Sci USA 2012;109:10251–6. [DOI] [PMC free article] [PubMed] [Google Scholar]
- 116. Mason C, Risques RA, Xiao L, Duggan CR, Imayama I, Campbell KL, Kong A, Foster-Schubert KE, Wang CY, Alfano CM, et al. Independent and combined effects of dietary weight loss and exercise on leukocyte telomere length in postmenopausal women. Obesity (Silver Spring) 2013;21:E549–54. [DOI] [PMC free article] [PubMed] [Google Scholar]
- 117. Comijs HC, van Marwijk HW, van der Mast RC, Naarding P, Oude Voshaar RC, Beekman AT, Boshuisen M, Dekker J, Kok R, de Waal MW, et al. The Netherlands Study of Depression in Older Persons (NESDO); a prospective cohort study. BMC Res Notes 2011;4:524. [DOI] [PMC free article] [PubMed] [Google Scholar]
- 118. Penninx BW, Beekman AT, Smit JH, Zitman FG, Nolen WA, Spinhoven P, Cuijpers P, De Jong PJ, Van Marwijk HW, Assendelft WJ, et al. The Netherlands Study of Depression and Anxiety (NESDA): rationale, objectives and methods. Int J Methods Psychiatr Res 2008;17:121–40. [DOI] [PMC free article] [PubMed] [Google Scholar]
- 119. Miranda-Furtado CL, Ramos FK, Kogure GS, Santana-Lemos BA, Ferriani RA, Calado RT, Dos Reis RM. A nonrandomized trial of progressive resistance training intervention in women with polycystic ovary syndrome and its implications in telomere content. Reprod Sci 2016;23:644–54. [DOI] [PubMed] [Google Scholar]
- 120. Denham J, Nelson CP, O'Brien BJ, Nankervis SA, Denniff M, Harvey JT, Marques FZ, Codd V, Zukowska-Szczechowska E, Samani NJ, et al. Longer leukocyte telomeres are associated with ultra-endurance exercise independent of cardiovascular risk factors. PLoS One 2013;8:e69377. [DOI] [PMC free article] [PubMed] [Google Scholar]
- 121. Chilton WL, Marques FZ, West J, Kannourakis G, Berzins SP, O'Brien BJ, Charchar FJ. Acute exercise leads to regulation of telomere-associated genes and microRNA expression in immune cells. PLoS One 2014;9:e92088. [DOI] [PMC free article] [PubMed] [Google Scholar]
- 122. Bloomer LD, Nelson CP, Denniff M, Christofidou P, Debiec R, Thompson J, Zukowska-Szczechowska E, Samani NJ, Charchar FJ, Tomaszewski M. Coronary artery disease predisposing haplogroup I of the Y chromosome, aggression and sex steroids—genetic association analysis. Atherosclerosis 2014;233:160–4. [DOI] [PubMed] [Google Scholar]
- 123. Gerstorf D, Bertram L, Lindenberger U, Pawelec G, Demuth I, Steinhagen-Thiessen E, Wagner GG. Editorial. Gerontology 2016;62:311–5. [DOI] [PubMed] [Google Scholar]
- 124. Bertram L, Bockenhoff A, Demuth I, Duzel S, Eckardt R, Li SC, Lindenberger U, Pawelec G, Siedler T, Wagner GG, et al. Cohort profile: The Berlin Aging Study II (BASE-II). Int J Epidemiol 2014;43:703–12. [DOI] [PubMed] [Google Scholar]
- 125. Meyer A, Salewsky B, Buchmann N, Steinhagen-Thiessen E, Demuth I. Relative leukocyte telomere length, hematological parameters and anemia—data from the Berlin Aging Study II (BASE-II). Gerontology 2016;62:330–6. [DOI] [PubMed] [Google Scholar]
- 126. Khalangot M, Krasnienkov D, Vaiserman A, Avilov I, Kovtun V, Okhrimenko N, Koliada A, Kravchenko V. Leukocyte telomere length is inversely associated with post-load but not with fasting plasma glucose levels. Exp Biol Med (Maywood) 2017;242:700–8. [DOI] [PMC free article] [PubMed] [Google Scholar]
- 127. Starnino L, Busque L, Tardif JC, D'Antono B. Psychological profiles in the prediction of leukocyte telomere length in healthy individuals. PLoS One 2016;11:e0165482. [DOI] [PMC free article] [PubMed] [Google Scholar]
- 128. Kasielski M, Eusebio MO, Pietruczuk M, Nowak D. The relationship between peripheral blood mononuclear cells telomere length and diet - unexpected effect of red meat. Nutr J 2016;15:68. [DOI] [PMC free article] [PubMed] [Google Scholar]
- 129. McDonnell BJ, Yasmin, Butcher L, Cockcroft JR, Wilkinson IB, Erusalimsky JD, McEniery CM. The age-dependent association between aortic pulse wave velocity and telomere length. J Physiol 2017;595:1627–35. [DOI] [PMC free article] [PubMed] [Google Scholar]
- 130. Yim OS, Zhang X, Shalev I, Monakhov M, Zhong S, Hsu M, Chew SH, Lai PS, Ebstein RP. Delay discounting, genetic sensitivity, and leukocyte telomere length. Proc Natl Acad Sci USA 2016;113:2780–5. [DOI] [PMC free article] [PubMed] [Google Scholar]
- 131. Wang X, Sundquist K, Hedelius A, Palmer K, Memon AA, Sundquist J. Leukocyte telomere length and depression, anxiety and stress and adjustment disorders in primary health care patients. BMC Psychiatry 2017;17:148. [DOI] [PMC free article] [PubMed] [Google Scholar]
- 132. Gerstein HC, Yusuf S, Holman R, Bosch J, Pogue J; Dream Trial Investigators. Rationale, design and recruitment characteristics of a large, simple international trial of diabetes prevention: the DREAM trial. Diabetologia 2004;47:1519–27. [DOI] [PubMed] [Google Scholar]
- 133. Yusuf S, Hawken S, Ounpuu S, Dans T, Avezum A, Lanas F, McQueen M, Budaj A, Pais P, Varigos J, et al. Effect of potentially modifiable risk factors associated with myocardial infarction in 52 countries (the INTERHEART study): case-control study. Lancet 2004;364:937–52. [DOI] [PubMed] [Google Scholar]
- 134. van der Harst P, van der Steege G, de Boer RA, Voors AA, Hall AS, Mulder MJ, van Gilst WH, van Veldhuisen DJ; Merit-Hf Study Group. Telomere length of circulating leukocytes is decreased in patients with chronic heart failure. J Am Coll Cardiol 2007;49:1459–64. [DOI] [PubMed] [Google Scholar]
- 135. Steenstrup T, Hjelmborg JV, Mortensen LH, Kimura M, Christensen K, Aviv A. Leukocyte telomere dynamics in the elderly. Eur J Epidemiol 2013;28:181–7. [DOI] [PMC free article] [PubMed] [Google Scholar]
- 136. Muezzinler A, Zaineddin AK, Brenner H. A systematic review of leukocyte telomere length and age in adults. Ageing Res Rev 2013;12:509–19. [DOI] [PubMed] [Google Scholar]
- 137. de Heredia FP, Gomez-Martinez S, Marcos A. Obesity, inflammation and the immune system. Proc Nutr Soc 2012;71:332–8. [DOI] [PubMed] [Google Scholar]
- 138. Spiegelman D, Israel RG, Bouchard C, Willett WC. Absolute fat mass, percent body fat, and body-fat distribution: which is the real determinant of blood pressure and serum glucose? Am J Clin Nutr 1992;55:1033–44. [DOI] [PubMed] [Google Scholar]
- 139. Manson JE, Bassuk SS, Hu FB, Stampfer MJ, Colditz GA, Willett WC. Estimating the number of deaths due to obesity: can the divergent findings be reconciled? J Womens Health 2007;16:168–76. [DOI] [PubMed] [Google Scholar]
- 140. Aviv A, Valdes AM, Spector TD. Human telomere biology: pitfalls of moving from the laboratory to epidemiology. Int J Epidemiol 2006;35:1424–9. [DOI] [PubMed] [Google Scholar]
- 141. Lin J, Epel E, Cheon J, Kroenke C, Sinclair E, Bigos M, Wolkowitz O, Mellon S, Blackburn E. Analyses and comparisons of telomerase activity and telomere length in human T and B cells: insights for epidemiology of telomere maintenance. J Immunol Methods 2010;352:71–80. [DOI] [PMC free article] [PubMed] [Google Scholar]
- 142. Freedman DS, Gates L, Flanders WD, Van Assendelft OW, Barboriak JJ, Joesoef MR, Byers T. Black/white differences in leukocyte subpopulations in men. Int J Epidemiol 1997;26:757–64. [DOI] [PubMed] [Google Scholar]
- 143. Camhi SM, Bray GA, Bouchard C, Greenway FL, Johnson WD, Newton RL, Ravussin E, Ryan DH, Smith SR, Katzmarzyk PT. The relationship of waist circumference and BMI to visceral, subcutaneous, and total body fat: sex and race differences. Obesity (Silver Spring) 2011;19:402–8. [DOI] [PMC free article] [PubMed] [Google Scholar]
- 144. Fitzpatrick AL, Kronmal RA, Gardner JP, Psaty BM, Jenny NS, Tracy RP, Walston J, Kimura M, Aviv A. Leukocyte telomere length and cardiovascular disease in the cardiovascular health study. Am J Epidemiol 2007;165:14–21. [DOI] [PubMed] [Google Scholar]
- 145. Benetos A, Kark JD, Susser E, Kimura M, Sinnreich R, Chen W, Steenstrup T, Christensen K, Herbig U, von Bornemann Hjelmborg J, et al. Tracking and fixed ranking of leukocyte telomere length across the adult life course. Aging Cell 2013;12:615–21. [DOI] [PMC free article] [PubMed] [Google Scholar]
- 146. Broer L, Codd V, Nyholt DR, Deelen J, Mangino M, Willemsen G, Albrecht E, Amin N, Beekman M, de Geus EJ, et al. Meta-analysis of telomere length in 19,713 subjects reveals high heritability, stronger maternal inheritance and a paternal age effect. Eur J Hum Genet 2013;21:1163–8. [DOI] [PMC free article] [PubMed] [Google Scholar]
- 147. Adaikalakoteswari A, Balasubramanyam M, Mohan V. Telomere shortening occurs in Asian Indian type 2 diabetic patients. Diabet Med 2005;22:1151–6. [DOI] [PubMed] [Google Scholar]
- 148. Raschenberger J, Kollerits B, Hammerer-Lercher A, Rantner B, Stadler M, Haun M, Klein-Weigel P, Fraedrich G, Kronenberg F. The association of relative telomere length with symptomatic peripheral arterial disease: results from the CAVASIC study. Atherosclerosis 2013;229:469–74. [DOI] [PubMed] [Google Scholar]
- 149. Heid IM, Wagner SA, Gohlke H, Iglseder B, Mueller JC, Cip P, Ladurner G, Reiter R, Stadlmayr A, Mackevics V, et al. Genetic architecture of the APM1 gene and its influence on adiponectin plasma levels and parameters of the metabolic syndrome in 1,727 healthy Caucasians. Diabetes 2006;55:375–84. [DOI] [PubMed] [Google Scholar]
Associated Data
This section collects any data citations, data availability statements, or supplementary materials included in this article.