

SUMMARY
Chromatin immunoprecipitation followed by high-throughput sequencing (ChIP-seq) has enabled discovery of genomic regions enriched with biological signals such as transcription factor binding and histone modifications. Allelic-imbalance (ALI) detection is a complementary analysis of ChIP-seq data for associating biological signals with single nucleotide polymorphisms (SNPs). It has been successfully used in elucidating functional roles of non-coding SNPs. Commonly used statistical approaches for ALI detection are often based on binomial testing and mixture models, both of which rely on strong assumptions on the distribution of the unobserved allelic probability, and have significant practical shortcomings. We propose Non-Parametric Binomial (NPBin) test for ALI detection and for modeling Binomial data in general. NPBin models the density of the unobserved allelic probability non-parametrically, and estimates its empirical null distribution via curve fitting. We demonstrate the advantages of NPBin in terms of interpretability of the estimated density and the accuracy in ALI detection using simulations and analysis of several ChIP-seq data sets. We also illustrate the generality of our modeling framework beyond ALI detection by an application to a baseball batting average prediction problem. This article has supplementary material available at Biostatistics online. The code and the sample input data have been also deposited to github https://github.com/QiZhangStat/ALIdetection.
Keywords: Allelic-imbalance, ChIP-seq, Empirical Bayes, Non-parametric density estimation, Spline
1. Introduction
Chromatin immunoprecipitation followed by high-throughput sequencing (ChIP-seq) has been widely used for genome-wide profiling of histone modifications and transcription factor (TF)–DNA interactions. ChIP-seq experiments generate sequencing reads from sheared DNA fragments that are enriched at genomic locations with the specific TF–DNA interaction or histone modification of interest. A standard ChIP-seq analysis pipeline maps these reads to the corresponding reference genome (i.e., the typical whole genome sequence of the samples) and identifies ChIP-seq peaks (Kharchenko and others, 2008). These peaks are short genomic intervals with higher than expected read counts and are candidates for harboring the signal of interest. When there are two or more experimental groups, it is also typical to study differential enrichment of signal within the peaks (Liang and Keleş, 2012). This pipeline generally handles other high-throughput sequencing experiments such as DNase-seq (Boyle and others, 2011) and ATAC-seq (Buenrostro and others, 2013) for chromatin accessibility, whose main goal is similar to that of ChIP-seq, i.e., discovering genomic regions harboring certain types of signals. We will also refer to these as ChIP-seq experiments in this article.
Standard ChIP-seq data analysis pipelines ignore the differences in DNA sequence among individuals by mapping reads to the reference genome. The diploid genomes consist of one maternal and one paternal copy of the genome. At each genomic position, the paternal and maternal alleles could be different than each other. The majority of these differences are in the form of heterozygous single-nucleotide polymorphism (SNP), which is one letter substitution. Such one nucleotide difference may be associated with significant differences in ChIP-seq signals. Each ChIP-seq peak on the reference genome consists of piles of reads from the maternal and the paternal genomes. At a heterozygous SNP, we may observe more reads from one allele than the other, which in turn may suggest a functional difference between the two alleles (Figure 1(a)). Such difference in ChIP-seq signals at heterozygeous SNPs is referred to as allelic-imbalance (ALI) because it characterizes an imbalance between the two alleles at the biological signal level (e.g., read counts) at heterozygeous SNPs. We remark that ALI observed at heterozygeous SNPs are not necessarily due to genotypic differences. They could be due to other molecular mechanisms such as imprinting. ALI events could also take place at loci where the two alleles are identical. In this article, we focus on ALI at heterozygeous SNPs because ALI signals in ChIP-seq are only observable at such loci. Hetetozygeous SNPs function as markers that differentiate the sequencing reads from the two alleles; hence, detecting ALI can also be viewed as a differential enrichment analysis between the two alleles. Studying ALI is important as it associates the genotype (SNPs) with the epigenetic signal (e.g., ChIP-seq peak) in vivo with internal control, and provides potential molecular mechanisms that enable interpretation of association SNPS from genome-wide association studies (GWAS). For example, Verlaan and others (2009) further dissected a region associated with asthma, type 1 diabetes, primary biliary cirrhosis, and Crohn disease. They showed that a common disease allele with a strong association with asthma was also linked to changes in CTCF binding and nucleosome occupancy leading to altered domain-wide cis-regulation. This brought them one step closer to elucidating a potential mechanism for genetic susceptibility of asthma.
Fig. 1.

Definition and detection of ALI in ChIP-seq data. (a) Each ChIP-seq peak with a heterozygous SNP consists of reads from the paternal (Pat) and the maternal (Mat) alleles. On the left is a peak with the majority of the reads from Mat; the middle peak has equal numbers of reads from both alleles; while the peak on the right is dominated by the Pat reads. Both the left and right peaks with heterozygeous SNPs exhibit ALI. (b) A typical ALI detection pipeline: (i) Alignment. Identifying the genomic origin and the contributing allele of each read; (ii) Read counting. Tallying the total read count (Pat+Mat) and the Mat read count at each SNP; and (iii) Statistical testing. For each SNP, deciding on the winning allele and inferring whether the difference between Mat and Pat read counts reach a certain statistical significance.
Detecting ALI includes three steps (Figure 1(b)): (i) Alignment: map the reads, and assign each read to an allele; (ii) Read counting: count the reads at the SNPs of interests; and (iii) Statistical testing: determine the statistical significance and adjust for multiple testing. In this article, we focus on the last step where the ALI status is inferred at each heterozygous SNP within ChIP-seq peaks based on the counts from each allele. For simplicity and following the standard assumptions in literature, we assume no error in genotyping, no read error at SNP locations, and that the read counts at different SNPs are independent. We then propose Non-Parametric Binomial (NPBin) test, an empirical Bayes test for ALI detection. The major innovation of NPBin includes the non-parametric density estimation for the unobserved allele probability, and approximating the ideal empirical null distribution via curve fitting. The rest of this article is organized as follows. In Section 2, we present the NPBin model, and draw its connections with the current literature on ALI detection. In Section 3, we compare NPBin with several alternatives in simulations and real ChIP-seq data analysis, and further illustrate its generality by a baseball batting average prediction application. We conclude with further discussion in Section 4.
2. ALI detection as a multiple testing problem
Detecting ALI at individual SNP positions can be formulated with the following model. Let  ,
,  , denote a phased heterozygous SNP. For ChIP-seq or any other sequencing data set, let
  and
and  denote the total number of reads and the number of reads from the maternal allele overlapping SNP
  , respectively. We are interested in
  , an indicator variable denoting ALI status at
  . We also define a latent variable
  as the true allelic probability that a read covering
  originates from the maternal allele.
  is biologically meaningful because it characterizes the ALI directly and quantitatively. We use the following hierarchical model for the allelic frequency. For
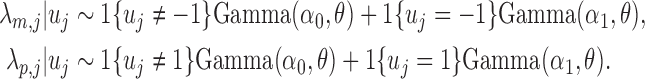
  :
:
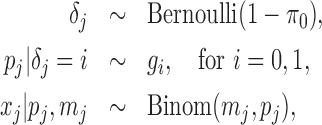 |
(2.1) |
where  is the proportion of SNPs with no ALI and we treat
  as a nuisance parameter. The marginal density of the unobserved allelic probability
  is:
is:
 |
For  , let
, let  be the marginal probability of
  at the SNP without or with ALI. We can also write the overall marginal distribution of
  as
as
 |
Similar hierarchical models have been used in the literature of ALI detection (Skelly and others, 2011; Zhang and others, 2014). Along with other differences, these approaches assume  to be a two-component beta mixture, the disadvantages of which will be discussed later in Section 2.4. In contrast, we propose NPBin test for ALI detection that estimates
  non-parametrically. The formal framework consists of the following steps:
Estimate
 directly via fitting splines.
Estimate
 by approximating the ideal empirical null distribution via curve fitting.
Control the false discovery rate via thresholding the local false discovery rate.
In what follows, we present these steps, discuss the conceptual advantage of NPBin compared to existing approaches, and refer to supplementary material available at Biostatistics online for the implementation details.
2.1. Non-parametric density estimation for the latent true allelic probability
Non-parametric density estimation methods such as Poisson regression over histogram has been used in empirical Bayes testing problems when such histogram of the observed data is meaningful (Efron and others, 2001; Schwartzman, 2008). When the density of a latent variable needs to be estimated, it is often assumed to be discrete or parametric (Liao and others, 2014; Efron, 2016). This is closely connected to the widely studied problem of estimating the mixing density non-parametrically. The works of Laird (1978), Lindsay and others (1983), and Efron (2016) were concerned with the case when the mixing density is discrete. Martin and Tokdar (2012), and Mabon (2016) developed deconvolution methods for additive noise. For the cases with i.i.d. observations, Zhang (1995) derived a kernel estimator using Fourier method, and Roueff and Rydén (2005) and Rebafka and Roueff (2015) discussed the general theoretical framework for orthogonal series estimators. However, we have not identified an existent algorithm for the setting considered in this article where the mixing density is continuous and the non-additive noise depends on a nuisance parameter. This necessitates the development of a new non-parametric estimator.
We propose to estimate  using B-splines. Let
  for
for 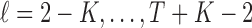 be equally spaced knots, and
  be the normalized K’th order B-spline defined on
 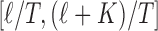 such that
 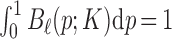 . These basis are restricted within
  and
and  and
and  are discarded. Let
  be a smooth density function which we can approximate as:
 |
(2.2) |
where  are non-negative coefficients summing to 1. Viewing
  as a nuisance parameter, we apply (2.2) to the joint likelihood of
  and obtain
 |
Thus, the marginal likelihood of  is given by
 |
(2.3) |
where  , depending on no unknown parameters.
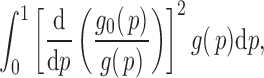
For a given data set, we fix the number of knots and do not include a smoothness penalty as the number of knots already controls the smoothness. The coefficients  ’s are estimated by maximizing
  via an Expectation–Maximization (EM) algorithm (Dempster and others, 1977). Then density in (2.3) can be viewed as a finite mixture distribution. Define
  (
( ) as the indicator that
  is from component
  , then
  , and
, and  . The exact EM-algorithm is as follows.
Initialization. Set
 for
for  and
and  .
.- E-step. For current coefficients
 ,
,
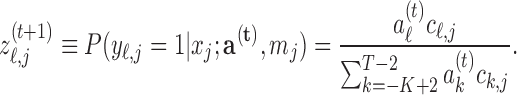
- M-step. Update the coefficients,
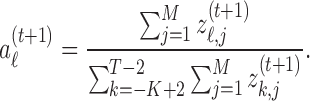
-
Stopping rule. Repeat steps 2–3 until the increase in the following estimated marginal likelihood is small in terms of both the absolute and the relative value.
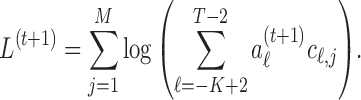 Stop when
where
 is a pre-specified control parameter.
2.2. Approximating the ideal empirical null distribution
Next, we discuss the empirical null distribution. The distribution of the latent variable  is the mixture of the null density
  and
and  , the density under the alternative. For the sake of identifiability, it is often assumed in literature that the density of
  is zero in the center of the bulk region (e.g., an interval around 0 in the case of z-score and correspondingly around
  in our setting), which is referred to as the zero assumption (Efron, 2012). Under this assumption and when the observed data are i.i.d., the null distribution can be estimated empirically using a central-matching method (Efron and others, 2001; Schwartzman, 2008). However, the above methods are not directly applicable when the random variable that follows
  is not observed.
In what follows, we exploit the zero assumption from a different angle and derive our empirical null from the characterization of the ideal null distribution. When the signal is not too weak, the implicit assumption underneath the zero assumption is that  and
and  need to be “separable” to a certain degree, so that ALI detection is possible. Then,
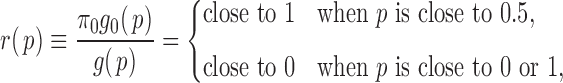 |
with the following most extreme (and ideal) form
 |
(2.4) |
In this case, ALI detection becomes easily tractable. Thus, we denote  that satisfies (2.4) the “ideal null.” We observed that the derivative of
  in (2.4) is zero when it can be defined. Motivated by this, we let
  , and mimic the ideal null by minimizing
 |
(2.5) |
where we assume that  for
for  . This formulation does not require the supports of
  and
and  to be disjoint, but only that the two densities are separable so that the zero assumption is satisfied. Noting that
  for any
  ,
,  can be estimated by
  . In practice, we estimate (2.5) numerically, and set
 |
for a more robust estimate.
2.3. FDR control by local false discovery rate thresholding
The local false discovery rate (locfdr), with the interpretation of  , where
  is the null hypothesis that
  , can be defined as
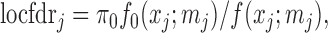 |
and estimated by plugging in estimators  ,
,  , and
, and  of
of  ,
,  , and
, and  . Then, the FDR can be controlled by using the following estimator
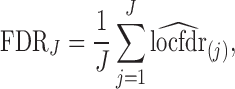 |
where  is the j’th (increasingly) sorted estimated locfdr value. Similar FDR control methods have been used in other genomics problems (Zhao and others, 2013).
2.4. Connection to existing ALI detection methods
The binomial test is widely used for count data from next generation sequencing (Rozowsky and others, 2011). For ALI detection, it treats  to be a point mass at
  and ignores the natural over-dispersion of
  even when there is no ALI. Consequently, it is overpowered when
  is large. Modeling
  as a Beta mixture, where the null
  is one component (potentially with equal shape parameters) and
  consists of the other beta components, is an appealing alternative considered by many (Muralidharan, 2010; Skelly and others, 2011; Zhang and others, 2014). Although this type of Beta-Binomial mixture (BBmix) model-based empirical Bayes approach is widely used, the parametric assumptions on the alternative hypothesis can be unrealistic, may result in inflexibility, and may not be able to capture the density of the latent variable
  .
.
A more important issue with the BBmix model is due to its lack of identifiability and the interpretability of the estimated  . In fact, estimated
  can be visually different from the truth. As a simple exposition, we compared the density estimation by the BBmix model (Muralidharan 2010) and our proposed non-parametric method (NPBin) in one of our simulation settings (
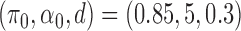 ; see Section 3.2 for details) where
  . We observed that BBmix led to an inaccurate and spiky estimate even though the true model of
  is BBmix. In contrast, NPBin yielded a more accurate and, thus, more interpretable estimate (Figure 1(a) in supplementary material available at Biostatistics online). This issue was also observed by Muralidharan (2010) who remarked that very different models for
  might give nearly identical marginal for
  .
.
A data-integration approach (Skelly and others, 2011; Zhang and others, 2014) emerged as an alternative. This approach estimates  by fitting a Beta-Binomial model on additional whole genome sequencing (DNA-seq) data of the subjects/cells that the functional assays (e.g., ChIP-seq, RNA-seq) originate from. Assuming this
  to be the same as the null distribution for the functional assay, it then estimates the other parameters of a two-component BBmix from the functional assay for ALI detection. Its critical assumption could be easily violated for two reasons. First, different assays target at different types of genomic regions (e.g., RNA-seq is for transcribed regions and DNase-seq for accessible regions), which may lead to different null distributions. Second, many other technical factors may also affect the null distributions. In fact, the estimated
  ’s from different technical replicates of the same biological sample could look very different (Figure 1(b) in supplementary material available at Biostatistics online). Additionally, the availability of whole genome DNA-seq data with satisfactory coverage is a bottleneck in practice, e.g., many of the cell lines utilized heavily by the ENCODE project does not have whole genome sequences.
Due to the limitations of the above methods, there is still pressing need for novel statistical tests for ALI detection. Our proposed NPBin relies on fewer assumptions, produces interpretable estimates, and does not require external data. Non-parametric density estimation has been widely used in empirical Bayes testing (Efron and others, 2001; Efron, 2016). If the allelic probability  is directly observed, non-parametric estimation of
  is relatively easy. However, the allelic probability
  is unobserved. The key innovation of NPBin test is the non-parametric estimation of the density
  of the latent allelic probability
  without requiring external data.
3. Results
We next evaluated our proposed method NPBin from several aspects. Next three subsections describe the methods included in the comparison, the simulation models, and the ChIP-seq data sets we analyzed. Then, we present comparison results on accuracy and interpretability in density estimation and accuracy in ALI detection using both simulations and the actual ChIP-seq data sets. To demonstrate the broader applicability of NPBin beyond ALI detection, we illustrate the generality and highlight the interpretability of NPBin’s density estimate in a baseball data set.
3.1. Methods compared in simulations and data analysis
If  ’s are observed, it is natural to test ALI in a similar fashion to the empirical Bayes tests on z-scores (Efron, 2012). We refer to this method as Empirical Bayes Oracle (EBO) because it requires oracle information, i.e., the true values of the latent variable
  . EBO first directly estimates
  using splines. Next, EBO estimates
  in Beta family by maximum likelihood using the data in the “bulk” region and also accounting for truncation (Efron 2012; see also supplementary material available at Biostatistics online for details). In our simulation studies where we know the true allelic probability, we compared EBO with NPBin. When we do not observe
  ’s as is in real data applications, a naive approach is to estimate
  and
and  using
using 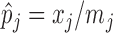 by treating
  as the true value of
  , and we refer it as Empirical Bayes Estimated (EBE). We remark that this approach that mimics EBO has not appeared in the literature, and we propose it here as a simple but logical alternative to NPBin. We also included a Beta-Binomial modeling approach, for which the true number of components and the true mean of each component are given, for comparisons in simulations. Empirically, we found that these additional oracle information helps to avoid the identifiability issues observed by Muralidharan (2010) and us, and yields more accurate estimates. This mixture model approach is different from the existing standard approaches as it is enhanced by the oracle information, i.e., true means of the components of the simulation model, and we refer to it as the Oracle Enhanced Mixture model (OEMix). We designed this approach strictly for the comparison purpose in simulations. It is excluded in comparisons using actual ChIP-seq data analysis since such oracle information is not available. For the Binomial test, we used Benjamini–Hochberg procedure (Benjamini and Hochberg, 1995) for FDR control. Table 1 in supplementary material available at Biostatistics online summarizes all the methods used in comparisons with simulations.
Table 1.
Simulation results for the 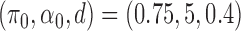 and
and 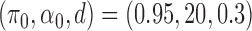 settings. Entries reported are mean and standard deviation (in parentheses) over 20 simulation replications. The column names are as follows.
  L1: L1 loss in estimating
  , normalized by the mean of the L1 loss of EBO;
  error: error in estimating
  ;
;  error: error in estimating
  , the proportion of the null; NS 0.05: number of loci selected for nominal FDR
  0.05; NS 0.10: number of loci selected for nominal
  ; eFDR 0.05: empirical FDR when nominal
  ; eFDR 0.10: empirical FDR when nominal

| |||||||
|---|---|---|---|---|---|---|---|
| Method |
 L1 L1 |
 error error |
 error error |
NS0.05 | NS0.10 | eFDR0.05 | eFDR0.10 |
| NPBin | 1.85(0.30) | 0.677(0.297) | –0.029(0.023) | 642(56) | 876(50) | 0.054(0.010) | 0.094(0.013) |
| OEMix | 1.04(0.28) | 1.063(2.307) | 0.000(0.007) | 675(44) | 907(48) | 0.061(0.014) | 0.109(0.017) |
| EBO | 1.00(0.05) | –0.950(0.088) | 0.071(0.003) | 371(25) | 638(32) | 0.025(0.007) | 0.045(0.008) |
| EBE | 2.11(0.13) | –2.100(0.085) | 0.192(0.005) | 66(23) | 287(46) | 0.014(0.019) | 0.017(0.007) |
| Binom | — | — | — | 1613(24) | 1940(35) | 0.433(0.009) | 0.488(0.006) |

| |||||||
| Method |
 L1 L1 |
 error error |
 error error |
NS 0.05 | NS 0.10 | eFDR 0.05 | eFDR 0.10 |
| NPBin | 1.75(0.37) |
 1.829(1.623) 1.829(1.623) |
0.015(0.011) | 14(7) | 27(12) | 0.047(0.063) | 0.083(0.060) |
| OEMix | 1.20(0.45) |
 1.077(1.311) 1.077(1.311) |
0.017(0.006) | 15(8) | 30(13) | 0.056(0.068) | 0.111(0.052) |
| EBO | 1.00(0.11) |
 0.355(1.170) 0.355(1.170) |
0.004(0.016) | 20(7) | 40(10) | 0.088(0.051) | 0.121(0.040) |
| EBE | 10.11(0.31) |
 12.470(0.357) 12.470(0.357) |
0.043(0.015) | 1(2) | 4(4) | 0.000(0.000) | 0.014(0.044) |
| Binom | – | – | – | 101(19) | 173(30) | 0.357(0.054) | 0.480(0.043) |
3.2. Simulation model
For  , we simulated the ChIP-seq read counts as follows. We first generated the allele specific binding state
  of SNP j as
 |
where  is a point mass at
  for
for  . Here
  represents that at SNP j, the TF only binds to the maternal allele,
  only to the paternal allele, and
  refers to binding to both alleles. Then, we simulated the expected ChIP-seq read counts from the maternal and the paternal alleles
  as independent Gamma samples as
 |
(3.1) |
As a result, if the TF binds to one allele, the expected ChIP-seq read count follows  , and
, and 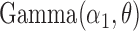 otherwise. Finally, we simulated the observed counts from the two alleles
  as
as
 |
Then the true maternal allele frequency  and there is
 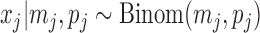 . It is easy to see that
  ’s are i.i.d. samples from the following Beta mixture:
 |
In particular, the null distribution ( ) is
) is  .
.
In this model,  is the proportion of the null, and
  controls the over-dispersion level of the null. We further define
  representing the strength of the ALI signal, as it is the difference between one component of the alternative (e.g.,
  ) to 0.5. The simulation parameters are set as follows:
  ,
,  ,
,  , and
, and  . In each setting, we set
  , i.e., the average read count from one allele with TF binding is roughly 15, which is reflective of many ChIP-seq experiments. We replaced the SNPs with
  with new simulations, so the minimal total read count
  is at least 5. It is easy to check that such manipulation does not influence the distribution of the true allelic frequency. We present the results for
  and
and 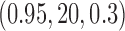 in Sections 3.4 and 3.5 and the rest, which are generally consistent with our findings presented here, in the supplementary material available at Biostatistics online.
3.3. Pre-processing of ChIP-seq data
Table 2 in supplementary material available at Biostatistics online summarizes the large collection of ChIP-seq and ChIP-seq-like data from GM12878 cells that we utilized. We used a personalized-genome-based AlleleSeq (Rozowsky and others, 2011) to map the reads and obtain  , the maternal and the overall read counts at each phased heterozygous SNP of GM12878, and then compared different statistical tests for ALI detection using the same pre-processed data. In particular, Binomial test was also utilized in the original AlleleSeq work. Each of these data sets contains 20k–40k SNPs. In addition to these AlleleSeq-based pre-processed data, we analyzed an additional 62 ENCODE ChIP-Seq data sets each of which had two replicates and was pre-processed by BaalChIP (de Santiago and others, 2017). These data contained significantly fewer SNPs (ranging between 100–4000). Further details on data pre-processing are in supplementary material available at Biostatistics online.
3.4. Estimation accuracy of the overall density and the null density of the latent variable
We first evaluated the accuracy in estimating  and
and  with ChIP-seq data and simulation studies.
In the analysis of ChIP-seq data, we compared the estimated  and
and  with the histogram of
  for
for  . The variation in
  has two sources,
  and the Binomial model. Thus, the estimated
  and
and  can be considered as being reasonable if they are slightly tighter than the histogram of
  , but not too far away, and if
  and
and  are close to each other around 0.5. As expected, we found that NPBin yielded reasonable estimates, while EBE’s estimates of
  and
and  were too flat and too dissimilar around 0.5 (Figure 2 in supplementary material available at Biostatistics online).
Fig. 2.

The AUPRC of 20 replicates for two settings of  . (a) (0.75,5,0.4), (b) (0.95,20,0.3), (c) (0.75,5,0.4) with mis-specified null, and (d) (0.95,20,0.3) with misspecified null.
In simulations, we measured the accuracy in estimating  using
using  loss (Table 1 and Table 3 in supplementary material available at Biostatistics online), and found that NPBin performed better than EBE. We also compared the bias and standard error of the estimated null shape parameter
  and the proportion of the null
  (Table 1 and Table 4 in supplementary material available at Biostatistics online). Since none of these methods assumes equal shape parameters in the null model, we used the average of the two shape parameters of the estimated null as the estimated
  . Overall, NPBin led to better accuracy than EBE in null model estimation.
3.5. Accuracy comparison with simulations
Next, we assessed the accuracy in ALI detection from two aspects using simulations. First, we evaluated the ranking performance using Precision-Recall Curve (PRC), which is more appropriate for non-balanced data compared to Receiver Operator Characteristic (ROC) Curve. Specifically, we compared these methods in terms of the Area Under Precision-Recall Curve (AUPRC, Figures 2(a) and (b) and 3) and found that all the empirical Bayes methods significantly outperformed the Binomial test and were similar to each other. EBE appeared to be slightly better than NPBin in more simulation settings, but was not uniformly superior.
Fig. 3.

ChIP-seq ALI detection results. (a)–(c)  (TP/FP) for fixed proportions of selected SNPs for ATAC-seq, ChIP-seq of CTCF, and DNase-seq (from left to right). (d) Ranking consistency between replicates for 62 BaalChIP pre-processed ENCODE data sets.
Next, we compared the number of selected loci and empirical FDR at the same nominal FDR level (Table 1 and Tables 5 and 6 in supplementary material available at Biostatistics online), and found that Binomial test selected too many and EBE selected too few compared to NPBin. This observation is compatible with the empirical FDR results from our simulations which highlighted that the empirical FDR levels of NPBin and the oracle-assisted methods were closer to the nominal level, while EBE was too conservative, and the Binomial test led to very large empirical FDR.
To investigate the impact of the misspecification of the null model, we considered perturbations on the simulation models by multiplying each of  and
and  by independent variates from
  . This led to a perturbed
  and a more over-dispersed null. The ranking comparison results were similar to that of the unperturbed settings (Figure 2(c) and (d), Figure 4 in supplementary material available at Biostatistics online) whereas the FDR control occasionally became worse (Tables 7 and 8 supplementary material available at Biostatistics online).
Fig. 4.

Comparison of the estimated density of batting rates ( ) with the histogram of
  . (a) All players, (b) pitchers, and (c) non-pitchers.
3.6. ALI detection in ChIP-seq data
We designed an evaluation criterion for the actual ChIP-seq ALI detection analysis based on the allelic motif difference as their biological connection is well known. Specifically, we used R package atSNP (Zuo and others, 2015) to identify the SNPs with significant allelic differences in TF binding motif strength based on the sequence information and the 205 known TF motifs in vertebrates from the JASPAR database (Mathelier and others, 2013). Since both information sources are independent of the ChIP-seq data under consideration, the allelic motif strength difference can serve as an external validation criterion (see supplementary material available at Biostatistics online for details). Such external validation criterion is only available for 5–10% of SNPs, and the others simply showed no significant allelic difference in motif strength or did not overlap any motifs at all. Reasons for these include other unknown factors affecting TF binding and chromatin accessibility such as imprinting and the incompleteness of the JASPAR database. For each of the 5–10% SNPs with this motif-based benchmark, an expected winning allele in ALI detection was assigned to it based on the sequence information. The results were compared with the actual winning alleles in ALI detection from ChIP-seq data. Note that all ALI detection methods will report the same winning allele at the same SNP for the same ChIP-seq data, e.g., if  , indicating more maternal reads than paternal reads at SNP
  , all methods will report the maternal allele as the winning allele. However, their estimated significance could be dramatically different. We label a SNP as a potential true positive (TP) if the expected winning allele based on sequence information and the actual winning allele in ALI detection from ChIP-seq data are the same and as a potential false positive (FP) otherwise. When such a potential TP (or FP) SNP has enough statistical significance to be chosen as an ALI SNP from ChIP-seq data, its winning allele will agree (or contradict) with the motif-based benchmark. Thus, it can be viewed as a true positive (or false positive) in the conventional sense. However, potential true negatives or false negatives cannot be defined in the same fashion due to the incompleteness of the databases of known TF motifs, and the limited knowledge on the other factors that may affect ChIP-seq signal.
Allele-seq pre-processed data.
Since the TP and FP labels were only available for a small proportion of SNPs, comparing methods with PRC became less relevant in this setting (Figure 5 in supplementary material available at Biostatistics online). As an alternative, we used  as the measure of accuracy for fixed number of selected ALI SNPs (Figure 6 in supplementary material available at Biostatistics online). Since ALI generally only exists at a small proportion of SNPs, we presented a zoom-in version (to
  ) here (Figure 3(a)–(c)). Using this benchmark, we found that NPBin showed slightly higher accuracy on ATAC-seq and DNase-seq, and all methods performed similarly on CTCF ChIP-seq, perhaps, partially because only five FP’s can be defined for CTCF data. The numbers of TP and FP for fixed proportion of selected SNPs are in Table 9 in supplementary material available at Biostatistics online. Consistent with the simulation results, we also found that EBE often selected too few ALI and the Binomial test usually selected too many at fixed nominal FDR (Table 10 in supplementary material available at Biostatistics online).
We explored the biological interpretation of the CTCF ALI SNPs by GO enrichment analysis of their associated genes (see supplementary material available at Biostatistics online for details). We found that different methods prioritize different GO terms (Table 11 in supplementary material available at Biostatistics online), most of which seem to be associated with the function of CTCF. However, it remains elusive how they are directly linked to the allele-specific binding of CTCF, and such discussion is beyond the scope of this article. We also remark that assigning regulatory SNPs to genes is a non-trivial task, which is a common drawback of any gene-centered analysis. Without additional information on chromatin structure (e.g., high resolution Hi-C data) and transcription, such mapping is neither exhaustive nor definitive.
BaalChIP pre-processed data.
For the 62 pre-processed ENCODE experiments, we used a more relaxed cutoff for defining motif changes to be able to define TP/FP (supplementary material available at Biostatistics online). The numbers of ALI detected and the associated TP and FP at  , presented in Table 12 in supplementary material available at Biostatistics online, highlight that NPBin generally has more TP’s than EBE and comparable numbers of FP’s to the Binomial test.
We further utilized ranking consistency across two replicates of each experiment as another performance metric. Such a cross-validation based criterion can be defined on all data sets regardless of whether motif information is available or reliable. However, this criterion also has its own drawbacks. For example, the Binomial test is known to be overpowered when the total count is large, even if the effect size is very small. Since the total ChIP-seq read counts at the same SNP from different replicates are positively correlated, the Binomial test will be consistently biased towards loci with high total read counts. With this caveat in mind, we applied NPBin, EBE, and Binom on all individual replicates of our data. For each method, we ranked the candidate SNPs by  , where FDR
 is FDR at SNP j for the method under consideration. Ranking by
  also takes into account the direction of ALI signals. For each pair of replicates, we focused on the common candidate SNPs, and we calculated the Spearman’s correlation of
  ’s from the two replicates for each individual method. Figure 3(d) presents the results of the BaalChIP pre-processed ENCODE data and the results of the other data are available in Table 13 in supplementary material available at Biostatistics online. Overall, we found that the rankings of EBE are less consistent across replicates (lower correlation) than Binomial test and NPBin, and Binomial test is only marginally superior to NPBin in consistency. However, such seeming advantage of the Binomial test in consistency could be attributed to its ranking bias. We further remark that the Binomial test led to significantly inferior ranking in our simulation studies. We also observed that the Spearman’s correlations were actually negative in one or two cases for each method. This may simply reflect the overall poor consistency among the replicates because the Spearman’s correlations of
  ’s between the replicates were very low in these cases (
 0.05, or even
  0 in some cases).
3.7. Re-analysis of Brown (2008) major league baseball data
We developed NPBin as an empirical Bayes testing method; however, the non-parametric density estimation procedure of NPBin is applicable to other problems, such as prior and effect size estimation. We next illustrate this in a non-biological context by re-analyzing a Major League Baseball data that has been used in Brown (2008) and Muralidharan (2010).
The data set consists of the batting records from the 2005 season. For player  , let
, let  be the number of bats, and
  the number of hits in the first half of the season. It is reasonable to assume
  , where
  is the unknown true batting average of this player. The goal is to predict the batting average of the second half of the season using the posterior mean of
  from the first half season. The key for this problem is to accurately estimate
  , the prior of
  . Similar to Muralidharan (2010), we focused on the 567 players with at least 11 bats in the first half of the season. Muralidharan (2010) analyzed the data as a whole, and also analyzed the pitchers and non-pitchers separately, because the author argued that better batters bat more which violated the Binomial model, and splitting the players by pitchers and non-pitchers reduced the variation in the number of bats in each group. We followed the same procedure for easy comparison. We compared the BBmix model (Muralidharan 2010), with the non-parametric density estimation component of NPBin.
We first compared the estimated priors by the two methods, with reference to the histogram of  , the sample batting average of the first half of the season. The variation in
  has two sources,
  and the Binomial model. Thus, we expected the estimated priors to be tighter than the histograms, but not too far away. We found that BBmix was in favor of very spiky estimates, and sometimes dramatically visually different from the histogram (Figure 4). This again highlighted the identifiability issue and consequently the lack of interpretability of priors estimated by BBmix. In contrast, the NPBin estimates were smoother, and closer to the histograms. Thus, they were more accurate and interpretable representations of the truth.
We next compared the batting average prediction, where the batting records of the second serve as the test set. Brown (2008) and Muralidharan (2010) used the following loss function
 |
where  are the number of bats and hits of player
  in the second half of the season, and
  where
where  are all the bats and hits in the training data. In addition, we also compared the prediction
  loss given by
  . Overall, NPBin performed competitively, and sometimes superior to BBmix (Table 14 in supplementary material available at Biostatistics online).
4. Summary and discussion
In this article, we studied the problem of detecting ALI in ChIP-seq. We proposed and implemented a NPBin test for ALI detection and for modeling Binomial data in general. NPBin estimates the overall density of the latent allelic probability non-parametrically, and estimates the null density empirically by curve fitting that mimics the ideal empirical null. It makes minimal assumptions on the data generating model, and does not rely on external data. Comparisons with the Binomial test highlight that NPBin yields significantly better ranking and FDR control, and comparable cross-replicate consistency. When compared to EBE, an empirical Bayes approach that we devised in this article for comparison purposes, NPBin leads to more accurate density estimation for the latent variable, comparable ranking, and superior FDR control and cross-replicate consistency. We also illustrated the generality of NPBin by applying it to effect size estimation in the context of baseball.
NPBin takes in count data ( and
and  ) as input, and performs statistical testing for ALI detection. Although it models the variation in allelic probability, it does not correct the bias from haplotype variation, wet lab experimental issues, sequencing error, or read mapping. Addressing such biases by incorporating additional DNA-seq data, screening candidate loci, and improving allele-specific mapping (Rozowsky and others, 2011; Younesy and others, 2013; Bailey and others, 2015; Van De Geijn and others, 2015) could result in improved count data for testing using NPBin.
We focused on the problem of ALI detection from ChIP-seq at single SNP level, and from one data set. There have been many other ALI detection methods and software that concern ALI in RNA-seq (Mayba and others, 2014), region-level ALI detection (Van De Geijn and others, 2015), joint ALI detection from multiple types of functional assays (de Santiago and others, 2017; Wei and others, 2012), and ALI-informed QTL/eQTL analysis of multiple individuals (Van De Geijn and others, 2015; Sun, 2012). The statistical machinery behind these approaches are mostly parametric empirical Bayes models. Our current non-parametric empirical Bayes framework could be potentially applied to these problems. For example, we can combine our SNP level results through a meta-analysis framework similar to MBASED (Mayba and others, 2014) and detect region or gene level ALI from ChIP-seq or RNA-seq. In our actual data analysis, the accuracy evaluation criterion relies on the binding affinity, which is not the only potential cause of ALI in ChIP-seq. As we have pointed out, other molecular mechanisms such as (allele-specific) imprinting may also cause ALI in ChIP-seq, at loci with or without genetic variations. One future study along this line is a joint ALI analysis of ChIP-seq and methylation data.
Supplementary Material
Acknowledgments
Conflict of Interest: None declared.
Funding
NSF DBI-1564621 to Q.Z., in part; NIH BD2K grant U54 AI117924, NIH UO1 grant HG007019, and NIH RO1 grant HG003747 to S.K., in part.
References
- Bailey S. D., Virtanen C., Haibe-Kains B. and Lupien M. (2015). Abc: a tool to identify snvs causing allele-specific transcription factor binding from chip-seq experiments. Bioinformatics 31, 3057–3059. [DOI] [PMC free article] [PubMed] [Google Scholar]
- Benjamini Y. and Hochberg Y. (1995). Controlling the false discovery rate: a practical and powerful approach to multiple testing. Journal of the Royal Statistical Society. Series B (Methodological) 57, 289–300. [Google Scholar]
- Boyle A. P., Song L., Lee B.-K., London D., Keefe D., Birney E., Iyer V. R., Crawford G. E. and Furey T. S. (2011). High-resolution genome-wide in vivo footprinting of diverse transcription factors in human cells. Genome Research 21, 456–464. [DOI] [PMC free article] [PubMed] [Google Scholar]
- Brown L. D. (2008). In-season prediction of batting averages: a field test of empirical Bayes and Bayes methodologies. The Annals of Applied Statistics 2, 113–152. [Google Scholar]
- Buenrostro J. D., Giresi P. G., Zaba L. C., Chang H. Y. and Greenleaf W. J. (2013). Transposition of native chromatin for fast and sensitive epigenomic profiling of open chromatin, DNA-binding proteins and nucleosome position. Nature Methods 10, 1213–1218. [DOI] [PMC free article] [PubMed] [Google Scholar]
- de Santiago I., Liu W., Yuan K., O’Reilly M., Chilamakuri C. S., Ponder B. A. J., Meyer K. B. and Markowetz F. (2017). Baalchip: Bayesian analysis of allele-specific transcription factor binding in cancer genomes. Genome Biology 18, 39. [DOI] [PMC free article] [PubMed] [Google Scholar]
- Dempster A. P., Laird N. M. and Rubin D. B. (1977). Maximum likelihood from incomplete data via the EM algorithm. Journal of the Royal Statistical Society. Series B (Methodological) 39, 1–38. [Google Scholar]
- Efron B. (2012). Large-Scale Inference: Empirical Bayes Methods for Estimation, Testing, and Prediction, Volume 1 Cambridge, UK: Cambridge University Press. [Google Scholar]
- Efron B. (2016). Empirical Bayes deconvolution estimates. Biometrika 103, 1–20. [Google Scholar]
- Efron B., Tibshirani R., Storey J. D. and Tusher V. (2001). Empirical Bayes analysis of a microarray experiment. Journal of the American Statistical Association 96, 1151–1160. [Google Scholar]
- Kharchenko P. V., Tolstorukov M. Y. and Park P. J. (2008). Design and analysis of ChIP-seq experiments for DNA-binding proteins. Nature Biotechnology 26, 1351–1359. [DOI] [PMC free article] [PubMed] [Google Scholar]
- Laird N. (1978). Nonparametric maximum likelihood estimation of a mixing distribution. Journal of the American Statistical Association 73, 805–811. [Google Scholar]
- Liang K. and Keleş S. (2012). Detecting differential binding of transcription factors with ChIP-seq. Bioinformatics 28, 121–122. [DOI] [PMC free article] [PubMed] [Google Scholar]
- Liao J. G., Mcmurry T. and Berg A. (2014). Prior robust empirical bayes inference for large-scale data by conditioning on rank with application to microarray data. Biostatistics 15, 60–73. [DOI] [PMC free article] [PubMed] [Google Scholar]
- Lindsay B. G. (1983). The geometry of mixture likelihoods: a general theory. The Annals of Statistics 11, 86–94. [Google Scholar]
- Mabon G. (2016). Adaptive deconvolution of linear functionals on the nonnegative real line. Journal of Statistical Planning and Inference 178, 1–23. [Google Scholar]
- Martin R. and Tokdar S. (2012). A nonparametric empirical bayes framework for large-scale multiple testing. Biostatistics 13, 427–439. [DOI] [PubMed] [Google Scholar]
- Mathelier A., Zhao X., Zhang A. W., Parcy F., Worsley-Hunt R., Arenillas D. J., Buchman S., Chen C.-Y., Chou A., Ienasescu H. and others. (2013). JASPAR 2014: an extensively expanded and updated open-access database of transcription factor binding profiles. Nucleic Acids Research 42, D142–D147. [DOI] [PMC free article] [PubMed] [Google Scholar]
- Mayba O., Gilbert H. N., Liu J., Haverty P. M., Jhunjhunwala S., Jiang Z., Watanabe C. and Zhang Z. (2014). Mbased: allele-specific expression detection in cancer tissues and cell lines. Genome Biology 15, 405. [DOI] [PMC free article] [PubMed] [Google Scholar]
- Muralidharan O. (2010). An empirical Bayes mixture method for effect size and false discovery rate estimation. The Annals of Applied Statistics 4, 422–438. [Google Scholar]
- Rebafka T. and Roueff F. (2015). Nonparametric estimation of the mixing density using polynomials. Mathematical Methods of Statistics 24, 200–224. [Google Scholar]
- Roueff F. and Rydén T. (2005). Nonparametric estimation of mixing densities for discrete distributions. Annals of Statistics 33, 2066–2108. [Google Scholar]
- Rozowsky J., Abyzov A., Wang J., Alves P., Raha D., Harmanci A., Leng J., Bjornson R., Kong Y., Kitabayashi N. and others. (2011). AlleleSeq: analysis of allele-specific expression and binding in a network framework. Molecular Systems Biology 7, 522. [DOI] [PMC free article] [PubMed] [Google Scholar]
- Schwartzman A. (2008). Empirical null and false discovery rate inference for exponential families. The Annals of Applied Statistics 2, 1332–1359. [DOI] [PMC free article] [PubMed] [Google Scholar]
- Skelly D. A., Johansson M., Madeoy J., Wakefield J. and Akey J. M. (2011). A powerful and flexible statistical framework for testing hypotheses of allele-specific gene expression from RNA-seq data. Genome Research 21, 1728–1737. [DOI] [PMC free article] [PubMed] [Google Scholar]
- Sun W. (2012). A statistical framework for eQTL mapping using RNA-seq data. Biometrics 68, 1–11. [DOI] [PMC free article] [PubMed] [Google Scholar]
- Van De Geijn B., McVicker G., Gilad Y. and Pritchard J. K. (2015). Wasp: allele-specific software for robust molecular quantitative trait locus discovery. Nature Methods 12, 1061–1063. [DOI] [PMC free article] [PubMed] [Google Scholar]
- Verlaan D. J., Berlivet S., Hunninghake G. M., Madore A.-M., Larivière M., Moussette S., Grundberg E., Kwan T., Ouimet M., Ge B. and others. (2009). Allele-specific chromatin remodeling in the ZPBP2/GSDMB/ORMDL3 locus associated with the risk of asthma and autoimmune disease. The American Journal of Human Genetics 85, 377–393. [DOI] [PMC free article] [PubMed] [Google Scholar]
- Wei Y., Li X., Wang Q.-F. and Ji H. (2012). iASeq: integrative analysis of allele-specificity of protein-DNA interactions in multiple ChIP-seq datasets. BMC Genomics 13, 681. [DOI] [PMC free article] [PubMed] [Google Scholar]
- Younesy H., Möller T., Heravi-Moussavi A., Cheng J. B., Costello J. F., Lorincz M. C., Karimi M. M. and Jones S. J. M. (2013). Alea: a toolbox for allele-specific epigenomics analysis. Bioinformatics 30, 1172–1174. [DOI] [PubMed] [Google Scholar]
- Zhang C.-H. (1995). On estimating mixing densities in discrete exponential family models. The Annals of Statistics 23, 929–945. [Google Scholar]
- Zhang S., Wang F., Wang H., Zhang F., Xu B., Li X. and Wang Y. (2014). Genome-wide identification of allele-specific effects on gene expression for single and multiple individuals. Gene 533, 366–373. [DOI] [PubMed] [Google Scholar]
- Zhao Z., Wang W. and Wei Z. (2013). An empirical bayes testing procedure for detecting variants in analysis of next generation sequencing data. The Annals of Applied Statistics 7, 2229–2248. [Google Scholar]
- Zuo C., Shin S. and Keleş S. (2015). atSNP: transcription factor binding affinity testing for regulatory SNP detection. Bioinformatics 31, 3353–3355. [DOI] [PMC free article] [PubMed] [Google Scholar]
Associated Data
This section collects any data citations, data availability statements, or supplementary materials included in this article.