Abstract
Background
Social media plays a more and more important role in the research of health and healthcare due to the fast development of internet communication and information exchange. This paper conducts a bibliometric analysis to discover the thematic change and evolution of utilizing social media for healthcare research field.
Methods
With the basis of 4361 publications from both Web of Science and PubMed during the year 2008–2017, the analysis utilizes methods including topic modelling and science mapping analysis.
Results
Utilizing social media for healthcare research has attracted increasing attention from scientific communities. Journal of Medical Internet Research is the most prolific journal with the USA dominating in the research. Overly, major research themes such as YouTube analysis and Sex event are revealed. Themes in each time period and how they evolve across time span are also detected.
Conclusions
This systematic mapping of the research themes and research areas helps identify research interests and how they evolve across time, as well as providing insight into future research direction.
Electronic supplementary material
The online version of this article (10.1186/s12911-019-0757-4) contains supplementary material, which is available to authorized users.
Keywords: Social media, Healthcare research, Topic modelling, Science mapping, Thematic detection, Thematic evolution
Background
In the past decade, the research field of utilizing social media for healthcare has attracted great interests from scientific communities, which can be observed from the annual increasing of research publications. Internet is becoming a significantly important role as the source of information for public health issues [1]. Health-related information is being actively searched, shared, communicated, and discussed through social media. This kind of online information exchange benefits users in aspects of immediate access to health concern information [2], emotional and psychological support [3], and health-related decision making [4]. Furthermore, the development of digital social media brings relatively inexpensive and readily available means for the collection and storage of large volumes of data [5].
Especially in recent years, researchers are beginning to explore how social media can be used in health and healthcare research [6]. There have been rich researches and achievements. For example, based on the regression analysis of country-level HIV rates and aggregation usage of future tense language, Ireland et al. [7] found that there were fewer HIV cases in countries with higher rates of future tense on Twitter. Similar works focusing on sex related events can be found, e.g., HIV prevention among men who have sex with men [8], and assessment of personal and environmental factors associated with premarital sex among adolescents [9]. Some researchers conduct studies on certain diseases, e.g., breast cancer [10], testicular cancer [11], and prostate cancer [12], with social media content as analysis materials, e.g., videos [13], twitter messages [14], and publicly available user profiles [15]. Similar studies centering on drug can also be found, e.g., online drug sales [16], and direct-to-consumer drug advertising [17]. As a result, the research field of utilizing social media for healthcare is growing fast and is receiving more and more attention. It is of great significance to conduct a systematic analysis on existing research publications to understand the status of recent development.
As an effective statistical method for evaluating scientific publications, bibliometric analysis has been widely applied in various fields [18, 19]. It has been especially applied in interdisciplinary research, e.g., artificial intelligence on electronic health records research [20], natural language processing empowered mobile computing research [21], natural language processing in medical research [22], text mining in medical research [23], technology enhanced language learning research [24], and event detection in social media research [25].
To that end, this study carries out a bibliometric analysis of utilizing social media for healthcare research based on the research publications from Web of Science and PubMed during the year 2008–2017. The main aim is to develop a general approach to analyze the thematic change and evolution in the research field. As for the overall thematic detection, topic modelling analysis is conducted to identify major topics in the whole period. As for the thematic evolution, the approach combines performance analysis and science mapping for detecting and visualizing conceptual subdomains to quantify and visualize the thematic evolution of the research field.
Methods
Data retrieval and preprocessing
In this study, bibliometric methodology is applied using data from Web of Science (WoS) and PubMed. WoS is the most authoritative citation database and has been widely applied for bibliometric analysis, while PubMed provides a wide coverage of medical-related publications.
The keywords of social media are developed by domain experts after an extensive literature review. In WoS Core Collection database, Topic Subject is used as a retrieval field. Publications indexed in “Science citation index expanded (SCI-EXPANDED)” and “Social Sciences Citation Index (SSCI)” are considered. Further, publications of “Article” and “Proceedings paper” types indexed in the research areas pertaining to healthcare are selected manually. While in PubMed database, Title and MeSH Terms are used as two retrieval fields. Specific exclusion strategies are also conducted to ensure high relatedness of the retrieved publications. The specific search strategy is shown as Additional file 1. In total, 4361 unique publications are finally identified out for analysis. Since there is no citation data available in PubMed, we use Google scholar citation as a measurement of citation count of the 4361 publications.
The raw data are downloaded as plain text. Key elements, e.g., title, published year, abstract, and author address are automatically extracted. Author affiliations and countries are identified based on author addresses. Inconsistent expressions are standardized.
As for the thematic analysis, in addition to author keywords, KeyWords Plus, and PubMed MeSH, we also include keywords from title and abstract using a self-developed Python program with a natural language processing module based on syntactic tree analysis. 1) The singular and plural forms of all the author keywords, KeyWords Plus, and PubMed MeSH are firstly stored as a database; 2) Keywords in title and abstract text are automatically and separately extracted from the database; 3) As for the remaining text of the title and abstract, notional words are also extracted. 4) All the keywords are merged and unified as singular form.
In order to improve the effectiveness of thematic analysis, a duplication checking process is conducted according to the experience by Cobo et al. [26]. Abbreviations are replaced by corresponding full names with a mapping table, e.g., SMS is replaced by short message service; ADE is replaced by adverse drug event; MSM is replaced by men who have sex with men. Keywords representing the same concepts are grouped, e.g., diabete mellitus, type 2, type 2 diabete, type 2 diabete mellitus, etc. We also apply weight 0.4, for author keywords, KeyWords Plus, and PubMed MeSH, as well as weights 0.4 and 0.2 to the keywords from title and abstract, respectively, based on our former experiment [22]. We then set TF-IDF > =0.1 to exclude terms with low frequency as well as those occurring in too many publications.
Approach for thematic detection analysis
Proposed by Blei et al. [27], Latent Dirichlet Allocation (LDA) model has been widely applied in topic detection in various domains. It is a Bayesian mixture model for discrete data with an assumption that topics are uncorrelated. Documents are represented as random mixtures over latent topics, where each topic is characterized by a distribution over words.
A document is represented as a sequence of N words denoted by d = (w1, … , wN), where a word is an item from a vocabulary indexed by {1, … , V}. A corpus is a collection of M documents denoted by D = {d1, … , dM}. LDA follows the following generation process. 1) The term distribution β is as β~Dirichlet(δ), donating the probability of a word occurring in a given topic; 2) θ~Dirichlet(α) is the proportions θ of the topic distribution for a document d; 3) For each word wi in the document d, a topic is chosen by the distribution zi~Multinomial(θ), and a word is chosen as zi : p(wi| zi, β). The log-likelihood for one document d ∈ D is as Eq. (1), and Eq. (2) is the likelihood for Gibbs sampling estimation with k topics.
| 1 |
| 2 |
We use 10-fold cross-validation to evaluate model performance with 16 different topic numbers as c(2–10,15,20,30,40,50,100,200). Perplexity criteria is used to select optimal topic number [27]. α for Gibbs sampling is the mean value of the α values in the 10 cross-validation for model fitting using VEM with the optimal topic number. With α and the optimal topic number, we adopt Gibbs sampling and VEM method to estimate the LDA model. The best matches are determined by Hellinger distance as Eq. (3), in which P and Q are two probability measures.
| 3 |
Further, we conduct comparative analysis using Affinity Propagation (AP) clustering method [28] based on keyword co-occurrence. In the analysis, only author keywords, KeyWords Plus, and PubMed MeSH are utilized. Keywords with a frequency less than 40 or that do not meet a co-occurrence frequency of 40 are excluded. 139 keywords meeting the threshold are selected. Based on keyword co-occurrence matrix of the 139 keywords, a keyword correlation matrix is calculated using Ochiai correlation coefficient expressed in Eq. (4). Oij represents the co-occurrence probability of two keywords. Ai and Aj represent keyword frequencies. Aij indicates the co-occurrence frequency of the two keywords. AP clustering is then conducted with the correlation matrix. Exemplars determined are used for representing and explaining each cluster.
| 4 |
Approach for thematic evolution analysis
Science mapping or bibliometric mapping is a spatial representation of the relationship between disciplines, fields, and documents or authors [29]. It has been widely used in different research fields [30–32] to reveal hidden key elements such as topics.
Science mapping analysis is carried out with SciMAT presented in [33] as a powerful science mapping software tool integrating the majority of the advantages of available tools [34]. In this paper, we adopt the bibliometric approach defined by Cobo et al. [35] that is based on a co-word analysis [36] and the H-index [37]. This approach establishes four stages to detect and visualize conceptual subdomains and thematic evolution of a research field in a longitudinal framework:
Research themes detection
The research themes for each period are detected using a co-word analysis [36]. The clustering of keywords to themes is conducted based on simple centers algorithm [38], a simple and well-known algorithm in the context of co-word analysis. The algorithm locates subgroups of keywords with strong link and that correspond to research interests or problems that are of great significance in the academia. The similarity between the keywords is measured by equivalence index [39] defined as Eq. (5). In the equation, cij is the count of publications in which two keywords i and j co-occur, and ci and cj represent the count of publications in which each one appears.
| 5 |
-
2)
Research themes visualization
The detected networks can be represented by two measures [39], i.e., Callon’s centrality and Callon’s density. Callon’s Centrality measures the degree of interaction among networks and can be defined as Eq. (6) with k a keyword belonging to the theme and h a keyword belonging to other themes. The internal strength of the network can be measured by Callon’s density defined as Eq. (7) with keywords i and j belonging to the theme and w is the keyword count in the theme.
| 6 |
| 7 |
Based on the two measures, research themes can be mapped in a two-dimensional strategic diagram with four quadrants. Commonly, themes in the upper-right quadrant known as the motor-themes are both well developed and are important for structuring a research field. Themes in the upper-left quadrant are of only marginal importance for the field with well-developed internal ties but unimportant external ties. Themes in the lower-left quadrant are both weakly developed and marginal. They mainly represent either emerging or disappearing themes. Transversal and basic themes are contained in the lower-right quadrant, and they are important but are not developed.
-
3)
Thematic evolution discovery and performance analysis
A thematic area is a set of themes that have evolved across different subperiods. Suppose Tt is the set of detected themes of the subperiod t, and U ∈ Tt donates each detected theme. Let V ∈ Tt + 1 be each detected theme in the next subperiod t + 1. It is considered that there is a thematic evolution from theme U to theme V if there are keywords presented in both associated thematic networks. Keywords k ∈ U ∩ V are considered to be a “thematic nexus”. The inclusion index [40] shown as Eq. (8) is used to weight the importance of a thematic nexus. It is worth noting that a theme could belong to a different thematic area, or could not come from any.
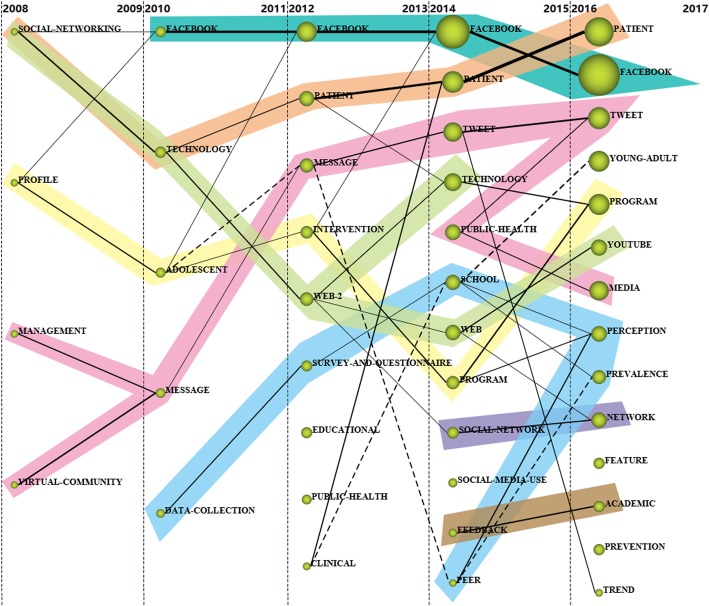
In a bibliometric map of thematic evolution over two periods. The solid lines show that the linked themes are with the same name. A dotted line indicates that the themes share elements that are not the theme names. The thickness of the lines and the sphere volume are proportional to the inclusion index and the publication count associated with each theme, respectively. Hence, two different thematic areas in different colors can be observed. However, theme in the first period has no link with any themes is discontinued, while theme in the second period has no link with any themes is a new one.
| 8 |
The analysis of the science mapping work-flow can be further enriched by a performance analysis with two kinds of bibliometric indicators, i.e., quantitative and qualitative ones. The quantitative indicators, e.g., publication count, author count, publication source count, and country count, measure the productivity of the detected themes and thematic areas. The qualitative indicators, e.g., citation count and H-index, measure the quality based on the bibliometric impact of those themes and thematic areas.
Results
Performance bibliometric analysis
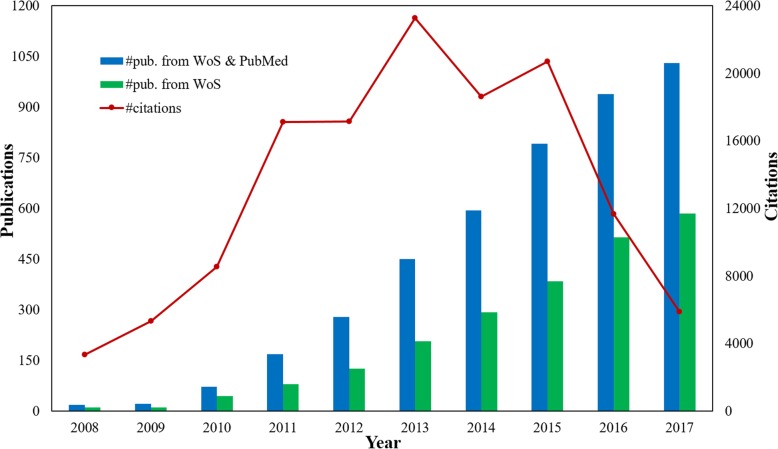
The statistical result of publication count and citation count from the year 2008 to 2017 are presented in Fig. 1. It is clear that the research of utilizing social media for healthcare is becoming more and more influential in scientific communities evidenced by the significant growth of publications from two databases, i.e. from 18 publications in 2008 to 1030 publications in 2017. The similar increasing trend can also be observed from the publication count in WoS. These results may be explained by the increasing global concerns and interests in exploring the use of social media data for healthcare research. It is worth mentioning that there is a remarkable upsurge on the research in 2010 with growth rates up to 309% in the WoS and 170% in the PubMed. The citation count curve shows an increasing trend between 2008 and 2013, and publications in 2013 have received the most citations. A decreasing trend is shown between 2014 and 2017, which may be resulted from the fact that new publications usually have less citations due to the limited time. On the whole, the research of utilizing social media for healthcare has received growing attention in the last decade.
Fig. 1.
Publication count and citation count
Researches in the field have been published in a wide range of nearly one thousand publication sources. Some of these publication sources are highly relevant to the field, while others are partially related. Table 1 lists the top 20 publication sources ranked by publication count in the research field. According to both publication percentage and H-index, Journal of Medical Internet Research, PLoS One, and Cyberpsychology, Behavior and Social Networking are the most influential journals in the field.
Table 1.
Prolific publication sources
| Rank | Publication sources | C | PC | P% | H | IF (2017) |
|---|---|---|---|---|---|---|
| 1 | Journal of Medical Internet Research | Canada | 308 | 7.06 | 59 | 4.671 |
| 2 | PLoS One | The USA | 253 | 5.80 | 51 | 2.766 |
| 3 | Cyberpsychology, Behavior and Social Networking | The USA | 229 | 5.25 | 58 | 2.689 |
| 4 | Studies in Health Technology and Informatics | The USA | 92 | 2.11 | 11 | NA |
| 5 | Health Communication | The USA | 43 | 0.99 | 18 | 1.71 |
| 6 | Journal of Adolescent Health | The USA | 37 | 0.85 | 21 | 4.098 |
| 7 | Journal of Health Communication | The USA | 36 | 0.83 | 18 | 1.648 |
| 8 | BMC Public Health | England | 34 | 0.78 | 17 | 2.42 |
| 9 | Tobacco Control | England | 26 | 0.60 | 16 | 4.151 |
| 10 | American Journal of Pharmaceutical Education | The USA | 23 | 0.53 | 15 | 1.495 |
| 11 | Journal of Biomedical Informatics | The USA | 23 | 0.53 | 16 | 2.882 |
| 12 | Medical Teacher | England | 23 | 0.53 | 15 | 2.45 |
| 13 | American Journal of Public Health | The USA | 22 | 0.50 | 14 | 4.38 |
| 14 | Vaccine | England | 22 | 0.50 | 14 | 3.285 |
| 15 | BMC Medical Informatics and Decision Making | England | 20 | 0.46 | 9 | 2.134 |
| 16 | Journal of the American Medical Informatics Association | England | 20 | 0.46 | 11 | 4.27 |
| 17 | Nurse Education Today | Scotland | 20 | 0.46 | 10 | 2.067 |
| 18 | Pediatrics | The USA | 20 | 0.46 | 8 | 5.515 |
| 19 | Journal of Cancer Education | The USA | 19 | 0.44 | 11 | 1.547 |
| 20 | Proceedings of the National Academy of Sciences of the United States of America | The USA | 19 | 0.44 | 13 | 9.504 |
Note: C countries or regions, PC publication count, %P percentage of publications among all the 4361 publications, H H-index score, IF (2017) impact factor (2017)
Among the 4361 publications, there are 3311 affiliations and 14,154 authors from 88 countries/regions. 18.18% of the countries/regions, 65.06% of the affiliations, or 84.41% of the authors contribute only one publication. Table 2 lists top 20 most prolific countries/regions, affiliations, and authors.
Table 2.
Prolific countries/regions, affiliations and authors
| Rank | C | TP | H | Affiliations | C | TP | H | Authors | C | TP | H |
|---|---|---|---|---|---|---|---|---|---|---|---|
| 1 | The USA | 2394 | 125 | Harvard University | The USA | 97 | 31 | Megan A. Moreno | The USA | 39 | 24 |
| 2 | England | 512 | 57 | University of Washington | The USA | 86 | 30 | Sean D. Young | The USA | 21 | 11 |
| 3 | Australia | 451 | 56 | University of Toronto | Canada | 83 | 26 | Lyle Ungar | The USA | 18 | 15 |
| 4 | Canada | 356 | 54 | University of California, San Francisco | The USA | 82 | 25 | Mowafa Househ | Saudi Arabia | 18 | 8 |
| 5 | China | 148 | 26 | University of Pennsylvania | The USA | 78 | 27 | Raina M. Merchant | The USA | 18 | 11 |
| 6 | Germany | 139 | 34 | University of Michigan | The USA | 76 | 25 | Melissa J. Krauss | The USA | 17 | 13 |
| 7 | Spain | 108 | 26 | Columbia University | The USA | 73 | 22 | Patricia A. Cavazos-Rehg | The USA | 17 | 13 |
| 8 | Netherlands | 104 | 31 | Johns Hopkins University | The USA | 72 | 26 | John S. Brownstein | The USA | 16 | 13 |
| 9 | Italy | 103 | 30 | University of Melbourne | Australia | 72 | 27 | Hansen Andrew Schwartz | The USA | 15 | 12 |
| 10 | France | 76 | 18 | University of Sydney | Australia | 66 | 26 | King-Wa Fu | Hong Kong | 15 | 12 |
| 11 | Korea | 74 | 18 | University North Carolina at Chapel Hill | The USA | 65 | 23 | Michelle Lin | The USA | 15 | 9 |
| 12 | Switzerland | 66 | 18 | Stanford University | The USA | 63 | 24 | Judith J. Prochaska | The USA | 14 | 10 |
| 13 | Hong Kong | 65 | 23 | University California, Los Angeles | The USA | 61 | 21 | Luis Fernandez-Luque | Norway | 14 | 9 |
| 14 | Saudi Arabia | 60 | 15 | University California, San Diego | The USA | 55 | 26 | Michael A. Thompson | The USA | 14 | 7 |
| 15 | Norway | 58 | 23 | University of Wisconsin-Madison | The USA | 55 | 29 | Tim K. Mackey | The USA | 14 | 11 |
| 16 | Sweden | 54 | 16 | New York University | The USA | 50 | 17 | Wen-ying Sylvia Chou | The USA | 13 | 3 |
| 17 | Taiwan | 54 | 18 | University of Southern California | The USA | 50 | 23 | Brian A. Primack | The USA | 12 | 8 |
| 18 | Ireland | 53 | 20 | Monash University | Australia | 47 | 19 | Laura J. Bierut | The USA | 12 | 12 |
| 19 | New Zealand | 49 | 22 | University of British Columbia | Canada | 47 | 16 | Nathan K. Cobb | The USA | 12 | 8 |
| 20 | Belgium | 44 | 17 | University of Pittsburgh | The USA | 44 | 19 | Robert P. Dellavalle | The USA | 12 | 7 |
Note: C countries or regions, TP publication count, H H-index score
From the country/region perspective, the USA dominates in the field with 2394 publications, accounting for 54.90% of the total publications. The USA also has the highest H-index as 125, indicating the high quality of its publications. Other prolific countries/regions with more than 100 publications include England, Australia, Canada, China, Germany, and Spain.
15 of the top 20 prolific affiliations are from the USA with Harvard University (97 publications and 30 H-index) and University of Washington (86 publications and 30 H-index) ranking at the top 2. University of Toronto and University of British Columbia from Canada, as well as three affiliations (University of Melbourne, University of Sydney, Monash University) from Australia also appear in the list.
The leading position of the USA in the research field can also be embodied from the analysis of prolific authors. Most of the top 20 authors are from the USA except Mowafa Househ from Saudi Arabia, King-Wa Fu form Hong Kong, and Luis Fernandez-Luqu form Norway. Megan A. Moreno has the most publications as well as the highest H-index, indicating the high productivity and high influence of his research.
Thematic detection analysis
With the optimal topic number as 20 and the initialized α as 0.028204, LDA model using Gibbs sampling is conducted for overall thematic detection. The 20 topics with their top 15 representative terms is shown in Table 3, along with their possible themes, e.g., YouTube analysis, Sex event, Web-based medical education, Students’ use of Facebook, and Twitter use.
Table 3.
Top 15 most frequent terms for the 20 detected topics
| Topic | Potential theme | Top high frequency terms |
|---|---|---|
| 14 | YouTube analysis | YouTube; quality; YouTube video; viewer; score; video recording; patient; health information; misleading; educational; surgery; comment; viewed; cardiopulmonary resuscitation; search term |
| 18 | Sex event | men who have sex with men; HIV; adolescent; sexual; suicide; youth; young adult; sex; intervention; sexual behavior; prevention; man; HIV testing; sexual health; partner |
| 10 | Web-based medical education | student; learning; medical education; teaching; course; nursing; technology; resident; nursing student; nurse; educational; wiki; web-2; medical student; university |
| 5 | Facebook usage | adolescent; Facebook; social networking site; young adult; depression; social networking; student; college student; Facebook use; friend; interpersonal relation; survey and questionnaire; mental health; motivation; anxiety |
| 1 | Twitter usage | twitter; tweet; post; account; message; twitter use; Facebook; follower; engagement; hashtag; conference; organization; urology; public health; meeting |
| 16 | Alcohol & drug | alcohol; e-cigarette; marketing; tobacco; smoking; exposure; message; drug; drinking; youth; product; advertising; adolescent; alcohol use; image |
| 15 | Twitter data mining | twitter; tweet; adverse drug reaction; sentiment; drug; big data; data mining; post; machine learning; sentiment analysis; algorithm; natural language processing; pharmacovigilance; social media data; surveillance |
| 20 | Exercise, food, and weight | intervention; physical activity; adolescent; program; children; obesity; weight loss; parent; control; Facebook; exercise; food; randomized controlled trial; social support; weight |
| 12 | Medicine & clinical | hospital; patient; surgeon; physician; rating; health care; surgery; surgical; quality; score; care; radiologist; marketing; breastfeeding; satisfaction |
| 2 | Social support | social support; online community; post; forum; Facebook; message; qualitative research; comment; online health community; parent; woman; narrative; virtual community; family; perception |
| 8 | Tech-assisted health | technology; application; health care; web-2; health promotion; public health; systematic review; service; digital; social networking; care; information and communication technology; framework; project; evaluation |
| 6 | Altmetric | china; citation; journal; Chinese; scale; Altmetric; item; science; metric; scientific; attention; language; reliability; publication; scientist |
| 7 | Smoking cessation | Facebook; recruitment; woman; pregnancy; smoking cessation; smoking; campaign; smoker; intervention; cost; advertisement; young adult; recruiting; engagement; recruit |
| 11 | Emergency surveillance | public health; disaster; media; news; outbreak; mass media; event; emergency; epidemic; surveillance; Ebola; crisis; disease; information dissemination; message |
| 9 | Disease treatment and management | patient; treatment; diabetes; quality of life; clinical; disease; self management; pain; inflammatory bowel disease; care; management; asthma; epilepsy; medication; symptom |
| 17 | Vaccine | vaccination; vaccine; human papillomavirus; children; autism spectrum disorder; HPV vaccine; immunization; parent; united states; attitude; burn; infant; comment; antibiotic; autism |
| 4 | Cancer & mental disease | cancer; health information; patient; mental health; breast cancer; schizophrenia; caregiver; awareness; internet use; health related; attitude; information seeking behavior; cancer survivor; dementia; care |
| 19 | Health-care through social media | patient; physician; health care; Facebook; blog; twitter; care; WhatsApp; smartphone; blogging; dermatology; provider; social network; social media use; healthcare provider |
| 3 | Media use by medical staff | Facebook; privacy; student; professionalism; ethical; social networking; social networking site; medical student; physician; ethic; perception; confidentiality; faculty; guideline; policy |
| 13 | Social-network analysis | network; social network; dynamic; politic; social networking; political; theoretical model; online social network; event; attention; diffusion; friend; twitter; algorithm; social behavior |
The top frequent keywords used for AP clustering analysis include social media (3484), human (2109), internet (1323), female (886), male (817), adolescent (694), adult (624), young adult (522), Facebook (473), and social networking (463). Figure 2 shows that the 139 keywords are classified into 28 clusters with exemplars, e.g., self concept, male, middle aged, internet, cancer, Youtube, and weight loss.
Fig. 2.

AP clustering result for the publications during the year 2008–2017 (Terms in bold and italic type donate exemplar for each cluster)
Thematic evolution analysis
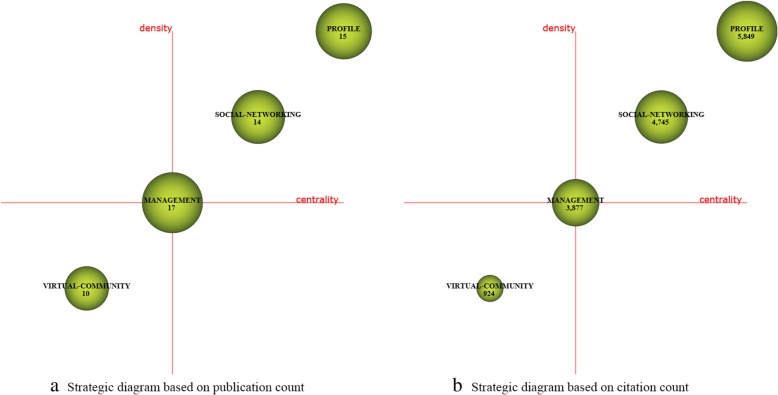
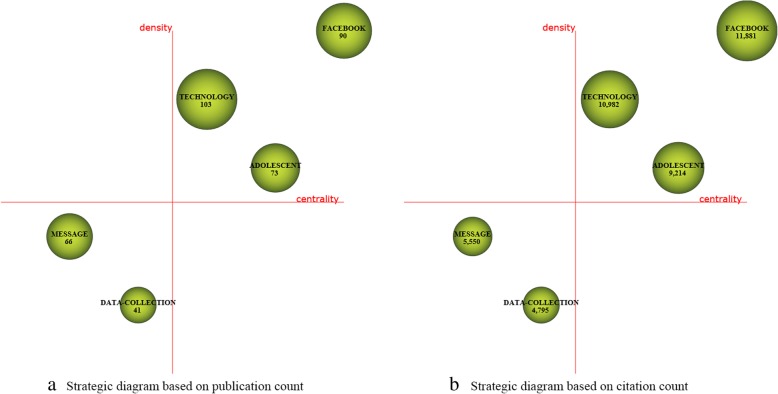
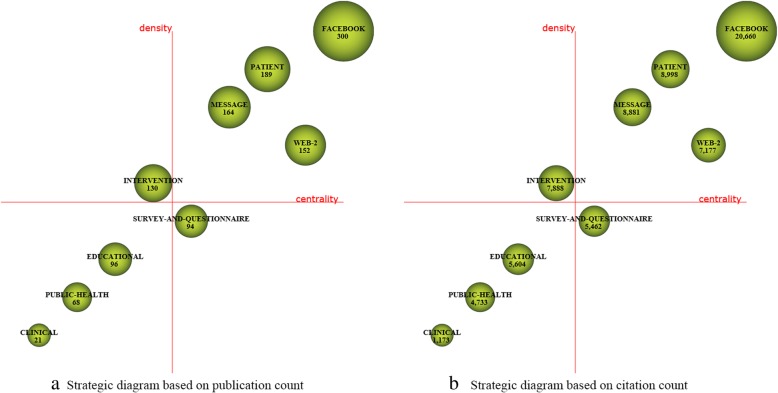
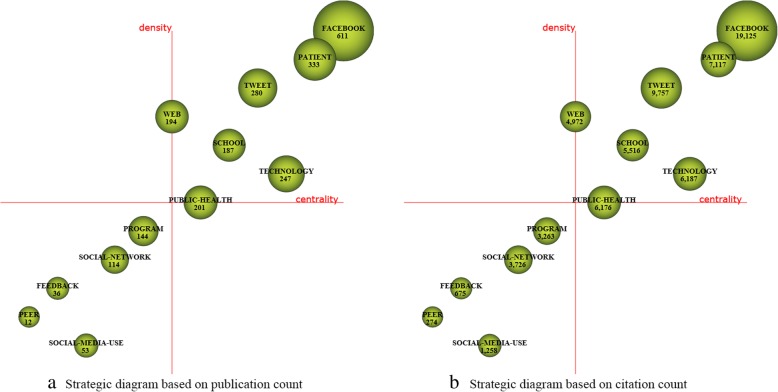
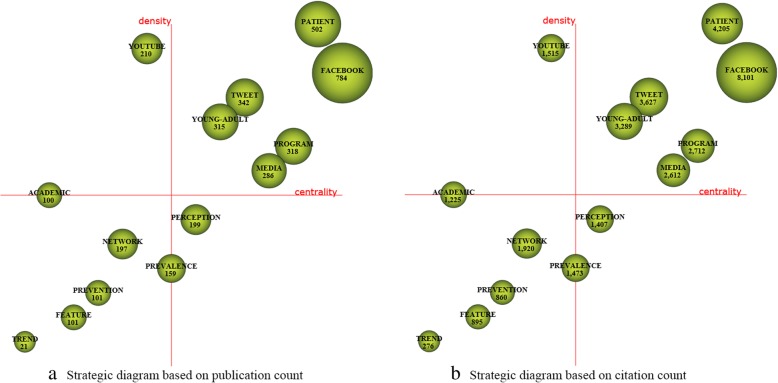
For each time period, two kinds of strategic diagrams are generated to analyze the most highlighted themes. The sphere size in the first diagram is proportional to publication count associated with each theme, while in the second one, the sphere size is proportional to the citation count received for each theme. We split the 10 years into five periods, i.e., [2008–2009], [2010–2011], [2012–2013], [2014–2015], and [2016–2017]. The identified themes with publication count are reported in Table 4 and are visualized using the strategic diagrams as Figs. 3, 4, 5, 6 and 7.
Table 4.
Performance measures for the themes of each subperiod
| Subperiod | Name | PC | CC | AC | H | Name | PC | CC | AC | H |
|---|---|---|---|---|---|---|---|---|---|---|
| 2008–2009 | MANAGEMENT | 17 | 3877 | 228.06 | 15 | SOCIAL-NETWORKING | 14 | 4745 | 338.93 | 12 |
| PROFILE | 15 | 5849 | 389.93 | 14 | VIRTUAL-COMMUNITY | 10 | 924 | 92.4 | 10 | |
| 2010–2011 | TECHNOLOGY | 103 | 10,982 | 106.62 | 52 | MESSAGE | 66 | 5550 | 84.09 | 36 |
| 90 | 11,881 | 132.01 | 56 | DATA-COLLECTION | 41 | 4795 | 116.95 | 29 | ||
| ADOLESCENT | 73 | 9214 | 126.22 | 49 | ||||||
| 2012–2013 | 300 | 20,660 | 68.87 | 78 | EDUCATIONAL | 96 | 5604 | 58.38 | 42 | |
| PATIENT | 189 | 8998 | 47.61 | 51 | SURVEY-AND-QUESTIONNAIRE | 94 | 5462 | 58.11 | 39 | |
| MESSAGE | 164 | 8881 | 54.15 | 56 | PUBLIC-HEALTH | 68 | 4733 | 69.6 | 34 | |
| WEB-2 | 152 | 7177 | 47.22 | 46 | CLINICAL | 21 | 1173 | 55.86 | 16 | |
| INTERVENTION | 130 | 7888 | 60.68 | 48 | ||||||
| 2014–2015 | 611 | 19,125 | 31.3 | 65 | SCHOOL | 187 | 5516 | 29.5 | 39 | |
| PATIENT | 333 | 7117 | 21.37 | 42 | PROGRAM | 144 | 3263 | 22.66 | 33 | |
| TWEET | 280 | 9757 | 34.85 | 52 | SOCIAL-NETWORK | 114 | 3726 | 32.68 | 36 | |
| TECHNOLOGY | 247 | 6187 | 25.05 | 42 | SOCIAL-MEDIA-USE | 53 | 1258 | 23.74 | 22 | |
| PUBLIC-HEALTH | 201 | 6176 | 30.73 | 43 | FEEDBACK | 36 | 675 | 18.75 | 17 | |
| WEB | 194 | 4972 | 25.63 | 38 | PEER | 12 | 274 | 22.83 | 10 | |
| 2016–2017 | 784 | 8101 | 10.33 | 34 | PERCEPTION | 199 | 1407 | 7.07 | 16 | |
| PATIENT | 502 | 4205 | 8.38 | 28 | NETWORK | 197 | 1920 | 9.75 | 22 | |
| TWEET | 342 | 3627 | 10.61 | 26 | PREVALENCE | 159 | 1473 | 9.26 | 18 | |
| PROGRAM | 318 | 2712 | 8.53 | 24 | FEATURE | 101 | 895 | 8.86 | 17 | |
| YOUNG-ADULT | 315 | 3289 | 10.44 | 26 | PREVENTION | 101 | 860 | 8.51 | 15 | |
| MEDIA | 286 | 2612 | 9.13 | 26 | ACADEMIC | 100 | 1225 | 12.25 | 18 | |
| YOUTUBE | 210 | 1515 | 7.21 | 17 | TREND | 21 | 276 | 13.14 | 10 |
Fig. 3.
Strategic diagrams for the period 2008–2009
Fig. 4.
Strategic diagrams for the period 2010–2011
Fig. 5.
Strategic diagrams for the period 2012–2013
Fig. 6.
Strategic diagrams for the period 2014–2015
Fig. 7.
Strategic diagrams for the period 2016–2017
In the period 2008–2009, there are a total of 39 publications. According to the strategic diagrams (Fig. 3) and quantitative measures (Table 4), we can observe that the motor themes PROFILE and SOCIAL-NETWORKING have high citations and H-index scores. Theme MANAGEMENT has the highest H-index score, indicating that it has a higher impact.
In the period 2010–2011, there are a total of 240 publications. The motor-theme FACEBOOK is the most cited and presents the highest impact. Other motor-themes TECHNOLOGY and ADOLESCENT also get high citations, and are with high H-index scores. Themes MASSAGE and DATA-COLLECTION get rather low citations and H-index scores.
In the period 2012–2013, a total of 729 publications are published. According to the performance measures, the following four themes could be highlighted: FACEBOOK, PATIENT, MESSAGE, and WEB-2. These research themes get important impact, achieving higher citations and H-index scores comparing with the remaining themes. The motor-theme FACEBOOK gets the most citations and also has the highest H-index score. The basic and transversal theme SURVEY-AND-QUESTIONNAIRE gets rather low citations and H-index score.
In the period 2014–2015 with a total of 1385 publications, according to the strategic diagrams (Fig. 6) and quantitative measures (Table 4), motor-themes present the highest citations and impact scores. The following seven themes with high citations and H-index scores are highlighted: FACEBOOK, PATIENT, TWEET, TECHNOLOGY, PUBLIC-HEALTH, WEB, and SCHOOL.
A total of 1968 publications are published in the period 2016–2017. The strategic diagrams (Fig. 7) and quantitative measures (Table 4) also show that motor-themes present the highest citations and impact scores, i.e., FACEBOOK, PATIENT, TWITTER, PROGRAM, YOUNG-ADULT, and MEDIA. The theme NETWORK also gets high citations, and are with high H-index score. The basic and transversal theme PERCEPTION gets rather low citations and H-index score.
An analysis of the evolution of the themes detected in each period considering their keywords and evolution across time is developed, shown as Fig. 8. Eight main thematic areas are identified such as FACEBOOK, PATIENT, TWEET, WEB, SOCIAL-NETWORK, and etc. According to Fig. 8, the research in this field presents dramatic cohesion due to the fact that the majority of the detected themes are grouped under a thematic area and come from a theme existing in the previous period. Some thematic areas are present in the research over the five periods studied such as FACEBOOK and PATIENT. Some thematic areas appear in the later periods such as SOCIAL-NETWORK.
Fig. 8.
Thematic evolution of the research field (2008–2017)
Discussion
Based on the 4361 research publications from Web of Science and PubMed during the year 2008–2017, a bibliometric analysis of utilizing social media for healthcare research is conducted, aiming at exploring the thematic detection and evolution of the research field.
The first finding worth noting is that the research field has attracted more and more attention from scientific communities throughout the last ten years. Most prolific publication sources are Journal of Medical Internet Research, PLoS One, and Cyberpsychology, Behavior and Social Networking. The USA dominates in the research with a comparatively higher publication count. Its dominant role can also be observed from the top prolific authors and affiliations, most of which belong to the USA.
In the overall thematic detection, 20 topics are detected by topic modelling analysis, e.g., YouTube analysis, Sex event, Web-based medical education, Students’ use of Facebook, and Twitter use. Most topics identified are recognizable because they are generally major issues in the research field. We here provide interpretations for some representative topics. Topic 14 contains words such as YouTube, YouTube video, video recording, viewer, and viewed. Thus it pertains to YouTube analysis. As a video-sharing platform, YouTube is nowadays widely utilized to search, share and disseminate health-related information. Topic 18 discusses Sex event. It includes terms such as men who have sex with men, HIV, adolescent, sexual, youth, sex, prevention, and intervention. Most relevant studies are about sexually transmitted infections with HIV as the major research focus, e.g., HIV prevention, treatment, and testing, in which men who have sex with men are often the main focus. Topic 10 mainly focuses on Web-based medical education with terms such as student, learning, medical education, teaching, course, nursing student, web-2, and technology. Participatory web-based platforms, including social media, have been increasingly recognized as valuable learning tools in medical and health education.
Comparing the results of topic modelling and AP clustering, it is found that for most of the identified groups, the representative terms in each group are more similar and understandable in AP clustering. The reason for this may be the use of analysis units. In AP clustering, only author keywords, KeyWords Plus, and PubMed MeSH are used with the consideration that too many analysis units may lead to poor performance when the selected frequent keywords are not of high quality. While in topic modelling, not only author keywords, KeyWords Plus, and PubMed MeSH, but also keywords from title and abstract are used with the consideration that more analysis units may lead to higher performance for topic modelling. However, phrase extraction is a difficult task due to the complexity of natural language text, thus the developed extraction program may extract keywords that are of low quality. Therefore, in the future work, more attention should be paid to improve keywords extraction performance.
From the thematic evolution analysis, Eight main thematic areas can be detected, e.g., FACEBOOK, PATIENT, TWEET, WEB, and SOCIAL-NETWORK. Also, generally, the motor-themes are presenting the highest citations and impact scores in each period. FACEBOOK, for instance, is presented as motor-theme in all the last four periods, while PATIENT and TWEET are motor-themes in all the last three periods, demonstrating their significant roles in the research field.
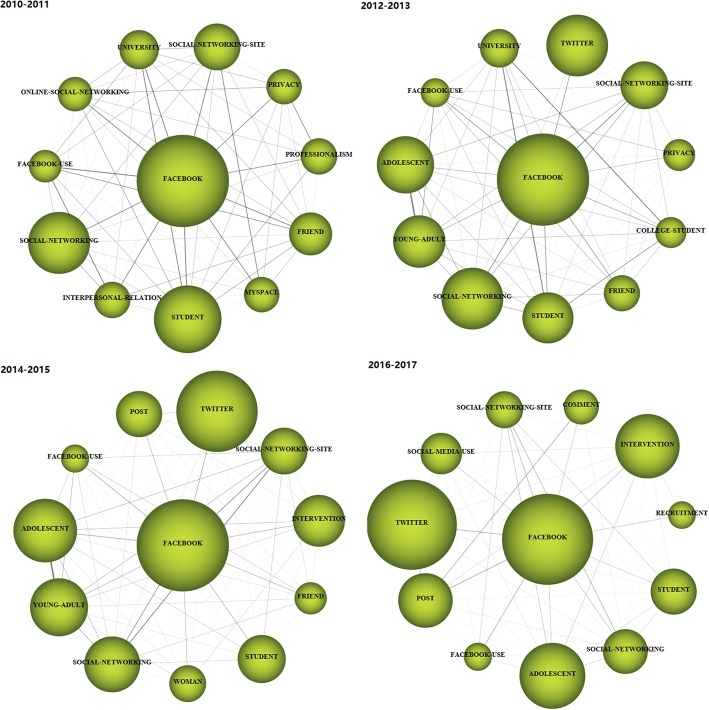
Specifically, the evolution of a certain thematic area can be represented using a series of thematic networks for each period. Taking the thematic area TWEET in Fig. 9 as an example, it first evolves in a decreasing way, and then in an increasing way. This thematic area is the origin of important thematic areas MANAGEMENT and VIRTUAL-COMMUNITY in the period 2008–2009, and these two areas evolve into MESSAGE in 2010–2011, and stays constant in the new period. In the period 2014–2015, it evolves into TWEET and PUBLIC-HEALTH, and finally moves into TWEET and MEDIA in the last period. Some thematic areas evolve in a constant way such as FACEBOOK, as shown in Fig. 10.
Fig. 9.
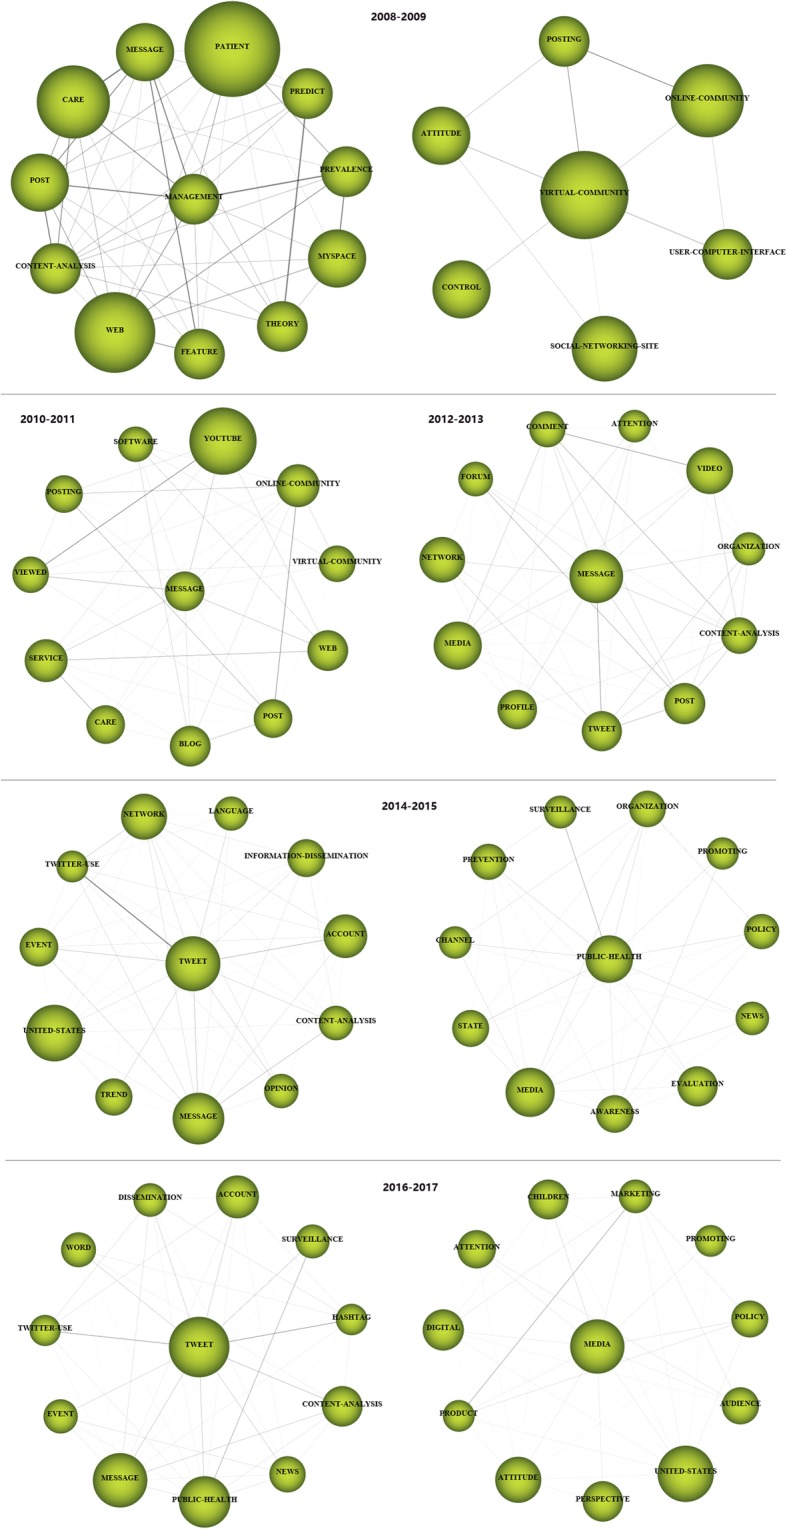
The TWEET thematic area (2008–2017)
Fig. 10.
The FACEBOOK thematic area (2011–2017)
Topic modelling analysis depicts the major research themes from the holistic perspective, and it does not take their evolution throughout different periods into consideration. The science mapping analysis fills this gap by providing opportunity to dig out the periodical thematic detection and how the detected themes evolve in a longitudinal framework. Observing from Tables 3 and 4, it is easy to find that there are more themes detected by topic modeling analysis comparatively. For example, some significant themes such as Sex event, Alcohol & drug, Vaccine, and Exercise, food, and weight, cannot be embodied in science mapping analysis. This may be caused by the fact that in the topic modelling analysis, all the keywords selected by TF-IDF are used as analysis units, but are not included the science mapping analysis.
In the science mapping analysis, data reduction and network reduction are used to attain modest network and dendrogram. On the one hand, data reduction is conducted by using a minimum frequency as a threshold to filter infrequent keywords so that the networks are not too complex to identify. On the other hand, as noted in [38], two keywords that appear infrequently in the corpus but always appear together usually have larger strength values than keywords that appear many times in the corpus almost always together, leading to the fact that possibly irrelevant or weak associations may dominate the network. Thus, SciMAT allows the network to be filtered using a minimum threshold edge value. The simple centers algorithm also has two parameters to limit the size of the detected themes: the minimum and maximum size of the networks. Although the data reduction and network reduction are of good intention to demonstrate the most significant keywords and their relationship in a more visible and clear way. Some keywords with a comparatively low frequency that are not taken into account may be also of importance. Thus, in the future work, we will find ways to explore periodical thematic evolution with consideration of every single word.
Conclusions
Aiming at understanding the thematic change and evolution of utilizing social media for healthcare research during the last decade, this paper presents a quantitative analysis of publications from Web of Science and PubMed. Topic modelling analysis is used to identify major areas from an overall perspective. An approach of science mapping combining performance analysis is applied to quantify and visualize the thematic evolution. This systematic mapping of the research themes and research areas helps identify research interests and how they evolve across time, as well as providing insight into future research direction.
Additional file
Table S1. Search strategy and keywords used for Web of Science. Table S2. Search strategy and keywords used for PubMed. (DOCX 16 kb)
Acknowledgements
Not applicable.
Funding
Publication of the article is supported by grants from National Natural Science Foundation of China (No. 61772146 & No. 61871141), and Guangzhou Science Technology and Innovation Commission (No. 201803010063).
Availability of data and materials
The datasets used and analyzed during the current study are available from the first author upon reasonable requests.
About this supplement
This article has been published as part of BMC Medical Informatics and Decision Making Volume 19 Supplement 2, 2019: Proceedings from the 4thChina Health Information Processing Conference (CHIP 2018). The full contents of the supplement are available online at URL. https://bmcmedinformdecismak.biomedcentral.com/articles/supplements/volume-19-supplement-2.
Abbreviations
- AP
Affinity Propagation
- HIV
Human immunodeficiency virus
- LDA
Latent Dirichlet Allocation
- MeSH
Medical subject headings
- SciMAT
Science mapping anaylsis tool
- TF-IDF
Term frequency-inverse document frequencies
- USA
United States
- VEM
Variational expectation-maximization
- WoS
Web of Science
Authors’ contributions
XLC leaded the method application, experiment conduction and the result analysis. YHL participated in the data extraction and preprocessing. JY participated in the manuscript revision. TYH provided theoretical guidance and the revision of this paper. HW took participated in manuscript revision. All authors read and approved the final manuscript.
Ethics approval and consent to participate
Not applicable.
Consent for publication
Not applicable.
Competing interests
The authors declare that they have no competing interests.
Publisher’s Note
Springer Nature remains neutral with regard to jurisdictional claims in published maps and institutional affiliations.
Contributor Information
Xieling Chen, Email: shaylyn_chen@163.com.
Yonghui Lun, Email: wingfai-lun@163.com.
Jun Yan, Email: jun.yan@yiducloud.cn.
Tianyong Hao, Email: haoty@m.scnu.edu.cn.
Heng Weng, Email: ww128@qq.com.
References
- 1.Baker L, Wagner TH, Singer S, Bundorf MK. Use of the internet and E-mail for health care information: results from a National Survey. JAMA. 2003;289(18):2400–2406. doi: 10.1001/jama.289.18.2400. [DOI] [PubMed] [Google Scholar]
- 2.Oh KM, Jun JM, Zhao XQ, Kreps GL, Lee EE. Cancer information seeking behaviors of Korean American women: a mixed-methods study using surveys and focus group interviews. J Health Commun. 2015;20(10):1143–1154. doi: 10.1080/10810730.2015.1018578. [DOI] [PubMed] [Google Scholar]
- 3.Lee SY, Hawkins R. Why do patients seek an Alternative Channel? The effects of unmet needs on Patients' health-related internet use. J Health Commun. 2010;15(2):152–166. doi: 10.1080/10810730903528033. [DOI] [PubMed] [Google Scholar]
- 4.Fox S, Purcell K. Chronic disease and the internet. DC: Pew Internet & American Life Project Washington; 2010. [Google Scholar]
- 5.Lavrač N, Keravnou ET, Zupan B. Intelligent data analysis in medicine and pharmacology: an overview. In: Lavrač N, Keravnou ET, Zupan B, editors. Intelligent data analysis in medicine and pharmacology. Boston, MA: Springer US; 1997. pp. 1–13. [Google Scholar]
- 6.Sinnenberg L, DiSilvestro CL, Mancheno C, Dailey K, Tufts C, Buttenheim AM, et al. Twitter as a potential data source for cardiovascular disease research. JAMA Cardiol. 2016;1(9):1032–1036. doi: 10.1001/jamacardio.2016.3029. [DOI] [PMC free article] [PubMed] [Google Scholar]
- 7.Ireland ME, Schwartz HA, Chen QJ, Ungar LH, Albarracn D. Future-oriented tweets predict lower county-level HIV Prevalence in the United States. Health Psychol. 2015;34(S):1252–1260. doi: 10.1037/hea0000279. [DOI] [PMC free article] [PubMed] [Google Scholar]
- 8.Ross MW, Berg RC, Schmidt AJ, Hospers HJ, Breveglieri M, Furegato M, Weatherburn P. Internalised Homonegativity predicts HIV-associated risk behavior in European men who have sex with men in a 38-country cross-sectional study: some public health implications of homophobia. BMJ Open. 2013;3(2):e001928. doi: 10.1136/bmjopen-2012-001928. [DOI] [PMC free article] [PubMed] [Google Scholar]
- 9.Wong ML, Chan RKW, Koh D, Tan HH, Lim FS, Emmanuel S, Bishop G. Premarital sexual intercourse among adolescents in an Asian country: multilevel ecological factors. Pediatrics. 2009;124(1):e44–e52. doi: 10.1542/peds.2008-2954. [DOI] [PubMed] [Google Scholar]
- 10.Bender JL, Jimenez-Marroquin MC, Ferris LE, Katz J, Jadad AR. Online communities for breast Cancer survivors: a review and analysis of their characteristics and levels of use. Support Care Cancer. 2013;21(5):1253–1263. doi: 10.1007/s00520-012-1655-9. [DOI] [PubMed] [Google Scholar]
- 11.Bender JL, Wiljer D, To MJ. Bedard PL, Chung P, Jewett MA, et al. Testicular Cancer survivors’ supportive care needs and use of online support: a cross-sectional survey. Support Care Cancer. 2012;20(11):2737–2746. doi: 10.1007/s00520-012-1395-x. [DOI] [PubMed] [Google Scholar]
- 12.Bravo CA, Hoffman-Goetz L. Tweeting about prostate and testicular cancers: do twitter conversations and the 2013 Movember Canada campaign objectives align? J Cancer Educ. 2016;31(2):236–243. doi: 10.1007/s13187-015-0796-1. [DOI] [PubMed] [Google Scholar]
- 13.Stellefson M, Chaney B, Ochipa K, Chaney D, Haider Z, Hanik B, et al. YouTube as a source of chronic obstructive pulmonary disease patient education: a social media content analysis. Chron Respir Dis. 2014;11(2):61–71. doi: 10.1177/1479972314525058. [DOI] [PMC free article] [PubMed] [Google Scholar]
- 14.Park S, Oh HK, Park G, Suh B, Bae WK, Kim JW, et al. The source and credibility of colorectal Cancer information on twitter. Medicine. 2016;95(7):e2775. doi: 10.1097/MD.0000000000002775. [DOI] [PMC free article] [PubMed] [Google Scholar]
- 15.Himelboim I, Han JY. Cancer talk on twitter: community structure and information sources in breast and prostate Cancer social networks. J Health Commun. 2014;19(2):210–225. doi: 10.1080/10810730.2013.811321. [DOI] [PubMed] [Google Scholar]
- 16.Mackey TK, Liang BA. Global reach of direct-to-consumer advertising using social Media for Illicit Online Drug Sales. J Med Internet Res. 2013;15(5):e105. doi: 10.2196/jmir.2610. [DOI] [PMC free article] [PubMed] [Google Scholar]
- 17.Mackey TK, Cuomo RE, Liang BA. The rise of digital direct-to-consumer advertising? Comparison of direct-to-consumer advertising expenditure trends from publicly available data sources and global policy implications. BMC Health Serv Res. 2015;15(1):236. doi: 10.1186/s12913-015-0885-1. [DOI] [PMC free article] [PubMed] [Google Scholar]
- 18.Chen XL, Weng H, Hao TY. A data-driven approach for discovering the recent research status of diabetes in China. Lect Notes Comput Sci. 2017;10594:89–101. doi: 10.1007/978-3-319-69182-4_10. [DOI] [Google Scholar]
- 19.Chen XL, Chen BY, Zhang CX, Hao TY. Discovering the recent research in natural language processing field based on a statistical approach. Lect Notes Comput Sci. 2017;10676:507–517. doi: 10.1007/978-3-319-71084-6_60. [DOI] [Google Scholar]
- 20.Chen XL, Liu ZQ, Wei L, Yan J, Hao TY, Ding RY. A comparative quantitative study of utilizing artificial intelligence on electronic health records in the USA and China during 2008-2017. BMC Med Inform Decis Mak. 2018;18(Suppl 5):117. doi: 10.1186/s12911-018-0692-9. [DOI] [PMC free article] [PubMed] [Google Scholar]
- 21.Chen XL, Ding RY, Xu K, Wang S, Hao TY, Zhou Y. A bibliometric review of natural language processing empowered Mobile computing. Wirel Commun Mob Comput. 2018:1–21.
- 22.Chen XL, Xie HR, Wang FL, Liu ZQ, Xu J, Hao TY. A bibliometric analysis of natural language processing in medical research. BMC Med Inform Decis Mak. 2018;18(1):14. doi: 10.1186/s12911-018-0594-x. [DOI] [PMC free article] [PubMed] [Google Scholar]
- 23.Hao TY, Chen XL, Li GZ, Yan J. A bibliometric analysis of text mining in medical research. Soft Comput. 2018:1–18.
- 24.Chen XL, Hao JT, Chen JJ, Hua SS, Hao TY. A bibliometric analysis of the research status of the technology enhanced language learning. Lect Notes Comput Sci. 2018;11284:169–179. doi: 10.1007/978-3-030-03580-8_18. [DOI] [Google Scholar]
- 25.Chen XL, Wang S, Tang Y, Hao TY. A bibliometric analysis of event detection in social media. Online Inf Rev. 2019;43(1):29-52.
- 26.Cobo MJ, Martinez MA, Gutierrez-Salcedo M, Fujita H, Herrera-Viedma E. 25 years at knowledge-based systems: a bibliometric analysis. Knowl-Based Syst. 2015;80:3–13. doi: 10.1016/j.knosys.2014.12.035. [DOI] [Google Scholar]
- 27.Blei DM, Ng AY, Jordan MI. Latent Dirichlet allocation. J Mach Learn Res. 2003;3(Jan):993–1022. [Google Scholar]
- 28.Frey BJ, Dueck D. Clustering by passing messages between data points. Science. 2007;315(5814):972–976. doi: 10.1126/science.1136800. [DOI] [PubMed] [Google Scholar]
- 29.Small H. Visualizing science by citation mapping. J Am Soc Inf Sci. 1999;50(9):799–813. doi: 10.1002/(SICI)1097-4571(1999)50:9<799::AID-ASI9>3.0.CO;2-G. [DOI] [Google Scholar]
- 30.Cartes-Velásquez R, Manterola-Delgado C. Bibliometric analysis of articles published in ISI dental journals, 2007-2011. Scientometrics. 2014;98(3):2223–2233. doi: 10.1007/s11192-013-1173-7. [DOI] [Google Scholar]
- 31.Cobo MJ, Chiclana F, Collop A, de Oña J, Herrera-Viedma E. A bibliometric analysis of the intelligent transportation systems research based on science mapping. IEEE Trans Intell Transp Syst. 2014;15(2):901–908. doi: 10.1109/TITS.2013.2284756. [DOI] [Google Scholar]
- 32.Huang MH, Chang CP. Detecting research fronts in OLED field using bibliographic coupling with sliding window. Scientometrics. 2014;98(3):1721–1744. doi: 10.1007/s11192-013-1126-1. [DOI] [Google Scholar]
- 33.Cobo MJ, López-Herrera AG, Herrera-Viedma E, Herrera F. SciMAT: a new science mapping analysis software tool. J Am Soc Inf Sci Technol. 2012;63(8):1609–1630. doi: 10.1002/asi.22688. [DOI] [Google Scholar]
- 34.Cobo MJ, López-Herrera AG, Herrera-Viedma E, Herrera F. Science mapping software tools: review, analysis and cooperative study among tools. J Am Soc Inf Sci Technol. 2011;62(7):1382–1402. doi: 10.1002/asi.21525. [DOI] [Google Scholar]
- 35.Cobo MJ, López-Herrera AG, Herrera-Viedma E, Herrera F. An approach for detecting, quantifying, and visualizing the evolution of a research field: a practical application to the fuzzy sets theory field. J Informetrics. 2011;5(1):146–166. doi: 10.1016/j.joi.2010.10.002. [DOI] [Google Scholar]
- 36.Callon M, Courtial JP, Turner WA, Bauin S. From translations to problematic networks: an introduction to co-word analysis. Soc Sci Inf. 1983;22(2):191–235. doi: 10.1177/053901883022002003. [DOI] [Google Scholar]
- 37.Hirsch JE. An index to quantify an individuals scientific research output. Proc Natl Acad Sci. 2005;102(46):16569–16572. doi: 10.1073/pnas.0507655102. [DOI] [PMC free article] [PubMed] [Google Scholar]
- 38.Coulter N, Monarch I, Konda S. Software engineering as seen through its research literature: a study in co-word analysis. J Am Soc Inf Sci. 1998;49(13):1206–1223. doi: 10.1002/(SICI)1097-4571(1998)49:13<1206::AID-ASI7>3.0.CO;2-F. [DOI] [Google Scholar]
- 39.Callon M, Courtial JP, Laville F. Co-word analysis as a tool for describing the network of interactions between basic and technological research: the case of polymer chemistry. Scientometrics. 1991;22(1):155–205. doi: 10.1007/BF02019280. [DOI] [Google Scholar]
- 40.Sternitzke C, Bergmann I. Similarity measures for document mapping: a comparative study on the level of an individual scientist. Scientometrics. 2009;78(1):113–130. doi: 10.1007/s11192-007-1961-z. [DOI] [Google Scholar]
Associated Data
This section collects any data citations, data availability statements, or supplementary materials included in this article.
Supplementary Materials
Table S1. Search strategy and keywords used for Web of Science. Table S2. Search strategy and keywords used for PubMed. (DOCX 16 kb)
Data Availability Statement
The datasets used and analyzed during the current study are available from the first author upon reasonable requests.


