

Abstract
Background
Many adults are living longer with health conditions in the United States. Understanding the disability-adjusted life years (DALYs) for such health conditions may help to inform healthcare providers and their patients, guide health interventions, reduce healthcare costs, improve quality of life, and increase longevity for aging Americans. The purpose of this study was to determine the burden of 10 health conditions for a nationally-representative sample of adults aged 50 years and older in the United States.
Methods
Data from the 1998–2014 waves of the Health and Retirement Study were analyzed. At each wave, participants indicated if they were diagnosed with the following 10 conditions: cancer, chronic obstructive pulmonary disease (COPD), congestive heart failure, diabetes, back pain, hypertension, a fractured hip, myocardial infarction, rheumatism or arthritis, and a stroke. Years lived with a disability and years of life lost to premature mortality were summed for calculating DALYs. Sample weights were utilized in the analyses to make the DALY estimates nationally-representative. Results for the DALYs were presented in thousands.
Results
There were 30,101 participants included. Sex stratified DALY estimates ranged from 4092 (fractured hip)-to-178,055 (hypertension) for men and 13,621 (fractured hip)-to-200,794 (hypertension) for women. The weighted overall DALYs were: 17,660 for hip fractures, 62,630 for congestive heart failure, 64,710 for myocardial infarction, 90,337 for COPD, 93,996 for stroke, 142,012 for cancer, 117,534 for diabetes, 186,586 for back pain, 333,420 for arthritis, and 378,849 for hypertension. In total, there were an estimated 1,487,734 years of healthy life lost from the 10 health conditions examined over the study period.
Conclusions
The burden of these health conditions accounted for over a million years of healthy life lost for middle-aged and older Americans over the 16 year study period. Our results should be used to inform healthcare providers and guide health interventions aiming to improve the health of middle-aged and older adults. Moreover, shifting health policy and resources to match DALY trends may help to improve quality of life during aging and longevity.
Electronic supplementary material
The online version of this article (10.1186/s12877-019-1110-6) contains supplementary material, which is available to authorized users.
Keywords: Normative aging, Epidemiology, Longevity, Morbidity
Background
Increased age is a hallmark risk factor for several health conditions [1]. Although approximately 86% of older adults in the United States are living with at least one health condition [2], life expectancy in the United States has generally continued to increase [3]. The advancements in life expectancy have been attributed to many factors including improvements in the prevention and treatment of morbidity. Given that the older adult population is projected to grow 112% by the year 2060 [4], healthcare providers and policy makers need to continue accommodating the emerging health demands of this population for helping them live longer, and with more quality years. For example, public health programs have been developed for improving the wellbeing and longevity of aging adults. Healthy People 2020 and 2030 includes initiatives to prevent morbidity, improve quality of care, and delay mortality for older adults in the United States [5].
Disability-adjusted life years (DALYs) are used globally to quantify the number of healthy years of life lost from the presence of a disease, disability, or injury [6]. The burden of chronic, non-fatal health loss and early mortality is evaluated separately and compared across populations. Information for DALYs in the United States and globally is often provided in Global Burden of Disease studies [7]. Such information is used to inform healthcare providers about the impact of a health condition and guide interventions seeking to improve the health and life expectancy of a given population [8]. Being that this time-based metric measures the burden of a health condition in a population and compares to a healthy population that reaches full life expectancy, the specific burden of common health conditions for middle-aged and older adults in the United States has yet to be calculated.
More studies are needed for understanding how aging is linked with disease [1]. Calculating the years lived with a disease (YLDs) and years of life lost (YLLs) from premature mortality will provide insights into the burden of common health conditions for the growing aging adult population. This information can help to identify which health conditions contribute most to the number of healthy years of life lost for aging adults, thereby informing how healthcare providers and interventions prioritize treatment and prevention efforts. Such prioritization will help to guide health policy, and increase the quality of life and longevity for aging adults. Therefore, the purpose of this study was to determine the burden of 10 common health conditions for a nationally-representative sample of middle-aged and older adults in the United States.
Methods
Participants
Data from 37,495 participants in the 1998–2014 waves of the Health and Retirement Study (HRS) were used. Individual data files were joined to the cleaned and standardized RAND HRS dataset. The purpose of the HRS is to understand the health and economic implications of advancing age that can threaten or promote health and wealth at individual- and population-levels [9]. Participants in the HRS have been re-interviewed biennially since 1992. Further, the HRS includes surveys from over 23,000 households and has provided data for a nationally-representative sample of Americans aged over 50 years since 1998 [10]. New cohorts of participants have been added to the original HRS sample to preserve national representation and participants are followed longitudinally until death [10]. A multi-stage probability design is used by the HRS, including geographical stratification and oversampling of certain demographic groups. Additional details for the HRS are described elsewhere [11].
Written informed consent was acquired from all participants before entering the study and protocols were approved by the University of Michigan Behavioral Sciences Committee Institutional Review Board. Participant anonymity was ensured because data used in this secondary analysis contained no direct identifiers.
Health conditions
Participants self-reported their date of birth and sex. Interviewers asked participants questions related to their physical health at each wave. Individuals who reported having cancer, chronic obstructive pulmonary disease (COPD), congestive heart failure, diabetes or high blood sugar, back pain, high blood pressure or hypertension, a fractured hip, a heart attack or myocardial infarction, rheumatism or arthritis, or a stroke were included. The date of interview for the wave a health condition was first confirmed by participants was treated as a proxy for the date of diagnosis. These health conditions were selected by investigators because they were identified as having a corresponding disability weight from the Global Burden of Disease [12, 13]. Example interviewer questions for each health condition that were asked to participants are listed in Additional file 1: Table S1.
Mortality
Date of death was obtained through linkage to the National Death Index. The HRS also conducted an interview with a surviving spouse, child, or other informant for each decedent, successfully obtaining study exit information [10].
Statistical analysis
Procedures from the World Health Organization for determining DALYs with an incidence-based calculation were used [14]. Participants were first stratified by sex, then by age categories (50–59 years, 60–69 years, 70–79 years, ≥80 years). The age at which a health condition occurred determined age categories for all participants.
YLDs were calculated by multiplying the number of incident cases for each health condition, corresponding disability weight, and average duration of years lived with the health condition until death, or truncation. For those who were still alive or lost to follow-up (i.e., truncation), the average duration of years lived with the health condition was determined using their estimated life expectancy at age of truncation [15]. Disability weights for each health condition were from the Global Burden of Disease (back pain = 0.020, cancer = 0.288, COPD = 0.019, congestive heart failure = 0.201, diabetes = 0.015, fractured hip = 0.058, hypertension = 0.246, myocardial infarction = 0.439, rheumatism or arthritis =0.199, stroke = 0.266) [12, 13]. For each sex, YLDs were summed across age categories to determine total YLDs.
YLLs were calculated by taking the product of the number of deaths that occurred by the mean life expectancy at age of death in years. The Period Life Table was used to determine life expectancy at each age for men and women [16]. The YLLs were summed across age categories to determine total YLLs.
For men and women, YLDs and YLLs were added across age categories to determine DALYs for each health condition. Then, the DALYs estimates were summed for calculating overall DALYs. Sample weights were utilized in the analyses so DALYs were nationally-representative. The YLLs, YLDs, and DALYs are reported in thousands. All analyses were performed with SAS 9.4 software (SAS Institute; Cary, NC).
Results
After exclusions (Fig. 1), there were 30,101 participants included (n = 16,591 women, n = 13,510 men) from the 1998–2014 waves who reported having at least one of the health conditions we examined. The non-weighted and weighted descriptive characteristics of the participants are presented in Table 1. Overall, participants entered the study at 63.3 ± 10.6 years of age. Of the 10,504 participants that died, the age at death was 79.6 ± 10.5 years. Table 2 provides person-level DALY estimates and 95% confidence intervals for each health outcome.
Fig. 1.
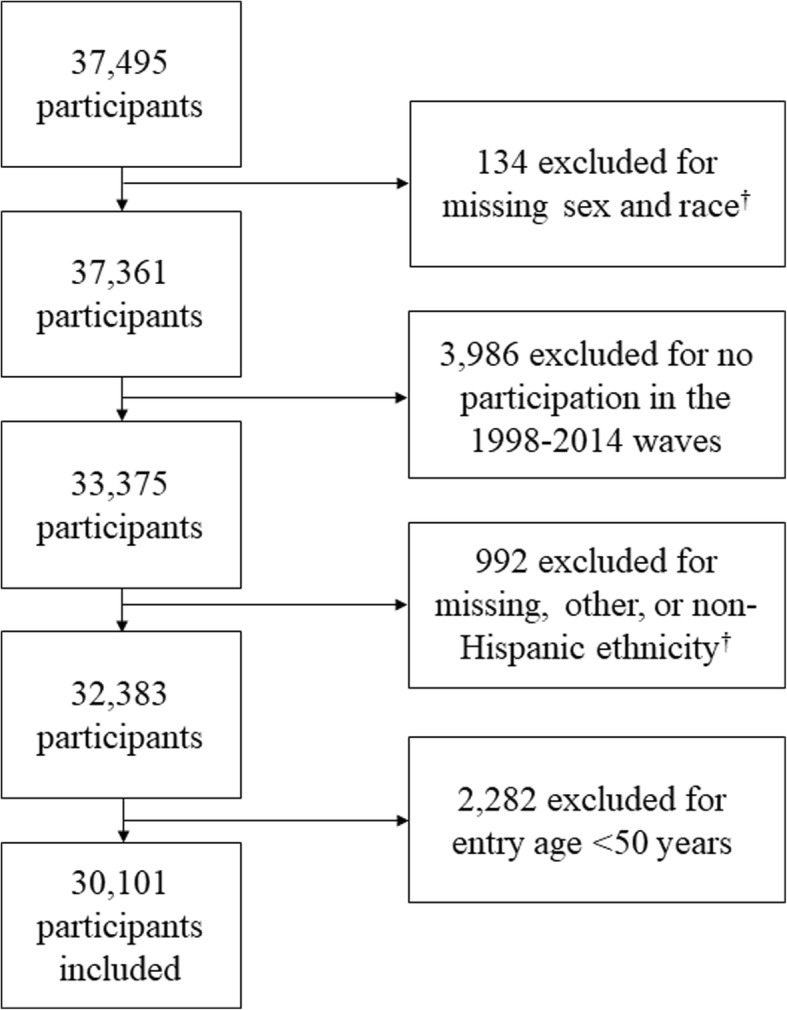
Flow Chart for Exclusions. †Exclusions occurred because races and ethnicities in the other category were stratified
Table 1.
Non-Weighted and Weighted Descriptive Characteristics of the Participants
| Overall (n = 30,101) | Weighted Overall (n = 114,610,740) | Women (n = 16,591) | Weighted Women (n = 59,183,770) | Men (n = 13,510) | Weighted Men (n = 55,426,970) | |
|---|---|---|---|---|---|---|
| Age (years) | 63.3 ± 10.6 | 60.9 ± 10.0 | 63.7 ± 11.1 | 61.8 ± 10.6 | 62.9 ± 10.0 | 60.1 ± 9.4 |
| Age at Death (years) | 79.6 ± 10.5 | 78.4 ± 11.0 | 81.2 ± 10.7 | 80.4 ± 10.8 | 77.9 ± 10.1 | 76.3 ± 10.9 |
| Died (n (%)) | 10,504 (34.9%) | 31,954,223 (27.8%) | 5553 (52.8%) | 16,504,100 (27.9%) | 4951 (16.4%) | 15,450,123 (27.8%) |
Table 2.
Person-Level Disability-Adjusted Life Year Means and 95% Confidence Intervals
| Mean | 95% Confidence Interval | Mean | 95% Confidence Interval | Mean | 95% Confidence Interval | |
|---|---|---|---|---|---|---|
| Arthritis | Back Pain | Cancer | ||||
| Males | ||||||
| 50–59 Years | 20.4 | 20.1, 20.8 | 20.6 | 20.2, 21.0 | 21.9 | 21.4, 22.5 |
| 60–69 Years | 14.4 | 14.2, 14.6 | 13.4 | 13.2, 13.7 | 15.7 | 15.4, 16.0 |
| 70–79 Years | 9.1 | 9.0, 9.2 | 8.4 | 8.2, 8.6 | 10.1 | 10.0, 10.3 |
| ≥80 Years | 5.4 | 5.3, 5.4 | 4.5 | 4.4, 4.7 | 5.8 | 5.7, 6.0 |
| Total | 11.0 | 10.9, 11.2 | 10.5 | 10.2, 10.7 | 11.2 | 10.9, 11.4 |
| Females | ||||||
| 50–59 Years | 23.0 | 22.7, 23.4 | 23.0 | 22.5, 23.5 | 24.8 | 24.2, 25.3 |
| 60–69 Years | 16.1 | 15.9, 16.3 | 15.1 | 14.8, 15.4 | 17.5 | 17.2, 17.8 |
| 70–79 Years | 9.9 | 9.8, 10.0 | 9.2 | 9.0, 9.4 | 11.1 | 10.9, 11.3 |
| ≥80 Years | 5.8 | 5.7, 5.9 | 5.0 | 4.8, 5.1 | 6.5 | 6.4, 6.6 |
| Total | 11.0 | 10.8, 11.2 | 10.5 | 10.3, 10.7 | 12.5 | 12.2, 12.8 |
| Overall | ||||||
| 50–59 Years | 21.8 | 21.6, 22.1 | 21.8 | 21.4, 22.1 | 23.5 | 23.1, 24.0 |
| 60–69 Years | 15.2 | 15.1, 15.4 | 14.3 | 14.1, 14.5 | 16.6 | 16.4, 16.8 |
| 70–79 Years | 9.5 | 9.5, 9.6 | 8.8 | 8.7, 9.0 | 10.6 | 10.5, 10.7 |
| ≥80 Years | 5.7 | 5.6, 5.7 | 4.8 | 4.7, 4.9 | 6.2 | 6.1, 6.3 |
| Total | 11.0 | 10.9, 11.2 | 10.5 | 10.3, 10.7 | 11.8 | 11.6, 12.1 |
| Chronic Obstructive Pulmonary Disease | Congestive Heart Failure | Diabetes | ||||
| Males | ||||||
| 50–59 Years | 19.8 | 19.1, 20.4 | 21.7 | 20.9, 22.4 | 19.6 | 19.1, 20.1 |
| 60–69 Years | 13.5 | 13.2, 13.9 | 15.4 | 15.0, 15.8 | 13.4 | 13.1, 13.7 |
| 70–79 Years | 8.6 | 8.4, 8.8 | 9.8 | 9.6, 10.0 | 8.2 | 8.0, 8.4 |
| ≥80 Years | 5.0 | 4.8, 5.1 | 5.2 | 5.1, 5.4 | 4.8 | 4.6, 5.0 |
| Total | 10.4 | 10.1, 10.7 | 10.4 | 10.0, 10.8 | 11.1 | 10.8, 11.3 |
| Females | ||||||
| 50–59 Years | 21.9 | 21.2, 22.6 | 24.5 | 23.7, 25.3 | 22.0 | 21.5, 22.6 |
| 60–69 Years | 15.6 | 15.2, 16.0 | 17.2 | 16.7, 17.7 | 15.0 | 14.7, 15.3 |
| 70–79 Years | 9.6 | 9.3, 9.8 | 11.0 | 10.7, 11.3 | 9.1 | 8.9, 9.3 |
| ≥80 Years | 5.3 | 5.1, 5.5 | 5.8 | 5.6, 5.9 | 5.3 | 5.1, 5.4 |
| Total | 11.5 | 11.2, 11.9 | 10.4 | 10.2, 10.7 | 11.9 | 11.6, 12.2 |
| Overall | ||||||
| 50–59 Years | 20.9 | 20.4, 21.4 | 23.1 | 22.5, 23.7 | 20.8 | 20.4, 21.2 |
| 60–69 Years | 14.6 | 14.3, 14.8 | 16.3 | 16.0, 16.6 | 14.2 | 14.0, 14.4 |
| 70–79 Years | 9.1 | 8.9, 9.2 | 10.4 | 10.2, 10.6 | 8.6 | 8.5, 8.8 |
| ≥80 Years | 5.1 | 5.0, 5.3 | 5.6 | 5.5, 5.7 | 5.1 | 4.9, 5.2 |
| Total | 11.0 | 10.7, 11.2 | 10.4 | 10.1, 10.6 | 11.5 | 11.3, 11.7 |
| Fractured Hip | Hypertension | Myocardial Infarction | ||||
| Males | ||||||
| 50–59 Years | – | – | 21.3 | 21.0, 21.6 | 22.4 | 21.8, 22.9 |
| 60–69 Years | 13.6 | 12.6, 14.5 | 14.8 | 14.6, 15.0 | 16.5 | 16.2, 16.8 |
| 70–79 Years | 9.0 | 8.4, 9.5 | 9.5 | 9.4, 9.6 | 10.9 | 10.7, 11.1 |
| ≥80 Years | 4.8 | 4.5, 5.1 | 5.7 | 5.6, 5.8 | 6.5 | 6.4, 6.7 |
| Total | 7.2 | 6.7, 7.7 | 11.9 | 11.8, 12.1 | 11.9 | 11.5, 12.2 |
| Females | ||||||
| 50–59 Years | – | – | 23.8 | 23.5, 24.1 | 25.0 | 24.1, 25.8 |
| 60–69 Years | 15.7 | 14.8, 16.6 | 16.6 | 16.4, 16.8 | 18.2 | 17.8, 18.7 |
| 70–79 Years | 10.1 | 9.6, 10.5 | 10.3 | 10.2, 10.4 | 12.0 | 11.8, 12.3 |
| ≥80 Years | 5.0 | 4.8, 5.2 | 6.1 | 6.0, 6.2 | 6.9 | 6.7, 7.1 |
| Total | 6.8 | 6.5, 7.1 | 11.7 | 11.5, 11.9 | 11.8 | 11.4, 12.3 |
| Overall | ||||||
| 50–59 Years | – | – | 22.5 | 22.3, 22.7 | 23.5 | 22.9, 24.0 |
| 60–69 Years | 15.0 | 14.3, 15.7 | 15.7 | 15.6, 15.8 | 17.1 | 16.9, 17.4 |
| 70–79 Years | 9.7 | 9.3, 10.0 | 9.9 | 9.8, 10.0 | 11.4 | 11.2, 11.6 |
| ≥80 Years | 5.0 | 4.8, 5.1 | 5.9 | 5.9, 6.0 | 6.7 | 6.6, 6.8 |
| Total | 6.9 | 6.7, 7.2 | 11.8 | 11.7, 12.0 | 11.8 | 11.6, 12.1 |
| Stroke | ||||||
| Males | ||||||
| 50–59 Years | 21.5 | 20.8, 22.1 | ||||
| 60–69 Years | 15.8 | 15.4, 16.1 | ||||
| 70–79 Years | 9.7 | 9.5, 9.8 | ||||
| ≥80 Years | 5.5 | 5.3, 5.6 | ||||
| Total | 10.6 | 10.3, 10.9 | ||||
| Females | ||||||
| 50–59 Years | 24.4 | 23.7, 25.1 | ||||
| 60–69 Years | 17.4 | 17.0, 17.8 | ||||
| 70–79 Years | 11.0 | 10.8, 11.2 | ||||
| ≥80 Years | 6.1 | 6.0, 6.2 | ||||
| Total | 10.1 | 9.8, 10.4 | ||||
| Overall | ||||||
| 50–59 Years | 22.9 | 22.3, 23.4 | ||||
| 60–69 Years | 16.5 | 16.2, 16.8 | ||||
| 70–79 Years | 10.3 | 10.2, 10.5 | ||||
| ≥80 Years | 5.9 | 5.8, 6.0 | ||||
| Total | 10.3 | 10.1, 10.5 | ||||
Figure 2 presents the weighted YLDs and YLLs for each health condition stratified by sex. DALY estimates for men were: 4092 for hip fractures, 28,707 for congestive heart failure, 36,688 for myocardial infarction, 42,413 for COPD, 45,197 for stroke, 59,006 for diabetes, 68,237 for cancer, 86,392 for back pain, 144,991 for arthritis, and 178,055 for hypertension. Likewise, DALY estimates for women were: 13,621 for hip fractures, 27,855 for myocardial infarction, 33,874 for congestive heart failure, 47,802 for COPD, 48,587 for stroke, 58,101 for diabetes, 73,529 for cancer, 99,736 for back pain, 188,177 for arthritis, and 200,794 for hypertension. Of the ten health conditions examined herein, the number of DALYs for diabetes and myocardial infarction were only higher in men than women. In total, the 10 health conditions accounted for an estimated 693,778 DALYs in men and 792,076 DALYs in women.
Fig. 2.

The Burden of the Health Outcomes for Middle-Aged and Older Adults Stratified by Sex. Note: Green Bars = Years of Life Lost; Yellow Bars = Years Lived with Disease. COPD = Chronic Obstructive Pulmonary Disease; DALYs = Disability-Adjusted Life Years
The weighted overall DALYs were: 17,660 for hip fractures, 62,630 for congestive heart failure, 64,710 for myocardial infarction, 90,337 for COPD, 93,996 for stroke, 117,534 for diabetes, 142,012 for cancer, 186,586 for back pain, 333,420 for arthritis, and 378,849 for hypertension. Detailed information for the weighted burden of each health condition by sex and overall is presented in Table 3. As a whole, there were an estimated 347,274 YLDs, 1,140,457 YLLs, and 1,487,734 DALYs for the 10 health conditions.
Table 3.
Disability-Adjusted Life Years for Each Health Outcome
| Cases | Number Dead | YLLs (in thousands) | YLDs (in thousands) | DALYs (in thousands) | |
|---|---|---|---|---|---|
| Arthritis | |||||
| Males | |||||
| 50–59 Years | 13,140,604 | 1,767,444 | 33,628 | 19,243 | 52,871 |
| 60–69 Years | 9,293,034 | 2,465,646 | 31,798 | 14,254 | 46,053 |
| 70–79 Years | 5,768,620 | 3,415,221 | 26,344 | 8051 | 34,396 |
| ≥80 Years | 2,600,532 | 2,069,681 | 9260 | 2411 | 11,671 |
| Total | 30,802,790 | 9,717,992 | 101,030 | 43,959 | 144,991 |
| Females | |||||
| 50–59 Years | 16,094,235 | 1,583,622 | 34,047 | 25,641 | 59,688 |
| 60–69 Years | 11,064,877 | 2,422,174 | 35,011 | 18,417 | 53,428 |
| 70–79 Years | 8,296,633 | 4,304,371 | 36,176 | 13,157 | 49,333 |
| ≥80 Years | 5,291,347 | 4,199,135 | 20,000 | 5728 | 25,728 |
| Total | 40,747,092 | 12,509,302 | 125,234 | 62,943 | 188,177 |
| Overall | |||||
| 50–59 Years | 29,234,839 | 3351,066 | 68,226 | 44,842 | 113,068 |
| 60–69 Years | 20,357,911 | 4,887,820 | 66,848 | 32,557 | 99,405 |
| 70–79 Years | 14,065,253 | 7,719,592 | 62,446 | 21,085 | 83,532 |
| ≥80 Years | 7,891,879 | 6,268,816 | 29,270 | 8145 | 37,415 |
| Total | 71,549,882 | 22,227,294 | 226,790 | 106,629 | 333,420 |
| Back Pain | |||||
| Males | |||||
| 50–59 Years | 15,686,707 | 1,740,053 | 35,669 | 1980 | 37,648 |
| 60–69 Years | 6,832,356 | 1,653,968 | 22,088 | 932 | 23,021 |
| 70–79 Years | 4,396,870 | 2,113,526 | 17,575 | 530 | 18,105 |
| ≥80 Years | 2,184,198 | 1,645,791 | 7424 | 194 | 7618 |
| Total | 29,100,131 | 7,153,338 | 82,756 | 3636 | 86,392 |
| Females | |||||
| 50–59 Years | 15,354,395 | 1,241,525 | 28,443 | 2126 | 30,569 |
| 60–69 Years | 8,568,148 | 1,788,250 | 26,819 | 1221 | 28,040 |
| 70–79 Years | 6,382,777 | 2,705,337 | 24,726 | 881 | 25,607 |
| ≥80 Years | 4,351,801 | 3,076,734 | 15,084 | 436 | 15,520 |
| Total | 34,657,121 | 8,811,846 | 95,072 | 4664 | 99,736 |
| Overall | |||||
| 50–59 Years | 31,041,102 | 2,981,578 | 64,644 | 4104 | 68,747 |
| 60–69 Years | 15,400,504 | 3,442,218 | 48,969 | 2151 | 51,120 |
| 70–79 Years | 10,779,647 | 4,818,863 | 42,198 | 1400 | 43,598 |
| ≥80 Years | 6,535,999 | 4,722,525 | 22,493 | 628 | 23,121 |
| Total | 63,757,252 | 15,965,184 | 178,304 | 8283 | 186,586 |
| Cancer | |||||
| Males | |||||
| 50–59 Years | 2,522,588 | 636,050 | 12,994 | 3863 | 16,857 |
| 60–69 Years | 3,755,041 | 1,213,733 | 17,078 | 6250 | 23,328 |
| 70–79 Years | 3,472,371 | 1,731,529 | 14,875 | 5443 | 20,318 |
| ≥80 Years | 1,618,157 | 1,236,842 | 5880 | 1854 | 7734 |
| Total | 11,368,157 | 4,818,154 | 50,827 | 17,410 | 68,237 |
| Females | |||||
| 50–59 Years | 3,700,463 | 591,564 | 13,619 | 6663 | 20,282 |
| 60–69 Years | 3,429,015 | 1,027,035 | 16,203 | 6220 | 22,423 |
| 70–79 Years | 3,072,482 | 1,655,490 | 15,535 | 5413 | 20,948 |
| ≥80 Years | 1,988,047 | 1385,791 | 7186 | 2690 | 9876 |
| Total | 12,190,007 | 4,659,880 | 52,543 | 20,986 | 73,529 |
| Overall | |||||
| 50–59 Years | 6,223,051 | 1,227,614 | 26,898 | 10,487 | 37,385 |
| 60–69 Years | 7,184,056 | 2,240,768 | 33,349 | 12,469 | 45,818 |
| 70–79 Years | 6544,853 | 3,387,019 | 30,372 | 10,862 | 41,234 |
| ≥80 Years | 3,606,204 | 2,622,633 | 13,055 | 4520 | 17,575 |
| Total | 23,558,164 | 9,478,034 | 103,674 | 38,338 | 142,012 |
| Chronic Obstructive Pulmonary Disease | |||||
| Males | |||||
| 50–59 Years | 2,580,113 | 632,447 | 12,445 | 316 | 12,762 |
| 60–69 Years | 2,591,636 | 986,541 | 13,276 | 324 | 13,600 |
| 70–79 Years | 2,108,494 | 1,366,288 | 11,661 | 208 | 11,869 |
| ≥80 Years | 1,039,325 | 830,476 | 4116 | 67 | 4182 |
| Total | 8,319,568 | 3,815,752 | 41,498 | 915 | 42,413 |
| Females | |||||
| 50–59 Years | 3,470,551 | 624,008 | 13,626 | 478 | 14,104 |
| 60–69 Years | 2,847,547 | 906,558 | 14,095 | 375 | 14,469 |
| 70–79 Years | 2,563,061 | 1,422,684 | 13,507 | 298 | 13,805 |
| ≥80 Years | 1,407,161 | 1,011,150 | 5312 | 112 | 5424 |
| Total | 10,288,320 | 3,964,400 | 46,540 | 1263 | 47,802 |
| Overall | |||||
| 50–59 Years | 6,050,664 | 1,256,455 | 26,209 | 792 | 27,001 |
| 60–69 Years | 5,439,183 | 1,893,099 | 27,426 | 697 | 28,124 |
| 70–79 Years | 4,671,555 | 2,788,972 | 25,102 | 501 | 25,604 |
| ≥80 Years | 2,446,486 | 1,841,626 | 9430 | 178 | 9608 |
| Total | 18,607,888 | 7,780,152 | 88,167 | 2168 | 90,337 |
| Congestive Heart Failure | |||||
| Males | |||||
| 50–59 Years | 901,813 | 309,556 | 6407 | 928 | 7335 |
| 60–69 Years | 1,093,609 | 452,061 | 6563 | 1020 | 7584 |
| 70–79 Years | 1,359,220 | 924,139 | 8239 | 1249 | 9487 |
| ≥80 Years | 956,151 | 794,466 | 3742 | 559 | 4301 |
| Total | 4,310,793 | 2,480,222 | 24,951 | 3756 | 28,707 |
| Females | |||||
| 50–59 Years | 783,103 | 218,141 | 5114 | 880 | 5994 |
| 60–69 Years | 1,004,064 | 434,919 | 7028 | 1083 | 8111 |
| 70–79 Years | 1,449,735 | 979,321 | 9791 | 1535 | 11,325 |
| ≥80 Years | 1,716,177 | 1,411,609 | 7293 | 1151 | 8444 |
| Total | 4,953,079 | 3,043,990 | 29,226 | 4649 | 33,874 |
| Overall | |||||
| 50–59 Years | 1,684,916 | 527,697 | 11,634 | 1813 | 13,447 |
| 60–69 Years | 2,097,673 | 886,980 | 13,590 | 2107 | 15,697 |
| 70–79 Years | 2,808,955 | 1,903,460 | 17,972 | 2772 | 20,744 |
| ≥80 Years | 2,672,328 | 2,206,075 | 11,033 | 1709 | 12,742 |
| Total | 9,263,872 | 5,524,212 | 54,229 | 8401 | 62,630 |
| Diabetes | |||||
| Males | |||||
| 50–59 Years | 6,357,757 | 1,136,872 | 22,201 | 652 | 22,853 |
| 60–69 Years | 5,109,121 | 1,327,408 | 17,770 | 535 | 18,305 |
| 70–79 Years | 3,110,939 | 1,702,148 | 13,938 | 291 | 14,229 |
| ≥80 Years | 1,111,108 | 743,942 | 3546 | 73 | 3619 |
| Total | 15,688,925 | 4,910,370 | 57,455 | 1551 | 59,006 |
| Females | |||||
| 50–59 Years | 5,545,897 | 856,217 | 18,801 | 635 | 19,436 |
| 60–69 Years | 4,846,946 | 1,185,951 | 17,734 | 543 | 18,276 |
| 70–79 Years | 3,287,663 | 1,603,639 | 14,515 | 340 | 14,855 |
| ≥80 Years | 1,588,280 | 1,035,687 | 5430 | 104 | 5534 |
| Total | 15,268,786 | 4,681,494 | 56,480 | 1622 | 58,101 |
| Overall | |||||
| 50–59 Years | 11,903,654 | 1,993,089 | 41,352 | 1292 | 42,644 |
| 60–69 Years | 9,956,067 | 2,513,359 | 35,588 | 1078 | 36,666 |
| 70–79 Years | 6,398,602 | 3,305,787 | 28,432 | 629 | 29,061 |
| ≥80 Years | 2,699,388 | 1,779,629 | 8986 | 177 | 9163 |
| Total | 30,957,711 | 9,591,864 | 114,358 | 3176 | 117,534 |
| Fractured Hip | |||||
| Males | |||||
| 50–59 Years | 0 | 0 | – | – | – |
| 60–69 Years | 146,403 | 41,458 | 554 | 39 | 593 |
| 70–79 Years | 380,325 | 226,413 | 1969 | 118 | 2087 |
| ≥80 Years | 441,705 | 287,456 | 1343 | 70 | 1412 |
| Total | 968,433 | 555,327 | 3866 | 227 | 4092 |
| Females | |||||
| 50–59 Years | 0 | 0 | – | – | – |
| 60–69 Years | 324,722 | 115,798 | 1791 | 88 | 1879 |
| 70–79 Years | 894,606 | 501,588 | 4931 | 267 | 5198 |
| ≥80 Years | 1,814,079 | 1,272,571 | 6168 | 376 | 6544 |
| Total | 3,033,407 | 1,889,957 | 12,890 | 731 | 13,621 |
| Overall | |||||
| 50–59 Years | 0 | 0 | – | – | – |
| 60–69 Years | 471,125 | 157,256 | 2324 | 127 | 2451 |
| 70–79 Years | 1,274,931 | 728,001 | 6868 | 386 | 7254 |
| ≥80 Years | 2,255,784 | 1,560,027 | 7509 | 446 | 7955 |
| Total | 4,001,840 | 2,445,284 | 16,701 | 959 | 17,660 |
| Hypertension | |||||
| Males | |||||
| 50–59 Years | 17,589,184 | 2,219,853 | 43,583 | 30,454 | 74,037 |
| 60–69 Years | 10,044,721 | 2,652,896 | 34,384 | 18,925 | 53,310 |
| 70–79 Years | 6,329,398 | 3,587,473 | 27,980 | 10,942 | 38,922 |
| ≥80 Years | 2,551,064 | 1,933,743 | 8767 | 3018 | 11,786 |
| Total | 36,514,367 | 10,393,965 | 114,714 | 63,339 | 178,055 |
| Females | |||||
| 50–59 Years | 15,159,062 | 1,560,757 | 34,321 | 28,232 | 62,554 |
| 60–69 Years | 10,942,927 | 2,570,377 | 37,670 | 21,718 | 59,388 |
| 70–79 Years | 8,588,794 | 4,388,589 | 36,871 | 16,804 | 53,674 |
| ≥80 Years | 5,024,558 | 3,838,927 | 18,314 | 6864 | 25,178 |
| Total | 39,715,341 | 12,358,650 | 127,176 | 73,618 | 200,794 |
| Overall | |||||
| 50–59 Years | 32,748,246 | 3,780,610 | 77,904 | 58,686 | 136,591 |
| 60–69 Years | 20,987,648 | 5,223,273 | 72,054 | 40,643 | 112,698 |
| 70–79 Years | 14,918,192 | 7,976,062 | 64,851 | 27,746 | 92,596 |
| ≥80 Years | 7,575,622 | 5,772,670 | 27,081 | 9882 | 36,964 |
| Total | 76,229,708 | 22,752,615 | 241,890 | 136,957 | 378,849 |
| Myocardial Infarction | |||||
| Males | |||||
| 50–59 Years | 1,477,509 | 311,855 | 6054 | 4451 | 10,505 |
| 60–69 Years | 1,472,041 | 555,368 | 7866 | 3466 | 11,332 |
| 70–79 Years | 1,322,100 | 781,906 | 6584 | 3304 | 9888 |
| ≥80 Years | 844,074 | 721,969 | 3578 | 1385 | 4963 |
| Total | 5,115,724 | 2,371,098 | 24,082 | 12,606 | 36,688 |
| Females | |||||
| 50–59 Years | 648,934 | 147,456 | 3181 | 2242 | 5422 |
| 60–69 Years | 850,883 | 350,042 | 5548 | 2080 | 7628 |
| 70–79 Years | 1,021,117 | 656,615 | 6217 | 2686 | 8903 |
| ≥80 Years | 999,380 | 803,335 | 4090 | 1811 | 5902 |
| Total | 3,520,314 | 1,957,448 | 19,036 | 8819 | 27,855 |
| Overall | |||||
| 50–59 Years | 2126,443 | 459,311 | 9333 | 6800 | 16,133 |
| 60–69 Years | 2,322,924 | 905,410 | 13,392 | 5548 | 18,940 |
| 70–79 Years | 2,343,217 | 1,438,521 | 12,783 | 5993 | 18,776 |
| ≥80 Years | 1,843,454 | 1,525,304 | 7669 | 3193 | 10,861 |
| Total | 8,636,038 | 4,328,546 | 43,177 | 21,534 | 64,710 |
| Stroke | |||||
| Males | |||||
| 50–59 Years | 1,566,132 | 450,841 | 8890 | 2850 | 11,739 |
| 60–69 Years | 1,849,572 | 736,604 | 10,615 | 2581 | 13,195 |
| 70–79 Years | 2,200,265 | 1,326,626 | 10,864 | 3351 | 14,215 |
| ≥80 Years | 1,464,604 | 1,019,878 | 4668 | 1380 | 6048 |
| Total | 7,080,573 | 3,533,949 | 35,037 | 10,162 | 45,197 |
| Females | |||||
| 50–59 Years | 1,257,018 | 250,971 | 5758 | 1891 | 7648 |
| 60–69 Years | 1,644,126 | 581,634 | 9217 | 2658 | 11,875 |
| 70–79 Years | 2,222,147 | 1,289,628 | 12,337 | 3357 | 15,694 |
| ≥80 Years | 2,782,176 | 2,064,287 | 10,575 | 2794 | 13,370 |
| Total | 7,905,467 | 4,186,520 | 37,887 | 10,700 | 48,587 |
| Overall | |||||
| 50–59 Years | 2,823,150 | 701,812 | 14,901 | 4718 | 19,619 |
| 60–69 Years | 3,493,698 | 1,318,238 | 19,853 | 5224 | 25,077 |
| 70–79 Years | 4,422,412 | 2,616,254 | 23,174 | 6709 | 29,883 |
| ≥80 Years | 4,246,780 | 3,084,165 | 15,239 | 4178 | 19,417 |
| Total | 14,986,040 | 7,720,469 | 73,167 | 20,829 | 93,996 |
Note: DALYs Disability-Adjusted Life Years, YLDs Years Lived with Disease, YLLs Years of Life Lost
Discussion
The principal findings of this investigation revealed that over 1-million years of healthy life were lost for middle-aged and older Americans from the 10 health conditions evaluated over the 16 year study period. Although aging adults were impacted by each health condition, hypertension accounted for the greatest burden; whereas, hip fractures had the lowest number of DALYs. These results were similar when evaluating the DALY estimates for each of the health conditions by sex. Our findings should be used to inform healthcare providers and interventions seeking to prevent morbidity and extend life expectancy in aging adults. Using DALYs to guide healthcare policy will also help to improve quality of life during aging through continued evolutions of disease prevention and treatment.
The Global Burden of Disease studies have identified hypertension as the leading risk factor by attributable disease burden [17]. The prevalence of hypertension increases with age, and is highest in older adults [18]. Of the ten health conditions evaluated in this investigation, hypertension had both the highest number of cases and DALYs. Likewise, those with hypertension had a large amount of YLDs, thereby indicating middle-aged and older adults are living with this disease for long periods of time after diagnosis. The large number of years lived with hypertension can be attributed to the evolution and adherence to hypertension medications [19, 20]. Like all medications, persons considering usage of promising hypertension medications should have discussions with a healthcare provider, and other non-pharmacological modes of treatment and prevention such as engaging in healthy behaviors remains a critical factor for reducing hypertension [18, 21]. Like hypertension, participants indicating they had arthritis or rheumatism also lived with this health condition for long periods of time after diagnosis as demonstrated by the large number of YLDs. These results align with another investigation that revealed rheumatoid arthritis causes significant YLDs and high overall disease burden [22]. It is projected that as smoking rates decline, the number of healthy years of life lost from rheumatoid arthritis will also decrease [22]. Future studies monitoring DALYs for arthritis in middle-aged and older adults are needed to confirm such projections and assess if arthritis medications lower the burden of arthritis in aging adults.
Back pain is generally a prevalent health condition all adults experience as they age and pain management is often challenging [23]. The health implications of back pain are also pronounced, as the Global Burden of Disease project demonstrated that back pain has a large burden in the United States, and is relatively lower in Asian countries [24, 25]. Although our results also suggest the burden of back pain is high for middle-aged and older adults in the United States, our findings for YLDs are lower compared to those of other similar investigations [24, 25]. We believe that this result is attributed to participants reporting back pain before entering the HRS, as indicated by the large number of cases for those aged 50–59 years. Cancer is also a leading cause of morbidity and mortality in older adults [26]. The rise of cancer rates for the older adult population in the United States is projected to increase, thereby posing challenges to healthcare systems and cancer patients [27]. Our results show that the burden of cancer in aging adults is high. Future investigations should continue monitoring DALYs for cancer and specific cancer types in aging adults to assess advancements in cancer treatment, care, and prevention.
About 33% of adults aged at least 65 years in the United States have diabetes and older adults with diabetes are at an elevated risk for mortality than those without diabetes [28]. According to the Global Burden of Disease, diabetes is a leading cause of DALYs in the United States [29], and men are more frequently diagnosed with diabetes than women at younger ages [30]. Our findings indicate the number of diabetes cases were higher in men than women, particularly at ages 50–59 and 60–69 years, which may explain why the burden of diabetes was higher for men than women. While our DALY estimates for diabetes were large, other countries in the Global Burden of Disease, such as Mexico, may have a higher burden from diabetes [25]. Similarly, our results revealed the number myocardial infarction cases and DALYs from this health condition were higher in men compared to women. These results align with another investigation that suggests the prevalence of myocardial infarctions is higher in men than women [31].
Stroke is a leading cause of disability and death for aging adults that is also responsible for billions of dollars in healthcare costs [32]. Persons that sustain a stroke have reduced mobility and are at an increased risk of experiencing another stroke [33]. Therefore, it is not unusual that the burden of stroke has remained high in the United States and globally [24, 25]. Our DALY results for stroke also indicate many healthy years of life lost in middle-aged and older adults. Although advancements in COPD prevention and treatment have been made [34], COPD remains a leading cause of death [35], and the Global Burden of Disease suggests COPD has a tremendous disease burden in the United States [29]. Given that COPD is progressive, persons living with this disease have a large amount of health-related costs [36]. While our findings indicate that the burden of COPD is already high, the burden of COPD is projected to increase [37]. As smoking cessation remains important for preventing and limiting the health effects of COPD, the burden of DALYs should continue to be monitored for helping to inform COPD treatments.
Heart failure is a worldwide health problem that is linked to high morbidity, mortality, and costs of care [38]. As the older adult population increases, the prevalence of heart diseases such as congestive heart failure has also risen [39]. Our results indicating the high burden of congestive heart failure are similar to those of other investigations evaluating DALYs [40]. Although hip fractures are common during aging, the incidence of hip fractures and mortality rates associated with hip fractures have declined in the United States [41, 42]. Another study evaluating DALYs for hip fractures determined that over 200,000 years of healthy life were lost from hip fractures in older adults [43]. While the burden of hip fractures was lowest of the ten health conditions for this investigation, prevention and treatment for hip fractures should remain a priority for aging adults.
Some limitations should be noted. Those who were lost from follow-up or died may have had a health condition that was not recorded before this event, thereby creating underestimations for our results. Moreover, the date of interview served as a proxy for diagnosis date, thereby allowing our results to be further underestimated. The use of an incidence-driven DALY calculation allowed us to determine how the burden of specific health conditions impacted middle-aged and older adults longitudinally; however, we were unable to control for multimorbiditiy in our disability weights. It is also possible that participants may have disputed their records for having a diagnosis or were no longer living with a health condition after initial diagnosis. Self-report biases may have occurred for participant responses. The HRS only includes adults aged 50 years and over; therefore, some participants may have had health conditions at younger ages before entering the study. Statistical tests of inference were not used for making comparisons between DALY estimates because DALYs are often used as a stand-alone statistic.
Likewise, our DALY estimates were influenced by cases, and YLD does not confirm that quality of life was compromised. Future investigations should examine the impact of a health condition on YLD because a smaller YLD may imply that a health condition exacerbates time to death; whereas, a larger YLD may suggest treatment and management of a health condition delays early mortality (depending on age of diagnosis and other important factors). As such, social and policy concerns for aging adults including living arrangements, finances, completion of autonomous living and basic self-care tasks, and care giving should be considered based on disease and health status. Comparing our findings with those of other burden of disease investigations performed in the United States and globally will be helpful for making comparisons across populations and diseases [44]. Moreover, expanding parts of the DALY calculation to other important health outcomes during aging and examining prevalence-based DALYs will help to advance our understanding of health burden.
Conclusions
The burden of the health conditions evaluated for this investigation accounted for over a million years of healthy life lost for middle-aged and older Americans during the study period. Overall, participants experienced different levels of non-fatal health loss and early mortality for each health condition. These results should be used to help improve the efficiency and effectiveness of disease prevention and treatment strategies for aging adults. Trends in DALYs should continue to be monitored for middle-aged and older adults so that health-related policies and resources match DALY trends, and for informing healthcare providers so they can accommodate the health needs of the growing aging population in the United States. Encouraging healthcare providers to continue evolving prevention, treatment, and early detection for disease, and healthcare policy makers to invest in promising solutions will help to reduce health-related costs, improve quality of life, and extend life expectancy for the aging adults in the United States.
Additional file
Table S1. Example Interviewer Questions for Each Health Condition (DOCX 13 kb)
Acknowledgements
Not applicable.
Funding
This study was funded by a grant (P2CHD065702) from the National Institutes of Health – National Institute of Child Health and Human Development (National Center for Medical Rehabilitation Research), the National Institute for Neurological Disorders and Stroke, and the National Institute of Biomedical Imaging and Bioengineering. Funds were utilized for all aspects of the manuscript including design of the study, statistical analyses, and dissemination.
Availability of data and materials
Data from the Health and Retirement Study are publicly available online (https://hrs.isr.umich.edu/data-products).
Abbreviations
- COPD
Chronic Obstructive Pulmonary Disease
- DALY
Disability-Adjusted Life Year
- HRS
Health and Retirement Study
- YLD
Years Lived with Disease
- YLL
Years of Life Lost
Authors’ contributions
RM conceived and designed the study, participated in statistical analyses, and wrote the manuscript. SAS conceived and designed the study, participated in statistical analyses, and revised the manuscript. KM conceived and designed the study, and revised the manuscript. OH conceived the study and revised the manuscript. MP conceived and designed the study, and revised the manuscript. All authors have read and approved the manuscript.
Ethics approval and consent to participate
Not applicable.
Consent for publication
Not applicable.
Competing interests
The authors have no conflicts of interest to disclose.
Publisher’s Note
Springer Nature remains neutral with regard to jurisdictional claims in published maps and institutional affiliations.
Contributor Information
Ryan McGrath, Email: ryan.mcgrath@ndsu.edu.
Soham Al Snih, Email: soalsnih@utmb.edu.
Kyriakos Markides, Email: kmarkide@utmb.edu.
Orman Hall, Email: ohall@med.umich.edu.
Mark Peterson, Email: mdpeterz@med.umich.edu.
References
- 1.Niccoli T, Partridge L. Ageing as a risk factor for disease. Curr Biol. 2012;22:R741–R752. doi: 10.1016/j.cub.2012.07.024. [DOI] [PubMed] [Google Scholar]
- 2.Ward BW, Schiller JS, Goodman RA. Multiple chronic conditions among US adults: a 2012 update. Prev Chronic Dis. 2014;11:E62. doi: 10.5888/pcd11.130389. [DOI] [PMC free article] [PubMed] [Google Scholar]
- 3.The World Bank . Life Expectancy at Birth, Total (Years) 2019. [Google Scholar]
- 4.Colby SL, Ortman JM. Projections of the size and composition of the US population: 2014 to 2060. Curr Popul Rep. 2015:P25–1143.
- 5.Office of Disease Prevention and Health Promotion. Healthy People 2020. https://www.healthypeople.gov/2020/topics-objectives/topic/older-adults. Accessed 21 Aug 2018.
- 6.Grosse SD, Lollar DJ, Campbell VA, Chamie M. Disability and disability-adjusted life years: not the same. Public Health Rep. 2009;124:197–202. doi: 10.1177/003335490912400206. [DOI] [PMC free article] [PubMed] [Google Scholar]
- 7.IHME. Global Burden of Disease (GBD). http://www.healthdata.org/gbd. Accessed 1 Mar 2019.
- 8.Fox-Rushby J. Disability-adjusted life years (DALYs) for decision-making?: an overview of the literature. London: BSC Print Ltd; 2002. [Google Scholar]
- 9.Karp F. Growing older in America: The health & retirement study: National Institutes of Health. 2007. [Google Scholar]
- 10.Sonnega A, Faul JD, Ofstedal MB, Langa KM, Phillips JW, Weir DR. Cohort profile: the health and retirement study (HRS) Int J Epidemiol. 2014;43:576–585. doi: 10.1093/ije/dyu067. [DOI] [PMC free article] [PubMed] [Google Scholar]
- 11.Health and Retirement Study. HRS Data Book. https://hrs.isr.umich.edu/about/data-book. Accessed 21 Aug 2018.
- 12.Salomon JA, Haagsma JA, Davis A, de Noordhout CM, Polinder S, Havelaar AH, Cassini A, Devleesschauwer B, Kretzschmar M, Speybroeck N. Disability weights for the global burden of disease 2013 study. Lancet Glob Health. 2015;3:e712–e723. doi: 10.1016/S2214-109X(15)00069-8. [DOI] [PubMed] [Google Scholar]
- 13.World Health Organiation. Global Burden of Disease 2004 Update: Disability Weights for Diseases and Conditions 2004. http://www.who.int/healthinfo/global_burden_disease/GBD2004_DisabilityWeights.pdf. Accessed 21 Aug 2018.
- 14.World Heatlh Organization. Metrics: Disability-Adjusted Life year (DALY). http://www.who.int/healthinfo/global_burden_disease/metrics_daly/en/. Accessed 21 Aug 2018.
- 15.Struijk EA, May AM, Beulens JW, de Wit GA, Boer JM, Onland-Moret NC, van der Schouw YT, Bueno-de-Mesquita HB, Hoekstra J, Peeters PH. Development of methodology for disability-adjusted life years (DALYs) calculation based on real-life data. PLoS One. 2013;8:e74294. doi: 10.1371/journal.pone.0074294. [DOI] [PMC free article] [PubMed] [Google Scholar]
- 16.United States Social Security Administration. Period Life Table. 2014. https://www.ssa.gov/oact/STATS/table4c6_2014.html. Accessed 21 Aug 2018.
- 17.Lim SS, Vos T, Flaxman AD, Danaei G, Shibuya K, Adair-Rohani H, AlMazroa MA, Amann M, Anderson HR, Andrews KG. A comparative risk assessment of burden of disease and injury attributable to 67 risk factors and risk factor clusters in 21 regions, 1990–2010: a systematic analysis for the global burden of disease study 2010. Lancet. 2012;380:2224–2260. doi: 10.1016/S0140-6736(12)61766-8. [DOI] [PMC free article] [PubMed] [Google Scholar]
- 18.Lionakis N, Mendrinos D, Sanidas E, Favatas G, Georgopoulou M. Hypertension in the elderly. World J Cardiol. 2012;4:135–147. doi: 10.4330/wjc.v4.i5.135. [DOI] [PMC free article] [PubMed] [Google Scholar]
- 19.Thomopoulos C, Parati G, Zanchetti AJ. Effects of blood pressure-lowering treatment on cardiovascular outcomes and mortality: 14–effects of different classes of antihypertensive drugs in older and younger patients overview and meta-analysis. J Hypertens. 2018;36:1637–1647. doi: 10.1097/HJH.0000000000001777. [DOI] [PubMed] [Google Scholar]
- 20.Kim S, Shin DW, Yun JM, Hwang Y, Park SK, Ko Y-J, Cho B. Medication adherence and the risk of cardiovascular mortality and hospitalization among patients with newly prescribed antihypertensive medications. Hypertension. 2016;67:506–512. doi: 10.1161/HYPERTENSIONAHA.115.06731. [DOI] [PubMed] [Google Scholar]
- 21.Frieden TR, Jaffe MG. Saving 100 million lives by improving global treatment of hypertension and reducing cardiovascular disease risk factors. J Clin Hypertens. 2018;20:208–211. doi: 10.1111/jch.13195. [DOI] [PMC free article] [PubMed] [Google Scholar]
- 22.Cross M, Smith E, Hoy D, Carmona L, Wolfe F, Vos T, Williams B, Gabriel S, Lassere M, Johns N. The global burden of rheumatoid arthritis: estimates from the global burden of disease 2010 study. Ann Rheum Dis. 2014;73:1316–1322. doi: 10.1136/annrheumdis-2013-204627. [DOI] [PubMed] [Google Scholar]
- 23.Wong AY, Karppinen J, Samartzis D. Low back pain in older adults: risk factors, management options and future directions. Scoliosis Spinal Disord. 2017;12:14. doi: 10.1186/s13013-017-0121-3. [DOI] [PMC free article] [PubMed] [Google Scholar]
- 24.Murray CJ, Abraham J, Ali MK, Alvarado M, Atkinson C, Baddour LM, Bartels DH, Benjamin EJ, Bhalla K, Birbeck G. The state of US health, 1990-2010: burden of diseases, injuries, and risk factors. JAMA. 2013;310:591–606. doi: 10.1001/jama.2013.13805. [DOI] [PMC free article] [PubMed] [Google Scholar]
- 25.GBD 2016 Disease and Injury Incidence and Prevalence Collaborators Global, regional, and national incidence, prevalence, and years lived with disability for 328 diseases and injuries for 195 countries, 1990–2016: a systematic analysis for the Global Burden of Disease Study 2016. Lancet. 2017;390:1211–1259. doi: 10.1016/S0140-6736(17)32154-2. [DOI] [PMC free article] [PubMed] [Google Scholar]
- 26.Cinar D, Tas D. Cancer in the elderly. N Clin Istanb. 2015;2:73–80. doi: 10.14744/nci.2015.72691. [DOI] [PMC free article] [PubMed] [Google Scholar]
- 27.Berger NA, Savvides P, Koroukian SM, Kahana EF, Deimling GT, Rose JH, Bowman KF, Miller RH. Cancer in the elderly. Trans Am Clin Climatol Assoc. 2006;117:147–155. [PMC free article] [PubMed] [Google Scholar]
- 28.Kirkman MS, Briscoe VJ, Clark N, Florez H, Haas LB, Halter JB, Huang ES, Korytkowski MT, Munshi MN, Odegard PS. Diabetes in older adults. Diabetes Care. 2012;35:2650–2664. doi: 10.2337/dc12-1801. [DOI] [PMC free article] [PubMed] [Google Scholar]
- 29.Mokdad AH, Ballestros K, Echko M, Glenn S, Olsen HE, Mullany E, Lee A, Khan AR, Ahmadi A, Ferrari AJ. The state of US health, 1990-2016: burden of diseases, injuries, and risk factors among US states. JAMA. 2018;319:1444–1472. doi: 10.1001/jama.2018.0158. [DOI] [PMC free article] [PubMed] [Google Scholar]
- 30.Kautzky-Willer A, Harreiter J, Pacini G. Sex and gender differences in risk, pathophysiology and complications of type 2 diabetes mellitus. Endocr Rev. 2016;37:278–316. doi: 10.1210/er.2015-1137. [DOI] [PMC free article] [PubMed] [Google Scholar]
- 31.Mozaffarian D, Benjamin EJ, Go AS, Arnett DK, Blaha MJ, Cushman M, De Ferranti S, Després J-P, Fullerton HJ, Howard VJ. Heart disease and stroke statistics—2015 update: a report from the American Heart Association. Circulation. 2015;131:e29–e322. doi: 10.1161/CIR.0000000000000152. [DOI] [PubMed] [Google Scholar]
- 32.Di Carlo A. Human and economic burden of stroke. Age Ageing. 2009;38:4–5. doi: 10.1093/ageing/afn282. [DOI] [PubMed] [Google Scholar]
- 33.Benjamin EJ, Blaha MJ, Chiuve SE, Cushman M, Das SR, Deo R, Floyd J, Fornage M, Gillespie C, Isasi C. Heart disease and stroke statistics-2017 update: a report from the American Heart Association. Circulation. 2017;135:e146–e603. doi: 10.1161/CIR.0000000000000485. [DOI] [PMC free article] [PubMed] [Google Scholar]
- 34.American Lung Association . Trends in COPD (chronic bronchitis and emphysema): Morbidity and mortality. 2013. [Google Scholar]
- 35.Quaderi SA, Hurst JR. The unmet global burden of COPD. Glob Health Epidemiol Genom. 2018;3:e4. [DOI] [PMC free article] [PubMed]
- 36.May SM, Li JT. Burden of chronic obstructive pulmonary disease: healthcare costs and beyond. Allergy Asthma Proc. 2015;36:4–10. doi: 10.2500/aap.2015.36.3812. [DOI] [PMC free article] [PubMed] [Google Scholar]
- 37.Mathers CD, Loncar D. Projections of global mortality and burden of disease from 2002 to 2030. PLoS Med. 2006;3:e442. doi: 10.1371/journal.pmed.0030442. [DOI] [PMC free article] [PubMed] [Google Scholar]
- 38.Diez-Villanueva P, Alfonso F. Heart failure in the elderly. J Geriatr Cardiol. 2016;13:115–117. doi: 10.11909/j.issn.1671-5411.2016.02.009. [DOI] [PMC free article] [PubMed] [Google Scholar]
- 39.Bundkirchen A, Schwinger RH. Epidemiology and economic burden of chronic heart failure. Eur Heart J Suppl. 2004;6:D57–D60. doi: 10.1016/j.ehjsup.2004.05.015. [DOI] [Google Scholar]
- 40.Salem K, ElKhateeb O. Gender-adjusted and age-adjusted economic inpatient burden of congestive heart failure: cost and disability-adjusted life-year analysis. ESC Heart Fail. 2017;4:259–265. doi: 10.1002/ehf2.12156. [DOI] [PMC free article] [PubMed] [Google Scholar]
- 41.Brauer CA, Coca-Perraillon M, Cutler DM, Rosen AB. Incidence and mortality of hip fractures in the United States. JAMA. 2009;302:1573–1579. doi: 10.1001/jama.2009.1462. [DOI] [PMC free article] [PubMed] [Google Scholar]
- 42.Stevens JA, Anne RR. Declining hip fracture rates in the United States. Age Ageing. 2010;39:500–503. doi: 10.1093/ageing/afq044. [DOI] [PubMed] [Google Scholar]
- 43.Dyer SM, Crotty M, Fairhall N, Magaziner J, Beaupre LA, Cameron ID, Sherrington C. A critical review of the long-term disability outcomes following hip fracture. BMC Geriatr. 2016;16:158. doi: 10.1186/s12877-016-0332-0. [DOI] [PMC free article] [PubMed] [Google Scholar]
- 44.Global Health Data Exchange. 2019. http://ghdx.healthdata.org/. Accessed 31 Jan 2019.
Associated Data
This section collects any data citations, data availability statements, or supplementary materials included in this article.
Supplementary Materials
Table S1. Example Interviewer Questions for Each Health Condition (DOCX 13 kb)
Data Availability Statement
Data from the Health and Retirement Study are publicly available online (https://hrs.isr.umich.edu/data-products).