

Abstract
Pathogenesis of mycobacterial infection has been extensively studied determining the fundamental role of host immunocompetence in disease progression. Cellular adaptive immunity, in particular CD4+ cells, has shown to be crucial in the host defence. A role of cytotoxic lymphocytes and humoral immunity has also been established. However, few studies have been performed in low endemic countries on immunological correlates of tuberculosis in paediatric patients. The present study aims to fill this gap analysing the distribution and the absolute values of the main lymphocyte subpopulations (CD3+, CD4+, CD8+, CD19+ and CD16+/CD56+) in the different stages of tubercular infection in human immunodeficiency virus–negative children living in low tubercular endemic countries. Results obtained in children with latent tuberculosis, active tuberculosis and healthy controls were compared. Moreover, quantitative analysis of interferon-γ levels of mitogen-induced response was carried out within the different study groups. The aim of this analysis was to enforce the comprehension of immune modifications subsequent to Mycobacterium tuberculosis infection. The major finding of our study was CD3+ and CD4+ absolute and percentage depletion in children with active tuberculosis versus healthy controls. Moreover, severe forms of active tuberculosis showed a marked reduction in the CD4+ percentage in the context of a systemic impairment which affects globally the absolute count of all peripheral lymphocyte subsets tested. A relative increase of natural killer cells was proved in infected patients, whereas no differences in B cells among the study groups were detected. Mitogen-induced interferon-γ levels were significantly higher in children with latent tuberculosis when compared to active tuberculosis and healthy controls, demonstrating effective immune activation in those patients able to control the infection.
Keywords: CD4+, interferon, lymphocyte subsets, paediatric, tuberculosis
Introduction
Tuberculosis (TB) ranks among the top 10 causes of death worldwide in 2016, with approximately 1.3 million deaths and 10.4 million incident cases.1 Almost 1 million of new TB cases occurs among children.1
Pathogenesis of mycobacterial infection has been extensively studied determining the fundamental role of host immunocompetence in the disease progression. Cellular adaptive immunity, in particular T-cells, has shown to be crucial on animal and human models.2–4 Moreover, the ongoing TB burden among human immunodeficiency virus (HIV)–infected/CD4-depleted people is the main evidence of the pivotal role of those cells in TB disease.1 CD4+ Th1 cells are considered the mainstay of protection against Mycobacterium tuberculosis.4,5 Traditionally, this role was considered to be exerted mostly by producing interferon (IFN)-γ and activating macrophages.6 However, more recent models have shown that CD4+ may have a role per se, irrespectively of IFN-γ production4 which can efficiently arise from other lymphocyte populations like γδ-T-cells.7,8 In fact, studies on mice and human models showed that CD4+ T-cells depletion induces disease while leaving unchanged IFN-γ lungs levels, whereas IFN-γ deficiency without CD4+ T-cells depletion still allows protection.4 Moreover, in the context of adaptive immunity, a role of cytotoxic lymphocytes and humoral immunity has also been shown.9,10
The first studies correlating the clinical evidence of CD4+ lymphopenia and Mycobacterium tuberculosis infection in HIV-negative patients date back to the mid-1980s.11–13 Since then, lymphocyte subset modification has been widely studied in relation to different stages of the disease and response to treatment.14–27 At present, literature shows quite a constant correlation between CD4+ lymphopenia and TB infection. However, data are contrasting about whether the depletion is referred to the absolute number in the context of a general CD3+ lymphopenia or referred to the proportion of CD4+ cells.17,20,21,24 Moreover, data about modifications regarding total number of T-cells, CD8+, B and natural killer (NK) cells are conflictual.13,16,18,19,22,23,27
In the present study, the distribution of lymphocyte subpopulations in the different stages of tubercular infection was analysed in HIV-negative children living in a low TB endemic country. The comparison of the above-mentioned values was carried out among patients with latent TB infection (LTBI), active TB (ATB) and healthy controls (HC). The aim of this analysis was to enforce the comprehension of immune modifications subsequent to Mycobacterium tuberculosis infection.
Methods
Study population
The study involved all HIV-negative children aged less than 18 years, assessed for TB between 1 January 2009 and 31 December 2016 at Anna Meyer Children’s University Hospital, Florence, Italy, for whom lymphocyte subsets were available. In particular, lymphocyte subsets were considered if performed between 3 months before and a month after the beginning of anti-tubercular treatment (if applicable). We reviewed records of children diagnosed with ATB, LTBI and HC. Data were recorded retrospectively from 2009 to 2014, and then prospectively. Irrespective of data collection method, the study design can be considered cross-sectional.
The following data were inserted in the study database: demographic characteristics, diagnosis, medications, lymphocyte subsets, interferon-gamma release assay (IGRA) and tuberculin skin test (TST). All results were collected anonymously and recorded following the international standards for the protection of privacy and personal information.
Definitions
HC were defined as immigrated/adopted children negative at the TB screening or children investigated for suspect or confirmed TB contact, in whom TST and IGRA were negative at the end of the window period.
LTBI was diagnosed in children with a positive TST and/or IGRA, without clinical or radiological signs of active disease.28
ATB was defined as the presence of at least one clinical specimen (sputum, gastric aspirate/lavage or other biologic samples) positive for Mycobacterium tuberculosis on culture, microscopy or nucleic acid amplification. An ATB diagnosis was also assigned to children with radiological and clinical findings consistent with ATB and with either exposure to a known TB case or with a positive TST and/or IGRA.28 No universally accepted definition of severe ATB (SATB) is available in literature, so we considered those forms severe, within the ATB group, which showed miliary spread, central nervous system (CNS) involvement or complicated pulmonary features designed as extensive cavitations, endobronchial localization or massive pleural effusion.
A positive TST was defined as an induration of 5 mm or greater in children with a suspected or confirmed TB contact or in children suspected to have TB or who are receiving immunosuppressive therapy. An induration of 10 mm or greater was considered positive in children younger than age 4 or in children with likely exposure to the TB disease. TST was defined positive with an induration of 15 mm or greater in children age 4 or older without any risk factors.28
The IGRA performed was the QuantiFERON-TB Gold In-Tube (QFT-G-IT, Cellestis, Victoria, Australia). The detection of IFN-γ by enzyme-linked immunosorbent assay (ELISA) was used to identify in vitro responses to peptide antigens associated with Mycobacterium tuberculosis infection (ESAT-6, CFP-10 and TB7.7). QFT-G-IT was considered positive when the concentration of the IFN-γ after stimulation with Mycobacterium tuberculosis antigens was ⩾0.35 IU/mL.
Lymphocyte subset analysis
Peripheral blood samples were collected aseptically by venipuncture into ethylenediamine tetraacetic acid (EDTA) collection tubes from all subjects of the study population for the quantification of the main lymphocyte subsets (CD3+, CD4+, CD8+, CD19+ and CD16+/CD56+). A minimum of 100 µL of whole blood, required for the procedure, was stained within 24 h of draw and analysed within 6 h of staining using BD Trucount™ tubes. Multitest™ 6-colour TBNK reagent (BD Biosciences, San Jose, CA, USA) was used for immunophenotypic analysis according to the manufacturer’s instructions. The above-mentioned reagent contains the following fluorescent conjugated monoclonal antibodies, specific for cell surface markers: anti-CD3-FITC, anti-CD16-PE, anti-CD56-PE, anti-CD45-PerCP-Cy™5.5, anti-CD4-PE-Cy™7, anti-CD19-APC and anti-CD8-APC-Cy7. Analysis was performed using a FACS Canto II flow cytometer and FACS Diva software (BD Biosciences). For each analysis, whole blood was incubated with directly conjugated fluorescent monoclonal antibodies for 30 min in the dark at room temperature, then red cells were lysed using NH4Cl solution obtained from BD Pharm Lyse™ lysing solution (pH range: 7.1–7.4). The samples were acquired immediately after lysis, and for each test, 10,000 events were recorded. Each lymphocyte subpopulation count was expressed in absolute value and as a percentage of total lymphocytes. The total lymphocyte frequency in the analysis gate met quality requirements only when greater than 95%.
Statistical analysis
Statistical analysis was performed using SPSS (Version 25.0, SPSS, Inc., Chicago, IL, USA). Metric data were tested for normal distribution. Continuous variables were expressed as median values and interquartile ranges (IQRs). Mann–Whitney U test was used to compare variables between groups. The chi-square test or Fisher’s test was performed when appropriate. P < 0.05 was considered statistically significant.
Results
Demographic and clinical data of study population
A total of 121 children under 18 years of age were enrolled. The median age was 71.9 (27.6–120.8) months. Forty-five of them (37.2%) were diagnosed with ATB, 25 of them (20.7%) with LTBI and 51 (42.1%) were HC. Demographic and clinical data are shown in Table 1.
Table 1.
Demographic and clinical data of the study populations.
| ATB (n = 45) | LTBI (n = 25) | HC (n = 51) | Total (n = 121) | ||
|---|---|---|---|---|---|
| Median age in months; IQR | 86.06; 26.13–166.98 | 107.1; 52–157.08 | 50.46; 24.03–90.43 | 71.9; 27.6–120.85 | |
| Gender | Male | 23 (51.1%) | 13 (52.0%) | 26 (50.9%) | 62 (51.2%) |
| Female | 22 (49.9%) | 12 (48.0%) | 25 (49.1%) | 59 (48.8%) | |
| Country of birth | West Europe | 26 (57.8%) | 10 (40.0%) | 46 (90.2%) | 82 (67.8%) |
| East Europe | 2 (4.4%) | 6 (24.0%) | 2 (3.9%) | 10 (8.3%) | |
| Asia | 8 (17.8%) | 5 (20.0%) | 0 (0.0%) | 13 (10.7%) | |
| North Africa | 4 (8.9%) | 2 (8.0%) | 2 (3.9%) | 8 (6.6%) | |
| Sub-Saharan Africa | 4 (8.9%) | 0 (0.0%) | 0 (0.0%) | 4 (3.3%) | |
| Latin America | 1 (2.2%) | 2 (8.0%) | 1 (2.0%) | 4 (3.3%) | |
| Reason for consulting | Immigration screening | 17 (37.8%) | 12 (48.0%) | 5 (9.8%) | 34 (28.1%) |
| Adoption screening | 1 (2.2%) | 4 (16.0%) | 0 (0.0%) | 5 (4.1%) | |
| Other | 27 (60.0%) | 9 (36.0%) | 46 (90.2%) | 82 (67.8%) | |
| RF | Cohabiting contact | 20 (44.4%) | 10 (40.0%) | 28 (54.9%) | 58 (47.9%) |
| Non-cohabiting contact | 5 (11.1%) | 2 (8.0%) | 18 (35.3%) | 25 (20.7%) | |
| From highly endemic area | 3 (6.7%) | 6 (24.0%) | 0 (0.0%) | 9 (7.4%) | |
| Other (travel, institute, etc.) | 4 (8.9%) | 2 (8.0%) | 4 (7.8%) | 10 (8.3%) | |
| No RF identified | 13 (28.9%) | 5 (20.0%) | 1 (2.0%) | 19 (15.7%) | |
| BCG vaccine | Yes | 5 (11.1%) | 9 (36.0%) | 3 (5.9%) | 17 (14.0%) |
| No | 32 (71.1%) | 11 (44.0%) | 47 (92.1%) | 90 (74.4%) | |
| Unknown | 8 (17.8%) | 5 (20.0%) | 1 (2.0%) | 14 (11.6%) | |
| TST | Positive | 39 (86.7%) | 21 (84.0%) | 1 (2.0%) | 61 (50.4%) |
| Negative | 4 (8.9%) | 4 (16.0%) | 50 (98.0%) | 58 (47.9%) | |
| Unknown | 2 (4.4%) | 0.0 (0.0%) | 0 (0.0%) | 2 (1.7%) | |
| IGRA | Positive | 33 (73.3%) | 11 (44.0%) | 0 (0.0%) | 44 (36.4%) |
| Negative | 11 (24.4%) | 14 (56.0%) | 51 (100%) | 76 (62.8%) | |
| Not performed | 1 (2.2%) | 0 (0.0%) | 0 (0.0%) | 1 (0.8%) | |
ATB: active tuberculosis; LTBI: latent TB infection; HC: healthy controls; IQR: interquartile range; RF: risk factor; BCG: Bacillus Calmette-Guérin; TST: tuberculin skin test; IGRA: interferon-gamma release assay.
Patients with LTBI were older than those with ATB and HC (median age of 107.1, 86.06 and 50.46 months, respectively; P = 0.004), whereas no significant difference in sex distribution was observed among the three groups (P = 0.996).
About a half of the patients with ATB and LTBI (57.8% and 40%, respectively) came from Western Europe, whereas all the others were native to Asia, Africa, Eastern Europe and Latin America, and attended to our clinic in the context of the health screening programme for immigration and international adoption. On the other hand, the vast majority of HC (90.2%) came from Western Europe. However, the provenance from highly endemic countries constituted the main risk factor only for a very small percentage of patients with ATB and LTBI (Table 1). The major hazard for both groups was a known contact with an affected individual, cohabiting or not (55.5% for ATB and 48% for LTBI). In the ATB group, 7 patients out of 45 (15.5%) had a diagnosis of complicated pulmonary TB. In particular, four patients were found to have cavitary disease, two patients massive pleural effusion and one patient endobronchial localization. Moreover, eight (17.8%) patients in the ATB group had an extra-pulmonary TB (one with bone involvement, two with CNS involvement, one miliary form and four with tuberculous lymphadenitis). The ATB group was further divided into two subgroups: a severe one (SATB) including 10 patients with clinical criteria for severe disease and a non-severe ATB group (nSATB) with the remaining 35 patients. The SATB group included the seven patients with complicated pulmonary TB and three of the extra-pulmonary group (one with miliary form and two with CNS involvement).
Lymphocyte subsets within the study groups
Lymphocyte subsets, performed 3 months before and 1 month after the beginning of anti-tubercular treatment, were evaluated within the study groups. Lymphocytes median absolute values and percentages in ATB, LTBI and HC are reported in Figure 1.
Figure 1.

Percentages and absolute values of surface-stained lymphocytes presenting CD19, CD3, CD4, CD8 and CD16/CD56 in patients with active tuberculosis (ATB), latent TB infection (LTBI) and healthy controls (HC). The horizontal line indicates the median value for each group. P values were determined by the Mann–Whitney U test.
No differences in the time interval between the determination of lymphocyte subset values and the beginning of treatment (if applicable) were found among the three study groups (P = 0.279).
Overall, CD3+ levels resulted significantly lower, both in percentage and absolute value, in children with ATB compared to HC (P = 0.002 and P = 0.010, respectively) and only in absolute value in children with LTBI when compared to HC (P = 0.027). In particular, a significant reduction of CD4+ lymphocytes was observed, considering both percentage and absolute value, in ATB infection compared to HC (P = 0.015 and P = 0.014, respectively). Statistical significance was maintained also excluding children younger than 2 years of age (Table 2).
Table 2.
Lymphocyte subset median value, interquartile range and statistical significance within the study groups in children older than 2 years (⩾24 months).
| Lymphocyte subsets | ATB (n = 39) | LTBI (n = 22) | HC (n = 40) | ATB versus HC | ATB versus LTBI | LTBI versus HC |
|---|---|---|---|---|---|---|
| CD19+ % | 19.5 (13.75–28.25) | 19.5 (15.75–21.75) | 18.5 (16–23) | P = 0.916 | P = 0.776 | P = 0.935 |
| CD3+ % | 63.5 (57.25–71.25) | 69 (67.25–71.25) | 71 (66.75–73.75) | P = 0.002 | P = 0.053 | P = 0.088 |
| CD4+ % | 34 (26–39) | 39.5 (36.75–42) | 38 (34–41.75) | P = 0.010 | P = 0.003 | P = 0.269 |
| CD8+ % | 25 (19–28) | 22 (20–27.25) | 24.5 (21.25–28.75) | P = 0.779 | P = 0.402 | P = 0.179 |
| CD16+/CD56+ % | 12 (7–18) | 10.5 (7–16) | 8.5 (6–11.75) | P = 0.013 | P = 0.585 | P = 0.047 |
| CD4+/CD8+ | 1.4 (1–1.7) | 1.85 (1.3–2.1) | 1.4 (1.025–1.975) | P = 0.707 | P = 0.025 | P = 0.099 |
| CD19+ av | 466.5 (275–1046.25) | 449 (270.25–716.5) | 586 (457.5–854.5) | P = 0.060 | P = 0.788 | P = 0.039 |
| CD3+ av | 1714 (1009.25–2608.75) | 1722 (1153–2503.75) | 2206.5 (1918–2937) | P = 0.017 | P = 0.878 | P = 0.012 |
| CD4+ av | 946 (515–1459) | 1015.5 (660.25–1408) | 1205.5 (953.75–1473) | P = 0.022 | P = 0.466 | P = 0.080 |
| CD8+ av | 635 (408.5–950.75) | 547.5 (391.5–917.75) | 845 (609.5–1256.25) | P = 0.039 | P = 0.550 | P = 0.004 |
| CD16+/CD56+ av | 342 (188–543) | 259 (205.5–373) | 255.5 (175–404) | P = 0.493 | P = 0.279 | P = 0.965 |
ATB: active tuberculosis; LTBI: latent TB infection; HC: healthy controls; av: absolute value. Statistically significant p values are shown in bold.
Interestingly, CD4+ percentage was significantly lower in ATB than in LTBI (P = 0.012), whereas no differences were observed in CD4+ percentage and absolute value between LTBI and HC (P = 0.496 and P = 0.094, respectively).
Median absolute value of CD8+ was significantly lower in ATB than in HC (P = 0.019) and in LTBI versus HC (P = 0.017). Moreover, a significantly higher percentage of NK cells was observed in ATB compared to HC (P = 0.016) and in LTBI versus HC (P = 0.034), but not in ATB versus LTBI (P = 0.722); no differences in absolute values of NK cells were observed among the three study groups (as listed above, respectively, P = 0.695, P = 0.631 and P = 0.868). No statistically significant difference was observed in the percentage and absolute count of CD19+ cells when comparing ATB with HC (P = 0.943 and P = 0.051, respectively), ATB with LTBI (P = 0.774 and P = 0.906, respectively) and LTBI with HC (P = 0.864 and P = 0.058, respectively).
SATB showed lower absolute values of all lymphocyte subsets when compared to nSATB (CD19+ P = 0.018, CD3+ P = 0.001, CD4+ P = 0.003, CD8+ P = 0.003, NK P = 0.001) and to HC (CD19+ P = 0.001, CD3+ P < 0.001, CD4+ P < 0.001, CD8+ P < 0.001, NK P = 0.008) (Figure 2). No statistical significance was detected between SATB and nSATB for percentage values of all lymphocyte subsets (CD19+ P = 0.710, CD3+ P = 0.841, CD4+ P = 0.228, CD8+ P = 0.474, NK P = 0.439), but a significant reduction of CD4+ percentage was shown in SATB when compared to LTBI and HC (P = 0.017 and P = 0.027, respectively). When compared to HC, nSATB showed statistical significance only in percentage distribution of CD3+ and NK cells, which were, respectively, lower (P = 0.003) and higher (P = 0.012) in the nSATB group. When referring to CD4+ percentage, nSATB compared to HC did not show a statistically significant difference but were very close to it (P = 0.057) with evident reduction in median values and IQR of nSATB, while a significant reduction was observed in nSATB when compared to LTBI (P = 0.034).
Figure 2.

Percentages and absolute values of surface-stained lymphocytes presenting CD19, CD3, CD4, CD8 and CD16/CD56 in patients with severe active tuberculosis (SATB), non-severe active TB (nSATB), latent TB infection (LTBI) and healthy controls (HC). The horizontal line indicates the median value for each group. P values were determined by the Mann–Whitney U test.
IFN-γ levels of mitogen and TB antigens induced response within the study groups
Median IFN-γ levels of TB antigens induced response were calculated and resulted to be 1.98 (IQR = 0.13–13.08) for ATB, 0.42 (IQR = 0.02–3.48) for LTBI and 0 (IQR = 0–0.01) for HC (Figure 3).
Figure 3.
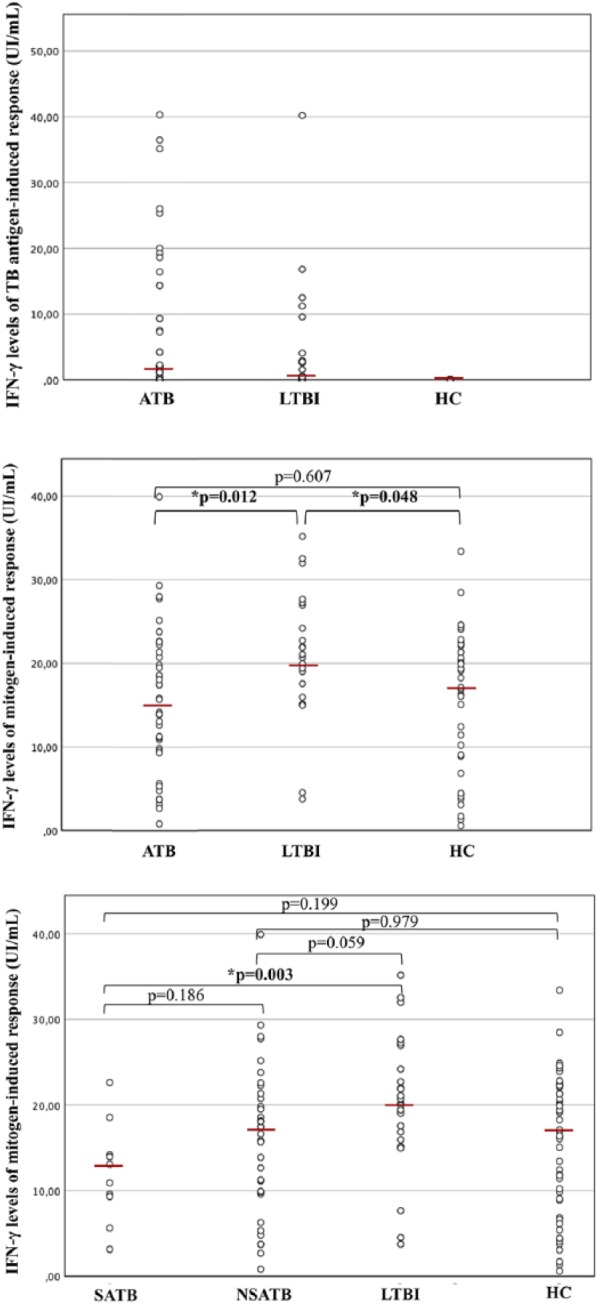
Interferon gamma (IFN-γ) levels of tuberculosis antigens induced response and mitogen-induced response within the different study groups. The results in patients with active tuberculosis (ATB), latent TB infection (LTBI) and Healthy Controls (HC) are reported in the two upper boxes. In the lower box, ATB patients were divided into severe active tuberculosis (SATB) and non-severe active TB (nSATB), and results of IFN-γ levels of mitogen-induced response were compared among subgroups and with patients with LTBI and HC. The horizontal line indicates the median value for each group. P values were determined by the Mann–Whitney U test.
IFN-γ levels of mitogen-induced response were also measured and compared within the different study groups. Median values were 14.92 IU/mL (IQR = 9.60–20.04 IU/mL) for ATB, 20.17 IU/mL (IQR = 15.95–24.19 IU/mL) for LTBI, 16.87 IU/mL (IQR = 8.97–22.18 IU/mL) for HC. Mitogen-induced IFN-γ levels were significantly higher in LTBI than in ATB (P = 0.012) and HC (P = 0.048). No statistically significant difference was detected between ATB and HC (P = 0.607) (Figure 3).
Moreover, within the ATB group, median IFN-γ levels of mitogen-induced response were 11.99 IU/mL (IQR = 8.40–15.26 IU/mL) for SATB and 17.03 IU/mL (IQR = 9.78–21.57 IU/mL) for nSATB. When ATB group was further divided into severe and non-severe forms, the lack of significance versus HC was maintained for both groups (P = 0.199 and P = 0.979, respectively), but when compared to LTBI, SATB showed significant reduction (P = 0.003) and nSATB was very close to it (P = 0.059). SATB and nSATB exhibited no difference in IFN-γ levels of mitogen-induced response between each other (P = 0.186).
Discussion
To the best of our knowledge, this is the first study conducted on a paediatric population living in a low endemic country, analysing lymphocyte subset modifications in HIV-negative patients with different stages of TB. The major evidence of our study is T-cells depletion in HIV-negative paediatric patients with ATB compared to HC, together with the documentation of a profound influence exerted by disease severity.
Previous studies11–26 were carried out mainly on adults and, for many of them, it was impossible to determine if the tubercular infection was due to an endogenous reactivation or a first contact. Moreover, comorbidities may be overrepresented in high-endemic countries and can alter independently lymphocyte subsets.26 A strong correlation, in fact, was found between lymphocytes depletion in TB patients and several parameters (low serum albumin, low haematocrit, low haemoglobin and low body mass index) reflecting generally compromised conditions as wasting and bad nutritional status.14,15,25 It is unclear, though, if low lymphocyte levels are directly related to immunological modifications induced by the TB infection or if they depend on the general health impairment caused by comorbidities or by the severity of the disease itself. In our study, only 3 out of 45 patients with ATB had their main risk factor in the provenance from a highly endemic area. The above-mentioned confounding factors could be considered less relevant in our study population.
In addition, paediatric population, particularly under the age of 5, represents a unique epidemiological group due to the rapid progression from latent infection to TB disease. Only two studies29,30 were performed, respectively, on 22 and 114 children with partially contrasting results. Moreover, both of them were conducted in high-endemic TB countries where malnutrition and co-infections are more frequent and, as mentioned above, can determine immunological modifications irrespectively of TB infection.31
CD3+ reduction affects CD4+ and CD8+ subsets causing a global deficiency that is evidenced by a lower absolute value of CD3+, CD4+ and CD8+. However, when referring only to percentages, the reduction of CD4+ is still evident (P = 0.015) while CD8+ distribution does not reach statistical significance (P = 0.791). This finding is consistent with a global decrement of T-cells that is more pronounced for CD4+ lymphocytes in children with ATB versus HC.
Our results are consonant with the great majority of studies on adult patients, even if many of them reached statistical significance only for absolute count of CD4+.14–16,18,19,21–27 A more limited number of studies also analysed CD4+ percentage and obtained evidences of its reduction.17,20 Moreover, our results are in line with the two studies conducted on paediatric populations. In particular, Swaminathan et al.29 have shown that children with ATB compared to HC have a reduction in the absolute number and proportion of CD3+ and CD4+ cells. Absolute values have not been analysed by Xiao et al.30 which found only a global reduction of CD3+ percentage in ATB versus HC. In this latter study, the decrease of CD4+ percentage reached statistical significance only in more severe extra-pulmonary forms of TB as meningitis and disseminated TB when compared to active pulmonary forms.30 Our group of SATB showed a similar reduction of CD4+ percentage associated with a more global reduction of the absolute number of all lymphocyte subsets when compared to HC (Figure 4) and LTBI. However, differently from the above-mentioned study, no statistically significant difference in the percentage distribution of the different lymphocyte subsets was observed between SATB and nSATB.
Figure 4.

Example of flow cytometry analysis in two age-matched individuals. The first with severe active tuberculosis (SATB; in the figure ‘PATIENT’) and a healthy control (HC; in the figure ‘CONTROL’). In the boxes above flow cytometric analysis of CD3 and CD4 expression in peripheral blood cells after electronic gating on CD45 cells within a lymphocyte gate. The expression of CD3 (FITC-A fluorochrome) is reported on the x-axis; the expression of CD4 (Pe-Cy7 fluorochrome) is reported on the y-axis. In the rectangular gate, CD4 T-cells are shown by density method. The diminished density of fluorescence events of CD4 T-cells in the patient with SATB is macroscopically perceivable and highlighted in the box below through count analysis.
Cellular immunity has a pivotal role in protection against TB infection. T lymphocytes and in particular CD4+ cells have a major role in infection control mainly but not only through IFN-γ production.4 Peripheral CD4+ reduction in ATB has already been interpreted as a consequence of an augmented pooling in the site of infection. This hypothesis has been sustained by molecular32 and clinical studies.27 Our results are in line with these findings and demonstrate that CD3+ and CD4+ reduction is also present in paediatric patients with ATB when compared to HC. This decrease becomes more pronounced alongside with disease progression and severity, probably as a consequence of an augmented pooling. Therefore, immunological modifications are clinically perceivable in paediatric ATB even through simple quantitative analysis of the immune system. Moreover, these modifications are very likely related to the infection itself and are not only consequence of the systemic impairment caused by comorbidities or severity of the disease. In SATB, the reduction in the absolute values of all lymphocytes is more likely due to the combination of an augmented pooling with a global lymphopenia caused by an impairment of general conditions. This hypothesis could be sustained by the evidence that in SATB, CD4+ cells are the only subset whose numeric representation is profoundly affected not only in absolute value but also on percentage distribution when compared to HC and LTBI. On the other hand, nSATB, when compared to HC, showed no differences in the absolute value of the different lymphocyte subsets and reached statistical significance only for CD3+ percentage reduction and NK percentage augmentation. These results may induce to presume that statistical significant reduction of CD4+ in the ATB group is imputable only to the inclusion of the severe forms. Anyhow, this assumption cannot be considered persuasive for several reasons. First of all, no statistically significant difference was detected in the percentage distribution of the different lymphocyte subsets between nSATB and SATB. Furthermore, in nSATB, CD4+ percentage reduction is very close to statistical significance (P = 0.057) and has an evidently lower mean value than the one of HC. In this case, the achievement of statistical significance is probably affected by the numeric reduction of the sample subsequent to its further partition. In addition, significant reduction of CD4+ percentage was observed in nSATB when compared to LTBI. Finally, due to the absence of a universally accepted definition of severe TB, patients’ inclusion in the SATB group was based merely on clinical criteria which can grossly identify more severe forms but necessarily fail in a subtle stratification of the disease activity. For this last reason, we pursued to consider ATB as a unique group where severity and disease activity may have a more homogeneous distribution.
The only statistically significant difference between lymphocyte subsets of ATB and LTBI was the lower percentage of CD4+ in ATB. However, gross comparison of median values and IQR showed a more profound absolute and percentage depletion of CD3+ in ATB that does not reach statistical significance when compared to LTBI. This to say that peripheral blood immunological modifications eventually start with LTBI and get more stressed when the disease becomes active and lymphocyte pooling is augmented. CD4+ lymphocytes are the most involved in the host defence and their percentage is the only one that reaches statistical significance between the groups. Although not statistically significant, there is a slight reduction in CD3+ and CD4+ numbers as well which is enhanced and is statistically relevant in the ATB groups. This suggests that the numbers of these subsets begin to fall in even in LTBI groups though larger data sets are required to prove this point. This interpretation, associated with a relatively small number of patients in different groups, could explain the lack of statistically significant difference between LTBI and HC which is obtained only for the absolute value of CD3+ and CD8+ cells.
Moreover, in particular as to CD3+ and CD4+ cells are concerned, this qualitative perception of a depletion gradient is substantially in agreement with the results obtained by Gao et al.27 in a recent study.
The limited number of patients did not allow an additional stratification of the sample by age groups which would have minimized age-dependent bias due to physiological lymphocyte subset variations. However, statistical significance was maintained also excluding children younger than 2 years of age whose lymphocyte subsets are numerically more different than all other age groups. Therefore, the differences detected among the study groups were supposed not to be deeply influenced by age-related immune modifications.
Humoral immunity plays a role in the host defence against TB through cytokines production, modulation of T immune response and granuloma formation.33 However, in line with previous studies,20,24,30 no difference was observed neither in the percentage nor in the absolute count of CD19+ cells when comparing the study groups.
NK cells have been extensively studied in TB, and their role in immunomodulation and direct cytotoxic activity have been underlined particularly in patients with impaired T function.34,35 Our results, in line with previous findings,20,35 confirm a consistent raise in percentage distribution which already appears during latent infection and it is maintained in ATB showing a percentage augmentation trend. The difference in NK percentage reaches statistical significance between ATB and HC, and LTBI and HC. However, this higher percentage of NK cells in ATB compared to HC could be due to a relative decrease of the other T-cells such as CD4+ and it does not reach statistical significance considering absolute value (Figure 1).
Mitogen-induced IFN-γ levels were significantly higher in LTBI when compared to ATB and HC, whereas no significant difference was detected between the last two groups. These results are concordant with previous studies which analysed cytokine panels in different stages of TB.36,37 If mitogen-induced response is considered as an expression of the subject immune status, higher results in LTBI versus HC can reflect an activation of the immune system which actually manages to control the tubercular infection. Furthermore, higher levels in LTBI versus ATB may be an expression of an initial immune impairment in ATB or, more probably, the effect of the augmented pooling of lymphocytes secreting IFN-γ in the site of infection with a consequent relative reduction of these cells in peripheral blood. This last hypothesis is in line with the numeric depletion of T lymphocytes discussed above.
The main limitation of this study is its cross-sectional design that did not allow data collection about clinical evolution, response to treatment and consensual lymphocyte subset modifications over time. Functional studies were not performed and were beyond the aim of this study. Moreover, the numeric narrowness of the sample did not allow further stratification by age. Nevertheless, we minimized this bias by repeating the analysis excluding patients under the age of 2 and statistical significance was maintained. One more deficiency in this study was the timing of lymphocyte subset execution with regard to the beginning of anti-tubercular treatment. To obviate this bias, we included only those patients in which lymphocyte subsets were performed between 3 months before and 1 month after the beginning of anti-tubercular treatment. Moreover, no differences in the time interval between the lymphocyte subset determination and the beginning of treatment (if applicable) were detected among the three study groups. When referring to ATB subgrouping in SATB and nSATB, the possibility of a selection bias must be considered for the absence of a universally accepted definition of severe TB. In addition, the numeric exiguity of the sample in SATB can limit the results obtained.
Finally, the lymphocyte pooling hypothesis cannot be confirmed by our study, as long as this study explored only peripheral blood lymphocyte quantitative modifications and did not directly detect immune changes and interactions at the site of infection.
In conclusion, our study demonstrates immunological modifications in the numeric representation and percentage distribution of peripheral lymphocytes in different stages of TB in a HIV-negative paediatric population living in a low endemic country. The paediatric sample and the study setting constitute a substantial contribution to the hypothesis that these modifications are directly dependent on TB and that they are not mere consequences of comorbidities or systemic impairment. Moreover, it is evident that disease activity and severity profoundly affects lymphocyte subset representation and its distribution. The major findings of our study were CD3+ and CD4+ absolute and percentage depletion in ATB versus HC. These data are in line with the hypothesis of an augmented lymphocyte pooling in the site of infection. SATB, compared to HC and LTBI, showed a marked reduction in the CD4+ percentage which, one again, strengthen the pooling hypothesis even in a situation where the systemic impairment probably affects globally the absolute count of all peripheral lymphocyte subsets that are all profoundly diminished. Moreover, the relative increase in NK cells was confirmed in infected patients and no differences in B cells among the study groups were detected. Mitogen-induced IFN-γ levels were significantly higher in LTBI when compared to ATB and HC demonstrating effective immune activation in those patients who manage to control the infection.
Our study reveals, on a very little investigated population, important immune modifications dependent on TB infection that are already perceivable on a quantitative routine immune evaluation. These data may constitute a call for larger studies comprehensive of functional investigations of the immune system which may reveal laboratory markers predictive of disease evolution and clinically helpful to distinguish the different stages of TB in children.
Footnotes
Declaration of conflicting interests: The author(s) declared no potential conflicts of interest with respect to the research, authorship, and/or publication of this article.
Funding: The author(s) received no financial support for the research, authorship, and/or publication of this article.
ORCID iD: Lorenzo Lodi  https://orcid.org/0000-0001-6902-544X
References
- 1. World Health Organization (2017) Global tuberculosis report 2017. Available at: https://www.who.int/tb/publications/global_report/gtbr2017_main_text.pdf
- 2. Lefford MJ. (1975) Transfer of adoptive immunity to tuberculosis in mice. Infection and Immunity 11(6): 1174–1181. [DOI] [PMC free article] [PubMed] [Google Scholar]
- 3. Orme IM, Collins FM. (1983) Protection against Mycobacterium tuberculosis infection by adoptive immunotherapy. Requirement for T cell-deficient recipients. The Journal of Experimental Medicine 158(1): 74–83. [DOI] [PMC free article] [PubMed] [Google Scholar]
- 4. Bozzano F, Marras F, De Maria A. (2014) Immunology of tuberculosis. Mediterranean Journal of Hematology and Infectious Diseases 6(1): e2014027. [DOI] [PMC free article] [PubMed] [Google Scholar]
- 5. Flynn JL, Ernst JD. (2000) Immune responses in tuberculosis. Current Opinion in Immunology 12(4): 432–436. [DOI] [PubMed] [Google Scholar]
- 6. Pedrazzini T, Louis JA. (1986) Functional analysis in vitro and in vivo of Mycobacterium bovis strain BCG-specific T cell clones. Journal of Immunology 136(5): 1828–1834. [PubMed] [Google Scholar]
- 7. de Martino M, Galli L, Chiappini E. (2014) Reflections on the immunology of tuberculosis: Will we ever unravel the skein? BMC Infectious Diseases 2014; 14(Suppl. 1): S1. [DOI] [PMC free article] [PubMed] [Google Scholar]
- 8. Meraviglia S, El Daker S, Dieli F, et al. (2011) γδ T cells cross-link innate and adaptive immunity in Mycobacterium tuberculosis infection. Clinical & Developmental Immunology 2011: 587315. [DOI] [PMC free article] [PubMed] [Google Scholar]
- 9. Flynn JL, Goldstein MM, Triebold KJ, et al. (1992) Major histocompatibility complex class I-restricted T cells are required for resistance to Mycobacterium tuberculosis infection. Proceedings of the National Academy of Sciences of the United States of America 89(24): 12013–12017. [DOI] [PMC free article] [PubMed] [Google Scholar]
- 10. Vordermeier HM, Venkataprasad N, Harris DP, et al. (1996) Increase of tuberculous infection in the organs of B cell-deficient mice. Clinical and Experimental Immunology 106(2): 312–316. [DOI] [PMC free article] [PubMed] [Google Scholar]
- 11. Beck JS, Potts RC, Kardjito T, et al. (1985) T4 lymphopenia in patients with active pulmonary tuberculosis. Clinical and Experimental Immunology 60(1): 49–54. [PMC free article] [PubMed] [Google Scholar]
- 12. Onwubalili JK, Edwards AJ, Palmer L. (1987) T4 lymphopenia in human tuberculosis. Tubercle 68(3): 195–200. [DOI] [PubMed] [Google Scholar]
- 13. Singhal M, Banavalikar JN, Sharma S, et al. (1989) Peripheral blood T lymphocyte subpopulations in patients with tuberculosis and the effect of chemotherapy. Tubercle 70(3): 171–178. [DOI] [PubMed] [Google Scholar]
- 14. Jones BE, Oo MM, Taikwel EK, et al. (1997) CD4 cell counts in human immunodeficiency virus-negative patients with tuberculosis. Clinical Infectious Diseases 24(5): 988–991. [DOI] [PubMed] [Google Scholar]
- 15. Kony SJ, Hane AA, Larouze B, et al. (2000) Tuberculosis-associated severe CD4+ T-lymphocytopenia in HIV-seronegative patients from Dakar. SIDAK Research Group. The Journal of Infection 41(2): 167–171. [DOI] [PubMed] [Google Scholar]
- 16. Rodrigues DSS, Medeiros EA, Weckx LY, et al. (2002) Immunophenotypic characterization of peripheral T lymphocytes in Mycobacterium tuberculosis infection and disease. Clinical and Experimental Immunology 128(1): 149–154. [DOI] [PMC free article] [PubMed] [Google Scholar]
- 17. Uppal SS, Tewari SC, Verma S, et al. (2004) Comparison of CD4 and CD8 lymphocyte counts in HIV-negative pulmonary TB patients with those in normal blood donors and the effect of antitubercular treatment: Hospital-based flow cytometric study. Cytometry, Part B: Clinical Cytometry 61(1): 20–26. [DOI] [PubMed] [Google Scholar]
- 18. Pessaran Z, Sahebfosul F, Oreizi F, et al. (2005) Immunophenotypic characterization of peripheral blood T-lymphocytes and their subpopulations in tuberculosis patients before and after treatments. Iranian Journal of Allergy, Asthma, and Immunology 4(1): 23–26. [PubMed] [Google Scholar]
- 19. Villacian JS, Tan GB, Teo LF, et al. (2005) The effect of infection with Mycobacterium tuberculosis on T-cell activation and proliferation in patients with and without HIV co-infection. The Journal of Infection 51(5): 408–412. [DOI] [PubMed] [Google Scholar]
- 20. Deveci F, Akbulut HH, Celik I, et al. (2006) Lymphocyte subpopulations in pulmonary tuberculosis patients. Mediators of Inflammation 2006(2): 89070. [DOI] [PMC free article] [PubMed] [Google Scholar]
- 21. Veenstra H, Baumann R, Carroll NM, et al. (2006) Changes in leucocyte and lymphocyte subsets during tuberculosis treatment; prominence of CD3dimCD56+ natural killer T cells in fast treatment responders. Clinical and Experimental Immunology 145(2): 252–260. [DOI] [PMC free article] [PubMed] [Google Scholar]
- 22. Davoudi S, Rasoolinegad M, Younesian M, et al. (2008) CD4+ cell counts in patients with different clinical manifestations of tuberculosis. The Brazilian Journal of Infectious Diseases 12(6): 483–486. [DOI] [PubMed] [Google Scholar]
- 23. Al-Aska A, Al-Anazi AR, Al-Subaei SS, et al. (2011) CD4+ T-lymphopenia in HIV negative tuberculous patients at King Khalid University Hospital in Riyadh, Saudi Arabia. European Journal of Medical Research 16(6): 285–288. [DOI] [PMC free article] [PubMed] [Google Scholar]
- 24. Guglielmetti L, Cazzadori A, Conti M, et al. (2013) Lymphocyte subpopulations in active tuberculosis: Association with disease severity and the QFT-GIT assay. The International Journal of Tuberculosis and Lung Disease 17(6): 825–828. [DOI] [PubMed] [Google Scholar]
- 25. Skogmar S, Schon T, Balcha TT, et al. (2013) CD4 cell levels during treatment for tuberculosis (TB) in Ethiopian adults and clinical markers associated with CD4 lymphocytopenia. PLoS ONE 8(12): e83270. [DOI] [PMC free article] [PubMed] [Google Scholar]
- 26. Atomsa D, Abebe G, Sewunet T. (2014) Immunological markers and hematological parameters among newly diagnosed tuberculosis patients at Jimma University Specialized Hospital. Ethiopian Journal of Health Sciences 24(4): 311–318. [DOI] [PMC free article] [PubMed] [Google Scholar]
- 27. Gao Y, Zhang S, Ou Q, et al. (2015) Characterization of CD4/CD8+ αβ and Vγ2Vδ2+ T cells in HIV-negative individuals with different Mycobacterium tuberculosis infection statuses. Human Immunology 76: 801–807. [DOI] [PubMed] [Google Scholar]
- 28. American Academy of Pediatrics (2018) Tuberculosis. In: Kimberlin DW, Brady MT, Jackson MA, et al. (eds) Red Book: 2018 Report of the Committee on Infectious Diseases, 31st edn Itasca, IL: American Academy of Pediatrics, pp. 829–853. [Google Scholar]
- 29. Swaminathan S, Nandini KS, Hanna LE, et al. (2000) T-lymphocyte subpopulations in tuberculosis. Indian Pediatrics 37(5): 489–495. [PubMed] [Google Scholar]
- 30. Xiao J, Sun L, Wu X-R, et al. (2012) Association of immunophenotypic characterization of peripheral lymphocytes with different clinical phenotypes of tuberculosis in Chinese Han children. Chinese Medical Journal 125(2): 275–280. [PubMed] [Google Scholar]
- 31. Chandra RK. (1997) Nutrition and the immune system: An introduction. The American Journal of Clinical Nutrition 66(2): 460S–463S. [DOI] [PubMed] [Google Scholar]
- 32. Walrath JR, Silver RF. (2011) The α4β1 integrin in localization of Mycobacterium tuberculosis-specific T helper type 1 cells to the human lung. American Journal of Respiratory Cell and Molecular Biology 45(1): 24–30. [DOI] [PubMed] [Google Scholar]
- 33. Kozakiewicz L, Phuah J, Flynn J, et al. (2013) The role of B cells and humoral immunity in Mycobacterium tuberculosis infection. Advances in Experimental Medicine and Biology 783: 225–250. [DOI] [PMC free article] [PubMed] [Google Scholar]
- 34. ChorenoParra JA, MartinezZuniga N, Jimenez Zamudio LA, et al. (2017) Memory of natural killer cells: A new chance against mycobacterium tuberculosis? Frontiers in Immunology 8: 967. [DOI] [PMC free article] [PubMed] [Google Scholar]
- 35. Barcelos W, Sathler-Avelar R, Martins-Filho OA, et al. (2008) Natural killer cell subpopulations in putative resistant individuals and patients with active Mycobacterium tuberculosis infection. Scandinavian Journal of Immunology 68(1): 92–102. [DOI] [PubMed] [Google Scholar]
- 36. Jeong YH, Hur Y-G, Lee H, et al. (2015) Discrimination between active and latent tuberculosis based on ratio of antigen-specific to mitogen-induced IP-10 production. Journal of Clinical Microbiology 53(2): 504–510. [DOI] [PMC free article] [PubMed] [Google Scholar]
- 37. Mueller H, Detjen AK, Schuck SD, et al. (2008) Mycobacterium tuberculosis-specific CD4+, IFNγ+, and TNFα+ multifunctional memory T cells coexpress GM-CSF. Cytokine 43(2): 143–148. [DOI] [PubMed] [Google Scholar]