Abstract
Differences in monolayer and three-dimensional (3D) culture systems have been recognized for several years. Despite the recognized importance of 3D systems, low cost and convenience of monolayer culture are still readily used for metabolic and nutritional studies. Here, we present part 1 of a 2-part series that will highlight (1) a novel and cost-effective model for culturing 3T3-L1 preadipocytes in 3D agarose as well as (2) an initial study showing the successful use of this 3D model for experimental analysis of these cells treated with cinnamon extract while suspended in agarose. In part 1, we provide a full characterization of the model system for the 3T3-L1 cells that demonstrate the functionality and convenience of this system. Importantly, we note spontaneous differentiation to adipocytes while cultured under these methods, independent of chemical induction. We present a 2.5-week time course with rounded cells forming vacuoles as early as 24 hours and accumulation of lipid detectable by Oil Red O stain at 0.5 weeks. Serum selection, lipid volume determination, and cell size are characterized. We conclusively demonstrate adipogenesis based on a peroxisome proliferator-activated receptor γ (PPARγ) detection using immunohistochemistry (IHC) of sections from these 3D cultures. Methods, materials and recommendations are described as well as proposed benefits to the use of this culture system for 3T3-L1 cells.
Keywords: three-dimensional culture, agarose culture, adipogenesis, differentiation, 3T3-L1 cells, PPARγ
Introduction
The use of three-dimensional (3D) culture techniques has been important for gaining a more physiologically representative environment for experimentation. Numerous studies have shown that 3D environments allow more conservative treatment doses than the monolayer parallel experiment.1–3 Similarly, 3D environments are more permissible spatially, allowing changes in shape and morphology that sometimes results in changes in cell signaling and gene expression profiles.4–9 Several 3D culture techniques have been used to study adipogenesis. This includes using a hydrogel, which is the extracellular matrix extracted from adipose. The hydrogel can be used for tissue regeneration allowing cells to migrate and populate the structure as seen in in vivo studies and in cell culture where cells are seeded onto the hydrogel and grown.10,11 Other types of 3D scaffold have also been employed.12–14 Another 3D technique is the spheroid cell model where cells are prevented from attaching to substratum and form a cluster or spheroid of cells.15–17 Both the spheroid and hydrogel result in a mass of cells, which is representative of adipose tissue. In culture, hydrogel and spheroids require the use of an indication cocktail to induce adipogenic phenotype.
Here, we present part 1 of a 2-part manuscript that will characterize the behavior of single 3T3-L1 cells grown in a novel 3D agarose system that induces differentiation without addition of the chemical induction cocktail without forming a cell mass. This system is different in that the cells are filtered and suspended as single cells and maintained as such throughout the growth period. Any aggregates are a result of mitosis or a plating error; therefore, a spheroid mass as used by others is not produced in this system. The advantage of this is that it allows the analysis of individual cells for morphology and immunohistochemistry (IHC). This single-cell agarose suspension lends itself to epigenetic analysis at the single-cell level. Part 2 will provide examples of a nutrition-based study examining the effects of cinnamon extract on preadipocyte cells grown in this system.
The 3T3-L1 pre-adipose cell line has long been used as a model system for the study of obesity, diabetes, and metabolism. Typically, these determinant cells can be treated with media cocktails that induce further differentiation to mature adipocytes; however, long-term monolayer experimentation can be difficult due to accumulation of lipid and clonal expansion.18 We sought a system to examine the effects of various treatments on differentiation of the 3T3-L1 cells over a period of time as long as 3 weeks. Furthermore, we desired an economical system with an environment that was permissive to the single pre-adipose cells to allow them to differentiate into the rounded morphology seen in vivo. A method that would allow staining, IHC, and cell content extraction was also essential. Ideally, our model system would not require additional chemical treatments to induce differentiation as these typical inducers could interfere with the cell signaling changes during our treatments.19
This 3D agarose system, in which single cells are suspended in agarose, has been used successfully in the past to provide a permissive environment for anchorage independent cells including chondrocytes and cancer cells.2,3,20 Based on previous research by author Aulthouse and collaborators involving 3D environment-induced differentiation, we sought to determine whether this same 3D agarose cell culture environment would allow for spontaneous environment-driven differentiation of the preadipocytes to maturing adipocytes.
Using our cost-effective 3D model system, induction of differentiation was possible without exogenous chemicals and the system allowed variable treatment periods up to 3 weeks post plating. To our knowledge, this is the first instance of 3T3-L1 preadipocytes being cultured using this 3D agarose method, and this technique proves useful for visualization of cells, staining, and IHC. In addition, this system allows spontaneous differentiation without chemical induction, rendering our method a physiologically significant experimental system for anchorage-independent cells.
Materials and Methods
Monolayer cell culture
The 3T3-L1 cell line (ATCC® CL-173™) was purchased from American Tissue Culture Collection (ATCC). Cells were grown in monolayer in expansion media, 1× Dulbecco’s Modified Eagle’s Medium (DMEM) with 10% bovine calf serum (BCS) and 0.1% penicillin/streptomycin, as recommended by the manufacturer at 37°C in a humidified CO2 incubator until approximately 70% confluence. All media and serum were purchased from ATCC. Culture plates, dishes, and supplies were purchased from Corning.
The 3D agarose culture
The 3T3-L1 cells were grown to 70% confluence under standard monolayer conditions as recommended by the manufacturer and collected via a 5-min incubation at 37oC with 1× trypsin ethylenediaminetetraacetic acid (EDTA; ATCC). Cells were filtered through a single-use sterile 70 µm cell strainer (Fisher Scientific) to remove cell clumps. Single cells were counted with a hemocytometer, pelleted and resuspended at a concentration of 5 × 10⁵ cells/mL in 0.5% low-temperature agarose in DMEM. The 0.5% low-temperature agarose (Bio-Rad) was created by mixing equal volumes of 1% low-temperature agarose with 2× DMEM. A 10 μL drop of individual cells suspended in 0.5% low-temperature agarose was plated in the center of a 35-mm cell culture dish previously coated with a 1% high-temperature agarose (Bio-Rad). Cultures were allowed to gel at 4oC for 15 minutes prior to feeding with 2 mL of media (DMEM, 10% fetal bovine serum [FBS] or 10% BCS, 0.1% pen-strep). Cells were fed by complete media change of 2 mL at half-week intervals. A detailed description of the protocol for 3D agarose is described in Kinder and Aulthouse.3
Cell viability
At all time points and treatments, at least 3 cultures were analyzed for viability using the trypan blue (Sigma) exclusion assay as described by the manufacturer and others.21,22 Trypan blue exclusion was visualized using an inverted Nikon M2 microscope prior to Oil Red O staining. Cells that were blue indicated membrane disruption and would be considered non-viable. As with other cells cultured using by this method by the investigator, the 3T3-L1 cells were highly viable with less than 0.2% taking up the trypan blue dye.
Statistical analysis
Appropriate statistical analysis was completed using GraphPad Prism. In brief, lipid content data were analyzed using an unpaired t-test with Welch correction. Lipid volume differences between cultures grown with different serums were analyzed using an ordinary two-way analysis of variance (ANOVA). Cell size differences were analyzed using an ordinary one-way ANOVA.
Measurement
Cell diameter was measured using an Olympus IM inverted microscope calibrated with a stage micrometer. The cultures were first centered at 4× and each quadrant of the culture was then analyzed at 20×. Cells measured were selected randomly from the field of vision. Measurements were taken on randomly selected culture dishes blind from treatment conditions. Twenty five cells were measured per quadrant giving 100 cells per culture. Lipid droplets were measured using the same technique and the average lipid droplet size per quadrant was used to estimate spherical volume.
Oil Red O staining
Both monolayer and agarose cultures were stained with Oil Red O (Sigma) to visualize and detect lipid droplets for photography. Monolayer and agarose cultures were rinsed twice with phosphate-buffered saline (PBS; Sigma), fixed with 10% neutral buffered formalin (NBF; Fisher Scientific) and then rinsed twice in deionized water. Cultures were incubated for 15 minutes in 60% isopropanol and stained with Oil Red O solution for 30 to 60 minutes and rinsed with tap water until clear. Residual dye was isolated to the high-temperature agarose dish coating and did not interfere with microscopy images.
Lipid quantitation using Oil Red O stain
Lipid content quantitation in 3D agarose cultures
Lipid content was estimated in each Oil Red O (Sigma)-stained 3D agarose culture by randomly centering the field on each quadrant of the plated culture to ensure no bias was involved in selection of the field area. The lipid droplet density was evaluated blindly as a fraction of 1 with no knowledge of the culture treatments of growth times. The average diameter of a micro-lipid droplet was calculated per quadrant with an overall average of 0.5 μm. Spherical volume was calculated using the equation 4/3πr3 where the radius was calculated from the measured micro-lipid droplet diameter. Once the lipid droplet volume was calculated, it was multiplied by the quadrant droplet number to obtain a total lipid volume for that quadrant. Residual dye in the high-temperature agarose coating was not adjacent to the microculture droplet (10 µL centered on the coated dish) and did not interfere with Oil Red O visualization.
Lipid content quantitation via dye extraction in monolayer cultures
Cells grown in monolayer were stained with Oil Red O and were dried overnight, and the dye was extracted with 98% isopropanol for 20 to 30 minutes at room temperature. Samples were assayed at 520 nm spectrophotometrically using a BioTek plate reader. These lipid volume values were comparable to the calculated method used for the 3D cultures where instead of calculating spherical volume, we calculated the surface area (using the formula 4πr2) of the lipid droplet in monolayer to estimate lipid content. The dye extraction method is less labor intensive and was used as the primary method of lipid quantitation in all remaining monolayer cultures stained with Oil Red O. Agarose 3D cultures were not subjected to dye extraction due to interference of the agarose with the spectrophotometer reading.
Photography
Monolayer cells were photographed using a Nikon Digital Sight DS-5M camera mounted on a Meiji Techno inverted microscope. Microscope used for Oil Red O visualization and photography was a ZEISS Primo Vert microscope equipped with a ZEISS Axiocam Erc 5s camera for imaging. Microscope used for 3,3′-diaminobenzidine (DAB) IHC photography was a Nikon Eclipse 50i with a Moticam 10+ MP camera for imaging.
IHC
For IHC, agarose cultures (0.5, 1.5, and 2.5 weeks) were rinsed in PBS twice and fixed in 10% NBF, minimum of 48 hours. Cultures were carefully removed from the dish using a spatula and placed in biopsy cassettes (General Data) for processing. Cultures were processed on a Tissue-Tek II processor for 10 minutes in each ethanol concentration (70%, 80%, 95%, 100%, and 100%) and 2 changes of xylene. Infiltration with molten paraffin involved 2 to 30 minutes changes and a third change of 15 minutes under vacuum to ensure complete infiltration. Eosin was added to the last 100% ethanol, so the cultures/cells could be visualized during embedding and sectioning. Cultures were embedded in paraffin and sectioned at 5 µm. The sections were mounted on plus charge slides and heated for 30 minutes at 58°C in an oven. Sections were selected for IHC and stained following the manufacturer’s, Cell Signaling Technology, instruction and using their reagents. Briefly, the sections were deparaffinized in xylene and rehydrated in a graded series of ethanol and brought to deionized water. Antigen retrieval was accomplished using citrate buffer heated in a microwave. Cooled sections were then rinsed in deionized water and endogenous peroxides were blocked using 3% H2O2 for 10 minutes. Sections were then washed with Tris-buffered saline with Tween 20 (wash buffer) and incubated in “animal-free block” solution for 1 hour in a humidified chamber to prevent nonspecific binding. The primary antibody PPARγ (C26H12) rabbit mAB #2435 was applied to sections after the blocking agent was removed. Phosphate-buffered saline served as the negative control. Sections were incubated overnight at 4°C in a humidified chamber. Sections were rinsed with wash buffer and incubated in SignalBoost reagent: horse radish peroxidase (HRP) for 30 minutes in a humidified chamber at room temperature. Sections were then rinsed in wash buffer and incubated in the DAB chromogen for 7 minutes, rinsed in deionized water, and counterstained for 30 sections with modified Harris Hematoxylin. Sections were then rinsed in deionized water, dehydrated in ethanol followed with xylene and cover-slipped using Permount. A PAP pen was used to encircle the sections to reduce the amount of reagents used.
Results
Morphological differences in 3T3-L1 cells in monolayer and 3D agarose culture
Using the 3T3-L1 preadipocytes expanded in monolayer, cells were filtered through a 70 µm cell strainer, and single cells were suspended at 5 × 10⁵ cells/mL in a 0.5% low-temperature agarose in DMEM. Cultures were plated in triplicate for each time point and media variation. Cultured cells were examined at varying time points in early and mid-stage differentiation ranging from 24 hours to 2.5 weeks post plating. Adipogenesis was monitored by examining lipid droplet formation and accumulation via whole culture Oil Red O staining and where appropriate lipid volume was estimated based on droplet size and number.
Similar experiments were completed in monolayer cells and were counted in each quadrant of the culture to determine the percent of cells that had a more rounded morphology compared with those that remained flat and fibroblast-like. Of the more rounded cells, the portion containing at least 50% space filled with lipid droplets were considered adipogenic. In monolayer, an estimate of lipid droplet volume was not reliable and a quantitation of extracted dye was necessary.
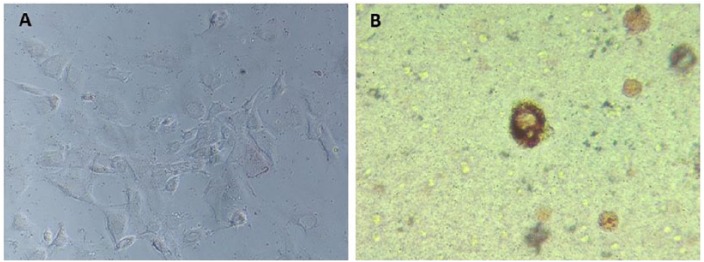
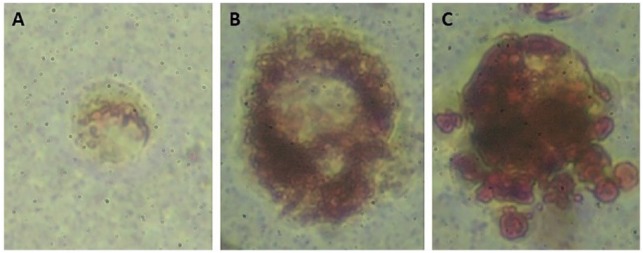
Figure 1A shows the 3T3-L1 cells grown in monolayer in expansion media only. These cells have not yet been treated with chemical induction cocktail for differentiation. Figure 1A is included only as a reference of morphology to make the morphological difference in the round cell more recognizable. The term rounded cells is used to describe morphology of the individual cell and is not to be confused with terminology used to describe spheroid model systems. Rounded cells grown in agarose and stained with Oil Red O are shown in Figure 1B. Although vacuoles were noted as early as 24 hours post plating, staining with Oil Red O was not conclusive at this early stage. Cultures grown 0.5 weeks showed vacuole formation that could be conclusively identified as lipid droplets using Oil Red O staining (Figure 2A). After 1.5 weeks, Figure 2B, an increased number of lipid droplets are evident. Figure 2C shows greater lipid droplet accumulation at 2.5 weeks. Based on these results, adipogenesis could be confirmed and occurred independent of chemical induction.
Figure 1.
(A) 3T3-L1 cells grown 1 week in monolayer with expansion media, lipid stained with Oil Red O to demonstrate minimal lipid accumulation (magnification 20×). The cells shown here have not yet been induced for differentiation and are included as a reference of flat fibroblast-like morphology. (B) 3T3-L1 cells grown 1 week in three-dimensional (3D) agarose culture without chemical induction, lipid stained with Oil Red O (magnification 20×).
Figure 2.
3T3-L1 cells grown in three-dimensional (3D) agarose culture without chemical differentiation, lipid stained with Oil Red O (magnification 400×): (A) 0.5 weeks, (B) 1.5 weeks, and (C) 2.5 weeks.
Evaluation of lipid volume in monolayer versus 3D agarose culture
A comparison was made between 3D cultures grown 1 week and monolayer cultures in which differentiation was chemically induced. Lipid content was estimated 1 week post plating in the 3D cultures and 1 week post chemical induction in the monolayer cultures. Lipid volume from the 3D cultures was estimated by lipid droplet density as a fraction of 1 in each of 4 sections of a culture. For each quadrant of the culture, the average diameter of a micro-lipid droplet was calculated and spherical volume was determined per droplet using the equation 4/3πr3. The samples from each quadrant were evaluated by randomly focusing on 1 field. To prevent individual variability and interpretation, the same evaluator analyzed all cultures and was blind to treatment and hypothesis. The average lipid content per cell was then calculated and graphed as shown in Figure 3. The content of lipid in the monolayer culture, grown 1 week post induction, was accomplished by extraction of the Oil Red O using isopropanol and quantitated using the measured absorbance at 520 nm. This dye extraction method was compared with calculation by measurement of volume in the monolayer cells and found comparable. The dye extraction method was possible and less labor intensive and therefore the obvious choice for the monolayer cultures. Unfortunately, due to agarose interference with the spectrophotometric readings, dye extraction was not possible in the 3D agarose cultures. The monolayer lipid content is shown in Figure 3. Although the difference in lipid content does not appear large based on the graph, the standard deviation between measurements was small and based on an unpaired t test with Welch correction, the P value was .0023, and the lipid content was considered significantly different with greater lipid accumulation in the 3D cultures. Although 2 different methods were used to evaluate lipid content (monolayer dye extraction method and 3D agarose spherical volume determination), both methods were independently reliable and accurate. The comparison between lipid content in each of the 2 methods is graphed for overall comparison, but caution should be used in drawing conclusions from this data comparison.
Figure 3.
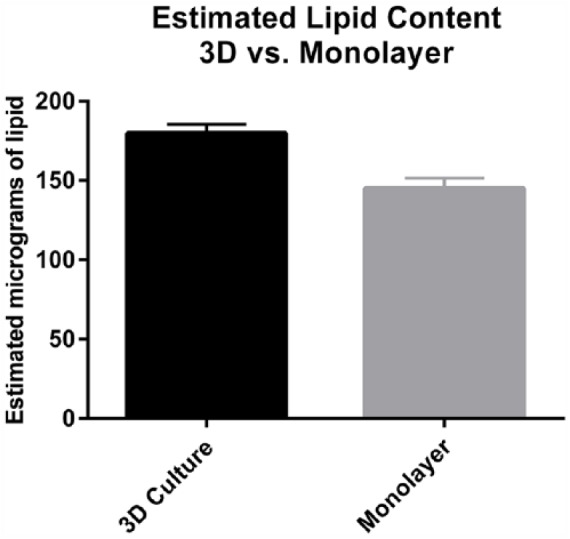
Estimated lipid content (quantitated by dye extraction in monolayer and volume fill in three-dimensional [3D] culture) was normalized and graphed for comparison. Data were analyzed using an unpaired t-test with Welch correction and found statistically different with a P value of .0023. Interpretation of these data comparsion is cautioned considering 2 different methods of lipid quantitation were used; however, the comparision was useful for trend identification.
Characterization of serum selection affects in 3D agarose culture
Given the unique list of required media changes in the chemically differentiated monolayer cells to achieve differentiation, a complete characterization of our model in different serums was desired. The morphology and lipid accumulation in 3D cultures at 1 and 2 weeks grown in 1× DMEM with either 10% BCS or 10% FBS was examined. Triplicate repeats showed similar lipid volumes with no significant difference between the BCS or FBS at week 1 (Figure 4). The similar lipid volumes between the FBS and BCS cultures at week 1 indicated that the differentiation occurring at this stage is independent of the serum contents. However, at week 2, there was a significantly greater lipid volume in cultures grown in FBS but not with those grown in BCS.
Figure 4.
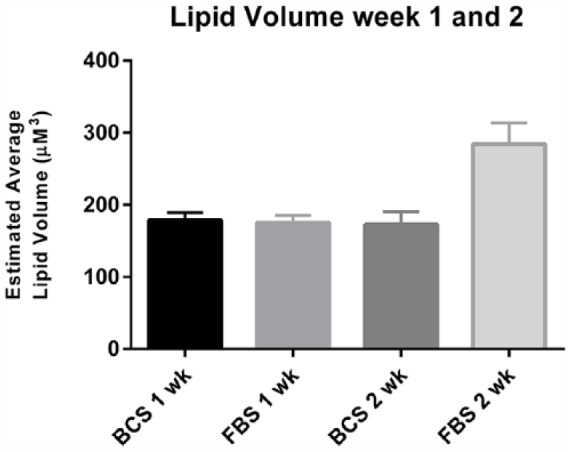
Lipid volume in three-dimensional (3D) agarose cultures of 3T3-L1 at 1 week and 2 weeks when grown with BCS- and FBS-supplemented DMEM. Estimated lipid volume showed no significant difference between cultures grown in BCS versus FBS. Cultures were grown in triplicate and each plate divided into 4 quadrants for lipid droplet counting and measurements. Maximum diameter was found by adjusting the plane of focus through each lipid droplet. Spherical volume was calculated as described in methods. Data were analyzed using an ordinary two-way ANOVA. The P value <.0001, suggesting a strong significant difference in lipid volume at week 2 in the FBS serum. ANOVA indicates analysis of variance; BCS, bovine calf serum; DMEM, Dulbecco’s Modified Eagle’s Medium; FBS, fetal bovine serum.
Generally BCS, although lot specific, contains higher insulin amounts (not significant) than FBS. Although no significant differences in lipid volume or morphology were observed, studies were conducted to ensure that the differences in insulin concentrations between the 2 serum samples did not result in any significant lipid volume changes. To determine how this lower insulin level affects the lipid accumulation, the insulin concentration of lot specific serum batches was calculated and correlated to lipid volume. Data were compiled by averaging the lipid volumes determined from a minimum of 3 cultures for each culture condition, which corresponds to approximately 300 cells subjected to the media with the specific serum. This correlation is plotted in Figure 5. The plotted points do not follow a linear pattern (the points do not fall on or near the line of best fit on the graph), indicating that no correlation exists between the lipid volume in the 3D agarose cultures and the level of insulin found in the serum added to the media. Based on the similar morphology and lipid volumes between the cultures grown with the 2 different serum samples, no such correlation between the lipid volume and serum sample-specific insulin level was expected. These results strongly suggest that the differentiation observed in the 3D agarose cultures is not related to the insulin found in the media serum.
Figure 5.
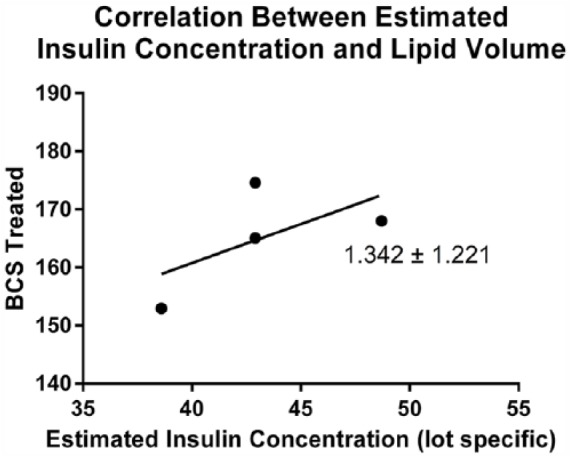
The concentration of insulin at the time of plating was calculated for each serum for a minimum of 300 cells per culture condition. The graph shows no correlation between the insulin concentration and lipid volume, suggesting that insulin concentration alone is not responsible for changes in lipid volume. BCS indicates bovine calf serum.
Cell size differences based on serum selection and growth time
After evaluating the cell size for both the 1 and 2 week time points for BCS and FBS cultures, a significant difference in cell size was observed at 2 weeks with the FBS cultured cells only (Figure 6). This difference between weeks 1 and 2 was not observed in the BCS cultured cells. As expected, these values suggest a directly proportional relationship between lipid volume and cell size for all data at 1 week and for the BCS cultured cells at both 1 and 2 weeks. Interestingly, the relationship appears stronger at 1 week than at 2 weeks for FBS cultured cells. This suggests that increased cell size early on could be a result of the lipid volume increasing, but later in the FBS cultures, the cell size is not as small as would be expected given the measured lipid volumes.
Figure 6.
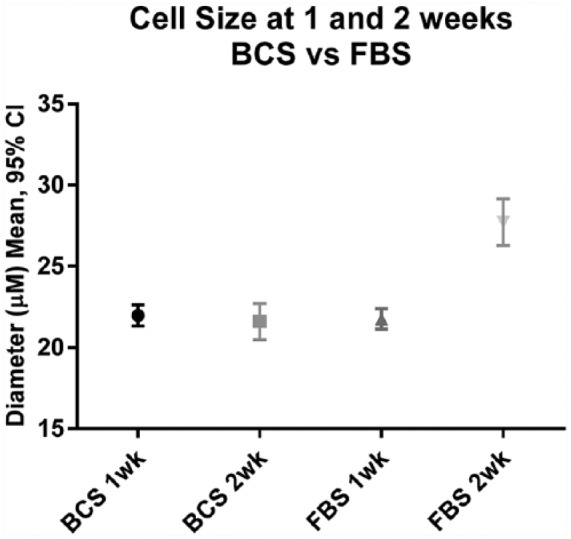
The diameter of a minimum of 100 cells per plate was measured with a minimum of 3 plates per treatment. There was no statistical significance in the difference of serums used with BCS and FBS being approximately equal. The only significant difference noted was with FBS cultures grown 2 weeks when compared with cells grown 2 weeks in BCS serum. P value = .0002 for FBS at 2 weeks compared with BCS at 2 weeks. Data were analyzed using an ordinary one-way ANOVA. ANOVA indicates analysis of variance; BCS, bovine calf serum; FBS, fetal bovine serum.
Adipogenesis confirmed by detection of PPARγ via IHC
Although adipogenesis is commonly detected by the formation of lipid droplets visualized by Oil Red O staining, a more definitive method to demonstrate that the agarose culture allowed spontaneous differentiation was desired. Peroxisome proliferator-activated receptor γ is typically used as a conclusive marker for differentiation as expression of PPARγ is increased during adipose differentiation and lipid uptake and storage.23–27 The presence of PPARγ during adipocyte differentiation is consistent between both chemically induced monolayer differentiation and 3D culture making it an ideal marker for this study.28,29 PPARγ functions as a transcription factor involved in adipogenesis as well as insulin sensitivity and metabolism.30–32
Considering the early time points showing accumulated lipid with Oil Red O stain, 0.5 week, it was especially important to demonstrate the presence of the PPARγ protein in the cells rather than focusing on gene expression analysis. Immunohistochemistry was selected as the method of detection. Moreover, it enabled demonstration of the success of IHC in this method of cell culture. Although analysis of mRNA levels coding for adipogenic markers would demonstrate that differentiation is stimulated at the gene expression level, extraction from the agarose culture is tedious and often results in degradation of the total RNA. Extraction was attempted for analysis of RNA levels, but results were not consistent between replicative experiments, and therefore, use of the RNA to produce cDNA for real-time PCR would not yield accurate results. Extraction of DNA and protein from cells grown in these systems in the past has been successful. Protein extraction has produced reliable and consistent results; however, a large number of high-density cultures are required to obtain enough protein for analysis. Here, we chose IHC as our method of protein detection because we were interested in detecting the expression of the differentiation factor at the protein level and because we were able to get multiple processed samples from 1 culture without modifying our protocol for higher density cultures or pooling replicative samples.
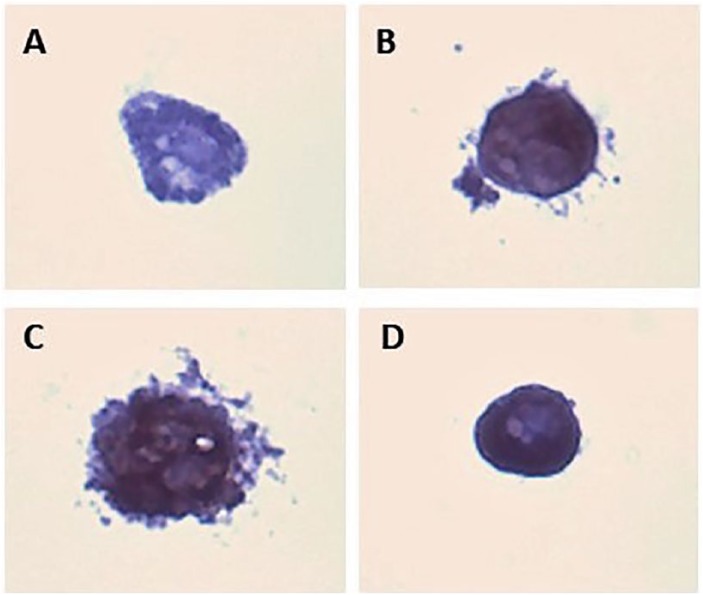
The results not only demonstrate successful use of the 3D agarose model for IHC, but also definitively detects the presence of PPARγ in the 3T3-L1 cells cultured via this novel adipogenesis 3D model. As our culture method allows for single-cell analysis, the slide produced included only sections of 1 culture, and we are able to visualize the brown DAB chromogen in each single cell section. This makes it a reliable method to conclusively identify the presence of the DAB brown chromogen in sections reactive with the PPARγ antibody. Quantitative analysis is not typical using this method. Figure 7A shows a 2.5-week cultured 3T3-L1 cell in FBS with PBS reaction rather than the primary PPARγ antibody, which represents a clear negative control with no detection of PPARγ, and only the blue hematoxylin stain is visible. The 0.5-week cell in panel B, however, was reacted with PPARγ primary antibody rather than the PBS control. 3,3′-Diaminobenzidine brown chromogen is clearly visible in addition to the blue hematoxylin stain in panel B, confirming the presence of PPARγ and active differentiation even at this early time point. Panel C shows a PPARγ-positive cell grown 1.5 weeks. Of note is the internal structure visible with darker regions indicating area positive for PPARγ. Although appearing smaller, the cell shown in panel D represents a 2.5-week culture. Peroxisome proliferator-activated receptor γ presence is visualized by the darker brown regions, again representing both brown DAB and blue hematoxylin. This more mature adipocyte has lipid droplets beginning to coalesce on 1 side of the cell. This coalescence is not as prominent in the 0.5 or 1.5 weeks cells.
Figure 7.
Immunohistochemistry (IHC) of 3T3-L1 cells grown in three-dimensional (3D) agarose. Cultures were processed for routine light microscopy, embedded in paraffin and sectioned at 5 µm. (A) Cell (2.5 weeks in culture) represents a negative control (no primary PPARγ antibody) prior to secondary reaction with HRP and DAB chromogen. (B) Cells grown for 0.5 weeks stained with antibody for PPARγ. Evidence of PPARγ demonstrated by the DAB chromogen (brown) is indicative of adipogenesis. (C) Cells grown for 1.5 weeks. (D) Cells grown for 2.5 weeks. Compared with control, all cells are positive for PPARγ and demonstrate adipogenesis. Slides were stained with hematoxylin for 30 seconds to make visible in the microscope. DAB indicates 3,3′-diaminobenzidine; HRP, horseradish peroxidase; PPARγ, peroxisome proliferator-activated receptor γ.
Discussion
Using a successful 3D agarose culture model previously described by Kinder and Aulthouse in 2004, we characterized the growth and differentiation process of 3T3-L1 preadipocytes in this model system. This system has proven effective at providing a permissive and physiologically relevant environment for anchorage-independent cells including chondrocytes and cancer cells.2,3,20
Full characterization of this model is novel for the 3T3-L1 preadipocytes and includes evaluation of change in morphology and non-chemically-induced spontaneous differentiation. This study demonstrates the effectiveness of this model for use by staining with Oil Red O, sectioning, and IHC. Evaluation of lipid content under both monolayer and 3D conditions was completed by analyzing the Oil Red O-stained cells. Differences in the effects of media serum selection on cell size and lipid accumulation were also characterized.
Typically, to initiate differentiation into adipocytes, cells in monolayer are treated with an induction cocktail consisting of 0.5 mM methylisobutylxanthine (IBMX), 1.0 µg/mL insulin, and 1.0 mM dexamethasone. Cells are first expanded in standard 1× DMEM with 10% BCS. Once cells have grown to approximately 50% to 70% confluence, the media is replaced with 1× DMEM and 10% FBS with the induction cocktail. Cells are typically cultured in this induction media for 3 to 5 days, at which point the growth media is exchanged with adipocyte maintenance media, comprising 1× DMEM, 10% FBS, and 1.0 µg/mL insulin. Cells are incubated in this media until adipogenesis is near completion. However, it is common that the cells do not reach full adipocyte maturation via this method. Clonal expansion sometimes occurs, which increases the cell density in monolayer and potentially jeopardizing long-term experiments.18 In addition, the cocktail added to induce chemical differentiation consists of chemicals designed to alter signaling pathways such that this differentiation is stimulated. Unfortunately, however, these chemicals interfere with signaling pathways, which overlap pathways of interest in metabolic studies, potentially increasing variables in an otherwise controlled experiment.
Morphologically, the chemically differentiated monolayer cells differ from the fibroblast-like preadipocytes. Chemically differentiated cells tend to round more than the undifferentiated cells and with time begin to accumulate lipid droplets, which can be detected using Oil Red O staining. These more rounded cells still have a flattened appearance when compared with cells grown in 3D cultures. Determination of lipid volume is limited to extraction of the Oil Red O dye by isopropanol, which is often compromised by extraneous dye in the plate. Increased rinses to remove extraneous dye increases the likelihood of dislodging the round cells, whose attachment has already been modified from the pre-adipocyte-shaped fibroblast-like cells. Although numerous successful studies have used monolayer culture because of its lower cost and less labor-intensive processes, users still recognize that deviation from physiological environment could alter experimental results.2–6,9
Adipocytes in vivo are round and able to expand with lipid accumulation, which is possible in the permissive 3D agarose environment and not in monolayer. Previously, cells have been shown to differentiate simply by being cultured in a 3D environment.20 Numerous 3D culture methods exist including magnetic levitation, matrigel, and scaffold. Three-dimensional culture methods that allow for formation of spheroid cultures and the use of scaffolds, such as hydrogels or cryogels, do form rounded cells as seen in vivo. However, unlike the described agarose method here, they produce a mass of cells, whereas agarose allows for individual cell observation. Moreover, these other 3D techniques, along with monolayer, require the use of an induction cocktail for differentiation, which is not required for the agarose single-cell suspension culture described in this article.10–17,28,33 In addition, these culture methods require substantial cost upfront and unique culturing supplies. Based on our desire to explore a more physiological 3D model at a low upfront cost, we tested our hypothesis that 3T3-L1 preadipocytes would spontaneously differentiate when placed in such an environment by culturing single cells suspended in agarose. We demonstrate here another cell type that can be grown using the 3D agarose culture technique. Morphology of the cells at various time points was examined and round cells and initial vacuole formation (potentially lipid droplet formation) were noted. These vacuoles were visible at as early as 24 hours post plating (data not shown). To confirm that the vacuole formation was indicative of lipid droplet formation, cultures were stained with Oil Red O. Moreover, the use of IHC and the detection of PPARγ in this system not only conclusively demonstrate differentiation, but also provide evidence of successful use of the model for routine histology, histochemistry, and immunocytochemistry staining.
Practical use of microscopy with the agarose method has allowed the calculation of lipid volume from the spherical volume calculation as described in “Materials and Methods” section. The positive correlation of lipid volume to cell size has been demonstrated for the first week of growth. Furthermore, the data demonstrate that at 2 weeks in FBS culture, cell size and lipid volume increase to a greater extent than in BCS culture cells, suggesting a significant serum-dependent effect highlighting the importance of using FBS for actively differentiating cells in this agarose culture system similar to what is recommended for other culture systems including both 3D and monolayer systems.
As insulin is traditionally added at a concentration of 1 µg/mL in the chemical induction protocol at the same time that the BCS is exchanged for FBS, the concentration of insulin is typically higher after chemical induction. This higher insulin concentration post differentiation induction in monolayer differs from the 3D method where FBS is used at plating in agarose and no additional insulin is added. This model therefore maintains a lower insulin level during differentiation than is required for the monolayer-based chemical differentiation. The lack of insulin concentration dependence on lipid volume suggests that an alternate process, likely the anchorage-independent environment allowing cell roundness to be maintained following monolayer trypsin release, responsible for the accumulation of lipid is of particular interest as adipocytes grow (and increase lipid volume) in an anchorage-independent environment physiologically. Of interest also is that this characteristic of the model makes it an ideal model to study insulin resistance.
This 3D agarose culture method provides a stable yet permissive environment for cell growth and differentiation in extended culture periods (as long as 3 weeks in this study). The agarose method limits cell overgrowth, via contact inhibition, and detachment, allowing numerous treatment regiments and exposure studies that could be expanded to include studies of epigenetic modifiers or development of treatment resistance. Unique when compared with monolayer, the 3D agarose method demonstrates that the 3T3-L1 preadipocytes will spontaneously commit to adipocyte differentiation based solely on being placed in this 3D permissive and anchorage-independent model. This significant change in cellular behavior occurs only as a result of the environmental change and speaks to the importance of 3D culture. This environmentally induced differentiation suggests that cell shape and morphology can influence gene expression and alter cell behavior. While it is common to consider how signaling and protein interactions can alter cell function and perhaps even cell morphology, it is less common to consider that morphology and shape alone can be responsible for these changes.
This study represents part 1 of a 2-part manuscript sequence that characterizes the use of the 3D agarose cell culture method for 3T3-L1 cells, which to our knowledge is the first time 3T3-L1 cells have been cultured and published using this method. This method describes an additional approach to add to the growing list of 3D culture techniques. It provides capabilities unique to the other systems and can be an effective and affordable method to examine culture at the single-cell level. Part 2 demonstrates the use of this 3D agarose method to study the metabolic effects of 3T3-L1 cells cultured in this model with treatment of cinnamon extract. These studies describe a reliable 3D agarose culture system that can be applied readily for other nutritional supplements and provide a system primed for the low-cost study of potential effects of nutritional or drug therapies on these cells with direct ties to diabetes, obesity, insulin insensitivity, and metabolic dysfunction.
Footnotes
Funding:The author(s) received no financial support for the research, authorship, and/or publication of this article.
Declaration of conflicting interests:The author(s) declared no potential conflicts of interest with respect to the research, authorship, and/or publication of this article.
Author Contributions: AA and AS are equally contributed first authors.
ORCID iD: Amy L Stockert  https://orcid.org/0000-0002-4127-2235
References
- 1. Maeno S, Niki Y, Matsumoto H, et al. The effect of calcium ion concentration on osteoblast viability, proliferation and differentiation in monolayer and 3D culture. Biomaterials. 2005;26:4847–4855. [DOI] [PubMed] [Google Scholar]
- 2. Stockert A, Kinder D, Christ M, Amend K, Aulthouse A. Improving the efficacy of cisplatin in colon cancer ht-29 cells via combination therapy with selenium. Austin J Pharmacol Ther. 2014;2:6. [Google Scholar]
- 3. Kinder DH, Aulthouse AL. MCF-7 breast cancer cell line grown in agarose culture for study of COX-2 inhibitors in three-dimensional growth system. Cancer Lett. 2004;205:49–53. [DOI] [PubMed] [Google Scholar]
- 4. Kenny PA, Lee GY, Myers CA, et al. The morphologies of breast cancer cell lines in three-dimensional assays correlate with their profiles of gene expression. Mol Oncol. 2007;1:84–96. [DOI] [PMC free article] [PubMed] [Google Scholar]
- 5. Birgersdotter A, Sandberg R, Ernberg I. Gene expression perturbation in vitro—a growing case for three-dimensional (3D) culture systems. Semin Cancer Biol. 2005;15:405–412. [DOI] [PubMed] [Google Scholar]
- 6. Ghosh S, Spagnoli GC, Martin I, et al. Three-dimensional culture of melanoma cells profoundly affects gene expression profile: a high density oligonucleotide array study. J Cell Physiol. 2005;204:522–531. [DOI] [PubMed] [Google Scholar]
- 7. Frith JE, Thomson B, Genever PG. Dynamic three-dimensional culture methods enhance mesenchymal stem cell properties and increase therapeutic potential. Tissue Eng Part C Methods. 2010;16:735–749. [DOI] [PubMed] [Google Scholar]
- 8. Abbott A. Biology’s new dimension. Nature. 2003;424:870. [DOI] [PubMed] [Google Scholar]
- 9. Liu H, Lin J, Roy K. Effect of 3D scaffold and dynamic culture condition on the global gene expression profile of mouse embryonic stem cells. Biomaterials. 2006;27:5978–5989. [DOI] [PubMed] [Google Scholar]
- 10. Kim JS, Choi JS, Cho YW. Cell-free hydrogel system based on a tissue-specific extracellular matrix for in situ adipose tissue regeneration. ACS Appl Mater Interfaces. 2017;9:8581–8588. [DOI] [PubMed] [Google Scholar]
- 11. Louis F, Pannetier P, Souguir Z, et al. A biomimetic hydrogel functionalized with adipose ECM components as a microenvironment for the 3D culture of human and murine adipocytes. Biotechnol Bioeng. 2017;114:1813–1824. [DOI] [PubMed] [Google Scholar]
- 12. Fischbach C, Spruß T, Weiser B, et al. Generation of mature fat pads in vitro and in vivo utilizing 3-D long-term culture of 3T3-L1 preadipocytes. Exp Cell Res. 2004;300:54–64. [DOI] [PubMed] [Google Scholar]
- 13. Kang X, Xie Y, Powell HM, et al. Adipogenesis of murine embryonic stem cells in a three-dimensional culture system using electrospun polymer scaffolds. Biomaterials. 2007;28:450–458. [DOI] [PubMed] [Google Scholar]
- 14. Qi D, Wu S, Kuss MA, et al. Mechanically robust cryogels with injectability and bioprinting supportability for adipose tissue engineering. Acta Biomater. 2018;74:131–142. [DOI] [PubMed] [Google Scholar]
- 15. Naderi N, Wilde C, Haque T, et al. Adipogenic differentiation of adipose-derived stem cells in 3-dimensional spheroid cultures (microtissue): implications for the reconstructive surgeon. J Plast Reconstr Aesthet Surg. 2014;67:1726–1734. [DOI] [PubMed] [Google Scholar]
- 16. Turner PA, Harris LM, Purser CA, Baker RC, Janorkar AV. A surface-tethered spheroid model for functional evaluation of 3T3-L1 adipocytes. Biotechnol Bioeng. 2014;111:174–183. [DOI] [PubMed] [Google Scholar]
- 17. Wang Y-H, Wu J-Y, Chou P-J, et al. Characterization and evaluation of the differentiation ability of human adipose-derived stem cells growing in scaffold-free suspension culture. Cytotherapy. 2014;16:485–495. [DOI] [PubMed] [Google Scholar]
- 18. Jefcoate CR, Wang S, Liu X. Methods that resolve different contributions of clonal expansion to adipogenesis in 3T3-L1 and C3H10T1/2 cells. Methods Mol Biol. 2008:456:173–193. [DOI] [PubMed] [Google Scholar]
- 19. Soderling SH, Beavo JA. Regulation of cAMP and cGMP signaling: new phosphodiesterases and new functions. Curr Opin Cell Biol. 2000;12:174–179. [DOI] [PubMed] [Google Scholar]
- 20. Aulthouse AL, Beck M, Griffey E, et al. Expression of the human chondrocyte phenotype in vitro. In Vitro Cell Dev Biol. 1989;25:659–668. [DOI] [PubMed] [Google Scholar]
- 21. Strober W. Trypan blue exclusion test of cell viability. Curr Protoc Immunol. 1997;21:A.3B.1-A.3B.2. [DOI] [PubMed] [Google Scholar]
- 22. Strober W. Trypan blue exclusion test of cell viability. Curr Protoc Immunol. 2015;111:A.3B.1-A.3B.3. [DOI] [PMC free article] [PubMed] [Google Scholar]
- 23. Guo X, Liao K. Analysis of gene expression profile during 3T3-L1 preadipocyte differentiation. Gene. 2000;251:45–53. [DOI] [PubMed] [Google Scholar]
- 24. Ambele MA, Dessels C, Durandt C, Pepper MS. Genome-wide analysis of gene expression during adipogenesis in human adipose-derived stromal cells reveals novel patterns of gene expression during adipocyte differentiation. Stem Cell Res. 2016;16:725–734. [DOI] [PubMed] [Google Scholar]
- 25. Prusty D, Park B-H, Davis KE, Farmer SR. Activation of MEK/ERK signaling promotes adipogenesis by enhancing peroxisome proliferator-activated receptor γ (PPARγ) and C/EBPα gene expression during the differentiation of 3T3-L1 preadipocytes. J Biol Chem. 2002;277:46226–46232. [DOI] [PubMed] [Google Scholar]
- 26. Targett-Adams P, McElwee MJ, Ehrenborg E, Gustafsson MC, Palmer CN, McLauchlan J. A PPAR response element regulates transcription of the gene for human adipose differentiation-related protein. Biochim Biophys Acta. 2005;1728:95–104. [DOI] [PubMed] [Google Scholar]
- 27. Spiegelman BM. PPAR-gamma: adipogenic regulator and thiazolidinedione receptor. Diabetes. 1998;47:507–514. [DOI] [PubMed] [Google Scholar]
- 28. Wang W, Itaka K, Ohba S, et al. 3D spheroid culture system on micropatterned substrates for improved differentiation efficiency of multipotent mesenchymal stem cells. Biomaterials. 2009;30:2705–2715. [DOI] [PubMed] [Google Scholar]
- 29. Mauney JR, Nguyen T, Gillen K, Kirker-Head C, Gimble JM, Kaplan DL. Engineering adipose-like tissue in vitro and in vivo utilizing human bone marrow and adipose-derived mesenchymal stem cells with silk fibroin 3D scaffolds. Biomaterials. 2007;28:5280–5290. [DOI] [PMC free article] [PubMed] [Google Scholar]
- 30. Xu H, Barnes GT, Yang Q, et al. Chronic inflammation in fat plays a crucial role in the development of obesity-related insulin resistance. J Clin Invest. 2003;112:1821–1830. [DOI] [PMC free article] [PubMed] [Google Scholar]
- 31. Miles PDG, Barak Y, He W, Evans RM, Olefsky JM. Improved insulin-sensitivity in mice heterozygous for PPAR-γ deficiency. J Clin Invest. 2000;105:287–292. [DOI] [PMC free article] [PubMed] [Google Scholar]
- 32. Ferré P. The biology of peroxisome proliferator-activated receptors: relationship with lipid metabolism and insulin sensitivity. Diabetes 2004;53:S43–S50. [DOI] [PubMed] [Google Scholar]
- 33. Turner PA, Tang Y, Weiss SJ, et al. Three-dimensional spheroid cell model of in vitro adipocyte inflammation. Tissue Eng Part A. 2015;21:1837–1847. [DOI] [PubMed] [Google Scholar]


