

Abstract
Background:
Roll-Your-Own tobacco (RYO) use is increasingly popular in many countries: it is generally cheaper than factory made cigarettes (FM) and smokers can further reduce costs by adjusting the amount of tobacco in each cigarette. However, the level of risk of RYO compared with FM cigarettes is similar, and does not meaningfully change with cigarette weight. We assessed the weight of tobacco in RYO cigarettes across jurisdictions with differing tobacco taxes/prices and over time.
Method:
Six waves of the International Tobacco Control 4-country longitudinal study of smokers and recent ex-smokers, providing 3,176 observations from exclusive RYO users covering 2006–15, are used to calculate the weight of tobacco used in RYO cigarettes in the USA, Canada, Australia, and the UK. Multilevel regression analyses were used to compare weights across countries, socio-demographic factors, and over time.
Results:
Smokers in the UK and Australia, where tobacco is relatively expensive, show higher levels of exclusive RYO use (25.8% and 13.8% respectively) and lower mean weights of tobacco per RYO cigarette (0.51g(sd 0.32g) and 0.53g(0.28g)), compared with both Canada and especially the USA (6.0% and 3.5%, and 0.76g(0.45g) and 1.07g(0.51g)). Smokers in the UK and Australia also exhibited a statistically significant year-on-year decrease in the mean weight of each RYO cigarette.
Conclusions:
Taxation of RYO should increase considerably in the UK and Australia, so that RYO and FM cigarettes are taxed equivalently to reduce RYO attractiveness and inequalities. Other measures to reduce the price differentials, including taxing RYO solely on weight, are also discussed.
Keywords: Tobacco, Roll-Your-Own, Hand-Rolled, Taxation, Weight, ITC
1. INTRODUCTION
Roll-Your-Own tobacco (RYO), also known as hand-rolled tobacco (HRT), is finely cut tobacco which is purchased by smokers, along with papers and filters, to self-assemble cigarettes by hand(HMRC, 2016). RYO cigarette smoking has increased in recent years in many countries, including the UK, USA, France, Germany, Spain, Italy, and South Africa (Ayo-Yusuf and Olutola, 2013; Brown et al., 2015; Fu et al., 2014; Gilmore et al., 2014; Hiscock et al., 2017; Koszowski et al., 2014; Lugo et al., 2015; Partos et al., 2017; Tarrazo et al., 2017; World Health Organization, 2011; Young et al., 2012), and continues to be used by a substantial number of smokers in others, including Canada, Australia, and New Zealand(Leatherdale and Burkhalter, 2012; Young et al., 2010; Young et al., 2012).
These trends appear to be influenced by price-conscious smokers who are attracted to RYO cigarettes in order to reduce the costs of smoking. Not only is RYO generally a cheaper product compared to factory made cigarettes (FM)(Gallus et al., 2014; Hiscock et al., 2017; Koszowski et al., 2014; López-Nicolás et al., 2013; Lugo et al., 2015; World Health Organization, 2011), but smokers can further reduce costs by adjusting the amount of tobacco included in each RYO cigarette. This is problematic, as past research, while limited, suggests that RYO cigarettes do not have a significantly different level of risk to FM cigarettes, and that risk does not meaningfully change with the weight of tobacco per cigarette(Darrall and Figgins, 1998; Koszowski et al., 2014; Laugesen et al., 2009; Shahab et al., 2008; Shahab et al., 2009). Harm appears primarily to be determined by regularly smoking, and the number of years doing so, and to a much lesser extent, by the number of cigarettes smoked(Begh et al., 2015; Centers for Disease Control Prevention, 2010; Hackshaw et al., 2018).
Since higher tobacco prices are widely regarded as being the most effective deterrent to smoking(Brown et al., 2014; Chaloupka et al., 2012; Ross et al., 2011; World Health Organization, 2011), the availability of and willingness to smoke cheap RYO cigarettes arguably diminishes the public health benefits of raising tobacco taxes. Price conscious smokers faced with increasingly costly tobacco can down-trade (i.e. switch) to relatively cheap RYO cigarettes, and/or adjust how they smoke RYO, instead of quitting(Hiscock et al., 2017; Partos et al., 2017; Ross et al., 2011). Indeed such behaviour will likely increase smoking-related socio-economic disparities since disadvantaged smokers, and those living in particular geographic areas have greater levels of RYO use(Gallus et al., 2014; Licht et al., 2011; Young et al., 2012).
Increased taxation on RYO would address its relative affordability, especially if it resulted in comparable costs of RYO and FM cigarettes. Not only should this make all tobacco taxation more effective (by addressing down-trading from FM to RYO), but it would also be consistent with harm-based taxation(Chaloupka et al., 2015). The complication is that in addition to possible taxation as a proportion of the retail price (ad valorem taxation), both FM and RYO cigarettes are both often subject to specific taxation. However specific taxation for FM cigarettes is generally based on the number of sticks in a pack, whereas RYO specific taxation is generally by weight of tobacco in a pouch with no account taken of the number of cigarettes that will be rolled (Government of Australia, 2017; Government of Canada, 2017; Government of the United Kingdom, 2017; U.S. Department of the Treasury, 2018; World Health Organization, 2011). Equivalisation of tax per cigarette therefore requires an understanding of the amount of tobacco used in each RYO cigarette. Unfortunately, research on this topic is very limited.
Only seven studies have previously considered the weight of tobacco used in RYO cigarettes(Darrall and Figgins, 1998; Gallus et al., 2013; Gallus et al., 2014; Koszowski et al., 2014; Laugesen et al., 2009; Rosenberry et al., 2013; Shahab et al., 2008). In all of these, participant numbers were low (n=26 to 192), and predominantly male (71% to 100%). Furthermore, six out of the seven sampled only from one country (NZ, Italy, UK, USA). Mean weights were found to be: 0.497g in NZ in 2009(Laugesen et al., 2009); 0.74 g (±0.35g) in Italy during 2011–12(Gallus et al., 2013); in the UK 0.505g in 1998 (range 0.328g to 0.818g)(Darrall and Figgins, 1998) and 0.511g (95% CI 0.476g to 0.548g) in 2008(Shahab et al., 2008); and in the USA 0.450g in 2013 (range 0.18g-0.94g)(Rosenberry et al., 2013), and 0.4g (± 0.2g) in 2014(Koszowski et al., 2014). The 2014 study by Gallus et al.(2014) (n=192) finds considerable variation in the self-reported median weight of tobacco used across 18 European countries (0.48g England - 1.15g Spain), and also within each country (e.g. England 0.34g – 0.71g interquartile range). However, age, sex, education and smoking intensity were found to have no statistically significant impact, which might be due to the small sample size and significant country variations reported.
In light of this, the objectives of this paper are four-fold. First, to investigate the weight of tobacco in RYO cigarettes in Australia, Canada, UK, and USA. Second, to determine whether more expensive tobacco is associated with RYO cigarettes with less tobacco, since Australia and the UK are markets where tobacco has higher taxes and had thus been relatively highly priced, while Canada and particularly the USA, are markets where tobacco has been cheaper (and consequently more affordable)(Blecher and Van Walbeek, 2004; Blecher and Van Walbeek, 2009; Eriksen et al., 2013; ITC Project, 2014; Shang et al., 2013). Third, to assess if the weight of tobacco in RYO cigarettes changes over time. Fourth, to examine socio-economic variations in the weight of RYO cigarettes, to help understand the contribution of RYO to smoking-related socio-economic disparities.
2. METHODS
2.1. Participants
The International Tobacco Control Four Country study (ITC-4C) has collected longitudinal cohort data from the UK, Australia, Canada, and USA since 2002. Participants are initially recruited as current adult smokers (smoking at least monthly at the time of the survey, and have smoked at least 100 cigarettes in their lifetime), and they are followed up for subsequent surveys, even if they have quit smoking. At each survey, generally a new replenishment sample of current smokers is also recruited to compensate for attrition. The ITC-4C uses a stratified random sampling design to ensure broad representativeness by age, sex, and geographical location within each country. Further details about ITC-4C methodology are published elsewhere(Fong et al., 2006; Thompson et al., 2006).
Six surveys conducted between 2006 and 2015 were analysed here because questions relating to the weight of RYO were not included in prior surveys. 19,277 individuals took part, providing 42,238 observations over the six surveys. The data collection period for each survey ranged over a number of months and varied by country, such that for some years, data were available for some countries but not others (see supplementary Table S1 for survey collection periods by country)2. No data were collected at survey 6 for Canada or the USA, and there were no data from 2012 for any country. Due to the longitudinal structure, it was possible for the same individual to provide observations at multiple surveys.
2.2. Exclusion criteria
The study focused only on current exclusive daily RYO smokers. Of the total 19,277 individuals who took part and provided 42,238 observations over the six surveys, 18,048 (providing 38,445 observations) were therefore excluded; namely: anyone who was currently quit or had unknown smoking status when surveyed (n = 5,830, observations = 9,594); smoked exclusively FM cigarettes (n = 12,813, observations = 25,573); smoked a mixture of FM cigarettes and RYO (n = 2,121, observations = 2,919); did not report the type of tobacco they smoked (n = 192, observations = 202); or did not smoke on a daily basis (n = 114, observations = 157). Those who smoked a mixture were excluded because the relevant questions to determine weight per RYO cigarette were not consistently asked of these participants. This left 1,924 individuals (providing 3,793 observations).
Of this sample we excluded a further 410 observations for missing information, 121 observations for likely misreporting of RYO weights, and 86 observations for incomplete data on the remaining variables of interest. We adopted the criteria used by Gallus and colleagues(Gallus et al., 2014) to identify likely misreporting of weight-related information, and excluded anyone with a weight per cigarette below 0.1 grams or over 3.0 grams, and also excluded anyone with missing data on any of the component variables required to calculate weights per cigarette. The final sample therefore consisted of 1,639 individuals who provided 3,176 observations over the six survey waves (with an average of 1.9 observations per participant), on which we had complete and valid data on all included variables of interest (see below). Characteristics for this sample are displayed in Table 1.
Table 1.
Sample characteristics by country.
| Total | United Kingdom | Australia | Canada | USA | |
|---|---|---|---|---|---|
| Total sample size (number of observations) | 1639 (3176) | 821 (1770) | 498 (935) | 168 (296) | 122 (175) |
| Observations by year | |||||
| 2006 | 456 | 233 | 132 | 75 | 16 |
| 2007 | 702 | 412 | 197 | 70 | 23 |
| 2008 | 463 | 271 | 128 | 41 | 23 |
| 2009 | 171 | 104 | 26 | 29 | 12 |
| 2010 | 414 | 252 | 103 | 39 | 20 |
| 2011 | 42 | 0 | 25 | 4 | 13 |
| 2012 | 0 | 0 | 0 | 0 | 0 |
| 2013 | 461 | 252 | 167 | 21 | 21 |
| 2014 | 424 | 246 | 157 | 17 | 4 |
| 2015 | 43 | 0 | 0 | 0 | 43 |
| Mean Weight (grams) per cigarette (sd) | 0.57 (0.37) | 0.51 (0.32) | 0.53 (0.28) | 0.76 (0.45) | 1.07 (0.51) |
| Mean TTFC (sd) | 46 (92) | 47 (91) | 48 (96) | 44 (103) | 32 (50) |
| Mean CPD (sd) | 17.7 (9.7) | 16.9 (9.4) | 18.1 (10.0) | 20.4 (9.7) | 19.1 (10.1) |
| Sex (%) | |||||
| Female | 38.1 | 38.9 | 35.4 | 38.9 | 42.9 |
| Male | 61.9 | 61.1 | 64.6 | 61.2 | 57.1 |
| Age group (%) | |||||
| 18 – 39 years | 20.9 | 22.5 | 19.3 | 17.2 | 20.0 |
| 40 – 54 years | 41.6 | 39.9 | 46.4 | 38.2 | 37.7 |
| 55 years and over | 37.5 | 37.5 | 34.3 | 44.6 | 42.3 |
| Ethnicity (%) | |||||
| White, English-speaking | 95.4 | 97.9 | 93.3 | 89.1 | 91.2 |
| Not white/ not English-speaking | 4.6 | 2.2 | 6.7 | 10.9 | 8.8 |
| Education (%) | |||||
| Low | 58.0 | 58.6 | 57.5 | 57.8 | 53.7 |
| Moderate | 26.9 | 25.8 | 27.5 | 26.7 | 34.3 |
| High | 15.2 | 15.5 | 15.0 | 15.5 | 12.0 |
| Income (%) | |||||
| Low | 38.4 | 35.9 | 38.2 | 47.3 | 49.1 |
| Moderate | 32.5 | 33.6 | 30.0 | 31.8 | 36.0 |
| High | 20.7 | 20.1 | 25.7 | 16.5 | 12.6 |
| Not disclosed | 8.5 | 10.5 | 6.2 | 7.4 | 2.3 |
Note: USA = United States of America; RYO = roll-your-own tobacco; m = mean, sd = standard deviation; TTFC = time to first cigarette; CPD = cigarettes smoked per day. Percentages are percentage of observations not individuals.
A missing data comparison between the 1,924 individuals suitable for the RYO study, and the final sample of 1,639 individuals indicated that the final sample featured participants who were significantly more likely to be: from Australia and the UK; male; younger; higher income; white with an English-speaking background; and to have a shorter time to first cigarette in the morning (TTFC) (indicative of higher nicotine dependence). Statistical analyses controlled for all these variables. No significant differences between the samples were found on education level (see supplementary Table S2)3.
2.3. Measures
Weight of tobacco per cigarette
Cigarette weights were based on participants’ last reported tobacco purchase, where they were asked to indicate the weight of the pouch of RYO they had last purchased. They were also asked how many days it usually took them to smoke this amount. Finally, they were asked how many cigarettes, on average, they smoked per day (CPD). This information was used to calculate the weight per cigarette, in grams, by dividing the total pouch weight by the days taken to smoke it and by their CPD. Our calculations of weight per cigarette were based on participants’ most recent purchase because the relevant data were only available for this question. However, participants were also asked whether their most recent purchase was the same as their usual or current brand, and 93.3% of our sample reported that it was, indicating that the last purchase is a good approximation of usual purchase patterns.
Time
To examine changes in the weight per cigarette over time, we allocated each observation to the calendar year of the survey date (see supplementary Table S1)4. The number of observations for each year for each country are provided in Table 1. Time (years) was treated as a continuous variable for statistical analyses.
Nicotine dependence
We used the time (in minutes) taken to smoke the first cigarette of the day after waking (TTFC) as an indicator of nicotine dependence, with shorter times indicating higher dependence. This was treated as a continuous variable for analysis. We were not able to use other common measures of dependence such as the CPD or the Heaviness of Smoking Index (HSI, which is derived using CPD) because our measure of the weight of tobacco per cigarette was derived using CPD.
Socio-demographics
Socio-demographic measures included sex (female or male), age group (18–39 years, 40–54 years, or 55 or over), ethnicity (white/not-white in Canada, USA, and UK; speaks only English at home versus English is a secondary language in Australia), highest level of education attained (low, moderate, and high), and income (low, moderate, high, or not disclosed). We combined 18–24 year olds with the 25–39 year old group as the former only comprised 2.9% of observations. Education was stratified slightly differently in each country due to differing education systems, but broadly corresponded to low: high-school or less, moderate: trade school, technical or community college or some university but no degree, and high: completed university. Income was based on annual household income before tax, and stratified as low: under $30,000 (Canada, USA and Australia) or under £15,000 (UK), moderate: $30,000 - $59,000 (Canada, USA and Australia) or £15,000 - £40,000 (UK), or high $60,000 and above (Canada, USA, and Australia) or £40,001 and above (UK). Participants who did not disclose their income (around 8.5% of the sample) were retained as a separate valid category.
2.4. Analyses
Unfortunately, the number of observations for Canada and the USA was too low (see Table 1) to allow for any reliable statistical analyses of trends in RYO weights over time. To compare the tobacco weights per cigarette in the four countries, we therefore pooled the data over time (across all survey waves). We conducted a multilevel linear regression analysis with weight as the outcome and country as the predictor, clustered over individuals to account for the correlation of multiple responses provided by the same individual over different surveys. This analysis controlled for TTFC and all socio-demographic variables, and used maximum likelihood estimation with a robust variance estimator.
To test for changes in tobacco weights over time, as well as the effects of socio-demographic differences, we only considered the UK and Australia (1,349 individuals providing 2,705 observations), where sample sizes were sufficient to allow for reliable estimations. As previously, we conducted multilevel linear regression analyses clustered over individuals, with maximum likelihood estimation and robust variance estimators. The outcome variable was weight of tobacco per cigarette, and the predictor variables were time (calendar year), country (UK versus Australia), TTFC, and the socio-demographic variables. We first examined the unadjusted univariate effects of each predictor variable and then looked at the fully-adjusted multivariate effects where all predictors were included simultaneously.
3. RESULTS
Exclusive use of RYO was relatively low in our sample for the USA (3.5% of our USA smokers) and Canada (6.0%), but higher in Australia (13.8%) and especially the UK (25.8%). When pooled over the survey period (2006 to 2015), the mean weight of tobacco per RYO cigarette was highest in the USA at 1.07 grams (sd = 0.51 grams), intermediate in Canada (m = 0.76 grams, sd = 0.45 grams), and lowest in Australia (m = 0.53 grams, sd = 0.28 grams) and the UK (m = 0.51 grams, sd = 0.32 grams). The results of the multilevel linear regression predicting weight by country and fully adjusted for TTFC and socio-demographic variables (see Table 2) indicated that all pairwise country differences were statistically significant, except for Australia and the UK, where the weight of tobacco per RYO cigarette was comparable.
Table 2.
Multilevel linear regression predicting the weight of tobacco per roll-your-own cigarette by country, pooled over time.
| Beta | SE (Beta) | p | ||
|---|---|---|---|---|
| Country comparisons | Overall effect: χ2 (3) = 223.5, p < .0001 | |||
| USA (ref) vs. Canada | −0.31 | 0.055 | < .001 | |
| USA (ref) vs. United Kingdom | −0.58 | 0.045 | < .001 | |
| USA (ref) vs. Australia | −0.56 | 0.045 | < .001 | |
| Canada (ref) vs. UK | −0.27 | 0.034 | < .001 | |
| Canada (ref) vs. Australia | −0.25 | 0.035 | ||
| < .001 | ||||
| Australia (ref) vs. UK | 0.021 | 0.014 | 0.142 | |
Note: SE = standard error; USA = United States of America; ref = reference category. Effects are fully-adjusted multivariate effects, controlling for time to first cigarette, sex, age, ethnicity, education, and income (see text for details of covariates).
For Australia and the UK, results of the multilevel linear regression analysis of tobacco weights over time (see Table 3) indicated a statistically significant decrease of around 0.01 grams per RYO cigarette per year (equivalent to a decrease of about 2% of the average weight per cigarette). This finding persisted even after controlling for TTFC and socio-demographics. The mean tobacco weight per cigarettes dropped from 0.59 grams (sd = 0.42 grams) for the UK and 0.59 grams (sd = 0.29 grams) for Australia in 2006, to 0.46 grams (sd = 0.25 grams) for the UK, and 0.48 grams (sd = 0.26 grams) for Australia in 2014. No significant differences were observed in weights between Australia and the UK. The mean tobacco weights per cigarette over time for the UK and Australia are presented alongside the predicted means from the fully adjusted multilevel linear regression model in Figure 1.
Table 3.
Multilevel linear regression predicting the weight of tobacco per roll-your-own cigarette. (N = 1349, observations = 2705)
| Univariate (unadjusted) effects | Multivariate (fully adjusted) effects | |||||||
|---|---|---|---|---|---|---|---|---|
| Beta | SE (Beta) | p | Beta | SE (Beta) | p | |||
| Time (calendar year) | −0.011 | 0.0021 | < .001 | −0.014 | 0.0021 | < .001 | ||
| Country | ||||||||
| United Kingdom | ref | --- | --- | ref | --- | --- | ||
| Australia | −0.023 | 0.014 | 0.100 | −0.026 | 0.014 | 0.057 | ||
| Time To First Cigarette (mins) | 0.00024 | 0.000089 | 0.006 | 0.00024 | 0.000083 | 0.004 | ||
| Sex | ||||||||
| Female | ref | --- | --- | ref | --- | --- | ||
| Male | −0.0049 | 0.014 | 0.735 | −0.020 | 0.014 | 0.175 | ||
| Age group | Overall effect: χ2 (2) = 26.6, p < .0001 | Overall effect: χ2 (2) = 42.3, p < .0001 | ||||||
| 18 – 39 years | ref | --- | --- | ref | --- | --- | ||
| 40 – 54 years | 0.046 | 0.015 | 0.002 | 0.052 | 0.015 | 0.001 | ||
| 55 years and over | 0.088 | 0.017 | < .001 | 0.12 | 0.018 | < 0.001 | ||
| Ethnicity | ||||||||
| White, English-speaking | ref | --- | --- | ref | --- | --- | ||
| Not white/ not English-speaking | 0.034 | 0.041 | 0.398 | 0.041 | 0.040 | 0.309 | ||
| Education | Overall effect: χ2 (2) = 1.12, p = 0.573 | Overall effect: χ2 (2) = 0.18, p = 0.913 | ||||||
| Low | ref | --- | --- | ref | --- | --- | ||
| Moderate | −0.016 | 0.016 | 0.319 | −0.0062 | 0.015 | 0.685 | ||
| High | 0.0007 | 0.018 | 0.969 | −0.00022 | 0.019 | 0.991 | ||
| Income | Overall effect: χ2 (3) = 4.93, p = 0.177 | Overall effect: χ2 (3) = 9.58, p = 0.023 | ||||||
| Low | ref | --- | --- | ref | --- | --- | ||
| Moderate | 0.016 | 0.015 | 0.289 | 0.033 | 0.015 | 0.032 | ||
| High | 0.043 | 0.020 | 0.029 | 0.060 | 0.021 | 0.004 | ||
| Not disclosed | 0.0079 | 0.024 | 0.741 | 0.019 | 0.024 | 0.428 | ||
Note: SE = standard error; TTFC = time to first cigarette; mins = minutes.
Figure 1.
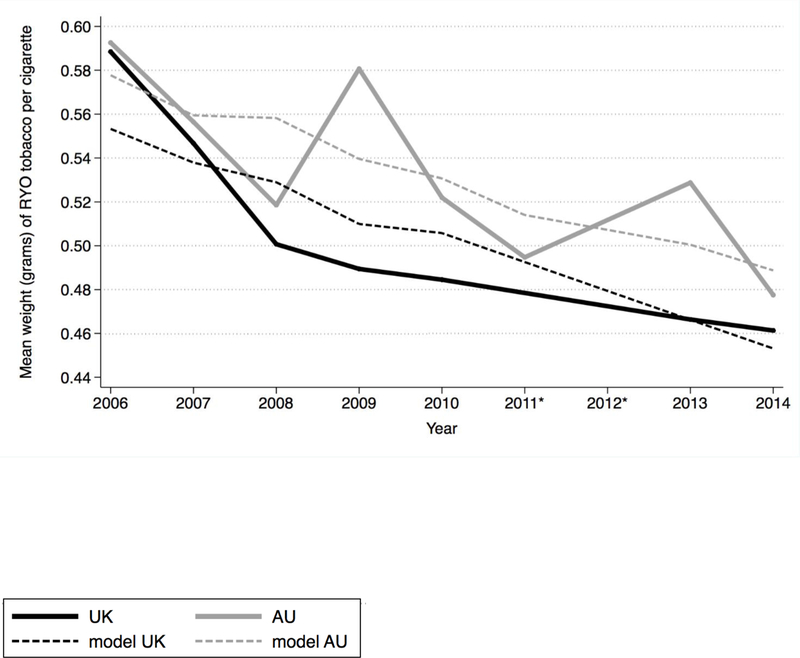
Mean weight of tobacco (in grams) per roll-your-own cigarette over time for the United Kingdom (UK) and Australia (AU), alongside the model predicted values from a fully-adjusted multilevel linear regression, controlling for time to first cigarette, sex, age, ethnicity, level of education, and income. *Note: no data was collected from the UK in 2011 and no data collected from the UK or Australia in 2012. Sample sizes from Australia for 2009 and 2011 were low (n = 26 and n = 25, respectively, see text and Table 1 for more details).
Table 3 also presents the results of the multilevel linear regression analyses of the effects of nicotine dependence (TTFC) and socio-demographics on tobacco weights per RYO cigarettes. Tobacco weights were significantly associated with TTFC, with weights increasing by around 0.00024 grams for every extra minute (or 0.014 grams for very extra hour) participants took to smoke their first cigarette after waking. This effect persisted even after controlling for time, country, and socio-demographic variables. There was also a significant association between age and tobacco weights, even after controlling for TTFC, with older participants using more tobacco than younger ones. For example, smokers aged 55 or older used about 0.12 grams more tobacco per cigarette than those aged under 40 years (see also Supplementary Figure S2)5. Finally, although the unadjusted effects of income on tobacco weights were not statistically significant overall, after controlling for time, country, TTFC, and other socio-demographics in the fully adjusted model, there was a significant effect of income on tobacco weights. Compared with those with low income, participants with moderate and high income used an average of 0.033 grams and 0.060 grams, respectively, more tobacco per cigarette (see supplementary Figure S1)5. There were no significant effects of sex, ethnicity, or level of education on the weight of tobacco per RYO cigarette, in either the unadjusted or fully-adjusted analyses.
4. DISCUSSION
Our results imply that smokers are likely adjusting the way they use RYO in order to make RYO cigarettes more affordable. Smokers in the UK and Australia, where there are high tobacco taxes/prices, are using less tobacco per RYO cigarette than those in USA and Canada, where tobacco taxes/prices are generally lower. The number of RYO cigarettes smoked per day is similar across all four countries, although the UK has the lowest at 16.9 and Canada the highest at 20.4, which suggests that smokers in high tobacco price countries are smoking fewer RYO cigarettes each containing less tobacco. Furthermore, our calculated trends over time suggest that consumers in Australia and the UK are further reducing the weight of tobacco in RYO cigarettes. The observed practice of reducing tobacco weights by about 2% per year will have offset, to some extent, any annual tax increases designed to make tobacco less affordable. In the UK for instance, annual tax increases on RYO have been about 2% above inflation since March 2009, with significantly bigger increases only taking place in March 2011 and 2012 (Hiscock et al., 2017). This implies the action of smokers has ensured that the real cost of smoking a RYO cigarette will not have changed significantly during this time. Policy makers need to take note, especially since smokers with the lowest incomes are smoking RYO cigarettes with the least amount of tobacco, thereby potentially contributing to the higher rates of smoking among low income groups.
The results also show that those smokers who are younger and more addicted (i.e. level of nicotine dependence) roll smaller cigarettes. Those more dependent on nicotine might be using less tobacco in order to allow them to smoke more cigarettes per day, whilst age could relate to levels of disposable income (which was likely not fully captured in our data), or might simply be indicative of rolling habits. Younger smokers are more likely to have started when tobacco was already heavily taxed, so could have immediately adopted expenditure minimising behaviour. Older smokers might have started at a time when tobacco was more affordable and hence developed the habit of using more tobacco per cigarette. Indeed, given both characteristics are important sources of health inequalities between groups, not addressing the affordability of RYO cigarettes risk such inequalities increasing over time.
Finally, it is possible that some smokers also inaccurately believe that smaller cigarettes are healthier given it has previously been found that a significant number of smokers believe RYO to be more ‘natural’ and less harmful (Devlin et al., 2003; Young et al., 2006; Young et al., 2010; Young et al., 2012).
4.1. Strengths and Limitations
The large scale of the ITC dataset allowed us to explore the weight of tobacco in RYO cigarettes over four countries, two of which (Canada and Australia) have not previously been considered. For the first time we also investigated how this changed over time and was influenced by smoker characteristics. However, even with this dataset with significantly more observations than previous studies, data limitations meant we were unable to consider how the weight of tobacco changed over time in Canada and the USA. The ITC data were also limited in that data were not available for all countries in all years. Self-reported details of smoking behaviour were used to calculate estimates of tobacco weights used in RYO cigarettes rather than weighing rolled cigarettes. The estimates might be somewhat imprecise as participants were not asked about any sharing of pouches, although any sharing between individuals might balance out over time thereby mitigating any such effect. Imprecision might also result from poor estimation/rounding errors on behalf of smokers, which could be greater for those using smaller pouches. Both of these factors may differ by country.
Our results are generally consistent with the limited amount of previous research in this area. Indeed, the tobacco industry also seems to have a similar understanding of the weight of tobacco RYO smokers use, as combination packs of RYO and rolling papers sold in the UK are very consistent with our findings. As of March 2017 we found that 30g plain packs of RYO (the smallest legally possible) come with 60 rolling papers, implying 0.5g of tobacco per cigarette.
The outlier is our findings for the USA where the mean of 1.07 grams (sd = 0.51 grams) of tobacco per RYO cigarette is notably higher than previous estimates of 0.450g in 2013 (range 0.180g-0.940g)(Rosenberry et al., 2013), and 0.4g (± 0.2g) in 2014(Koszowski et al., 2014). However, our result is in line with previous results observed by Gallus for countries such as Spain and Finland(Gallus et al., 2014), so it is certainly plausible. Nevertheless, interpretations of our findings for the USA should be mindful of the small sample sizes, both herein and the previous studies, and also that our results are derived from an aggregation across several survey waves which might be masking a change in RYO usage over time.
4.2. Implications and Policy Responses
Tobacco taxation will likely be most effective when there is broadly equivalent taxation of FM and RYO on a per cigarette basis. However, our investigation of the weight of RYO used to make cigarettes suggest current taxation is significantly lower on RYO cigarettes to varying degrees in the four countries considered herein. For instance, in the UK from 22nd November 2017 the minimum excise tax on 1,000 FM cigarettes is £280.15, but £221.18 per kg of RYO(Government of the United Kingdom, 2017), which at 0.46g per cigarette (our most recent estimate), is enough tobacco for approximately 2,174 cigarettes. On a per cigarette basis this implies a tax of £0.28 per FM cigarette but just £0.10 per RYO cigarette, just over a third the level. A similar but less extreme situation exists in Australia, where as of September 2017, FM cigarettes are federally taxed at AUS$0.699 per stick but each RYO cigarette of 0.48g is only taxed at AUS$0.433, just over half the level(Government of Australia, 2017). Such differentials might help explain the relative popularity of smoking RYO in these two countries.
In Canada, as of 23rd March 2017, federal tax was C$0.1078 per FM cigarette while each RYO cigarette of 0.76g was similarly taxed at C$0.1024(Government of Canada, 2017). However, whilst the federal government has broadly equivalised taxation per cigarette, taxation by the provinces is more mixed. In British Columba and Ontario for instance, FM cigarettes are taxed at the same rate as a gram of cut tobacco, suggesting an under-taxing of each RYO cigarette(British Columbia, 2018; Ontario, 2017). Other provinces, as such Alberta or Newfoundland and Labrador tax a gram of tobacco more heavily to varying degrees, thereby joining the federal government in implicitly recognising the size of an average RYO cigarette and hence broadly equivalising taxation per cigarette(Alberta, 2017; Newfoundland and Labrador, 2016). A similar situation exists in the USA. The federal government taxes ‘small cigarettes’ at US$0.0505, and each RYO cigarette of 1.07 grams, at $0.05845, thereby broadly equilivalsing taxation per cigarette(U.S. Department of the Treasury, 2018). However, at state level RYO seems to be generally taxed as a proportion of the retail price(California State, 2017; New York State, 2018), which risks a lower level of taxation for RYO cigarettes compared to FM cigarettes, given the generally lower selling price. Nevertheless, the more equivalent levels of taxation in both the USA and Canada might help explain the lower levels of RYO use in these two countries, although the overall lower levels of tobacco taxes/prices are probably also a factor. The differential availability of different forms of illicit tobacco (e.g. very cheap untaxed FM cigarettes or loose tobacco) may also be influencing RYO prevalence in different countries.
An obvious policy response where taxes are clearly not broadly equivalised per cigarette (e.g. the UK and Australia), would be a considerable increase in the rate of RYO taxation. Higher taxation of RYO would reduce its attractiveness as a more affordable product, and would help address the socio-economic inequalities of smoking since disadvantaged smokers, the most likely users of RYO, would be more liable to give up. Indeed, a sudden large increase of RYO tax would probably to be the most effective at encouraging quitting, as smokers would be very unlikely to be able to undermine tax policy by immediately proportionally reducing the tobacco weight of RYO cigarettes. If, for instance, UK RYO taxation were to double (to bring it more in line with FM cigarettes), then it is improbable that the weight of RYO per cigarette would instantly halve. Small but frequent tax increases on RYO taxation would likely be less effective as smokers could offset the tax increase by gradually shrinking the amount of tobacco used per cigarette. There must of course be a practical limit to how small RYO cigarettes can ultimately shrink, but there is no evidence to suggest this limit has been reached, hence larger unexpected tax increases should be favoured. The impact on illicit tobacco use of a RYO tax rise would need to be monitored and measures to strengthen enforcement implemented if appropriate.
Equivalisation of taxes will always be somewhat imperfect given that smokers roll different sizes of cigarettes from RYO. If, for instance, tax were equivalised with FM using the mean weight of RYO per cigarette it would result in a significant proportion of the market (i.e. those rolling thicker cigarettes) paying more tax per RYO cigarette than on a FM cigarette, while another proportion would pay less (i.e. those rolling thinner cigarettes). However, this variation need not be considered to be a barrier to action, since RYO smokers already pay varying amounts of tax on each cigarette given the weight of tobacco used. The point is to make the tax broadly similar in typical use, so that RYO is not considered to be a significantly cheaper option. Furthermore, options exist as to how taxes might be equivalised. For instance a government definition of typical use could be informed by the mean, median, and/or mode weight of tobacco used in RYO cigarettes, which could be sampled from time to time in real-world conditions and/or taken from data collected via existing surveys, to establish general trends. This would capture any responses in terms of rolling behaviour, or wider changes such as switching between RYO and FM. Policy makers would need to take care that any survey is appropriately conducted at appropriate intervals, the results are interpreted correctly, and that any established equivalisation formula is not slavishly followed with perverse results.
All countries need to be mindful of ensuring equivalent taxation of RYO, even those (such as Canada and the USA) with relatively low levels of current RYO use. Increasing FM cigarette taxation without equivalent increases on other tobacco products risks substituting one type of cigarette for another, rather than broadly discouraging smoking.
Recent research has revealed that the tobacco industry is now segmenting RYO alongside FM cigarettes(Hiscock et al., 2017), which simultaneously allows them to maximise profits with more expensive brands and offer affordable tobacco to the most price conscience smokers. This also allows them to vary the extent to which they pass on higher tobacco duty. Such findings suggest it is likely that higher taxes on RYO might not affect all brands uniformly, and also that the impact on retail price would be introduced gradually over a number of months to cushion the price shock to smokers. Therefore as well as increasing RYO duty significantly, limits should also be placed on the number of times retail prices can be changed in a year in order to make sure smokers of RYO are fully exposed to the change in duty. Furthermore, taxation of RYO as a proportion of its retail price (as happens in some US states) enhances the ability of the tobacco industry to segment the RYO market as not all brands are subject to equal amounts of taxation. As such taxation by weight of RYO should be favoured over taxing as a proportion to price.
Supplementary Material
HIGHLIGHTS.
Smokers likely adjust the way they use Roll Your Own tobacco to keep it affordable
Lower mean weight of RYO cigarettes was found in high tobacco price countries
2% yearly reduction in mean weight of RYO cigarettes in Australia and the UK
RYO use was lower in countries that equivalize RYO and factory made cigarette taxes
RYO cigarettes significantly undertaxed relative to factory made in Australia/UK
Acknowledgements:
We would like to acknowledge our colleagues from the US, Canada, and Australia involved in the International Tobacco Control Policy Evaluation Project.
Funding: This project is funded by the National Institute for Health Research (NIHR) Public Health Research (PHR) programme (grant number 13/43/58). NIHR is funded by the UK Department of Health to improve the health and wealth of the nation through research. The ITC project is funded by the following grants: Canadian Institutes of Health Research (57897, 79551, 115016), Robert Wood Johnson Foundation (045734), Cancer Research U.K. (C312/A326, C312/A6465, C312/A11039, C312/A11943), Commonwealth Department of Health and Ageing, Canadian Tobacco Control Research Initiative (014578), National Health and Medical Research Council of Australia (265903, 450110, APP1005922), U.S. National Cancer Institute (P50 CA111236, R01 CA100362), Ontario Institute for Cancer Research (Senior Investigator Award).
Disclaimer: The views and opinions expressed therein are those of the authors and do not necessarily reflect those of the Public Health Research programme, NIHR, NHS, or the Department of Health. TRP, AG, RH, and AM are members of the UK Centre for Tobacco & Alcohol Studies, a UK Clinical Research Collaboration Public Health Research: Centre of Excellence, whose work is supported by funding from the Medical Research Council, British Heart Foundation, Cancer Research UK, Economic and Social Research Council, and the National Institute for Health Research under the auspices of the UK Clinical Research Collaboration (MR/ K023195/1). The responsibility for any errors lie solely with the authors.
Footnotes
Ethics: All waves of the ITC study have received ethical approval from the institutional review board/ research ethics committee at King’s College London (UK).
Supplementary material can be found by accessing the online version of this paper at http://dx.doi.org and by entering doi: …
Supplementary material can be found by accessing the online version of this paper at http://dx.doi.org and by entering doi:
Supplementary material can be found by accessing the online version of this paper at http://dx.doi.org and by entering doi:
Supplementary material can be found by accessing the online version of this paper at http://dx.doi.org and by entering doi:
Supplementary material can be found by accessing the online version of this paper at http://dx.doi.org and by entering doi:
5. REFERENCES
- Alberta, 2017. Current and Historic Alberta Tax Rates (from January 1, 2000 to current) http://www.finance.alberta.ca/publications/tax_rebates/rates/hist1.html#tobacco. (Accessed 23rd January 2018.
- Ayo-Yusuf OA, Olutola BG, 2013. ‘Roll-your-own’cigarette smoking in South Africa between 2007 and 2010. BMC Public Health 13, 597. [DOI] [PMC free article] [PubMed] [Google Scholar]
- Begh R, Lindson-Hawley N, Aveyard P, 2015. Does reduced smoking if you can’t stop make any difference? BMC Med 13, 257. [DOI] [PMC free article] [PubMed] [Google Scholar]
- Blecher E, Van Walbeek C, 2004. An international analysis of cigarette affordability. Tobacco Control 13, 339–346. [DOI] [PMC free article] [PubMed] [Google Scholar]
- Blecher EH, Van Walbeek CP, 2009. Cigarette affordability trends: an update and some methodological comments. Tob Control 18, 167–175. [DOI] [PubMed] [Google Scholar]
- British Columbia, 2018. Tobacco Tax https://www2.gov.bc.ca/gov/content/taxes/sales-taxes/tobacco-tax. (Accessed 23rd January.
- Brown AK, Nagelhout GE, van den Putte B, Willemsen MC, Mons U, Guignard R, Thompson ME, 2015. Trends and socioeconomic differences in roll-your-own tobacco use: findings from the ITC Europe Surveys. Tob Control 24, iii11–iii16. [DOI] [PMC free article] [PubMed] [Google Scholar]
- Brown T, Platt S, Amos A, 2014. Equity impact of population-level interventions and policies to reduce smoking in adults: a systematic review. Drug Alcohol Depend 138, 7–16. [DOI] [PubMed] [Google Scholar]
- California State, 2017. Tax Rates - Special Taxes and Fees https://www.boe.ca.gov/sptaxprog/tax_rates_stfd.htm. (Accessed 23rd January 2018.
- Centers for Disease Control Prevention, 2010. How tobacco smoke causes disease: The biology and behavioral basis for smoking-attributable disease: A report of the surgeon general https://www.ncbi.nlm.nih.gov/books/NBK53017/ [PubMed] [Google Scholar]
- Chaloupka F, Sweanor D, Warner K, 2015. Differential Taxes for Differential Risks--Toward Reduced Harm from Nicotine-Yielding Products. N Engl J Med 373, 594–597. [DOI] [PubMed] [Google Scholar]
- Chaloupka FJ, Yurekli A, Fong GT, 2012. Tobacco taxes as a tobacco control strategy. Tob Control 21, 172–180. [DOI] [PubMed] [Google Scholar]
- Darrall KG, Figgins JA, 1998. Roll-your-own smoke yields: theoretical and practical aspects. Tob Control 7, 168–175. [DOI] [PMC free article] [PubMed] [Google Scholar]
- Devlin E, Eadie D, Angus K, 2003. Rolling tobacco Report prepared for the National Health Service, Scotland, by the Centre for Tobacco Research, The University of Strathclyde. [Google Scholar]
- Eriksen M, Mackay J, Ross H, 2013. The tobacco atlas (4th edition). American Cancer Society. [Google Scholar]
- Fong GT, Cummings KM, Borland R, Hastings G, Hyland A, Giovino GA, Hammond D, Thompson ME, 2006. The conceptual framework of the International Tobacco Control (ITC) policy evaluation project. Tob Control 15, iii3–iii11. [DOI] [PMC free article] [PubMed] [Google Scholar]
- Fu M, Martínez-Sánchez JM, Clèries R, Villalbí JR, Daynard RA, Connolly GN, Fernández E, 2014. Opposite trends in the consumption of manufactured and roll-your-own cigarettes in Spain (1991–2020). BMJ Open 4, e006552. [DOI] [PMC free article] [PubMed] [Google Scholar]
- Gallus S, Lugo A, Colombo P, Pacifici R, La Vecchia C, 2013. Smoking prevalence in Italy 2011 and 2012, with a focus on hand-rolled cigarettes. Prev Med 56, 314–318. [DOI] [PubMed] [Google Scholar]
- Gallus S, Lugo A, Ghislandi S, La Vecchia C, Gilmore AB, 2014. Roll-your-own cigarettes in Europe: use, weight and implications for fiscal policies. Eur J Cancer Prev 23, 186. [DOI] [PMC free article] [PubMed] [Google Scholar]
- Gilmore AB, Tavakoly B, Hiscock R, Taylor G, 2014. Smoking patterns in Great Britain: the rise of cheap cigarette brands and roll your own (RYO) tobacco. J. Public Health 37, 78–88. [DOI] [PMC free article] [PubMed] [Google Scholar]
- Government of Australia, 2017. Excise rates for tobacco https://www.ato.gov.au/Business/Excise-and-excise-equivalent-goods/Tobacco-excise/Excise-rates-for-tobacco/. (Accessed 23rd November 2017).
- Government of Canada, 2017. Current and Historical Excise Duty Rates https://www.canada.ca/en/revenue-agency/services/forms-publications/publications/edrates-excise-duty-rates/excise-duty-rates.html#_Toc482700423. (Accessed 17th January 2018.
- Government of the United Kingdom, 2017. Excise Duty - Tobacco Duty rates https://www.gov.uk/government/publications/rates-and-allowances-excise-duty-tobacco-duty/excise-duty-tobacco-duty-rates. (Accessed 23rd November 2017).
- Hackshaw A, Morris JK, Boniface S, Tang J-L, Milenković D, 2018. Low cigarette consumption and risk of coronary heart disease and stroke: meta-analysis of 141 cohort studies in 55 study reports. BMJ 360, j5855. [DOI] [PMC free article] [PubMed] [Google Scholar]
- Hiscock R, Branston JR, McNeill A, Hitchman SC, Partos TR, Gilmore AB, 2017. Tobacco industry strategies undermine government tax policy: evidence from commercial data. Tob Control 10.1136/tobaccocontrol-2017-053891 [DOI] [PMC free article] [PubMed] [Google Scholar]
- HMRC, 2016. HM Revenue and Customs Tobacco Bulletin - July 2016 [Google Scholar]
- ITC Project, 2014. Tobacco Price and Taxation: ITC Cross-Country Comparison Report University of Waterlook, Waterloo, Ontario, Canada. [Google Scholar]
- Koszowski B, Rosenberry ZR, Viray LC, Potts JL, Pickworth WB, 2014. Make your own cigarettes: toxicant exposure, smoking topography, and subjective effects. Cancer Epidemiol Biomarkers Prev 23, 1793–1803. [DOI] [PMC free article] [PubMed] [Google Scholar]
- Laugesen M, Epton M, Frampton CM, Glover M, Lea RA, 2009. Hand-rolled cigarette smoking patterns compared with factory-made cigarette smoking in New Zealand men. BMC Public Health 9, 194. [DOI] [PMC free article] [PubMed] [Google Scholar]
- Leatherdale ST, Burkhalter R, 2012. Roll-your-own tobacco use among Canadian youth: is it a bigger problem than we think? BMC Public Health 12, 557. [DOI] [PMC free article] [PubMed] [Google Scholar]
- Licht AS, Hyland AJ, O’Connor RJ, Chaloupka FJ, Borland R, Fong GT, Nargis N, Cummings KM, 2011. Socio-economic variation in price minimizing behaviors: findings from the International Tobacco Control (ITC) Four Country Survey. Int J Environ Res Public Health 8, 234–252. [DOI] [PMC free article] [PubMed] [Google Scholar]
- López-Nicolás Á, Cobacho MB, Fernández E, 2013. The Spanish tobacco tax loopholes and their consequences. Tob Ccontrol 22, e21–e24. [DOI] [PubMed] [Google Scholar]
- Lugo A, Asciutto R, Pacifici R, Colombo P, La Vecchia C, Gallus S, 2015. Smoking in Italy 2013–2014, with a focus on the young. Tumori 101, 529–534. [DOI] [PubMed] [Google Scholar]
- New York State, 2018. Cigarette and Tobacco Product Tax https://www.tax.ny.gov/bus/cig/cigidx.htm. (Accessed 23rd January 2018.
- Newfoundland and Labrador, 2016. Tobacco Taxation http://www.fin.gov.nl.ca/fin/tax_programs_incentives/personal/tobacco.html. (Accessed 23rd January 2018.
- Ontario, 2017. Tobacco tax rates https://www.ontario.ca/data/tobacco-tax-rates. (Accessed 23rd January 2018.
- Partos TR, Gilmore AB, Hitchman SC, Hiscock R, Branston JR, McNeill A, 2017. Availability and use of cheap tobacco in the UK 2002–2014: Findings from the International Tobacco Control Project. Nicotine Tob Res 20, 714–724. [DOI] [PMC free article] [PubMed] [Google Scholar]
- Rosenberry ZR, Strasser AA, Canlas LL, Potts JL, Pickworth WB, 2013. Make your own cigarettes: characteristics of the product and the consumer. Nicotine Tob Res 15, 1453–1457. [DOI] [PMC free article] [PubMed] [Google Scholar]
- Ross H, Blecher E, Yan L, Cummings KM, 2011. Predictors of what smokers say they will do in response to future price increases. Findings from the International Tobacco Control (ITC) Four Country Survey. Nicotine Tob Res 13, 419–425. [DOI] [PMC free article] [PubMed] [Google Scholar]
- Shahab L, West R, McNeill A, 2008. The feasibility of measuring puffing behaviour in roll-your-own cigarette smokers. Tob Control 17, i17–i23. [DOI] [PubMed] [Google Scholar]
- Shahab L, West R, McNeill A, 2009. Clinical Study: A comparison of exposure to carcinogens among roll‐your‐own and factory‐made cigarette smokers. Addict Biol 14, 315–320. [DOI] [PubMed] [Google Scholar]
- Shang C, Chaloupka FJ, Zahra N, Fong GT, 2013. The distribution of cigarette prices under different tax structures: findings from the International Tobacco Control Policy Evaluation (ITC) Project. Tob Control 23, i23–i29. [DOI] [PMC free article] [PubMed] [Google Scholar]
- Tarrazo M, Perez-Rios M, Santiago-Pérez MI, Malvar A, Suanzes J, Hervada X, 2017. Changes in tobacco consumption: boom of roll-your-own cigarettes and emergence of e-cigarettes. Gac Sanit 31, 204–209. [DOI] [PubMed] [Google Scholar]
- Thompson ME, Fong GT, Hammond D, Boudreau C, Driezen P, Hyland A, Borland R, Cummings KM, Hastings GB, Siahpush M, 2006. Methods of the International Tobacco Control (ITC) four country survey. Tob Control 15, iii12–iii18. [DOI] [PMC free article] [PubMed] [Google Scholar]
- U.S. Department of the Treasury, 2018. Tax and Fee Rates https://www.ttb.gov/tax_audit/atftaxes.shtml. (Accessed 17th January 2018.
- World Health Organization, 2011. Effectiveness of Tax and Price Policies for Tobacco Control. IARC Handbooks of Cancer Prevention in Tobacco Control 14. [Google Scholar]
- Young D, Borland R, Hammond D, Cummings K, Devlin E, Yong H, O’Connnor R, 2006. Prevalence and attributes of roll-your-own smokers in the International Tobacco Control (ITC) Four Country Survey. Tob Control 15, iii76–iii82. [DOI] [PMC free article] [PubMed] [Google Scholar]
- Young D, Wilson N, Borland R, Edwards R, Weerasekera D, 2010. Prevalence, correlates of, and reasons for using roll-your-own tobacco in a high RYO use country: findings from the ITC New Zealand survey. Nicotine Tob Res 12, 1089–1098. [DOI] [PubMed] [Google Scholar]
- Young D, Yong H-H, Borland R, Shahab L, Hammond D, Cummings KM, Wilson N, 2012. Trends in roll-your-own smoking: findings from the ITC Four-Country Survey (2002–2008). J Environ Public Health. 2012 [DOI] [PMC free article] [PubMed] [Google Scholar]
Associated Data
This section collects any data citations, data availability statements, or supplementary materials included in this article.