

Abstract
Integrative computational modeling is currently the method of choice for studying the detailed mesoscale molecular structure of cellular environments. However, current methods are highly compute intensive and require extensive and diverse domain knowledge. We have developed an interactive mesoscale illustration method, cellPAINT, that allows non-expert users to create mesoscale models that integrate a variety of biological data. CellPAINT uses the approach of popular digital painting software, providing users with a palette of “brushes” to paint molecules and infrastructure into a mesoscale scene, and coloring tools and visual filters to customize the rendering. CellPAINT also incorporates a variety of mesoscale properties, such as an interactive temperature slider that controls diffusive motion and interaction of proteins within membranes. The current release allows creation of scenes with an HIV virion, blood plasma, and a simplified T-cell.
Keywords: interactive illustration, molecular graphics, mesoscale visualization, cellular structure
Introduction
Living systems show a complex multidimensional hierarchy of structure and interaction. At the smallest level, atoms are combined to form molecular machines that perform the chemical, informational, and energetic tasks of living. These molecules are contained and controlled within cells, which have a complex and specific architecture. Multicellular organisms such as ourselves add an additional level of complexity, building larger bodies from trillions of cells held together by an infrastructure of structural molecules.
Study of the cellular mesoscale, the scale level bridging nanometer-sized molecular structure with micron-sized cellular structure, is opening a new window on the processes of life. Most of the large-scale processes of cells are only comprehensible when seen through the lens of their cellular context. For example, the crowded nature of cells markedly changes the structure, function, and interaction of the component molecules, and transport between cellular compartments provides essential regulatory capabilities. Biomedical research also relies on detailed understanding of the cellular mesoscale, since many disease states, including atherosclerosis and Alzheimer’s disease, are a consequence of disruption of cellular processes by aberrant mesoscale structure and interaction.
An active community of computational and experimental biologists is currently exploring the cellular mesoscale (Box 1). The available tools, however, are still highly compute intensive and require extensive domain knowledge. CellPAINT is designed as a complementary approach, allowing users to build semiquantitative mesoscale environments interactively. It is modeled after familiar digital painting programs, allowing users to choose molecules from a palette and paint them into a mesoscale scene. The program ensures that everything is illustrated at the proper scale, consistent with available experimental data. The current beta version of cellPAINT is presented as a proof of concept, using a specific class of scenes that explore HIV structure and infection as the initial application. Our goal for future work with cellPAINT visualizations is to create a general method for creation of dynamic mesoscale illustrations for use as thinking tools for researchers, as starting points for generation of detailed models for simulation, or in education and outreach settings.
Box 1. Modeling the Mesoscale.
Biologists have devised a variety of experimental techniques to study molecular and cellular biology, but there are still experimental blind spots. In particular, the cellular mesoscale, which spans scale lengths between individual molecules and entire cells, is largely invisible to experiment. Microscopy allows detailed views of the ultrastructure of cells, but the atomic details are beyond the resolution of existing technology. Methods of structural biology, such as x-ray crystallography, provide detailed atomic structures of individual molecules, but they are divorced from their cellular context. Experimental techniques at both ends of this spectrum are converging at the center, particularly with improvements in cryoelectron tomography, but the cellular mesoscale, where large collections of molecules work together to create a living cell, is still primarily revealed and studied through integrative modeling.
Currently, there is a vigorous research effort to create 3D integrative models of cellular environments and entire cells, to bridge the experimental gap between molecular structure and cellular function (reviewed in Ref. 10). These methods are computationally intensive, challenging both in the size of the models and the intrinsic difficulty for intuitive visualization. Examples of available software include cellPACK 11 and GraphiteLifeExplorer 12.
We have taken a complementary illustrative approach for study of the mesoscale. We began this work in the 1990s, when computational simulation at this level of complexity wasn’t yet feasible 13. Instead, we employed the classical techniques of scientific illustration to integrate the available data into a coherent view of selected mesoscale environments for which sufficient experimental data was available 14. These illustrations have shown success in hypothesis generation and dissemination of research, biological education, and outreach. With cellPAINT, we are working to make these types of illustration more quantitative and accessible to a wide range of researchers and educators.
Box 1 Figure.

Cross sections of an entire mycoplasma cell integrate data from structural biology, microscopy and proteomics. An artistic watercolor rendering is shown at left and a 3D model generated by CellVIEW is shown at right..
Visualization of the Cellular Mesoscale with Cross Sections
Depiction of the cellular mesoscale poses several challenges for visualization. First, mesoscale environments are highly heterogeneous, with hundreds of different types of molecules. Second, mesoscale scenes have a hierarchical structure (atoms -- molecules -- assemblies -- ultrastructure – cells) and each level of the hierarchy has important functional features. Finally, mesoscale scenes are complex, with thousands of individual molecules in even small portions of a cell. As described in Box 2, effective methods are available for visualization at the molecular scale and at the cellular scale, but visualization of the mesoscale is still an area of active research.
Box 2. Molecular and Cellular Visualization.
An extensive body of visualization methodology is available at the molecular and the cellular levels. Visualization of whole cell ultrastructure has a significant advantage: cell structure may be directly observed by microscopy. Currently, computer visualization is most often used for displaying the results of cellular tomography, typically using simple approaches to scroll through stacks of images or traditional shaded surfaces to render hand-segmented tomographic data 15,16. Visualizations of molecular structures also build on strong experimental results. Atomic structures from x-ray crystallography and other techniques are rendered using a variety of proven visual metaphors that capture salient properties of the molecules, including ball-and-stick models of the covalent structure, spheres to represent the space occupied by electrons, and various schematic representations to represent chain topology and subunit structure 17,18.
Mesoscale visualization, on the other hand, is in its infancy, largely due to the lack of comprehensive models of mesoscale structure (see Box 1). The most effective approaches have been artistic and time consuming, using traditional animation tools to simulate mesoscale scenes. Many notable examples may be found on MolecularMovies.org. Very often, these animations employ significant artistic license to create an interpretable image 19, in particular, removing many molecules from a crowded scene to reveal the key players and using smoother approaches to motion instead of random Brownian motion.
Visualization of mesoscale is challenging both in terms of the scale and complexity. A typical approach is to generate a full atomic model of the mesoscale scene (often as part of a larger simulation), and then render this with existing molecular visualization tools. More recently, interactive methods are being developed that take advantage of the modular nature of biology, using instancing to create complex mesoscale scenes from a small number of unique atomic structures 20,21. Advanced visualization methods are also being explored to improve the navigation and comprehensibility of these complex scenes 22.
In our early work on depiction of mesoscale environments (Box 1), we chose cross sections rather than the common immersive view employed in many visualization projects (Figure 1). Cross sections have several advantages. They scale naturally, allowing comprehensible visualization of large portions of a cell in a single image, while also allowing a zoom to explore local details. Since cross sections have limited depth, an orthographic projection may be used, allowing easy recognition and comparison of size and shape of molecules throughout a scene without perspective distortion.
Figure 1.

Mesoscale scenes are often depicted using traditional computer graphics techniques (top), displaying global views of a section of the modeled environment and transitioning to an immersive view when zooming in (images created with cellVIEW, https://www.cg.tuwien.ac.at/cellview). CellPAINT (bottom) depicts orthographic cross-sections, allowing the display of large mesoscale scenes and facile zooming to the level of individual molecules.
We developed a visual approach to these cross sections in early watercolor work. To manage the complexity of the scenes, a simplified representation of molecules is used, which captures the shape and form of molecules without overwhelming the scene with many atomic-level details. The shapes, however, are easily recognized and allow easy correspondence with atomically-detailed images of individual molecules. The crowded nature of the mesoscale allows a simple depth-cueing approach to heighten perception of depth and concentration. The paintings also employ significant artistic license in the orientation and placement of molecules, choosing canonical views and selected overlaps to enhance the user’s ability to recognize each molecule and understand their interactions.
The graphical design of cellPAINT builds on this previous watercolor approach. As in the paintings, the scene models a cross-section with strong depth cueing to reveal only a shallow portion of the environment. The scene is built of a foreground layer and two background layers, each with its own population of molecules. A restrained approach to representation and lighting helps to improve the interpretability of the entire scene.
Overview of Design and Implementation of CellPAINT
Our primary goal in the design of CellPAINT is to capture as much of the underlying science as possible and use it to create an accurate illustration. We have focused on two primary aspects: design and interaction of the actors, and dynamics.
For the actors, we implemented a context-aware approach, where autonomous actors interact with neighbors based on a set of molecule-specific rules. The shapes and sizes of actors are based on experimental atomic structures, and the interactions are based on known specific interactions (such as RNA with nucleocapsid protein), non-specific but localized interactions (such as proteins within membranes), and non-specific interactions (such as between soluble proteins). Implementation of specific interactions is based on atomic structures of the complexes, and non-specific interactions are based on the underlying physics.
The implementation of context-aware actors allows the facile incorporation of motion into the scene. The cellular mesoscale is highly dynamic, and dynamic in a way that is often intuitively difficult to comprehend. Biomolecules in mesoscale environments are surrounded with water. At typical temperatures that support life, this water continually buffets each molecule, causing rapid and random diffusive motion. This motion is essential for life, providing the main mechanism for transport of molecules through the cell and providing transient energy to support a variety of molecular transitions. Many molecular visualizations, however, continue to use familiar macroscale models for dynamic depictions, often using graceful Newtonian trajectories or highly goal-directed motions. In cellPAINT, we have implemented a temperature-dependent random walk that captures features of the random diffusive motion that drives mesoscale dynamics.
Another major goal of cellPAINT is to improve the comprehensibility of mesoscale scenes, both in recognition of molecules and gaining insights into the role of crowding. In the design of cellPAINT, we built on insights gained from previous illustrative work, using a 2.5D metaphor to depict a cross-section of a mesoscale scene. As described below, there are a number of tunable parameters in the process of rendering a complex 3D space into a 2.5D cross-section, which may be adjusted to improve the readability and accuracy of the scene.
CellPAINT is developed with Unity (http://unity3d.com), providing efficient methods for sprite animation and interaction, and ready deployment to a variety of platforms (Box 3). The current version of cellPAINT allows interactive placement of molecules and simulation of dynamic diffusive motion of the scene in real time. On typical consumer-level hardware, it is limited by the CPU-based physics of NVIDIA PhysX. As the density of molecules increases, the number of rigid-body contacts to be resolved increases. We have seen degradation of performance when scenes exceed roughly 5,000 rigid bodies. This is sufficient to create mesoscale scenes that are 300–400 nanometers on a side. In previous illustrative work, this size has been effective for showing functional portions of cells.
Box 3. CellPAINT Graphical Design and User Controls.
We designed a simple interface for cellPAINT to be suitable for use in education, while providing enough flexibility to be useful in research settings. The current tool includes a palette for choosing molecules, tools for painting, pinning, and deleting molecules, tools for changing rendering parameters for molecules and for the environment, and tools for saving and restoring scenes and images.
The palette of molecules for each compartment (HIV, blood plasma, T-cell) is built using a hexagonal grid with a spiral layout (http://www.redblobgames.com/grids/hexagons/). Each tile is updated with the number of molecules painted in the current scene. The “Bucket” tool also allows users to select multiple molecules within the palette, and then fill the scene with multiple copies of this user-defined recipe. A scene definition is saved and restored using a simple editable text file format that includes the coordinates, rotation angle, user-defined colors and other user effects for each 2D instance of the molecule.
Box 3 Figure.

User interface of cellPAINT..
In the following sections, we describe how these design goals were implemented using the graphical tools available within the Unity environment.
Painting of Context-Aware Actors
We have implemented a 2.5D approach that includes a foreground layer and two background layers, with sprites that move and rotate freely within each plane. Each actor is limited by a set of rules that define its allowable placement and interaction within the context of surrounding actors, based on the physical properties of the molecule that it represents. This allows users to place objects roughly within the desired compartment, and CellPAINT will optimize placement and orientation to be consistent with the rules.
The simplest actors are soluble molecules, which in reality have a defined size and shape, do not interpenetrate, and have a variety of modes of attractive or repulsive interaction. In the current version of cellPAINT, we treat each molecule as a sprite with one or more associated circular colliders (Figure 2). Colliders are centered on the bounding box of the sprite and the radius is the distance to the furthest sprite pixel. This works well for molecules that are roughly spherical, but the colliders are manually tunable to optimize exceptional cases, such as the antibody shown in Figure 2. Colliders are treated as hard spheres. Attractive forces are also possible within the PhysX implementation, but tests with specific interactions between antibodies and HIV envelope glycoprotein revealed that these types of interactions do not scale well, impacting performance in complex scenes with more than a few hundred actors.
Figure 2.
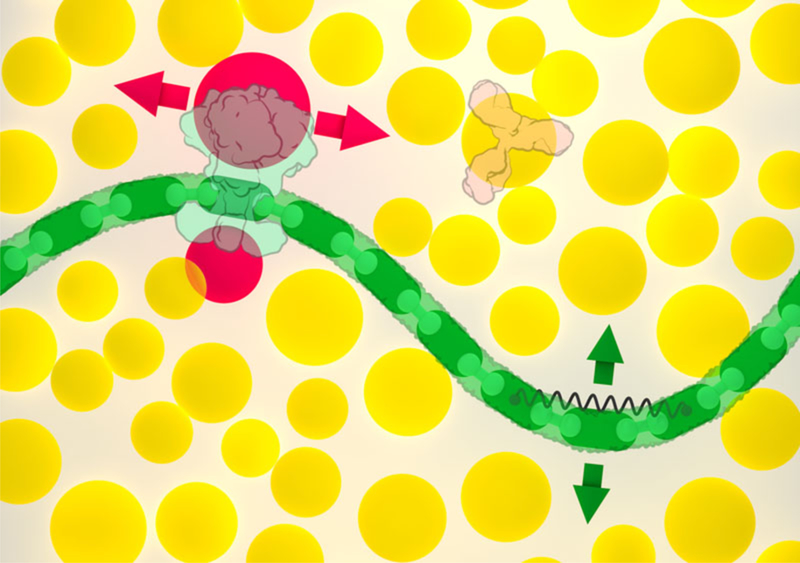
Soluble molecules, such as the Y-shaped antibody at upper right, are associated with circular colliders (shown in yellow). Membranes (green) and other articulated assemblies are created with modular components, with hinges between neighboring modules and springs to control large scale bending motion; the green arrows show the primary directions of motion available to a segment of membrane. Membrane-bound molecules, such as HIV envelope glycoprotein shown at upper left, are associated with two additional colliders (red) that only prevent overlap with the membrane, constraining the protein to move within the membrane (red arrows). A separate collider centered on the membrane protein (not shown) prevents overlap with soluble proteins.
Cells also include larger structures, built from modular components. Four examples are included in the current version of cellPAINT: membranes, HIV capsid, RNA and actin filaments. These components are build from a jointed chain of rigid bodies. Tight hinge constraints control the articulation of neighboring segments, and weaker spring constraints between more distant segments control the overall flexibility of the chain. Table 1 includes parameters for these molecules and for DNA, which is not included in the current beta release. The parameters give different characteristics to the assemblies: membranes and DNA can bend locally, but are smoothed over large distances by additional springs; limits on hinge angles between neighboring segments model a flexible RNA chain and a rigid actin filament. Topology of membranes and capsid imposes an additional complication--both have a defined inside and outside. In the current release, membranes and capsid must be drawn in a clockwise direction to give the proper topology. Based on comments from users, we added visual cues to these brushes to guide users in creating the desired topology.
Table 1.
Parameters for Fibrous and Membrane Components
| Type | Collider (nm) (circle / box) | Segment length (nm) | Hinge Limit (deg) | Number of Springs |
|---|---|---|---|---|
| RNA | 0.525 / 0 | 0.84 | 15 | 0 |
| DNA | 1.05 / 3.15 | 3.5 | 15 | 10 |
| Membrane | 1.57 / 5.0 | 5.0 | 15 | 3 |
| Actin | 1.3 / 4.9 | 2.63* | 15 | 0 |
| HIV Capsid | 3.28 / 8.87 | 8.92 | 15 | 1 |
Colliders are defined as a circle with the given radius at each extremity of the segment and a box with the given thickness (equal the circle radius) and length covering the body of the segment if long enough. The segment length defines the distance constraint linking neighboring segments, defined from center to center. The hinge limit defines the maximal deviation that is allowed from a perfectly straight alignment. For DNA and membranes, springs are added between segment A to segment A + i to model stiffness that extends over lengths of multiple segments. Parameters are provided for DNA, but it is not included in the current beta release.
Actin is a special case where unit segments overlap, so the length is smaller than the box covering the unit body.
Membrane-bound proteins typically have a specific orientation within membranes. This poses two challenges: user placement and dynamic simulation. To simplify placement, membrane-bound proteins can only be placed when the mouse is over an existing membrane. When painted into the scene, an active protein is snapped automatically to the membrane and aligned to the closest surface normal. Then, the proteins are anchored to the membrane by using two additional circle colliders (Figure 2) that act like wheels on either side of a rail. Currently, the colliders are manually specified, based on the known alignment of the protein with the membrane. Development tests showed that a diameter of twice the linear length of the membrane subunit and separated by 1.25 times the thickness of the membrane allows free diffusion of the sprite and prevents escape of the sprite from the membrane. This allows the protein to diffuse laterally along the membrane, without escaping into the surrounding soluble compartments.
A major goal for future development will be the implementation of user-friendly methods for defining specific interactions between molecules within the scene. Several interactions are currently hardwired into cellPAINT, including the interaction of cyclophilin A with capsid and the interaction of nucleocapsid with the HIV RNA genome. For other specific interactions, such as the interaction of HIV envelope glycoprotein with its cellular receptors, the current option is to position molecules manually close to one another and pin them in place.
Painting with Diffusive Motion
As soon as an actor is placed, it begins a random walk within its 2D layer (Figure 3), based on a user-defined temperature. At every odd-numbered update a random translation and torque displacement is applied to half of the rigid-body objects, using the Unity random generator. At every other update the displacement is applied to the other half of the rigid-body objects. Diffusive motion is performed separately on the foreground and background layers, so molecules within a layer never cross behind one another.
Figure 3.

The paths of insulin (the smallest protein in the cellPAINT plasma palette) and immunoglobulin M (one of the largest protein assemblies in the palette) are shown over 25 microseconds of random diffusive motion. The paths were traversed in 50 seconds of wall-clock time, so time was slowed by 2 million times.
The magnitude of the displacement is a function of the user-defined temperature, the radius of the object and the time scaling unit (real time to molecular time factor). We used the classic equation for a 3D random walk 1:
Where < ∆r > is the mean magnitude of the displacement, Dt is the translational diffusion constant, and t is time. The diffusion constant is estimated based on the the size of the spherical collider:
Where kB is the Boltzmann constant, T is the absolute temperature, η is the viscosity, and R is the radius. Estimation of diffusion constants of non-spherical objects can get quite complex, so we employed a simplification based on the average of the largest and smallest dimensions.
Magnitude of angular displacements for rotational diffusion (∆θ) were calculated similarly based on a rotational diffusion constant (Dr):
Diffusion of membrane-bound proteins is based on a 2D random walk, using the observed diffusion constant of bacteriorhodopsin 2.
Layered on top of this naturalistic diffusive motion, cellPAINT also allows users to make interactive perturbations when designing scenes. These are performed with a “Move” tool. Users apply a force to selected molecules, dragging them through the scene to desired locations. A “Pin” tool allows users to constrain a molecule to a fixed position within the scene.
Design and Implementation of Cross-sectional Visualization Parameters
Building on previous illustrative work, we implemented a 2.5D metaphor to create a cross-section of the cellular scene. When designing this method and optimizing its comprehensibility, we explored several parameters, including the slab size and depth cueing, the simplification of molecular form, and orientational constraints.
Our first task was to design a rendering style for individual molecules. The style is designed to depict the overall shape of the molecule, while minimizing distracting details typically found in atomic-level renderings of molecules (Figure 4). Smooth per-chain isosurfaces were generated with ePMV within Cinema4D 3, and rendered in an illustrative style using the “Sketch and Toon” shader with a subtle ambient occlusion to heighten perception of the major features of the molecule. Orientations of the molecules were chosen manually to highlight the major structural features. In some cases, such as the Y-shaped antibodies, the orientation is based on canonical views widely used in the literature. For others, we chose a recognizable orientation that highlights symmetry or features such as grooves or multiple domains. For membrane proteins, the Orientations of Membrane Proteins (OMP) database (http://omp.phar.umich.edu) provides a normal vector defining alignment with a planar membrane. We place this normal parallel to the image plane, and manually rotate the molecule around this vector to choose the rendered orientation.
Figure 4.
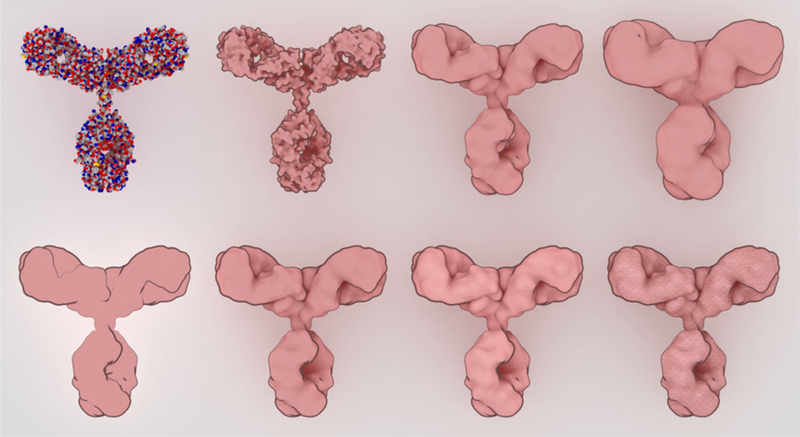
Sprites were designed with a simplified representation that still retains enough visual cues to highlight the shape and form of the molecule. At the top, a traditional spacefilling representation (left) is progressively smoothed with a blobby surface. At the bottom, non-photorealistic rendering parameters are explored, adding outlines, ambient occlusion, subtle specular highlights, and finally textures for the final sprite.
We tuned the slab size of the scene to give an intuitive perception of concentration. 3D models were generated with cellPACK, with depths ranging from 5 nm to 25 nm, along with a full cube. Three concentrations were tested, using the molecules in blood plasma: 7% weight/volume (the observed concentration of plasma), 14% and 21% (which is more typical for cellular cytoplasm). Based on this array of images, we chose a 15 nm slab thickness. Thinner slabs were essentially a single foreground layer, and thicker slabs were visually confusing, with little black negative space to help with perception of depth, particularly in the more crowded scenes. The corresponding cellPAINT images were created by dividing the molecules in the 3D slab equally between three 2.5 D layers.
Our previous illustrations incorporate a strong orientational bias, placing each molecule in a canonical view to improve recognition in complex scenes. This bias is a natural feature of the current sprite-based 2.5 D version of cellPAINT, where a single image is used for all instances of a molecule in the scene. We compared this with 3D models created with cellPACK (Figure 5). In our hands, comparison of these images leads to two insights. First, the orientation-biased views indeed improve recognition of individual molecules, particularly those with more subtle features. Second, the canonical orientations often yield the largest possible footprint for the molecule, so for a scene with identical numbers of molecules, orientationally-biased views will appear more concentrated.
Figure 5.
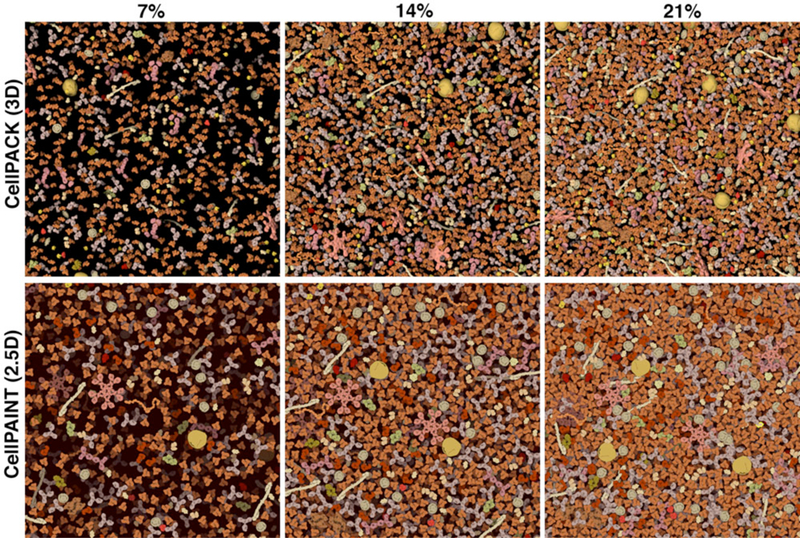
Visualization parameters were tuned by comparison with a 3D volume of blood plasma molecules. Images from 3D cellPACK models, with slab depth of 15 nanometers, are shown at the top and corresponding cellPAINT images are shown at the bottom. Three concentrations are shown: blood plasma has a typical concentration of about 7% (left), and the image at 21% (right) is more typical of cellular cytoplasm.
Sources of Biological Information
The current release of cellPAINT is built around a specific biomedical application: mesoscale depiction of HIV surrounded by blood plasma and interacting with a simplified white blood cell surface. HIV and its interaction with human cells has been a topic of extensive research, so a large body of information is available (Figure 6).
Figure 6.
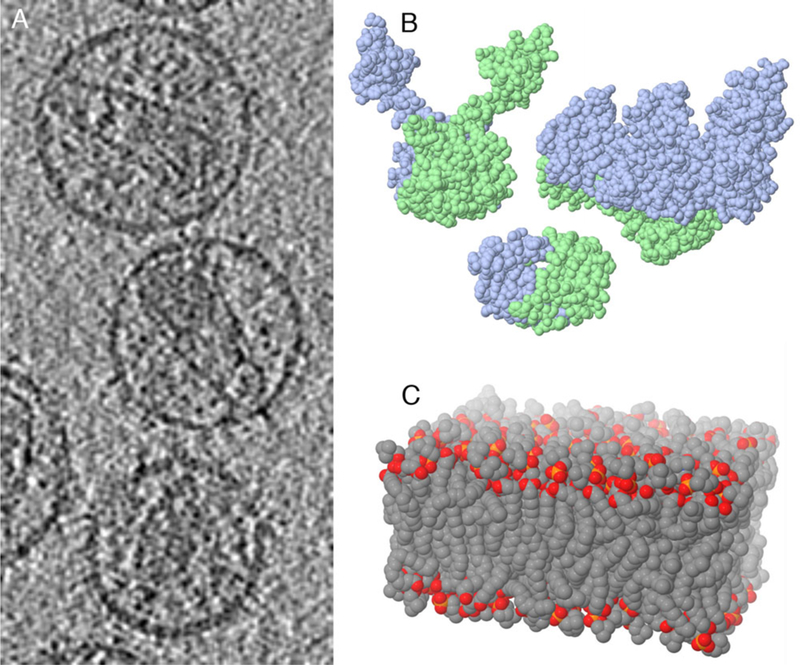
CellPAINT integrates experimental data from a variety of sources. Sources for illustrations of HIV include: a) an electron tomogram of mature virion; b) atomic structures of HIV proteins (integrase, reverse transcriptase and protease are shown here, PDB entries 1ex4, 1hys, 1hpv); c) computational simulations of lipid bilayers.
In cryoelectron tomograms, infectious HIV has a characteristic ultrastructure. It is surrounded by a lipid bilayer. Large glycoproteins are near the limit of resolution in these reconstructions, embedded in the membrane, extending from the surface and mediating infection of target cells. A cone-shaped capsid is found at the center of the virion, with two copies of the RNA genome inside. In cellPAINT, a slice through the tomogram (entry EMD-1155 from http://emdatabank.org) may be viewed and used as a guide for placement of ultrastructural elements.
Atomic structures of the major HIV proteins have been determined by x-ray crystallography, NMR spectroscopy, and electron microscopy, and were obtained from the Protein Data Bank archive (http://www.rcsb.org). The abundance of each protein within the virion was taken from a variety of sources, building on previous illustrative work 4–6. The membrane is based on a molecular dynamics simulation of a simplified lipid bilayer 7.
The composition of blood plasma has also been extensively studied. The concentrations of the most plentiful proteins were obtained from the Plasma Proteome Database (www.plasmaproteomedatabase.org), by obtaining the spreadsheet and sorting it by “Highest Reported Plasma Protein”. Structures were identified by choosing the most complete structure from the the list of PDB entries at UniProt (http://www.uniprot.org), and manually curated to determine possible higher states of oligomerization. In most cases, the structures were used directly to create sprites. For IgG antibodies, the coordinates were modified to give the canonical Y-shape, and a model of low density lipoprotein was created that is consistent with studies from electron microscopy.
A simplified model of a T-cell is also included in cellPAINT, based on a cellular panorama of a B-cell 8. The palette includes entries for a membrane with several proteins that are relevant for interaction with HIV, and a few basic molecules for the cytoplasm and cytoskeleton. A major goal of future work is to create a general interface to allow users to import new molecules, to fill out this model of the T-cell and to allow extension of cellPAINT to other cellular systems. This extension will be streamlined by the ready availability of biostructural data with standard formats at the Protein Data Bank.
Sample Applications
The current version of cellPAINT includes a collection of actors for illustrating a particular system: the mature, infectious form of HIV in the context of the immune system. We have created illustrations of several states of this system, depicting infectious HIV in plasma, HIV interacting with a T-cell, HIV entering a T-cell, and drug-inhibited forms of the virus. Two examples are included in Figure 7. The diffusive motion implemented in cellPAINT greatly simplifies the creation of these types of naturalistic scenes, allowing the user to spray in the desired number of molecules, and then wait for a short period to allow the entire scene to equilibrate.
Figure 7.
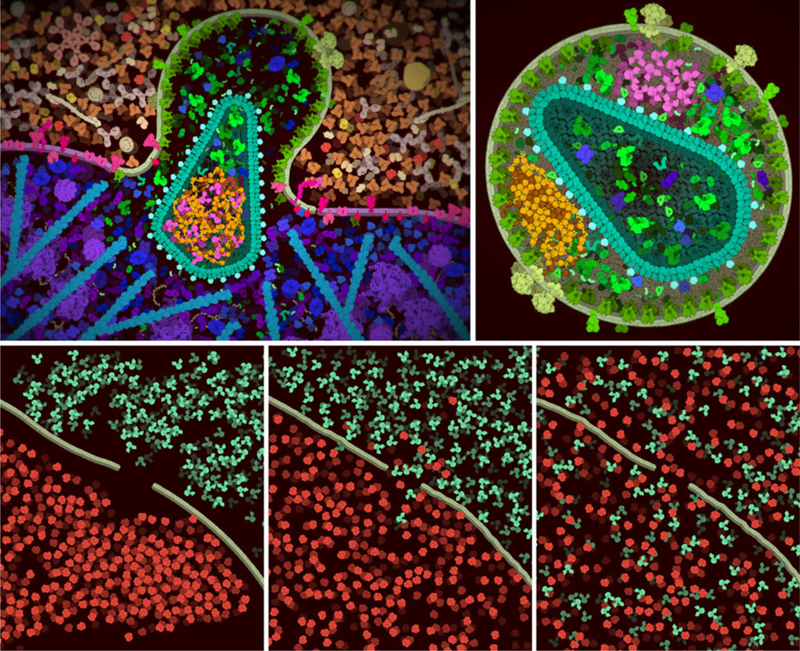
Sample screen captures from cellPAINT. (Top left) The distributed version of cellPAINT includes three palettes for creating a scene with HIV (green), blood plasma (tan and orange) and a simplified T-cell (blue and magenta). Here, we’ve created a scene after the virus has fused with the cell, releasing the capsid inside. The default colors have been changed to highlight integrase (magenta) and the viral genome with nucleocapsid (yellow and orange) inside the cone-shape capsid. A rendering option for vignetting is also used in the image. (Top right) Variations on this basic scene are also possible, such as a non-infectious virus that is formed when infected cells are treated with an integrase inhibitor. Notice that both the genome (orange) and integrase (magenta) are packaged outside the capsid in this aberrant form. (Bottom) CellPAINT may also be used to explore mesoscale properties, such as the diffusion of molecules through a semi-permeable membrane. Three time points are shown here: after roughly painting molecules in the scene, after 2 minutes (wall clock time) of diffusion at the room temperature, and after 2 hours of diffusion.
CellPAINT also provides a playful interactive space for exploring general mesoscale properties. For example, users may explore the consequences of crowding by creating and interacting with volume-occupied spaces. One consequence of crowded environments is that once two molecules get close to one another, they tend to spend more time close to one another, promoting interaction and higher levels of assembly. This frustration of motion is easily seen in crowded cellPAINT scenes. In addition, all manner of diffusion in and out of compartments may be explored by creating membranes with gaps and filling them with different collections of molecules (Figure 7).
Usability Testing
The current version of cellPAINT has been created as a proof of concept, to demonstrate the feasibility of the paint program approach and to generate interest for a more general program. Throughout development of the basic functionality and user interface, we relied on periodic usability testing with members of the local molecular graphics community. A number of features were added in response to these tests, including counts for each type of molecule (to allow quantitative control of concentration when adding molecules to a scene) and tools to assign custom colors to molecules. We also relied on these alpha testers to tune the visualization parameters, including the work on layer thickness and depth cueing described above, and determining the best range of temperature and time scale to give an interpretable and useful range of diffusive motion.
This yielded a beta version that was presented in two contexts for usability. CellPAINT was presented as part of a workshop on mesoscale modeling, which included 30 graduate students and postdoctoral researchers. A short tutorial was given, presenting features of the tool, and the group was then challenged with the creation of a scene with HIV and a T-cell, surrounded by blood plasma. Impressions were then solicited using an online questionnaire, which is currently also being used to gather input from users on the cellPAINT website (http://cellpaint.scripps.edu). Attendees were generally positive about the usability of the interface, with overall impressions of the method reported as either “very good” or “good” (out of five choices).
Specific comments were primarily focused on enhancements rather than complaints. Two issues were raised by multiple users: difficulty with creation of membranes, and the need for an Undo button. In response to the first, the currently-distributed version of cellPAINT includes new visual cues that assist the user in creating closed membranes with the proper in/out topology. As a first step towards an “Undo” functionality, we implemented the ability to select entire membranes or classes of molecules, to allow simplified erasure if they are painted incorrectly. As with all tutorials of this type, it also became apparent that effective implementation on multiple platforms is essential. Based on a comment from one user, we improved deployment under Linux, and we are currently working on a version for deployment on the internet.
We also presented a demonstration of cellPAINT at the 2017 meeting of the NIGMS Specialized Centers for HIV/AIDS-Related Structural Biology. During this demonstration, we solicited requests from researchers for scenes that would be useful for their projects. One example is included in Figure 7, showing a model of new research on the unexpected structural consequences of treatment with inhibitors that bind to the HIV integrase enzyme. As part of this work, cellPAINT is now presented as part of the outreach effort for the HIVE Center (http://hive.scripps.edu/resources).
Conclusions and Future Plans
The current version of cellPAINT demonstrates the feasibility of using the familiar approach of a digital painting program for creation of complex, data-driven mesoscale scenes. In all of our responses from users (as well as in the comments from reviewers of this manuscript), the primary request is to to expand the scope of cellPAINT to allow construction of more general scenes. By all expectations, this will greatly increase the utility of the program both in education and in research. We are currently addressing the many challenges of this enhancement. The first step has been development of general methods to import and render new molecules and assemblies based on user-defined atomic structures. One interesting aspect of this process will be the automated selection of useful orientations, based on maximal extent, symmetry elements, or salient functional features.
Acknowledgements
We thank Stefano Forli and Ivan Viola for helpful discussions. This work was supported by grant R01-GM120604 from the National Institutes of Health, and this is manuscript 29568 from the Scripps Research Institute.
Footnotes
Availability
The beta version of cellPAINT is available for mac, Windows and Linux. A quick-start guide and links to executables are available at http://cellpaint.scripps.edu.
Supplementary Information
A video demonstration of the process of creating a mesoscale scene is available (see Ref. 9).
References
- 1.Berg HC, “Random Walks in Biology,” 1983, Princeton University Press, Princeton, New Jersey. [Google Scholar]
- 2.Gambin Y, Lopez-Esparza R, Reffay M, Slereckl E, Gov NS, Genest M, Hodges RS, and Urbach W, “Lateral Mobility of Proteins in Liquid Membranes Revisited,” Proc. Natl. Acad. Sci. USA, vol. 103, 2006, pp. 2098–2102. [DOI] [PMC free article] [PubMed] [Google Scholar]
- 3.Johnson GT, Autin L, Goodsell DS, Sanner MF, and Olson AJ, “ePMV Embeds Molecular Modeling into Professional Animation Software Environments,” Structure, vol. 19, 2011, pp. 293–303. [DOI] [PMC free article] [PubMed] [Google Scholar]
- 4.Goodsell DS, “Illustrating the Machinery of Life: Viruses,” Biochem. Mol. Biol. Ed, vol. 40, no. 5, 2012, pp. 291–296. [DOI] [PubMed] [Google Scholar]
- 5.Goodsell DS, “Illustrations of the HIV Life Cycle,” Curr. Top. Microbiol. Immunol, vol. 389, 2015, pp. 243–252. [DOI] [PubMed] [Google Scholar]
- 6.Johnson GT, Goodsell DS, Autin L, Forli S, Sanner MF, and Olson AJ, “3D Molecular Models of Whole HIV-1 Virions Generated with cellPACK,” Faraday Disc, 2014, DOI: 10.1039/c4fd00017j. [DOI] [PMC free article] [PubMed]
- 7.Heller J, Schaefer M, and Schulten K, “Molecular Dynamics Simulation of a Bilayer of 200 Lipids in the Gel and in the Liquid-crystal Phases,” J. Phys. Chem, vol 97, 1993, pp. 8343–8360. [Google Scholar]
- 8.Goodsell DS, “Illustrating the Machinery of Life: Eukaryotic Cell Panorama,” Biochem. Mol. Biol. Ed, vol. 39, no. 2, 2011, pp. 91–101. [DOI] [PubMed] [Google Scholar]
- 9. https://youtu.be/4Pz4cNQcNJ0.
- 10.Im W, Liang J, Olson A, Zhou HX, Vajda S, and Vakser IA, “Challenges in Structural Approaches to Cell Modeling,” J. Mol. Biol, vol. 428, 2016, pp. 2943–2964. [DOI] [PMC free article] [PubMed] [Google Scholar]
- 11.Johnson GT, Autin L, Al-Alusi M, Goodsell DS, Sanner MF, and Olson AJ, “cellPACK: a Virtual Mesoscope to Model and Visualize Structural Systems Biology,” Nature Methods, vol. 12, no. 1, 2015, pp. 85–91. [DOI] [PMC free article] [PubMed] [Google Scholar]
- 12.Hornus S, Levy B, Lariviere D, and Fourmentin E, “Easy DNA Modeling and More with GraphiteLifeExplorer,” PLOS One, vol. 8, no. 1, e53609. [DOI] [PMC free article] [PubMed] [Google Scholar]
- 13.Goodsell DS, “Inside a Living Cell,” Trends Biochem. Sci vol. 16, no. 6, 1991, pp. 203–206. [DOI] [PubMed] [Google Scholar]
- 14.Goodsell DS The Machinery of Life, Springer, 2009. [Google Scholar]
- 15.Irobalieva RN, Martins B, and Medalia O, “Cellular Structural Biology as Revealed by Cryo-electron Tomography,” J. Cell Sci, vol. 129, 2016, pp. 469–476. [DOI] [PubMed] [Google Scholar]
- 16.Rueden CT and Eliceiri KW, “Visualization Approaches for Multidimensional Biological Image Data,” Biotechniques, vol. 43, 2007, pp. 31–36. [DOI] [PubMed] [Google Scholar]
- 17.Johnson GT and Hertig S, “A Guide to the Visual Analysis and Communication of Biomolecular Structural Data,” Nat. Mol. Cell. Biol, vol. 15, 2014, pp. 690–698. [DOI] [PubMed] [Google Scholar]
- 18.O’Donoghue SI, Goodsell DS, Frangakis AS, Jossinet F, Laskowski RA, Nilges M, Saibil HR, Schafferhans A, Wade RC, Westhof E, and Olson AJ, “Visualization of Macromolecular Structures,” Nat. Meth, vol. 7, 2010, pp. S42–S55. [DOI] [PMC free article] [PubMed] [Google Scholar]
- 19.Goodsell DS and Johnson GT, “Filling in the Gaps: Artistic License in Education and Outreach,” PLoS Biol, vol. 5, 2007, pp. 2759–2762. [DOI] [PMC free article] [PubMed] [Google Scholar]
- 20.Lindow N, Baum D, and Hege HC, “Interactive Rendering of Materials and Biological Structures on Atomic and Nanoscopic Scale,” Comp. Graph. Forum, vol. 31, 2012, pp. 1325–1334. [Google Scholar]
- 21.Falk M, Krone M, and Ertl T, “Atomistic Visualization of Mesoscopic Whole-Cell Simulations Using Ray-Casted Instancing,” Comp. Graph. Forum, vol. 32, 2013, pp. 195–206. [Google Scholar]
- 22.Le Muzic M, Mindek P, Sorger J, Autin L, Goodsell D, and Viola I, “Visibility Equalizer: Cutaway Visualization of Mesoscopic Biological Models,” Comp. Graph. Forum, vol. 35, 2016, pp. 161–170. [DOI] [PMC free article] [PubMed] [Google Scholar]