

Abstract
Tropolones are naturally occurring seven-membered non-benzenoid aromatic compounds that are of interest due to their cytotoxic properties. MO-OH-Nap is a novel α-substituted tropolone that induces caspase cleavage and upregulates markers associated with the unfolded protein response (UPR) in multiple myeloma (MM) cells. Given previous reports that tropolones may function as iron chelators, we investigated the effects of MO-OH-Nap, as well as the known iron chelator deferoxamine (DFO), in MM cells in the presence or absence of supplemental iron. The ability of MO-OH-Nap to induce apoptosis and upregulate markers of the UPR could be completely prevented by co-incubation with either ferric chloride or ammonium ferrous sulfate. Iron also completely prevented the decrease in BrdU incorporation induced by either DFO or MO-OH-Nap. Ferrozine assays demonstrated that MO-OH-Nap directly chelates iron. Furthermore, MO-OH-Nap upregulates cell surface expression and mRNA levels of transferrin receptor. In vivo studies demonstrate increased Prussian blue staining in hepatosplenic macrophages in MO-OH-Nap-treated mice. These studies demonstrate that MO-OH-Nap-induced cytotoxic effects in MM cells are dependent on the tropolone’s ability to alter cellular iron availability and establish new connections between iron homeostasis and the UPR in MM.
Keywords: Tropolone, apoptosis, iron, unfolded protein response pathway, multiple myeloma
1. Introduction
Tropolones are small, naturally occurring organic compounds that make ideal scaffolds for drug development. Several tropolone derivatives have anti-proliferative effects in a variety of cancer cell lines, which has led to investigation into the use of tropolones as anti-cancer agents [1–4], Beta-thujaplicin, a naturally occurring and well-studied tropolone, has anti-cancer activity in a variety of mouse tumor models, including melanoma, breast, and lung cancer [5–7]. Tropolones have been shown to inhibit select metalloenzymes, including histone deacetylase (HDAC) 2 and 8, and may have activity as iron-chelating agents. [8–13].
Multiple myeloma (MM) is a bone marrow malignancy characterized by the abnormal proliferation of clonal plasma cells which produce monoclonal protein. It is predicted that in 2018 over 30,000 individuals will be diagnosed with MM and over 12,000 will die from MM in the United States. [14] While new treatment options have prolonged patient survival, the majority of patients will eventually die of relapsed/refractory MM. Thus there continues to be a need for novel treatment strategies. Recently, our group examined the activity of six novel α-substituted tropolones, including MO-OH-Nap (2-hydroxy-7-naphthalene-2-yl-cyclohepta-2,4,6-trienone), in MM cells and demonstrated that MO-OH-Nap induces caspase cleavage in a time frame distinct from that of the pan-HDAC inhibitor suberoylanilide hydroxamic acid (SAHA) [15]. MO-OH-Nap, but not SAHA, promotes the expression of markers associated with endoplasmic reticulum (ER) stress and the unfolded protein response (UPR) in MM cells. MO-OH-Nap also displayed synergistic effects when used in conjunction with the proteasome inhibitor bortezomib but in a manner that was independent of aggresome formation [15]. These findings prompted further investigation into MO-OH-Nap’s mechanism of action in MM.
Previous studies in leukemia cell lines demonstrated that co-incubation with Fe3+ mitigates the antiproliferative effects of various tropolones, including MO-OH-Nap [2]. However, whether the ability of MO-OH-Nap to induce the UPR is dependent on the agent’s activity as an iron chelator is unknown. We therefore evaluated the iron-dependency of MO-OH-Nap as well as the effects of the known iron chelator deferoxamine (DFO) in MM cells. We found that DFO upregulates markers of the UPR and that co-incubation with either ferric chloride (FC) or ammonium ferrous sulfate (AFS) prevents the MO-OH-Nap-induced increase in apoptosis and UPR activation. Collectively, these studies reveal that the ability of MO-OH-Nap to induce the UPR and apoptosis in MM cells is iron-dependent.
2. Material and Methods
2.1. Reagents and Cell culture.
MO-OH-Nap was synthesized as previously described [2, 10]. Stock solutions of MO-OH-Nap were prepared in DMSO (10 mM) and stored at −20°C. Suberoylanilide hydroxamic acid (SAHA), bortezomib, DFO, FC, AFS and zinc chloride were purchased from Sigma-Aldrich (St Louis, MO, USA).
2.2. Cell culture.
RPMI-8226, MM.1S, and U266 cell lines were purchased from American Type Culture Collection (ATCC) (Manassas, VA, USA). Cells were grown in media supplemented with heat-inactivated fetal bovine serum, glutamine and penicillin-streptomycin at 37°C and 5% CO2.
2.3. Immunoblotting.
Cells were incubated in the presence of drugs with or without iron for either 24 or 48 hours, washed with PBS, and lysed in RIPA buffer supplemented with protease and phosphatase inhibitors (0.15M NaCI, 1% sodium deoxycholate, 0.1% SDS, 1% (v/v) Triton X-100, 0.05 M Tris HCI, pH 7.4). Protein quantification was determined using the BCA method. Equal amounts of total protein were run on SDS-PAGE gels, transferred to polyvinylidene difluoride membranes, and probed with applicable primary and secondary antibodies (Supplemental Table 1). Proteins were visualized using an ECL chemiluminescence detection kit and a Bio-Rad ChemiDoc MP imaging system.
2.4. Apoptosis assay.
U266 cells were treated with solvent control (DMSO), MO-OH-Nap or DFO for 48 hours with or without the addition of iron. Cells were washed and stained with APC-conjugated Annexin V antibody and propidium iodide (PI) according to the manufacturer’s recommendations (eBioscience, San Diego, CA, USA). From each tube, 10,000 cells were analyzed using a BD LSRII flow cytometer. Data analysis and flow diagrams were accomplished using FlowJo software. Early apoptotic cells are defined as those positive for Annexin V and negative for PI while late apoptotic/necrotic cells are those positive for both markers [16].
2.5. BrdU incorporation assay.
MM cells were grown in 96-well tissue culture plates at 2.5 × 10⁴ cells/100 μL/well (RPMI-8226) or 5 × 10⁴ cells/100 μL/well (U266). Cells were incubated for 48 hours with solvent control (DMSO) or varying concentrations of drugs and/or iron. BrdU was added four (RPMI-8226) or six (U266) hours prior to fixation. Plates were spun at 1000 rpm for 10 minutes. Cell processing occurred per manufacturer’s instructions using the Millipore BrdU Cell Proliferation Assay kit.
2.6. Ferrozine iron chelation assay.
All reactions were performed in triplicate in a 96-well microplate. 100 μL of DFO or MO-OH-Nap solutions (dissolved in DMSO) were mixed with AFS (50 μL, final concentration of 0.25 mM, dissolved in H2O) and incubated at room temperature for 5 minutes. Ferrozine (50 μL dissolved in DMSO, final concentration of 1 mM and purchased from Sigma-Aldrich, St Louis, MO, USA) was then added to the iron-chelator mixture. After 5 minutes, absorbance at 540 nm was recorded. Readings were normalized to the ferrozine-only control (50 μL ferrozine, 100 μL DMSO, and 50 μL AFS) using the following calculation: % Iron chelation= [(Absorbance control-Absorbance sample)/Absorbance control]*100.
2.7. qRT-PCR analysis.
Cells were incubated for 24 hours in the presence of DMSO or drug. 50 μM AFS was added concurrently with drug. RNA was isolated using the E.Z.N.A. HP total RNA kit from Omega, 1μg of total RNA was reverse transcribed to cDNA using the i-Script cDNA synthesis kit (Bio-Rad, Hercules, CA, USA). cDNA, gene specific primers, and i-Taq Sybr green super mix (Bio-Rad) were mixed according to manufacturer’s instruction. qRT-PCR reactions were performed in duplicate in a CFX96 real time machine (Bio-Rad, Hercules, CA, USA) and data was analyzed using the Bio-Rad CFX manager 3.1 software. Expression values were normalized to the house-keeping gene β-actin.
2.8. Cell cycle analysis.
Cells were incubated for 48 hours in the presence of solvent control (DMSO) or drug with or without iron. Next, to label and fix cells for flow cytometry, we re-suspended in 0.5 mL of cold hypotonic PI solution (50 μg/ml PI and 0.1% sodium citrate solution dissolved in water). Cells were vortexed and stored on ice for at least 15 minutes prior to data acquisition. From each tube, 20,000 cells were analyzed using a BD LSRII flow cytometer. Data analysis and flow diagrams were accomplished using FlowJo software.
2.9. Detection of reactive oxygen species (ROS).
Cells were plated at a density of 0.5 × 10⁶ cells per well into six-well plates in complete culture medium containing 10 μM of chloromethyl 2′, 7′-dichlorodihydrofluorescein diacetate (CM-H2DCFDA, Thermo Fisher, Waltham, MA, USA) and appropriate drug or solvent control (DMSO). FC (50 μM) was added concurrently with drug. 24 or 48 hours later, the cells were washed and re-suspended in PBS. Positive controls were incubated with hydrogen peroxide (100 μM) for 1 hour. Cells were incubated with PI (1 mg/mL) for at least 15 minutes prior to data analysis. Living cells, which are PI-negative, were selected by FACS gating. In these living cells, the fluorescence of CM-H2DCFDA was recorded. Data was obtained using a BD LSRII flow cytometer and analyzed with FlowJo software.
2.10. Animal studies and histology.
Female 6-8 week-old CD-1 mice were purchased from Charles River and housed in the University of Nebraska Medical Center (UNMC) animal facility at a temperature of 23–25 °C, relative humidity of 50–70% and 12/12 hour light/dark cycles. CD-1 mice are an outbred strain that are routinely used in toxicology studies. All studies were carried out in accordance with the Guide for the Care and Use of Laboratory Animals (U.S. National Institutes of Health) and were approved by the UNMC IACUC (protocol number 17-014-04-FC). MO-OH-Nap was dissolved in a 5% DMSO, 45% W/V hydroxypropyl-β-cyclodextrin solution in PBS (final concentration 1.3 mg/mL MOOH-Nap). The solution was filter sterilized and stored at −20 °C. Standard dose escalation procedures were followed using the up-and-down method. To conserve animals, one mouse was injected at a time via tail vein. Dose escalation continued until the dose of 9.4 mg/kg was reached which represented the limit of solubility of the drug. At that point, multi-dose testing began such that mice were injected with 9.4 mg/kg MO-OH-Nap via the tail vein three times per week for a total of four weeks. Blood samples were analyzed using an Abaxis Vetscan2 instrument and the preventative care profile plus rotor. Complete blood count (CBC) measurements were obtained via whole blood using a soil Vet ABC Instrument. Tissues were fixed with formalin, imbedded, sectioned, and stained with Prussian blue dye or H&E using standard procedures in the UNMC Tissue Sciences Facility.
2.11. In vitro metabolism studies.
Mouse S9 stability experiments were conducted utilizing a solution containing Tris buffer (50 mM ,pH 7.4), mouse S9 fraction (1 mg/mL, XenoTech, LLC, Lenexa, KS, USA), magnesium chloride (20 mM), NADPH (2 mM), uridine diphosphate glucuronyltransferase (Sigma-Aldrich, MO) (2 mM), Adenosine 3′-Phosphate 5′-Phosphosulfate (PAPS, Sigma-Aldrich, MO) (0.1 mM) and saccharolactone (Sigma-Aldrich, MO) (5 mM). The reaction mixture (final volume 1.0 mL) was pre-incubated at 37 °C for 10 min in a water bath maintaining 60 rpm. The reaction was initiated upon addition of 2 μM final concentration of MO-OH-Nap (2 μL from 1 mM stock). Samples (100 μL) were collected at different time intervals (0, 5, 10, 20, 30, 45 60 and 90 min) and quenched with 300 μL of methanol: acetonitrile (1:1). Testosterone, 7-HC and diclofenac were used as positive controls. Supernatants (10 μL) were then analyzed by LC-MS/MS. The S9 fraction is a supernatant obtained from mouse liver homogenate by centrifuging at 9000g.
2.12. Statistics:
Two-tailed t-testing was used to calculate statistical significance. An α of 0.05 was set as the level of significance. Combination indices for the BrdU assays were determined via CalcuSyn software (Biosoft) which analyzes drug interactions based on the method of Chou and Talalay [17].
3. Results
3.1. Iron reverses the cytotoxic effects of MO-OH-Nap.
As shown in Figure 1a, incubation with MO-OH-Nap or DFO for 48 hours induces the expression of proteins associated with apoptosis, including PARP and cleaved caspases 3, 8, and 9 in MM cell lines. Importantly, co-incubation with exogenous ferric or ferrous iron at a concentration of 50 μM completely prevents the induction of apoptotic markers in MO-OH-Nap- and DFO-treated cells. Furthermore, the addition of iron 24 hours after the start of MO-OH-Nap incubation partially prevents the induction of apoptotic markers (Fig. 1b). In U266 cells, as little as 5 μM FC or AFS is sufficient to block induction of apoptotic markers (PARP, cleaved caspases 3, 8, and 9) and a UPR marker (phosphorylated-eIF2a (p-eIF2a)) (Fig. 1c). Likewise, Annexin V/PI flow cytometric studies demonstrate that iron prevents the MO-OH-Nap- and DFO-induced increase in early apoptotic and late apoptotic/necrotic cells in a concentration-dependent manner (Fig. 1d and Supplemental Fig. 1). Iron also inhibited MO-OH-Nap-induced apoptosis at 24- and 72-hour time-points (Supplemental Fig. 2). BrdU incorporation experiments revealed that iron blocks the inhibition in cellular proliferation caused by MO-OH-Nap and DFO (Fig. 1e-f). Co-incubation with zinc does not prevent either MO-OH-Nap or DFO-induced cytotoxic effects (Supplemental Fig. 3). Because tropolones are postulated to function as HDAC inhibitors and MO-OH-Nap can induce changes in histone acetylation [2, 15], we examined the effect of iron on the activity of the pan-HDAC inhibitor, SAHA. Co-incubation with either FC or AFS did not alter SAHA-induced inhibition of proliferation or induction of apoptosis (Fig. 1 e-f, Supplemental Fig. 4a). While iron prevented MO-OH-Nap-induced alterations in acetylated histone levels, the SAHA-treated cells were unaffected by the addition of iron (Supplemental Fig. 4b).
Figure 1. Iron prevents the cytotoxic effects of MO-OH-Nap treatment in MM cells.
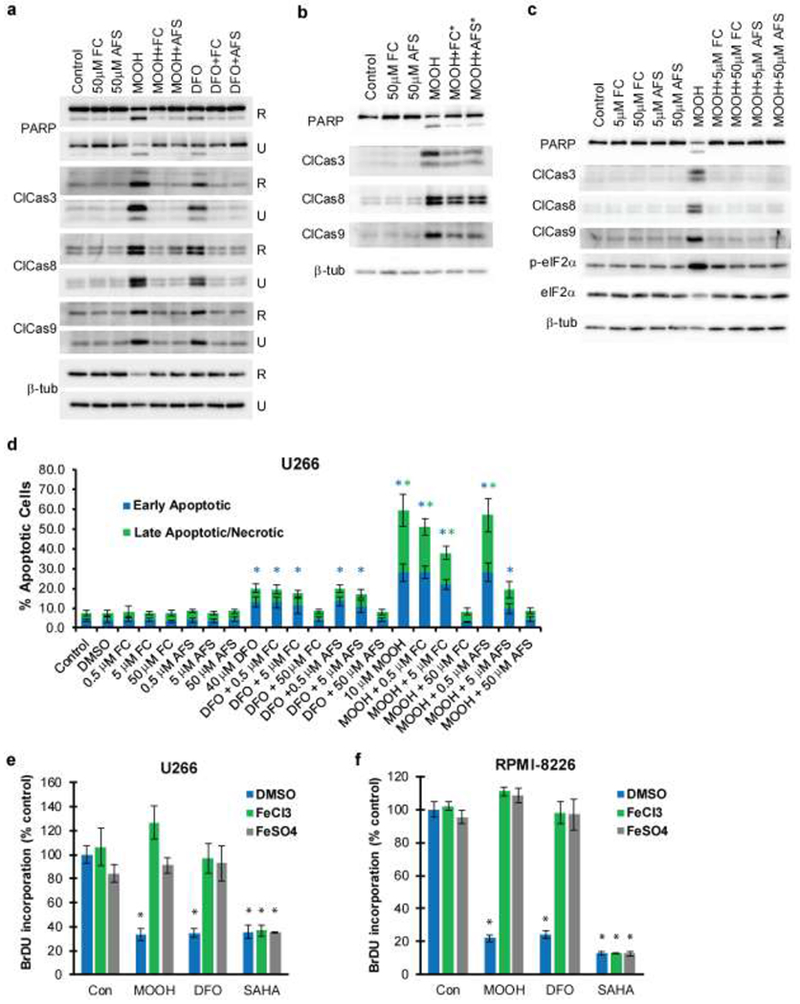
a) U266 (U) and RPMI-8226 (R) cells were treated for 48 hours with solvent control (DMSO), MO-OH-Nap (denoted as MOOH; 10 μM for U226 and 2.5 μM for RPMI), or 40 μM DFO in the presence or absence of 50 μM FC and 50μM AFS. Immunoblot analysis of cell lysates was performed using antibodies to detect PARP, cleaved caspases (3, 8, and 9) and β-tubulin (loading control). b) U266 cells were treated for 48 hours with solvent control or 10 μM MO-OH-Nap. 50 μM of AFS or FC were added 24 hours after the addition of MO-OH-Nap. PARP, cleaved caspases (3, 8, and 9) and β-tubulin were detected by immunoblot. c) U266 cells were treated with DMSO or 10 μM MO-OH-Nap in the presence or absence of either 5 μM or 50 μM FC or AFS for 48 hours. Protein levels of PARP, cleaved caspases (3, 8, and 9), p-eIF2a, eIF2a and β-tubulin were assessed by immunoblot. Immunoblots (a-c) are representative of three independent experiments. d) U226 cells were treated for 48 hours with FC, AFS, MO-OH-Nap (10 μM), and DFO (40 μM). Percentage of early apoptotic and late apoptotic/necrotic cells were determined via flow cytometry. Early apoptotic cells are defined as AnnexinV+,PI− while late apoptotic/necrotic cells are defined as AnnexinV+,PI+. Data are shown as mean ± S.D. (n=3) * denotes p<0.05 for comparison to the vehicle-only control sample. e) BrdU incorporation was measured in U266 and RPMI-8226 cells treated with MO-OH-Nap (2.5 μM for RPMI-8226 and 10 μM for U266), 40 μM DFO, or 1 μM SAHA in the presence of solvent control (DMSO) or 50 μM AFS/FC. Data are shown as mean (normalized to control) ± S.D. (n=3). *denoted p<0.05 for comparison to the vehicle-only control.
3.2. Iron prevents MO-OH-Nap mediated induction of the unfolded protein response.
Our previous studies demonstrated that MO-OH-Nap induces upregulation of markers associated with the UPR in MM cells [15], however, whether iron chelators induce similar effects in MM cells has not yet been reported. We therefore evaluated the effects of DFO treatment on markers of the UPR and observed increases in protein levels of ATF4, CHOP, phosphorylated-eIF2α (p-eIF2α) and IRE1 in a concentration-dependent manner in MM cells (Fig. 2a). As shown by qRT-PCR, 24 hour treatment with MO-OH-Nap promotes expression of UPR-associated genes, including ATF4, CHOP, and PERK and co-incubation with iron prevents this upregulation (Fig. 2b). The increase in p-eIF2α, ATF4, and CHOP protein levels induced by MO-OH-Nap and DFO can be prevented by co-incubation with iron (Fig. 2c and Supplemental Fig. 5). In addition, MO-OH-Nap induces XBP-1 splicing from its pro- to its active form by 24 hours and this effect is blocked by the addition of AFS (Fig. 2d). Interestingly, both MO-OH-Nap and DFO induced cleavage of PERK, which was prevented by co-incubation with iron (Supplemental Fig. 6).
Figure 2. Iron prevents MO-OH-Nap mediated induction of the unfolded protein response.
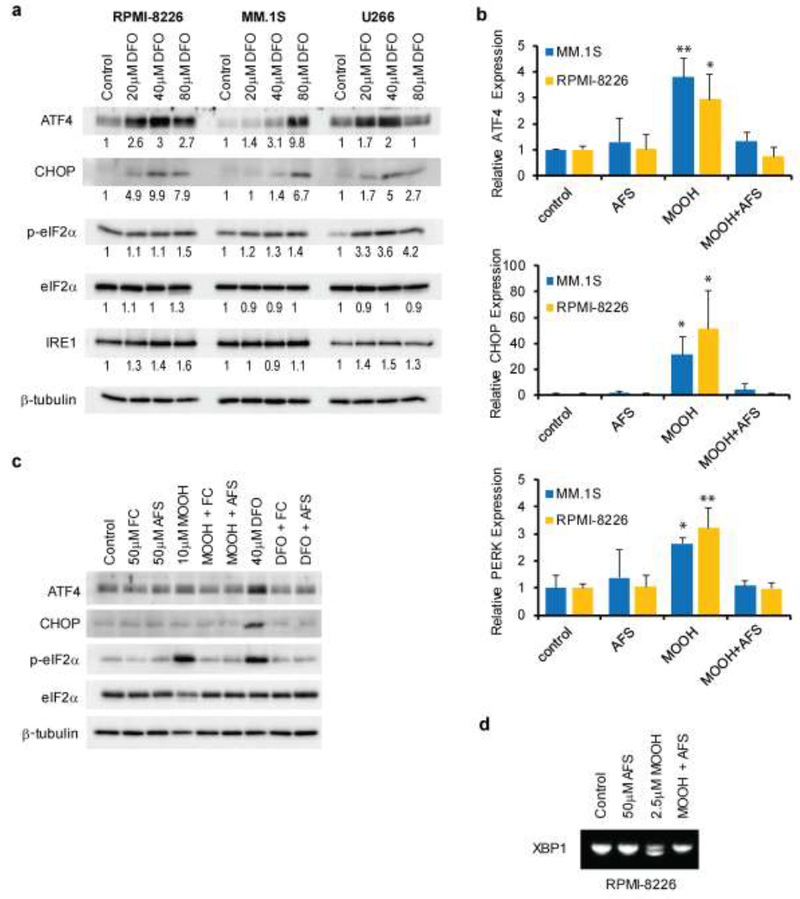
a) U266, MM1.S, and RPMI-8226 cells were treated for 48 hours with DMSO (solvent control) or various concentrations of DFO. Protein levels of ATF4, CHOP, p-eIF2α, eIF2α, IRE1 and β-tubulin (loading control) were measured by immunoblot. Densitometric analysis of the proteins of interest (normalized to loading control) for the treated cells normalized to untreated (control) cells is shown. Immunoblots are representative of three independent experiments. b) qRT-PCR analysis of ATF4, CHOP, and PERK mRNA levels in MM1.S and RPMI-8226 cell lines. Cells were exposed to DMSO, 2.5 μM MO-OH-Nap (MOOH) or 40 μM DFO in the presence or absence of 50 μM AFS for a period of 24 hours. Data are shown as mean (normalized to control) ± S.D. (n=3) ** denotes p<0.01, *denotes p<0.05 for comparison to the vehicle only control. c) U266 cells were treated for 48 hours with DMSO, MO-OH-Nap or DFO in the presence or absence of FC and AFS. Protein levels of ATF4, CHOP, p-eIF2α, eIF2α and β-tubulin were measured by immunoblot. Immunoblots are representative of three independent experiments. d) PCR fragments showing XBP-1 slicing in PRMI-8226 cells following 24 hour MO-OH-Nap and DFO treatment. Top band and bottom bands represent unspliced and spliced forms, respectively. This gel is representative of three independent experiments.
3.3. MO-OH-Nap chelates iron.
To more directly address the hypothesis that MO-OH-Nap chelates iron, we conducted a ferrozine-based assay with MO-OH-Nap and DFO. In this cell-free assay, ferrozine produces a color change when it binds ferrous iron, which can be inhibited by the addition of a chelator. As shown in Figure 3a, formation of the ferrozine-Fe complex was decreased by both MO-OH-Nap and DFO in a concentration-dependent manner. Under conditions where equal concentrations of DFO and MO-OH-Nap were used, DFO and MO-OH-Nap chelated 91% and 83% of iron, respectively.
Figure 3. MO-OH-Nap complexes iron and upregulates transferrin receptor (TFR1) expression in MM cells.
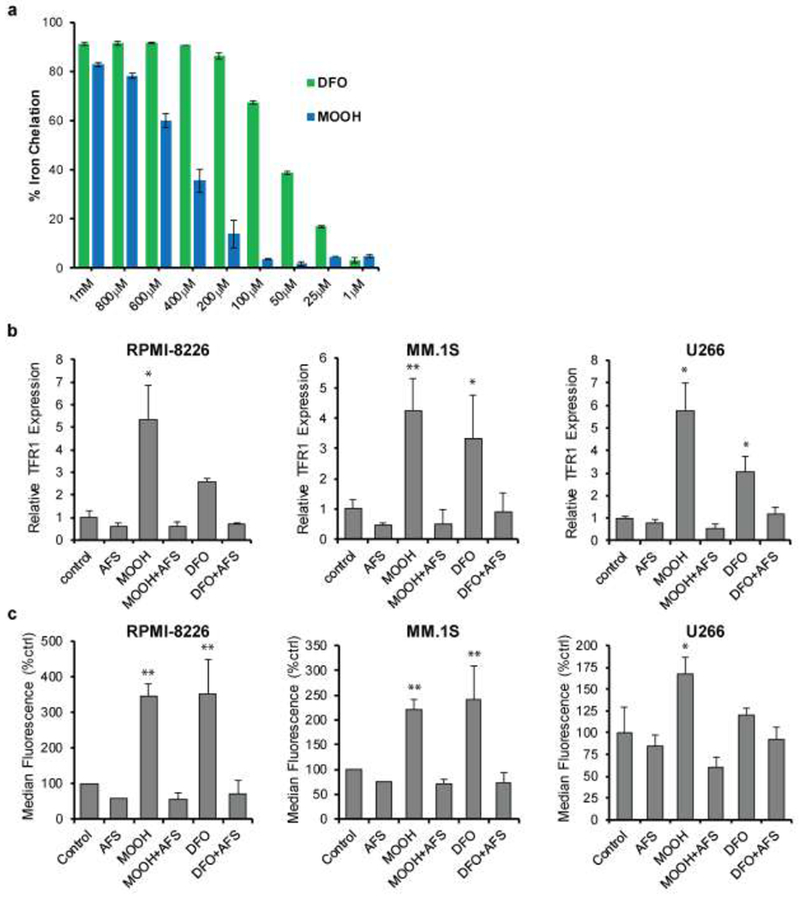
a) Ferrozine assay showing relative amounts of iron chelation for various concentrations of MO-OH-Nap (MOOH) and DFO in the presence of A FS (0.25 mM) and Ferrozine (1 mM). Data was normalized to a control sample containing Ferrozine and AFS. Error bars denote S.D. b) qRT-PCR analysis of TFR1 transcript levels in MM.1S, RPMI-8226, and U266 cells treated for 24 hours with MO-OH-Nap (MOOH; 2.5 μM for RPMI-8226/MM.1S and 10 μM for U266) or 40 μM DFO with or without 50 μM AFS. Data are normalized to expression values from the solvent only control. Error bars denote S.D., ** denotes p<0.01, *denotes p<0.05 for comparison to control. c) Flow cytometric analysis of TFR1 surface levels. Cells were treated for 48 hours using the same concentration of drugs as in panel A. The bar graphs show median fluorescence values normalized to control (n=3, error bars denote S.D., ** denotes p<0.01, *denotes p<0.05).
3.4. MO-OH-Nap induces an upregulation of transferrin receptor.
To address how MO-OH-Nap may affect intracellular iron homeostasis, we investigated MO-OH-Nap’s effects on the expression of transferrin receptor 1 (TFR1). Under conditions of cellular iron deprivation TFR1 becomes upregulated in order to increase iron uptake [18]. Examination of TFR1 transcript levels via qRT-PCR show MO-OH-Nap and DFO upregulate TFR1 mRNA by 24 hours and that this upregulation is reversed by the addition of AFS (Fig. 3b). Treatment with MO-OH-Nap or DFO induced an increase in TFR1 surface protein as measured by flow cytometry (Fig. 3c, Supplemental 7a) as well as an overall increase in TFR1 protein levels as assessed by western blot analysis (Supplemental Fig. 7b). The MO-OH-Nap-induced increase in TFR1 protein levels was also prevented by co-incubation with exogenous iron (Supplemental Fig. 7c).
3.5. MO-OH-Nap causes a cell-cycle arrest.
Previous reports suggest that iron deprivation causes cells to accumulate in the G1 phase of the cell cycle, which likely is linked to iron’s vital role in DNA synthesis [19]. Cell cycle analysis revealed an accumulation of MM cells in G0-G1 and a decrease of cells in S and G2-M phases when MO-OH-Nap was used alone but not when co-incubated with iron (Fig. 4). DFO promoted a similar effect as MO-OH-Nap, but to a lesser extent (Fig. 4).
Figure 4. MO-OH-Nap disrupts cell cycle progression.
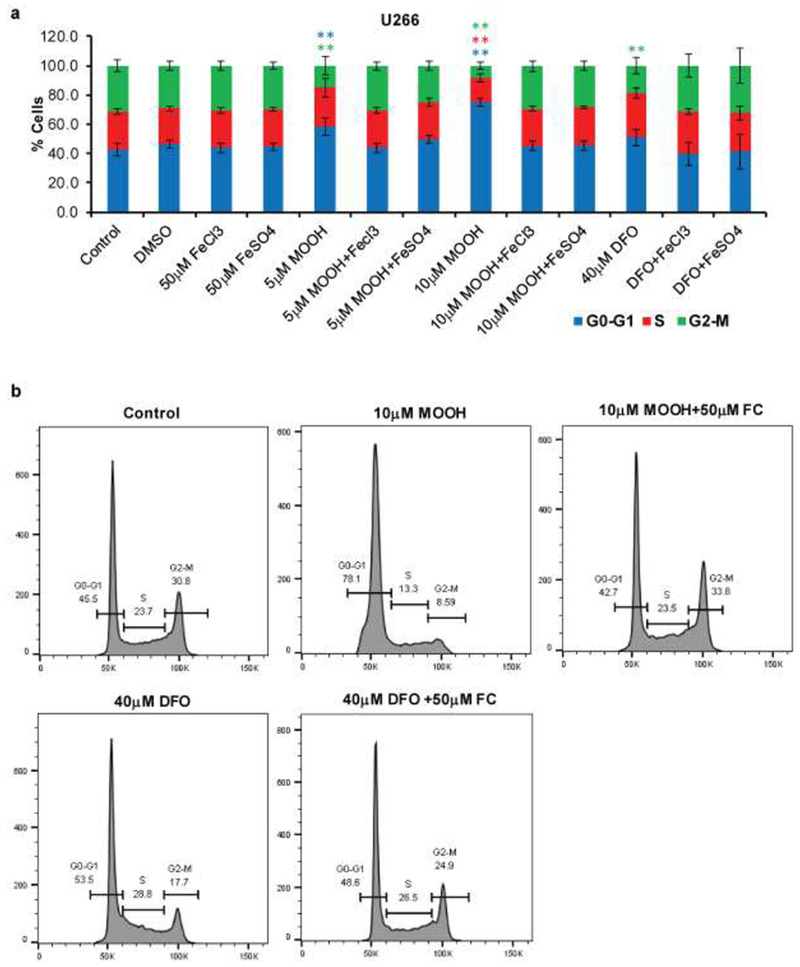
a) U266 cells were treated with DMSO, MO-OH-Nap (MOOH) or DFO with or without FC and AFS for 48 hours. Cell cycle was measured via flow cytometry analysis. Data are shown as mean ± S.D. (n=3) ** denotes p<0.01, * denotes p<0.05 for comparison to the vehicle only control. b) Representative flow histograms from data shown in panel A.
3.6. MO-OH-Nap does not increase ROS.
Because bound iron can participate in redox cycling we examined if MO-OH-Nap treatment promotes changes in intracellular reactive oxygen species (ROS) using the H2DCF-DA probe and flow cytometric analysis. At 24 and 48 hours there were no changes in H2DCF-DA fluorescence levels in either MO-OH-Nap- or DFO-treated cells, suggesting neither compound promotes ROS generation in MM cells (Supplemental Fig. 8).
3.7. MO-OH-Nap, but not DFO, is synergistic with bortezomib.
We previously reported that MO-OH-Nap and bortezomib induce synergistic cytotoxic effect in MM cells [15]. In contrast to the synergistic interaction observed between MO-OH-Nap and bortezomib, isobologram analysis of BrdU incorporation assays of DFO- and bortezomib-treated cells revealed an antagonistic interaction with combination indices (CI) greater than 1: RPMI-8226 CI for IC30 = 1.98; CI for IC50 = 1.46; U266: CI for IC30 = 1.34, CI for IC50 = 1.41 (Fig. 5).
Figure 5. DFO is not synergistic with bortezomib.
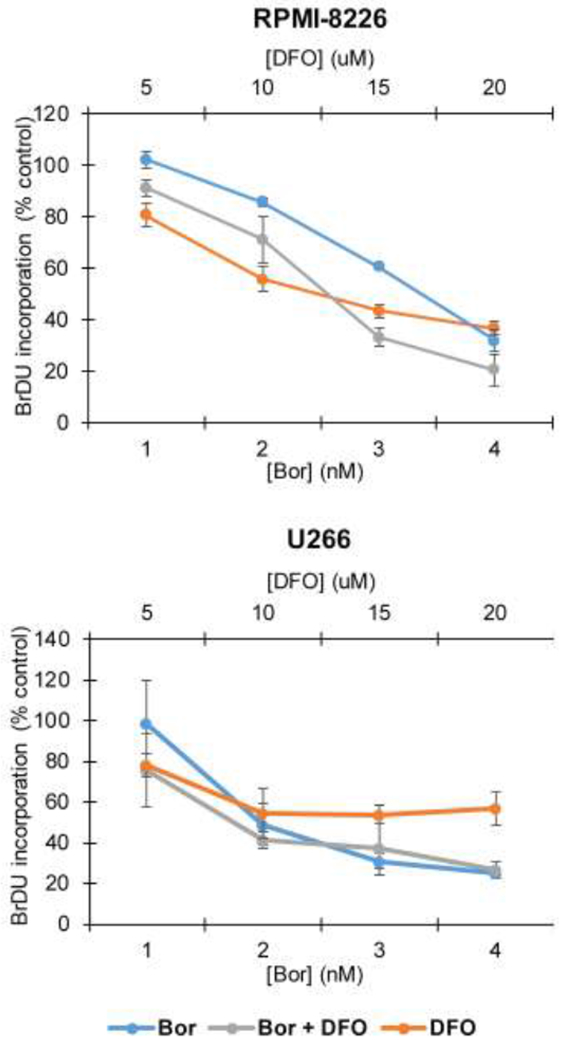
RPMI-8226 and U266 cells were treated with increasing concentrations bortezomib (Bor) and DFO. BrdU incorporation was measured after 48 hours. Data are shown as mean ± S.D. (n=3).
3.8. MO-OH-Nap alters hepatosplenic macrophage iron consumption.
To begin to evaluate the in vivo effects of MO-OH-Nap we performed dose escalation studies in CD-1 mice. No toxicities were observed at single doses up to 9.4 mg/kg IV, which represented the maximum dose that could be injected due to drug solubility issues. Multi-dose studies (9.4 mg/kg MO-OH-Nap 3 times per week for 4 weeks, n=2) were then performed. Mice injected with MO-OH-Nap were grossly and histologically normal (Supplemental Fig. 9). No effects on hematological, renal, or hepatic function were observed (Supplemental Tables 2 and 3). Prussian blue staining of liver and spleen sections was performed to identify differences in iron levels between control and MO-OH-Nap-treated mice (Fig. 6). As would be expected, there was a lack of Prussian blue staining in the liver samples from control animals. Analysis of sections from the livers of MO-OH-Nap-treated animals revealed stainable iron within Kupffer cells (1-2+) while adjacent bile ducts and hepatocytes were negative. As compared to controls, spleens from treated mice showed a marked increase in the number of red pulp macrophages containing iron, consistent with macrophage consumption of MO-OH-Nap-iron complexes. Finally, to assess the metabolic stability of MO-OH-Nap, studies were performed with mouse S9 fractions (liver homogenate isolated after centrifugation at 9000 g) to evaluate phase I and phase II metabolism. Minimal (<15%) metabolism was observed in the presence of mouse S9 fraction, indicating that the compound is not undergoing cytochrome P450-mediated or phase II metabolism (Supplemental Fig. 10). Diclofenac, 7-HC, and testosterone were chosen as controls because they display known slow, medium, and fast metabolism, respectively. No additional peaks specific to predicted phase I or phase II metabolites were detected by LC/MS/MS following incubation of MO-OH-Nap in S9 fractions (data not shown).
Figure 6. MO-OH-Nap disrupts hepatosplenic iron handling.
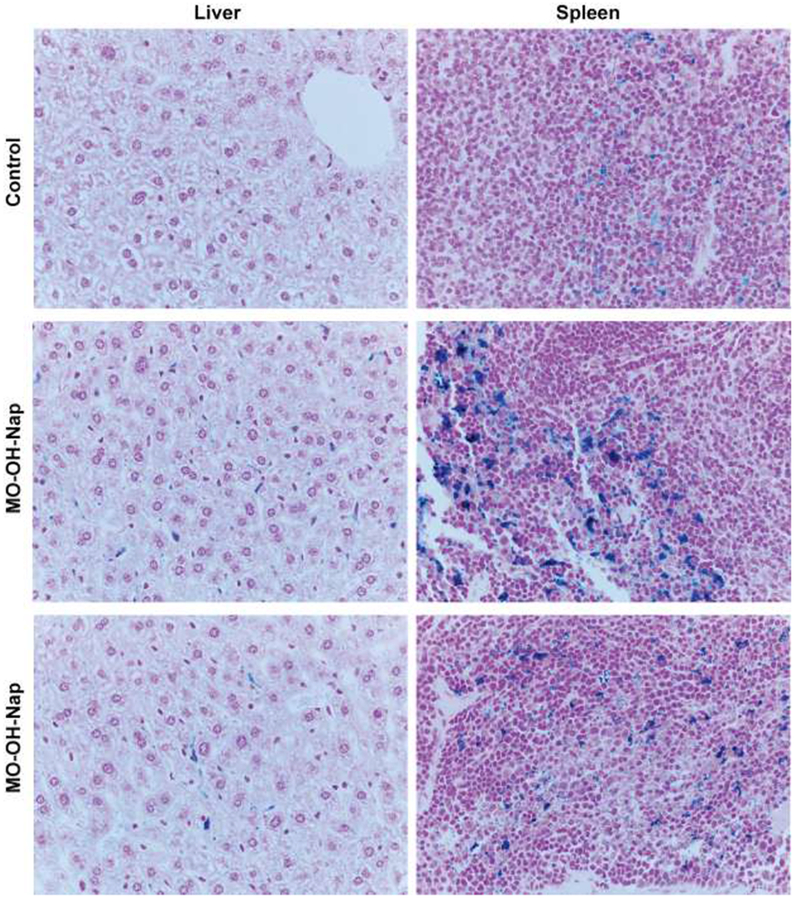
Prussian blue staining of liver and spleen sections (400×) from control and MO-OH-Nap (MOOH)-treated mice (9.4mg/kg IV three times a week for four weeks).
4. Discussion
MM cells, by virtue of their high protein synthetic rate, are uniquely sensitive to therapeutic strategies which induce ER stress and the UPR. We had previously demonstrated that the novel α-substituted tropolone, MO-OH-Nap, induces apoptosis of MM cells in a UPR-dependent manner [15]. Due to this finding, we believe that tropolones are promising developmental candidates for MM therapy, and further studies on their anti-MM mechanisms of action are warranted. While previous studies suggested that related tropolones have activity as HDAC inhibitors [10], we found that MO-OH-Nap and the pan-HDAC inhibitor SAHA had unique gene expression profiles, consistent with disparate mechanisms of action [15]. Our current studies have focused on the activity of MO-OH-Nap as an iron chelator to better define this agent’s mechanism of action.
We compared MO-OH-Nap to the clinically approved iron chelator DFO and found that both compounds have the ability to induce the UPR and trigger apoptosis in MM cells and that these effects are fully abrogated by co-incubation with iron. Furthermore, much like DFO, MO-OH-Nap promotes upregulation of TFR1 in MM cells and it can directly complex iron. These data suggest that the activity of MO-OH-Nap is in part dependent on its ability to chelate iron and deplete intracellular iron stores. While various studies show that tropolones can complex iron [20], there is limited in vivo data for tropolones with respect to iron chelating activity. One study using tropolone derivatives found that while all four tested compounds were able to bind iron (III) hydroxide, they were not able to reduce iron loads in a mouse model of hemosiderosis [21]. Recent findings demonstrate that beta-thujaplicin facilitates the absorption of iron in the gut of DMT1-deficient rats and ferroportin-deficient mice, thus allowing it to restore the movement of iron into cells in the absence of iron transport proteins.[22] Our studies reveal that MO-OH-Nap is well-tolerated following repeat dosing in mice and we observed evidence of MO-OH-Nap-induced effects on hepatosplenic macrophage iron consumption.
Iron plays a pivotal role in a variety of normal cellular processes, including DNA synthesis and cell cycle progression. The rate-limiting step of DNA synthesis is accomplished via the iron-dependent ribonucleotide reductase, which explains why iron deprivation causes cells to accumulate at the G1/S border [23, 24]. It has long been suggested that cancer cells demonstrate an increased requirement for intracellular iron and that pathways related to iron metabolism are deregulated. Some neoplastic cells express higher levels of iron import proteins, such as TFR1 and divalent metal transporter 1 (DMT1), while others can mediate iron uptake through non-receptor mediated pinocytosis [25–28]. A recent study found that MM cell lines have increased intracellular levels of iron as compared to normal cells, possibly due to decreased expression of the iron exporter ferroportin [29]. Several studies have suggested that iron chelators have anti-cancer activities [30]. There is increasing evidence for a complex interplay between the UPR and iron homeostasis, including the observations that ER stress can alter the expression profile of iron-related genes and that iron overload is associated with increased expression of ER chaperones [31–33]. On the other hand, exceedingly high levels of iron can be detrimental to cellular survival under certain conditions. Ferroptosis can occur when iron metabolism generates toxic reactive oxygen species that cause lipid peroxidation and cell death [34]. MM cell lines were shown to be less sensitive to an agent which induces ferroptotic cell death compared to diffuse large B cell lymphoma cell lines [35], demonstrating the complex relationship between iron and cell death pathways in MM.
Iron chelators have been shown to induce cytotoxic effects in MM cell lines. Kamihara et al., demonstrated that the clinically used iron chelator, deferasirox, induces caspase cleavage and apoptosis in MM cell lines [29]. Pullarkat et al., reported the cytotoxic activities of DFO and deferasirox in MM cells as being the result of autophagy-induced iron deprivation [36]. Likewise, di-2-pyridylketone 4,4-dimethyl-3-thiosemicarbazone (Dp44mT) is a novel cytotoxic agent that forms redox-active metal complexes to elevate ROS-production and can induce apoptosis in MM cells [37]. Interestingly, Dp44mT induces the upregulation of UPR-associated proteins including ATF4, CHOP, and p-eIF2a and promotes XBP-1 mRNA splicing in neuroepithelioma cell lines [38]. Such findings parallel our own results with MO-OH-Nap in MM cells. In vivo efficacy for Dp44mT in regards to MM has not been reported, however Dp44mT was shown to inhibit tumor growth in various other murine cancer models [39–41]. The solubility of MO-OH-Nap in biologically relevant solvents limited our ability to reach the maximally tolerated dose and perform in vivo efficacy studies in mouse MM models. However, studies are ongoing to develop analogues of MO-OH-Nap that will be tested in vivo.
Our previous findings show that MO-OH-Nap behaves synergistically with the proteasome inhibitor bortezomib which is clinically relevant as proteasome inhibitors are widely used in the management of MM [15]. Here we demonstrate that DFO and bortezomib have an antagonistic affect when used in combination, indicating that MO-OH-Nap may have activity that is independent of its ability to bind iron. The results of previous microarray studies have suggested that tropolones have additional mechanisms of action, such effects on DNA damage repair pathways [2, 15], and the extent to which these effects are dependent on iron is as yet unknown. Furthermore, our findings indicate that MO-OH-Nap’s effect on histone acetylation, while dependent on iron, is likely indirect. The mechanism by which MO-OH-Nap modulates histone modifications will require further investigation as the possibility remains that by binding iron MO-OH-Nap may disrupt the activity of an iron-dependent metalloenzyme.
In summary, our studies demonstrate that MO-OH-Nap’s ability to induce the UPR and apoptosis is iron-dependent. These findings are relevant as they not only provide insight into the mechanism of action of a novel tropolone, but also provide further rationale for investigating the therapeutic potential of iron-chelating agents to induce the UPR and apoptosis in MM. Future studies will focus on better understanding the molecular mechanisms of MO-OH-Nap and structure-function analysis of new generations of tropolone derivatives in order to evaluate these agents’ potential as a novel anti-MM therapy.
Supplementary Material
Highlights.
Iron prevents induction of myeloma cell death by the novel tropolone MO-OH-Nap
Iron prevents MO-OH-Nap induction of the unfolded protein response (UPR) pathway
The iron chelator deferoxamine induces upregulation of the UPR in myeloma cells
MO-OH-Nap directly chelates iron and upregulates transferrin receptor expression
Acknowledgments:
Flow cytometry experiments were performed at the Flow Cytometry Core Facility at University of Nebraska Medical Center (UNMC). The UNMC Flow Cytometry Research Facility is administrated through the Office of the Vice Chancellor for Research and supported by state funds from the Nebraska Research Initiative and The Fred and Pamela Buffett Cancer Center’s National Cancer Institute Cancer Support Grant. Major instrumentation has been provided by the Office of the Vice Chancellor for Research, The University of Nebraska Foundation, the Nebraska Banker’s Fund, and by the NIH-NCRR Shared Instrument Program. This project was supported in part by the National Institutes of Health National Institute of Cancer [R01 CA16247, P30 CA036727]; the National Institutes of Health National Institute on Alcohol Abuse and Alcoholism [R25 AA20818]; the American Association of Colleges of Pharmacy [AG140125].
Abbreviations:
- AFS
ammonium ferrous sulfate
- BCA
bicinchoninic acid
- CM-H2DCFDA
chloromethyl 2′, 7′-dichlorodihydrofluorescein diacetate
- CI
combination index
- DFO
deferoxamine
- ER
endoplasmic reticulum
- FC
ferric chloride
- HDAC
histone deacetylase
- MM
multiple myeloma
- PI
propidium iodide
- ROS
reactive oxygen species
- SAHA
suberoylanilide hydroxamic acid
- TFR1
transferrin receptor UPR, unfolded protein response pathway
Footnotes
Publisher's Disclaimer: This is a PDF file of an unedited manuscript that has been accepted for publication. As a service to our customers we are providing this early version of the manuscript. The manuscript will undergo copyediting, typesetting, and review of the resulting proof before it is published in its final citable form. Please note that during the production process errors may be discovered which could affect the content, and all legal disclaimers that apply to the journal pertain.
The authors declare that they have no conflict of interest.
Compliance with Ethical Standards
All applicable international, national, and/or institutional guidelines for the care and use of animals were followed. All procedures performed in studies involving animals were in accordance with the ethical standards of the institution or practice at which the studies were conducted.
This article does not contain any studies with human participants performed by any of the authors.
References
- 1.Hsiao CJ, Hsiao SH, Chen WL, Guh JH, Hsiao G, Chan YJ, Lee TH and Chung CL, Pycnidione, a fungus-derived agent, induces cell cycle arrest and apoptosis in A549 human lung cancer cells. Chem Biol Interact. 197 (2012) 23–30. 10.1016/j.cbi.2012.03.004 [DOI] [PubMed] [Google Scholar]
- 2.Li J, Falcone ER, Holstein SA, Anderson AC, Wright DL and Wiemer AJ, Novel alpha-substituted tropolones promote potent and selective caspase-dependent leukemia cell apoptosis. Pharmacol Res. 113 (2016) 438–448. 10.1016/j.phrs.2016.09.020 [DOI] [PMC free article] [PubMed] [Google Scholar]
- 3.Ononye SN, Vanheyst MD, Giardina C, Wright DL and Anderson AC, Studies on the antiproliferative effects of tropolone derivatives in Jurkat T-lymphocyte cells. Bioorg Med Chem. 22 (2014) 2188–2193. 10.1016/j.bmc.2014.02.018 [DOI] [PMC free article] [PubMed] [Google Scholar]
- 4.Liu S and Yamauchi H, Hinokitiol, a metal chelator derived from natural plants, suppresses cell growth and disrupts androgen receptor signaling in prostate carcinoma cell lines. Biochem Biophys Res Commun. 351 (2006) 26–32. 10.1016/j.bbrc.2006.09.166 [DOI] [PubMed] [Google Scholar]
- 5.Huang CH, Jayakumar T, Chang CC, Fong TH, Lu SH, Thomas PA, Choy CS and Sheu JR, Hinokitiol Exerts Anticancer Activity through Downregulation of MMPs 9/2 and Enhancement of Catalase and SOD Enzymes: In Vivo Augmentation of Lung Histoarchitecture. Molecules. 20 (2015) 17720–17734. 10.3390/molecules201017720 [DOI] [PMC free article] [PubMed] [Google Scholar]
- 6.Huang CH, Lu SH, Chang CC, Thomas PA, Jayakumar T and Sheu JR, Hinokitiol, a tropolone derivative, inhibits mouse melanoma (B16-F10) cell migration and in vivo tumor formation. Eur J Pharmacol. 746 (2015) 148–157. 10.1016/j.ejphar.2014.11.011 [DOI] [PubMed] [Google Scholar]
- 7.Chen SM, Wang BY, Lee CH, Lee HT, Li JJ, Hong GC, Hung YC, Chien PJ, Chang CY, Hsu LS and Chang WW, Hinokitiol up-regulates miR-494-3p to suppress BMI1 expression and inhibits self-renewal of breast cancer stem/progenitor cells. Oncotarget. 8 (2017) 76057–76068. 10.18632/oncotarget.18648 [DOI] [PMC free article] [PubMed] [Google Scholar]
- 8.Nakano K, Chigira T, Miyafusa T, Nagatoishi S, Caaveiro JM and Tsumoto K, Discovery and characterization of natural tropolones as inhibitors of the antibacterial target CapF from Staphylococcus aureus. Sci Rep. 5 (2015) 15337 10.1038/srep15337 [DOI] [PMC free article] [PubMed] [Google Scholar]
- 9.Fullagar JL, Garner AL, Struss AK, Day JA, Martin DP, Yu J, Cai X, Janda KD and Cohen SM, Antagonism of a zinc metalloprotease using a unique metal-chelating scaffold: tropolones as inhibitors of P. aeruginosa elastase. Chem Commun (Camb). 49 (2013) 3197–3199. 10.1039/c3cc41191e [DOI] [PMC free article] [PubMed] [Google Scholar]
- 10.Ononye SN, VanHeyst MD, Oblak EZ, Zhou W, Ammar M, Anderson AC and Wright DL, Tropolones as lead-like natural products: the development of potent and selective histone deacetylase inhibitors. ACS Med Chem Lett. 4 (2013) 757–761. 10.1021/ml400158k [DOI] [PMC free article] [PubMed] [Google Scholar]
- 11.Bryant BE FW, Formation constants of metal complexes of tropolone and its derivatives II. J Am Chem Soc. 76 (1954) 1696–1697. [Google Scholar]
- 12.Menis O MB, Bright DS, Determination of the formation constants of iron(III) and vanadium(V) with β-isopropyltropolone using the extraction method. Anal Chem. 43 (1971) 431–435. [Google Scholar]
- 13.Oka Y MS, Mutual determination of iron(III) and tropolone, and the formation constant of their complex. Bunseki Kagaku. 7 (1958) 215–219. [Google Scholar]
- 14.Noone AM, Howlander N, Krapcho M, Miller D, Brest A, Yu M, Ruhl J, Tatalovich Z, Mariotto A, Lewis DR, Chen HS, Feuer EJ and Cronin KA, SEER Cancer Statistics Review, 1975-2015, https://seer.cancer.gov/csr/1975_2015/, 2018
- 15.Haney SL, Allen C, Varney ML, Dykstra KM, Falcone ER, Colligan SH, Hu Q, Aldridge AM, Wright DL, Wiemer AJ and Holstein SA, Novel tropolones induce the unfolded protein response pathway and apoptosis in multiple myeloma cells. Oncotarget. 8 (2017) 76085–76098. 10.18632/oncotarget.18543 [DOI] [PMC free article] [PubMed] [Google Scholar]
- 16.Wlodkowic D, Skommer J and Darzynkiewicz Z, Flow cytometry-based apoptosis detection. Methods Mol Biol. 559 (2009) 19–32. 10.1007/978-1-60327-017-52 [DOI] [PMC free article] [PubMed] [Google Scholar]
- 17.Chou TC and Talalay P, Quantitative analysis of dose-effect relationships: the combined effects of multiple drugs or enzyme inhibitors. Adv Enzyme Regul. 22 (1984) 27–55. [DOI] [PubMed] [Google Scholar]
- 18.Yu Y, Kovacevic Z and Richardson DR, Tuning cell cycle regulation with an iron key. Cell Cycle. 6 (2007) 1982–1994. 10.4161/cc.6.16.4603 [DOI] [PubMed] [Google Scholar]
- 19.Brodie C, Siriwardana G, Lucas J, Schleicher R, Terada N, Szepesi A, Gelfand E and Seligman P, Neuroblastoma sensitivity to growth inhibition by deferrioxamine: evidence for a block in G1 phase of the cell cycle. Cancer Res. 53 (1993) 3968–3975. [PubMed] [Google Scholar]
- 20.Murakami K, Ohara Y, Haneda M, Tsubouchi R and Yoshino M, Prooxidant action of hinokitiol: hinokitiol-iron dependent generation of reactive oxygen species. Basic Clin Pharmacol Toxicol. 97 (2005) 392–394. 10.1111/j.1742-7843.2005.pto_214.x [DOI] [PubMed] [Google Scholar]
- 21.Pitt CG, Gupta G, Estes WE, Rosenkrantz H, Metterville JJ, Crumbliss AL, Palmer RA, Nordquest KW, Hardy KA, Whitcomb DR, Byers BR, Arceneaux JE, Gaines CG and Sciortino CV, The selection and evaluation of new chelating agents for the treatment of iron overload. J Pharmacol Exp Ther. 208 (1979) 12–18. [PubMed] [Google Scholar]
- 22.Grillo AS, SantaMaria AM, Kafina MD, Cioffi AG, Huston NC, Han M, Seo YA, Yien YY, Nardone C, Menon AV, Fan J, Svoboda DC, Anderson JB, Hong JD, Nicolau BG, Subedi K, Gewirth AA, Wessling-Resnick M, Kim J, Paw BH and Burke MD, Restored iron transport by a small molecule promotes absorption and hemoglobinization in animals. Science. 356 (2017) 608–616. 10.1126/science.aah3862 [DOI] [PMC free article] [PubMed] [Google Scholar]
- 23.Terada N, Or R, Szepesi A, Lucas JJ and Gelfand EW, Definition of the roles for iron and essential fatty acids in cell cycle progression of normal human T lymphocytes. Exp Cell Res. 204 (1993) 260–267. 10.1006/excr.1993.1032 [DOI] [PubMed] [Google Scholar]
- 24.Thelander L and Graslund A, Mechanism of inhibition of mammalian ribonucleotide reductase by the iron chelate of 1-formylisoquinoline thiosemicarbazone. Destruction of the tyrosine free radical of the enzyme in an oxygen-requiring reaction. J Biol Chem. 258 (1983) 4063–4066. [PubMed] [Google Scholar]
- 25.Gatter KC, Brown G, Trowbridge IS, Woolston RE and Mason DY, Transferrin receptors in human tissues: their distribution and possible clinical relevance. J Clin Pathol. 36 (1983) 539–545. [DOI] [PMC free article] [PubMed] [Google Scholar]
- 26.Brookes MJ, Hughes S, Turner FE, Reynolds G, Sharma N, Ismail T, Berx G, McKie AT, Hotchin N, Anderson GJ, Iqbal T and Tselepis C, Modulation of iron transport proteins in human colorectal carcinogenesis. Gut. 55 (2006) 1449–1460. 10.1136/gut.2006.094060 [DOI] [PMC free article] [PubMed] [Google Scholar]
- 27.Trinder D, Zak O and Aisen P, Transferrin receptor-independent uptake of differic transferrin by human hepatoma cells with antisense inhibition of receptor expression. Hepatology. 23 (1996) 1512–1520. 10.1053/jhep.1996.v23.pm0008675172 [DOI] [PubMed] [Google Scholar]
- 28.Richardson DR and Baker E, The uptake of iron and transferrin by the human malignant melanoma cell. Biochim Biophys Acta. 1053 (1990) 1–12. [DOI] [PubMed] [Google Scholar]
- 29.Kamihara Y, Takada K, Sato T, Kawano Y, Murase K, Arihara Y, Kikuchi S, Hayasaka N, Usami M, Iyama S, Miyanishi K, Sato Y, Kobune M and Kato J, The iron chelator deferasirox induces apoptosis by targeting oncogenic Pyk2/beta-catenin signaling in human multiple myeloma. Oncotarget. 7 (2016) 64330–64341. 10.18632/oncotarget.11830 [DOI] [PMC free article] [PubMed] [Google Scholar]
- 30.Bedford MR, Ford SJ, Horniblow RD, Iqbal TH and Tselepis C, Iron chelation in the treatment of cancer: a new role for deferasirox? J Clin Pharmacol. 53 (2013) 885–891. 10.1002/jcph.113 [DOI] [PubMed] [Google Scholar]
- 31.You KR, Liu MJ, Han XJ, Lee ZW and Kim DG, Transcriptional regulation of the human transferrin gene by GADD153 in hepatoma cells. Hepatology. 38 (2003) 745–755. 10.1053/jhep.2003.50367 [DOI] [PubMed] [Google Scholar]
- 32.Oliveira SJ, Pinto JP, Picarote G, Costa VM, Carvalho F, Rangel M, de Sousa M and de Almeida SF, ER stress-inducible factor CHOP affects the expression of hepcidin by modulating C/EBPalpha activity. PLoS One. 4 (2009) e6618 10.1371/journal.pone.0006618 [DOI] [PMC free article] [PubMed] [Google Scholar]
- 33.Vecchi C, Montosi G, Zhang K, Lamberti I, Duncan SA, Kaufman RJ and Pietrangelo A, ER stress controls iron metabolism through induction of hepcidin. Science. 325 (2009) 877–880. 10.1126/science.1176639 [DOI] [PMC free article] [PubMed] [Google Scholar]
- 34.Thevenod F, Iron and Its Role in Cancer Defense: A Double-Edged Sword. Met Ions Life Sci. 18 (2018). 10.1515/9783110470734-021 [DOI] [PubMed] [Google Scholar]
- 35.Yang WS, SriRamaratnam R, Welsch ME, Shimada K, Skouta R, Viswanathan VS, Cheah JH, Clemons PA, Shamji AF, Clish CB, Brown LM, Girotti AW, Cornish VW, Schreiber SL and Stockwell BR, Regulation of ferroptotic cancer cell death by GPX4. Cell. 156 (2014) 317–331. 10.1016/j.cell.2013.12.010 [DOI] [PMC free article] [PubMed] [Google Scholar]
- 36.Pullarkat V, Meng Z, Donohue C, Yamamoto VN, Tomassetti S, Bhatia R, Krishnan A, Forman SJ and Synold TW, Iron chelators induce autophagic cell death in multiple myeloma cells. Leuk Res. 38 (2014) 988–996. 10.1016/j.leukres.2014.06.005 [DOI] [PubMed] [Google Scholar]
- 37.Noulsri E, Richardson DR, Lerdwana S, Fucharoen S, Yamagishi T, Kalinowski DS and Pattanapanyasat K, Antitumor activity and mechanism of action of the iron chelator, Dp44mT, against leukemic cells. Am J Hematol. 84 (2009) 170–176. 10.1002/ajh.21350 [DOI] [PubMed] [Google Scholar]
- 38.Merlot AM, Shafie NH, Yu Y, Richardson V, Jansson PJ, Sahni S, Lane DJ, Kovacevic Z, Kalinowski DS and Richardson DR, Mechanism of the induction of endoplasmic reticulum stress by the anti-cancer agent, di-2-pyridylketone 4,4-dimethyl-3-thiosemicarbazone (Dp44mT): Activation of PERK/eIF2alpha, IRE1alpha, ATF6 and calmodulin kinase. Biochem Pharmacol. 109 (2016) 27–47. 10.1016/j.bcp.2016.04.001 [DOI] [PubMed] [Google Scholar]
- 39.Yuan J, Lovejoy DB and Richardson DR, Novel di-2-pyridyl-derived iron chelators with marked and selective antitumor activity: in vitro and in vivo assessment. Blood. 104 (2004) 1450–1458. 10.1182/blood-2004-03-0868 [DOI] [PubMed] [Google Scholar]
- 40.Guo ZL, Richardson DR, Kalinowski DS, Kovacevic Z, Tan-Un KC and Chan GC, The novel thiosemicarbazone, di-2-pyridylketone 4-cyclohexyl-4-methyl-3-thiosemicarbazone (DpC), inhibits neuroblastoma growth in vitro and in vivo via multiple mechanisms. J Hematol Oncol. 9 (2016) 98 10.1186/s13045-016-0330-x [DOI] [PMC free article] [PubMed] [Google Scholar]
- 41.Li P, Zheng X, Shou K, Niu Y, Jian C, Zhao Y, Yi W, Hu X and Yu A, The iron chelator Dp44mT suppresses osteosarcoma’s proliferation, invasion and migration: in vitro and in vivo. Am J Transl Res. 8 (2016) 5370–5385. [PMC free article] [PubMed] [Google Scholar]
Associated Data
This section collects any data citations, data availability statements, or supplementary materials included in this article.