Abstract
The rate of preterm birth has been increasing worldwide. Most preterm babies are at increased risk of central nervous system impairments as well as respiratory and gastrointestinal complications. The aim of this study was to investigate the trends in preterm birth and associated factors contributing to preterm delivery in Taiwan. Information on obstetric antecedents and risk factors of preterm birth of pregnant women was obtained from the Taiwan National Medical Birth Register database. All live births from 2001 to 2011 in Taiwan were included in this study. A total of 2,334,532 live births from 2001 to 2011 were included in this study. Overall, the proportion of preterm deliveries increased by 11.1% (from 8.2% in 2001 to 9.1% in 2011). Multiple logistic regression analyses showed that nulliparity, multiple births, maternal medical complications, maternal age <20 years or ≥40 years, and medical indication for earlier delivery were positively associated with an increased risk of preterm delivery. Nulliparous women aged younger than 20 years and older than 40 years should be recognized as at-risk for preterm birth.
Keywords: epidemiology, indicated preterm birth, prematurity, preterm delivery, spontaneous
1. Introduction
Preterm birth is a multietiological disease caused by spontaneous preterm labor or by either inducing labor or performing a cesarean delivery.[1–3] Preterm births account for more than 50% of long-term morbidity and 75% of perinatal mortality.[4] Most preterm infants are at increased risk of neurodevelopmental impairments as well as respiratory and gastrointestinal complications. The preterm birth rate has increased in most developed countries, despite advancing knowledge of the mechanisms related to preterm labor and the introduction of medical prevention strategies designed to reduce the incidence of preterm birth.[5–7] The preterm delivery rate is 12% to 15% in the USA, the rates of preterm birth are generally 5% to 9% in Europe and other developed countries,[8–11] and in China, the preterm birth rate increased from 4.7% in 1987 to 18.9% in 2006.[12] Low or advanced maternal ages, socioeconomic status, parity, smoking, low or high body mass index (BMI) and obstetric history of previous pregnancy complications are the main risk factors for preterm birth.[13–15]
The precise mechanism for the cause of preterm birth is still unclear in most cases. Therefore, risk factors associated with preterm deliveries have been sought in an attempt to prevent preterm labor. Many maternal or fetal factors, including nutritional status, psychological characteristics, adverse behaviors, infections, uterine contractions, length of the cervix, and genetic factors, are associated with the risk of preterm deliveries.[16,17] Preterm labor is now considered as a complex syndrome initiated by multiple mechanisms, including infection, uteroplacental ischemia or hemorrhage, uterine overdistension, stress, and other immunological reactions.[18]
The increase in the preterm birth rate may increase the need for social support and medical intervention.[19–21] However, little information on preterm births among Taiwanese women has been reported. The objectives of this study were to explore the trend of preterm births and factors contributing to preterm delivery in Taiwan.
2. Methods
2.1. Data source
We collected all premature-related data from the Taiwan National Medical Birth Register database, a nation-wide database on all births in Taiwan.[22,23] The reported information included maternal age, gravidity, medical complications of pregnancies, labor and delivery complications, labor induction data, methods of delivery, and limited data on neonatal status.
2.2. Study population
All live births greater than or equal to 20 weeks of gestation in Taiwan from 2001 to 2011 were included in the study population. All stillbirths (0.6%) and cases with missing information on gestational length (2.8%) were excluded.
Approval was obtained from the Institutional Review Board of National Cheng Kung University Hospital, Tainan, Taiwan.
2.3. Definition
Preterm births were defined as births at greater than or equal to 20 completed weeks of gestation and less than 37 completed weeks of gestation.[23] In this study, preterm births were further divided into 2 categories:
-
(1)
spontaneous preterm birth (including births with spontaneous onset of labor and preterm premature rupture of membranes) and
-
(2)
nonspontaneous preterm birth or medically indicated preterm births (including births requiring medical labor induction or cesarean delivery before onset of labor).
Gestational age was based on the difference between the date of the last menstrual period reported at the first antenatal visit and dates of delivery and ultrasound.[24]
The variables of preterm status were defined as extremely preterm birth (22–27 weeks of gestation), very preterm birth (28–31 weeks of gestation), and moderately preterm birth (32–36 weeks of gestation).[15]
Nulliparity was defined as those women having their first pregnancy/delivery, and multiparity was defined as those women having their second or greater pregnancy/delivery.[25] Maternal age was defined as the age at the time of delivery.[26]
The maternal medical complications were defined as a mother who had disease during the pregnancy period, including hypertension, pre-eclampsia, eclampsia, gestational hypertension, placental abruption, placenta previa, pre-existing diabetes, gestational diabetes, chronic renal disease, and oligohydramnios.
3. Statistical analysis
Data were stratified by singleton pregnancy, multiple pregnancy, maternal age, nulliparity, multiparity, spontaneous onset of labor, and medically indicated labor. Preterm birth trends and related variables were calculated according to the difference in the rates from 2001 to 2011. The preterm deliveries rate was calculated by dividing the number of preterm deliveries by the total number of deliveries in this population. All variables were analyzed using the Chi-squared test or Fisher exact test for categorical variables and t tests for continuous variables. The Cochran–Armitage test for trend was used to compare rate changes among groups as appropriate. All variables that were significant in the univariate analysis were entered into the stepwise multivariate logistic regression analysis procedure. In the multiple logistic regression analysis, all measured effects were controlled by controlling the influences of all other variables at the time of testing. Statistical significance was defined as an alpha level of 0.05 or less. All statistical analyses were performed using SPSS version 20 (IBM Corp, Armonk, NY).
The population proportional attributable risk (PAR) was calculated based on the following formula[27]:
 |
4. Results
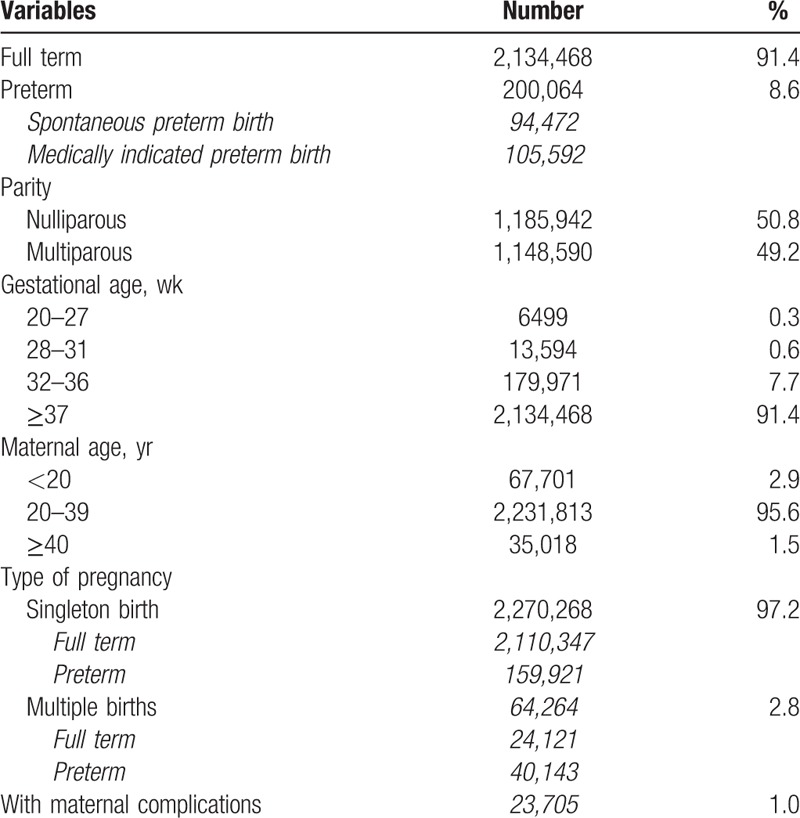
Table 1 shows the live births enrolled in the study by maternal obstetric characteristics. From 2001 to 2011, there was a total of 2,334,532 live births at greater than 20 weeks in Taiwan; 2,134,468 (91.4%) of these were full-term births, 94,472 (4.0%) were spontaneous preterm births, and 105,592 (4.5%) were indicated preterm births. Stratified by gestational age, 6499 (0.3%) were born at 20 to 27 weeks, 13,594 (0.6%) at 28 to 31 weeks, 179,971 (7.7%) at 32 to 36 weeks, and 2,134,468 (91.4%) at ≥37 weeks. According to the pregnancy status, 2,270,268 (97.2%) were singleton pregnancies, and 64,264 (2.8%) were multiple pregnancies.
Table 1.
Number and percentage of live births enrolled in the study according to maternal obstetric characteristics in Taiwan, 2001 to 2011 (total number of live births = 2,334,532).

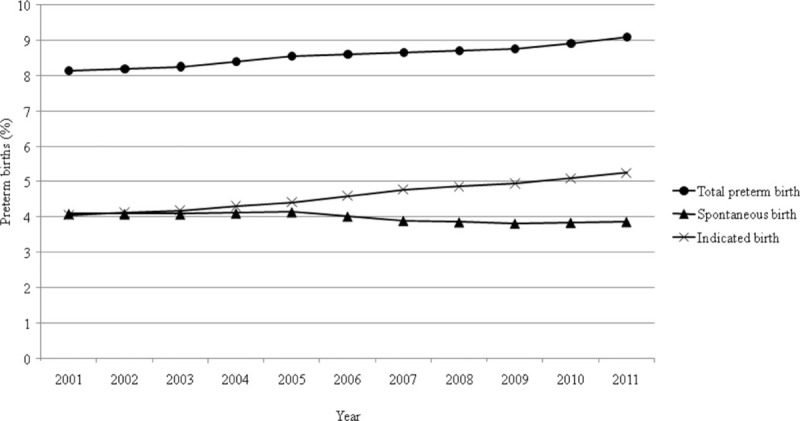
Figure 1 shows the trends of the preterm birth rate in Taiwan. The overall preterm rate increased by 11.1% (from 8.2% in 2001 to 9.1% in 2011) between 2001 and 2011. When we stratified preterm deliveries in the population by spontaneous preterm and medically indicated preterm deliveries, the change in the preterm birth rate after the spontaneous onset of labor for the total population was −6.1% (from 4.1% in 2001 to 3.9% in 2011), and the change in the preterm birth rate after the indicated preterm for the total population was 29.7% (from 4.0% in 2001 to 5.2% in 2011).
Figure 1.

Time trends in preterm birth among liveborn births in Taiwan, 2001 to 2011.
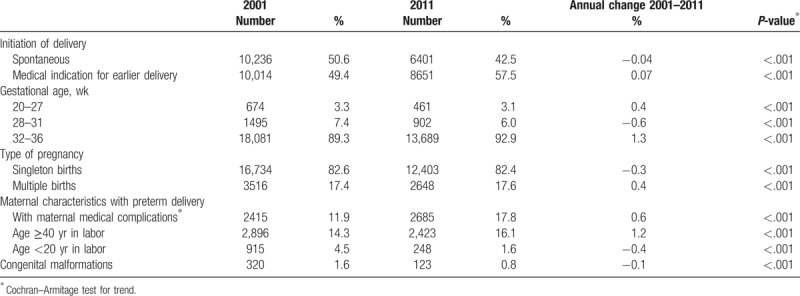
Table 2 shows the number and proportion of preterm births associated with major obstetric antecedents. During the study period, we found that the proportion of spontaneous initiation of delivery onset decreased (annual decrease, 0.04%), while the proportion of medically indicated preterm deliveries increased (annual rate, 0.07%). The proportions of deliveries at 20 to 27 weeks and 32 to 36 weeks gestational age increased (the annual rates were 0.4% and 1.3%, respectively), and the proportion of deliveries at 28 to 31 weeks gestational age decreased (annual rate, −0.6%). Increased maternal age (≥40 years, annual increase 1.2%), multiple pregnancies (annual increase rate of 0.4%), and medical complications (annual increase rate of 0.6%) were significantly associated with the risk of preterm birth.
Table 2.
Numbers and percentages of preterm births in association with major obstetric antecedents.

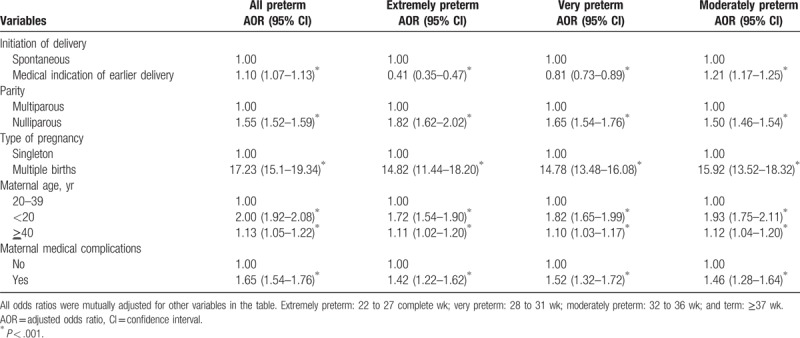
Table 3 shows the results of the multivariate logistic analysis of risk factors for preterm delivery in Taiwan, 2001 to 2011. The independent variables were the initiation of delivery, parity, pregnancy type, maternal age, and maternal medical complications. Significant contributions to preterm birth included medically indicated pre-term labor (adjusted odds ratio [AOR]=1.10; 95% confidence interval [CI] 1.07–1.13; P < .001), nulliparity (AOR 1.55; 95% CI 1.52–1.59; P < .001), multiple births (AOR 17.23; 95% CI 15.12–19.34; P < .001), maternal age younger than 20 years (AOR 2.00; 95% CI 1.92–2.08; P < .001) or ≥40 years (AOR 1.13; 95% CI 1.05–1.22; P < .001) at the time of giving birth, and the presence of maternal medical complications (AOR 1.65; 95% CI 1.54–1.76; P < .001).
Table 3.
Multivariate logistic analysis of risk factors for preterm delivery in Taiwan, 2001–2011.

The PAR values based on the prevalence of various factors in the population were 21.9% for nulliparity, 31.0% for multiple births, and 0.4% for nonspontaneous onset of labor.
5. Discussion
The results presented in this study highlight an increase in the rate of preterm births among women who had a live-born infant in Taiwan, a finding that was similar to those of previous studies worldwide.[28,29] The main reason for the increase in the preterm birth rate is the increasing numbers of medically indicated preterm births.[19]
Pregnancies with multiple fetuses carry a substantial risk of preterm delivery.[3,18] Approximately 40% of twins will have spontaneous labor or preterm, premature rupture of the membrane before 37 weeks of gestation,[29] while others can have preterm delivery due to maternal medical complications.[3] Uterine overdistension is considered as the causative mechanism for the increased spontaneous preterm birth rate.[18] Previous studies found that the preterm rate was lower in the presence of a single embryo compared with multiple embryos.[30,31] However, in this study, we lacked sufficient information on women who used assisted reproductive technologies. Our study had similar findings in that multiple births had a higher risk of preterm delivery.
Similar to the previous studies,[32,33] our study found that parity was associated with preterm birth, with higher rates in nulliparous women and lower rates in multiparous women. The combined effects of advanced maternal age and parity have been reported.[26,34] Some studies comparing nulliparous and parous women[15,35,36] suggest that advanced maternal age influences the risk of preterm birth, regardless of parity.
In the USA, the preterm birth rate at 32 to 36 weeks increased from 7.3% in 1990 to 9.1% in 2005.[5] In 2005, preterm birth at 32 to 36 weeks accounted for more than 70% of all preterm births. Consistent with previous studies,[7,17] our study also found that the preterm birth rate was highest at 32 to 36 weeks gestation in the population in Taiwan. The reason for the increase in preterm births at 32 to 36 weeks is not well understood. Several theories have been raised.[37] First, the increased use of reproductive technologies can result in an increase in multifetal pregnancies; advances in perinatal management, fetal health monitoring, medical intervention during pregnancy, and neonatal intensive care could also be contributing factors.[37] As a result, fetuses considered to be at risk for stillbirth may be identified earlier, resulting in more deliveries at 32 to 36 weeks of gestation.
We observed that the rate of preterm deliveries increased as the maternal age increased. Previous studies also have identified trends in the mean maternal age at the birth of the first child, and advanced maternal age has been positively associated with early preterm delivery.[7,38–40] This observation indicates that the increase in the preterm birth rate may be due to indicated preterm deliveries during the study period.
Similar to the results of the previous study,[23] this study found that the preterm birth rate in Taiwan increased from 8.2% in 2001 to 9.1% in 2011. The risk factors were multiple births, followed by maternal medical complications, and maternal age <20 years or ≥40 years. However, advances were obtained in this study over and above the findings from Wang's study, as there were 2 additional years,[23] and we performed a more detailed analysis on the relationship between parity and the preterm birth rate and found that nulliparous women had higher preterm birth rate in Taiwan. This association gave us more information about the risk of preterm birth.
It was interesting that the medically indicated preterm birth rate increased markedly, while the spontaneous preterm birth rate decreased. However, this finding is consistent with the findings in the studies in the USA and Latin America from the 1980s to the 2000s.[19,41,42] There are 2 possible explanations for this finding
-
(1)
It may be due to the high level of access to hospitals in Taiwan. A mandatory national health insurance program was implemented by the Taiwan government in 1995. By 1999, more than 96% of the population in Taiwan was covered by the program,[43] and the program provides comprehensive coverage.
-
(2)
Physicians are more aggressive with the management of chronic diseases (eg, hypertensive disorders) and other medical complications.[44]
The increase in medically indicated preterm birth is likely to be related with a reduction in the perinatal mortality rate.[11,45] There were several limitations in the present study. First, there was underreporting or misclassification of medical and obstetric complications. In fact, the low number of pregnancies with medical complications in the induced labor group could have resulted from misclassification or a lack of the classification data in the birth record. Nonetheless, the large sample size enabled us to assess the contribution of risk factors in the Taiwanese population, adjusted for confounding factors, decreasing the risk of potential biases. Second, we did not collect data on mothers who received assisted reproductive technology during the study time period. Previous studies have indicated that both singleton and multiple pregnancies resulting from assisted conception have a disproportionate rate of preterm births.[46] However, from 2001 to 2011, among the large numbers of women (approximately 2 million mothers) in the sample who had live births, the percentage of pregnant women who used assisted reproduction technology as a percentage of all women who gave birth to a live infant was less than 1%. From the previous studies,[47] we learned that 11% of singleton pregnancies were preterm, and 45% of mothers who used assisted reproduction technology for a singleton pregnancy had a cesarean section. Third, the database did not include information on certain risk factors, including maternal smoking history, maternal height, weight, BMI, socioeconomic status, or education level.
In conclusion, this study showed that the rate of preterm birth has risen over the 11-year study period. The main reason for the increase in the preterm birth rate is the increasing number of medically indicated preterm births. Nulliparity, multiple pregnancies, maternal age younger than 20 years or older than 40 years, and maternal medical complications increase the risk for preterm delivery.
Author contributions
KHC contributed on the study's design, data collection, and analysis. ICC participated in the data collection and data analysis. YCY contributed to interpretation of results. KTC served as the principal responsible for the study's design and writing of this manuscript. All authors approved the final version of the manuscript.
Conceptualization: Kow-Tong Chen.
Data curation: I-Chu Chen.
Formal analysis: I-Chu Chen.
Methodology: Kou-Huang Chen.
Supervision: Kou-Huang Chen, Yi-Chieh Yang, Kow-Tong Chen.
Validation: Yi-Chieh Yang.
Writing – Original Draft: Kou-Huang Chen, Kow-Tong Chen.
Writing – review and editing: Kow-Tong Chen.
Footnotes
Abbreviations: AOR = adjusted odds ratio, BMI = body mass index, CI = confidence interval, PAR = proportional attributable risk.
The funding of this study was supported by the Chi-Mei Medical Center, Tainan, Taiwan (CLFHR-10406).
The authors have no conflicts of interest to disclose.
References
- [1].Savitz DA, Blackmore CA, Thorp JM. Epidemiologic characteristics of preterm delivery: etiologic heterogeneity. Am J Obstet Gynecol 1991;164:467–71. [DOI] [PubMed] [Google Scholar]
- [2].Kramer MS, Papageorghiou A, Culhane J, et al. Challenges in defining and classifying the preterm birth syndrome. Am J Obstet Gynecol 2012;206:108–12. [DOI] [PubMed] [Google Scholar]
- [3].Goldenberg RL, Culhane JF, Iams JD, et al. Epidemiology and causes of preterm birth. Lancet 2008;371:75–84. [DOI] [PMC free article] [PubMed] [Google Scholar]
- [4].McCormick MC. The contribution of low birth weight to infant mortality and childhood morbidity. N Engl J Med 1985;312:82–90. [DOI] [PubMed] [Google Scholar]
- [5].Martin JA, Hamilton BE, Osterman MJK, et al. Births: final data for 2013. Natl Vital Stat Rep 2015;64:1–65. [PubMed] [Google Scholar]
- [6].Goldenberg RL, Rouse DJ. The prevention of premature birth. N Engl J Med 1998;339:313–20. [DOI] [PubMed] [Google Scholar]
- [7].Tracy SK, Tracy MB, Dean J, et al. Spontaneous preterm birth of liveborn infants in women at low risk in Australia over 10 years: a population-based study. BJOG 2007;114:731–5. [DOI] [PubMed] [Google Scholar]
- [8].Slattery MM, Morrison JJ. Preterm delivery. Lancet 2002;360:1489–97. [DOI] [PubMed] [Google Scholar]
- [9].Hamilton BE, Martin JA, Ventura SJ. Births: Preliminary Data for 2005. Health E-Stats. Hyattsville, MD, 2006. Available at: http://www.cdc.gov/nchs/products/pubs/pubd/hestats/prelimbirths05/prelimbirths05.htm Accessed December 15, 2016. [PubMed] [Google Scholar]
- [10].Shennan AH, Bewley S. Why should preterm births be rising? BMJ 2006;332:924–5. [DOI] [PMC free article] [PubMed] [Google Scholar]
- [11].Blondel B, Supernant K, Du Mazaubrun C, et al. Trends in perinatal health in metropolitan France between 1995 and 2003: results from the National Perinatal Surveys. J Gynecol Obstet Biol Reprod (Paris) 2006;35:373–87. [DOI] [PubMed] [Google Scholar]
- [12].Han W, Song J, Liu A, et al. Trends in live births in the past 20 years in Zhengzhou, China. Acta Obstet Gynecol Scand 2011;90:332–7. [DOI] [PubMed] [Google Scholar]
- [13].Schemf AH, Branum AM, Luskacs SL, et al. Maternal age and parity-associated risks of preterm birth: differences by race/ethnicity. Paediatr Perinat Epidemiol 2007;21:34–43. [DOI] [PubMed] [Google Scholar]
- [14].Schmidt L, Sobotka T, Bentzen JG, et al. Demographic and medical consequences of the postponement of parenthood. Hum Reprod Update 2012;18:29–43. [DOI] [PubMed] [Google Scholar]
- [15].Waldenstrom U, Cnattingius S, Vixner L, et al. Advanced maternal age increases the risk of very preterm birth, irrespective of parity: a population-based register study. BJOG 2017;124:1235–44. [DOI] [PubMed] [Google Scholar]
- [16].Goldenberg RL, Goepfert AR, Ramsey PS. Biochemical markers for the prediction of preterm birth. Am J Obstet Gynecol 2005;192:S36–46. [DOI] [PubMed] [Google Scholar]
- [17].Langhoff-Roos J, Kesmodel U, Jacobsson B, et al. Spontaneous preterm delivery in primiparous women at low risk in Denmark: population based study. BMJ 2006;332:937–9. [DOI] [PMC free article] [PubMed] [Google Scholar]
- [18].Romero R, Espinoza J, Kusanovic JP, et al. The preterm parturition syndrome. BJOG 2006;113:17–42. [DOI] [PMC free article] [PubMed] [Google Scholar]
- [19].Ananth CV, Joseph KS, Oyelese Y, et al. Trends in preterm birth and perinatal mortality among singletons: United States, 1989 through 2000. Obstet Gynecol 2005;105:1084–91. [DOI] [PubMed] [Google Scholar]
- [20].Meis PJ, Michielutte R, Peters TJ, et al. Factors associated with preterm birth in Cardiff, Wales. II. Indicated and spontaneous preterm birth. Am J Obstet Gynecol 1995;173:597–602. [DOI] [PubMed] [Google Scholar]
- [21].Gardner MO, Goldenberg RL, Cliver SP, et al. The origin and outcome of preterm twin pregnancies. Obstet Gynecol 1995;85:553–7. [DOI] [PubMed] [Google Scholar]
- [22].Ministry of Health and Welfare, Taiwan. 2013. National Medical Birth Register System. Available at: http://olap.bhp.doh.gov.tw/system/SiteSecret.aspx?ID=3&menu=-30 Accessed September 9, 2015. [Google Scholar]
- [23].Wang LK, Chen WM, Chen CP. Preterm birth trend in Taiwan from 2001 to 2009. J Obstet Gynaecol Res 2014;40:1547–54. [DOI] [PubMed] [Google Scholar]
- [24].Morken NH, Källen K, Hagberg H, et al. Preterm birth in Sweden 1973–2001: rate, subgroups, and effect of changing patterns in multiple births, maternal age, and smoking. Acta Obstet Gynecol Scand 2005;84:558–65. [DOI] [PubMed] [Google Scholar]
- [25].Mgaya AH, Massawe SN, Kidanto HL, Mgaya HN. Grand multiparity: is it still a risk in pregnancy? BMC Pregnancy Childbirth 2013;13:1–8. [DOI] [PMC free article] [PubMed] [Google Scholar]
- [26].Delbaere I, Verstraelen H, Goetgeluk S, et al. Pregnancy outcome in primiparae of advanced maternal age. Eur J Obstet Gynecol Reprod Biol 2007;135:41–6. [DOI] [PubMed] [Google Scholar]
- [27].Rothman K, Greenland S, Lash L. Modern Epidemiology. Philadelphia, PA: Lippincott, Williams and Wilkins; 2008. [Google Scholar]
- [28].Beck S, Wojdyla D, Say L, et al. The worldwide incidence of preterm birth: a systematic review of maternal mortality and morbidity. Bull World Health Organ 2010;88:31–8. [DOI] [PMC free article] [PubMed] [Google Scholar]
- [29].Lawn JE, Gravett MG, Nunes TM, et al. Global report on preterm birth and stillbirth (1 of 7): definitions, description of the burden and opportunities to improve data. BMC Pregnancy Childbirth 2010;10Suppl 1:1–22. [DOI] [PMC free article] [PubMed] [Google Scholar]
- [30].McLernon DJ, Harrild K, Bergh C, et al. Clinical effectiveness of elective single versus double embryo transfer: Meta-analysis of individual patient data from randomized trials. BMJ 2010;341:1–3. [DOI] [PMC free article] [PubMed] [Google Scholar]
- [31].Jakobsson M, Gissler M, Paavonen J, et al. The incidence of preterm deliveries decreases in Finland. BJOG 2008;115:38–43. [DOI] [PubMed] [Google Scholar]
- [32].Mayo JA, Shachar BZ, Stevenson DK, et al. Nulliparous teenagers and preterm birth in California. J Perinat Med 2017;45:959–67. [DOI] [PubMed] [Google Scholar]
- [33].Auger N, Hansen AV, Mortensen L. Contribution of maternal age to preterm birth rates in Denmark and Quebec, 1981-2008. Am J Public Health 2013;103:e33–8. [DOI] [PMC free article] [PubMed] [Google Scholar]
- [34].Aldous MB, Edmonson MB. Maternal age at first childbirth and risk of low birth weight and preterm delivery in Washington State. JAMA 1993;270:2574–7. [PubMed] [Google Scholar]
- [35].Chan BCP, Tsz-Hsi Lao TTH. Effect of parity and advanced maternal age on obstetric outcome. Int J Gynecol Obstet 2008;102:237–41. [DOI] [PubMed] [Google Scholar]
- [36].Luke B, Brown MB. Elevated risks of pregnancy complications and adverse outcomes with increasing maternal age. Hum Reprod 2007;22:1264–72. [DOI] [PubMed] [Google Scholar]
- [37].Engle WA, Tomashek KM, Wallman C. Committee on fetus and newborn, American Academy of Pediatrics. “Late-preterm” infants: a population at risk. Pediatrics 2007;120:1390–401. [DOI] [PubMed] [Google Scholar]
- [38].Hsieh TT, Liou JD, Hsu JJ, et al. Advanced maternal age and adverse perinatal outcomes in an Asian population. Eur J Obstet Gynecol Reprod Biol 2010;148:21–6. [DOI] [PubMed] [Google Scholar]
- [39].Bayrampour H, Heaman M, Duncan KA, et al. Comparison of perception of pregnancy risk of nulliparous women of advanced maternal age and younger age. J Midwifery Womens Health 2012;57:445–53. [DOI] [PubMed] [Google Scholar]
- [40].Biro MA, Davey MA, Carolan M, et al. Advanced maternal age and obstetric morbidity for women giving birth in Victoria, Australia: a population-based study. Aust N Z J Obstet Gynaecol 2012;52:229–34. [DOI] [PubMed] [Google Scholar]
- [41].American College of Obstetricians and Gynecologists. ACOG committee opinion no. 561: nonmedically indicated early-term deliveries. Obstet Gynecol 2013;121:911–5. [DOI] [PubMed] [Google Scholar]
- [42].Barros FC, Velez MP. Temporal trends of preterm birth subtypes and neonatal outcomes. Obstet Gynecol 2006;107:1035–41. [DOI] [PubMed] [Google Scholar]
- [43].Wu CL, Yang YC, Huang LM, Chen KT. Cost-effectiveness of childhood rotavirus vaccination in Taiwan. Vaccine 2009;27:1492–9. [DOI] [PubMed] [Google Scholar]
- [44].MacDorman MF, Reddy UM, Silver RM. Trends in stillbirth by gestational age in the United States, 2006-2012. Obstet Gynecol 2015;126:1146–50. [DOI] [PMC free article] [PubMed] [Google Scholar]
- [45].Bailit JL, Lappen JR. Stillbirth and the 39-week rule: can we be reassured? Obstet Gynecol 2015;126:1131–2. [DOI] [PubMed] [Google Scholar]
- [46].Lumley J. Defining the problem: the epidemiology of preterm birth. BJOG 2003;110:3–7. [PubMed] [Google Scholar]
- [47].Wang YA, Dean JH, Grayson N, et al. Assisted Reproductive Technology in Australia and Technology Series No. 10 Catalogue No. PER 39. Sydney, Australia: AIHW National Perinatal Statistics Unit; 2006. [Google Scholar]


