

Abstract
A major challenge in the field of water electrolysis is the scarcity of oxygen-evolving catalysts that are inexpensive, highly corrosion-resistant, suitable for large-scale applications and able to oxidize water at high current densities and low overpotentials. Most unsupported, non-precious metals oxygen-evolution catalysts require at least ~350 mV overpotential to oxidize water with a current density of 10 mA/cm2 in 1 M alkaline solution. Here we report on a robust nanostructured porous NiFe-based oxygen evolution catalyst made by selective alloy corrosion. In 1 M KOH, our material exhibits a catalytic activity towards water oxidation of 500 mA/cm2 at 360 mV overpotential and is stable for over eleven days. This exceptional performance is attributed to three factors. First, the small size of the ligaments and pores in our mesoporous catalyst (~10 nm) results in a high BET surface area (43 m2/g) and therefore a high density of oxygen-evolution catalytic sites per unit mass. Second, the open porosity facilitates effective mass transfer at the catalyst/electrolyte interface. Third and finally, the high bulk electrical conductivity of the mesoporous catalyst allows for effective current flow through the electrocatalyst, making it possible to use thick films with a high density of active sites and ~3×104 cm2 of catalytic area per cm2 of electrode area. Our mesoporous catalyst is thus attractive for alkaline electrolyzers where water-based solutions are decomposed into hydrogen and oxygen as the only products, driven either conventionally or by photovoltaics.
Table of contents entry
Mesoporous NiFeMn-based electrocatalysts made by selective alloy corrosion stably produce O2 from water for more than eleven days in 1 M KOH at a current density of 500 mA/cm2 and an overpotential of just 360 mV.
1. Introduction
State-of-the-art oxygen evolution catalysts supported on commercially available three-dimensional nickel foams with pore sizes in the submillimeter and millimeter ranges exhibit exceptionally good catalytic activities.1,2,3,4,5 For example, Co-based oxygen-evolving catalyst can achieve a current density of 1 mA/cm2 at ~410 mV overpotential near neutral pH in thin film format.6 When this catalyst is electrodeposited onto a three-dimensional nickel foam scaffold, its activity towards water oxidation near neutral pH is further increased, resulting in a current density of 100 mA/cm2 at 363 mV overpotential with stability of over 90 hours.1 NiFe-based material systems represent another promising class of high-performance non-precious metals oxygen evolution catalysts.7,8,9,10,11 Thin film NiFe-based oxygen evolution catalysts can deliver a current density of 10 mA/cm2 at ~350 mV overpotential in 1 M alkaline solutions.7 When NiFe-based oxygen evolution catalysts are grown onto three-dimensional nickel foams, they only require 240 mV overpotential to deliver a current density of 10 mA/cm2 in 1 M NaOH solution.2 In 10 M KOH, they also require only 240 mV overpotential to deliver a current density of 500 mA/cm2 over 2 hours.3
Oxygen-evolving catalysts supported onto three-dimensional nickel foams have both positive and negative attributes. On the positive side, the high intrinsic electrical conductivity of the nickel foam allows it to act as an effective current collector for the catalyst. In addition, the porous architecture of open cell nickel foams favours effective mass transfer of both ionic species and gas molecules at the catalyst/electrolyte interface. The main drawback for the usage of commercially available nickel foams for these type of applications is their very large pore sizes, which is commonly in the submillimeter to millimeter range. Consequently, the specific surface area of open cell nickel foams is very low, less than 1 m2/g depending on the pore size distribution.12,13,14 Concretely, it means that the total effective interface surface area of a 1 cm2 area film of open cell nickel foam foil with a thickness of 10 μm can be less than 1 cm2. In other words, the surface area of a dense nickel foil can be higher than that of a porous nickel foam foil.
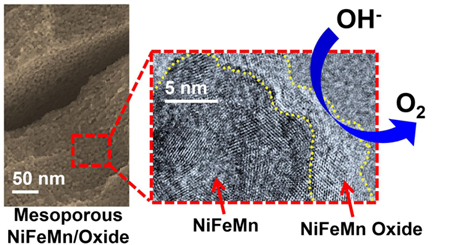
Based on these considerations, it appears that mesoporous structures with pore size distributions in the nanometer regime are needed to further improve the catalytic activity of these oxygen-evolving catalysts. In contrast to nickel foams, which exhibit very low interfacial surface areas, three-dimensional mesoporous structures can exhibit much larger interfacial surface areas, since the specific surface area scales inversely with the average pore size.15,16,17 Here we thus exploit dealloying to produce a high-performance, robust, and ultrafine mesoporous NiFeMn-based oxygen-evolving catalysts with average ligament and pore sizes on the order of ~10 nm. The material has a BET surface area of 43 m2/g and high electrical conductivity. Below we present the synthesis, characterization, and electrocatalytic performance of these novel mesoporous metal/metal oxide composite catalysts.
2. Experimental
2.1. Materials and methods
A home-built electric arc furnace was used to make the parent alloys from the component elements (Ni, Fe, Mn) in the powder form. See Text S1 in ESI† for more details. Those elements were thoroughly mixed at the proper stoichiometry (Ni15Fe20Mn65 at. %, Ni30Mn70 at. %, or Fe40Mn60 at. %), and consolidated by pressing them into pellets using 2.5 tons of force in a 13 mm die. Samples were then heated until molten using an electric arc furnace under one atmosphere of ultrahigh purity argon atmosphere. During that ‘alloying’ process, the samples were fully melted into a liquid state and allowed to cool. After cooling, the samples were flipped and re-melted. That process was repeated a minimum of four times to ensure thorough mixing. The local temperature of the samples while molten was ~1500oC, which exceeds the melting point the elements in the mixture. Subsequent elemental characterization of the samples was performed to elucidate the post-arc melted stoichiometry. The as-synthesized parent alloys were then cold-rolled (see Text S1, ESI†) and dealloyed in 1 M aqueous solution of ammonium sulphate supplied by Sigma Aldrich. Details on ‘dealloying’ are provided in section 2.2. Overall, we found that the structure and composition of the final dealloyed catalyst was highly reproducible as long as the homogeneity and stoichiometry of the as-synthesized parent alloy was carefully controlled.
A JEOL Scanning Electron Microscope (SEM) with Energy Dispersive Spectroscopy (EDS) was used to analyse the microstructure and bulk elemental composition of our samples before and after dealloying. In addition to EDS, Wavelength-Dispersive Spectroscopy (WDS) using a JEOL JXA-8200 electron microprobe equipped with a wavelength-dispersive detector was also used to confirm the bulk elemental composition of our samples. Raman spectroscopy was performed to study the metal oxide bonds in our dealloyed materials, using a Renishaw inVia Raman confocal microscope with excitation wavelength 514 nm and 200 mW laser power. The local surface composition of our dealloyed samples was analysed using X-ray Photoelectron Spectroscopy (XPS) using a Kratos Axis Ultra DLD spectrometer with a monochromatic Al (Kα) radiation source. Powder X-ray diffraction (XRD) was performed using a PANalytical X’Pert Pro diffractometer operating with Cu Kα (λ = 1.5418 Å) using a 0.03° step size, an accelerating voltage of 45 kV, and a current of 40 mA. An FEI Titan S/TEM High-Resolution Transmission Electron Microscopy (HRTEM) operating at 300 kV in transmission mode was used to further analyse the microstructure of dealloyed specimens.
Nitrogen porosimetry was carried out using a Micromeritics TriStar II 3020 porosimeter. The surface area was then calculated from the adsorption branch of the isotherm at low relative pressures using the Brunauer-Emmett-Teller (BET) model. The pore diameter and pore volume were also derived from the adsorption branch of the isotherm using the Barret-Joyner-Halenda (BJH) model. An Arbin BT-2000 station was used for electrochemical characterization, in combination with a standard three-electrode electrochemical cell. For these measurements, our mesoporous Ni60Fe30Mn10-based catalyst film was used as the working electrode, Pt foil was used as the counter electrode, and either Hg/HgO or Ag/AgCl was used as the reference electrode. The faradaic efficiency of our mesoporous catalyst for oxygen evolution was estimated using the water displacement method to determine the amount of gas produced18,19 (See for more details Fig. S1 and Text S2 in ESI†).
2.2. Synthesis of mesoporous Ni60Fe30Mn10-alloy based metal/metal oxide composite thick film catalysts
Nanoporous metals with mesopores (pore size < 50 nm ‒IUPAC classification) or macropores (pore size > 50 nm ‒UPAC classification) are commonly made by dealloying, a top-down nanosynthesis technique where the most chemically active element is selectively removed from a dense parent alloy using acidic or alkaline aqueous electrolytes, sometimes in combination with a bias voltage.15,16,17,20,21,22 For the synthesis of our mesoporous NiFeMn-based catalyst, we use as the parent alloy a ternary system with composition Ni15Fe20Mn65 at. %. The mesoporous catalyst was obtained from the parent alloy by free-corrosion dealloying (i.e. without bias voltage assistance) in a 1 M aqueous solution of (NH4)2SO4 (see Text S3 in ESI† for more details). During that dealloying process, both Fe and Mn, which are more chemically reactive than Ni, gradually dissolve in the weak acid corroding solution. Mn dissolves more readily than Fe, however, so the initial composition was chosen to include enough Mn to produce the desired nanoporous architecture, and enough Fe to reach the a near optimal Fe:Ni ratio after the majority of the Mn is removed.
3. Results and discussion
3.1. Dealloyed mesoporous Ni60Fe30Mn10-alloy based metal/metal oxide composite thick film catalysts
In general, nanoparticulate NiFe-based catalysts exhibit optimal activity towards water oxidation at a Fe:Ni ratio of about 0.5.9 Therefore, we stop our dealloying process when the Fe:Ni ratio in the bulk of the parent alloy drops from ~1.3 down to ~0.5. This corresponds to a bulk elemental composition of ~Ni60Fe30Mn10 at. % in the dealloyed mesoporous catalyst, as determined by both EDS and WDS. Figures 1a and b show EDS traces for the parent alloy before and after dealloying. It can be seen that the initial Mn-rich parent alloy (Fig. 1a) has lost the majority of its Mn during the free-corrosion process (Fig. 1b).
Fig.1.
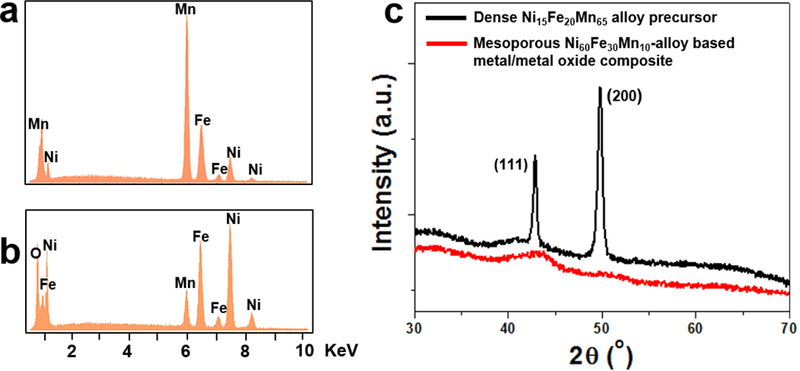
Elemental and structural analysis. Energy dispersive x-ray spectroscopy traces for the parent alloy before (a) and after (b) dealloying. The initial Mn-rich parent alloy has lost the majority of its Mn during dealloying. (c) X-ray diffraction patterns for the parent alloy before (black) and after (red) dealloying. The parent alloy is crystalline with a cubic crystal lattice, while the corresponding dealloyed mesoporous metal/metal-oxide structure is amorphous.
Although the Mn:Ni ratio has significantly dropped from ~4.3 in the parent alloy down to ~0.17 in the mesoporous NiFeMn-based catalyst, there is still ~10 at. % residual Mn present in the bulk of the final mesoporous material (Fig. 1b). Mn is commonly removed from Mn-rich nickel alloys by dealloying via potentiostatic control using a negative bias voltage.23,24,25 Such a negative bias voltage minimizes the electroadsorption of negatively charged oxygen species (OH-, O2–),26,27 and thus prevents spontaneous oxide formation in dealloyed mesoporous nickel-based systems, resulting in nearly oxide-free mesoporous nickel structures23,24,25. In this work, however, we are interested in producing oxide-rich mesoporous NiFe-based systems, since the oxide plays an important role in the oxygen evolution reaction.28 Therefore, the oxygen peak observed in Fig. 1b as a consequence of the partial oxidation of the dealloyed material is desirable. As a result, potentiostatic dealloying is not ideal for the materials described here. More importantly, we have observed that both Mn and Fe are etched away during dealloying via potentiostatic control, under similar conditions to those previously reported for NiMn parent alloys,23,24,25 and preserving at least part of the Fe content is desirable here.
Alternatively, fully oxidized structures have be made by free-corrosion dealloying of non-precious metals in strongly alkaline solutions.29 During that process, freshly dealloyed non-precious metal surfaces spontaneously react with water under strongly alkaline corroding solution.29 While this method is effective at producing oxide nanocrystals,29 for the current electrocatalyst application, fully oxidized structures are also not suitable because of the poor electrical conductivity of most metal oxides. Moreover, Al must be used as sacrificial element instead of Mn,29 since Mn is not effectively removed under such alkaline corrosion condition. In this work, we thus use weak acid as the corroding medium to achieve partial oxidation of our dealloyed structures, even if it does not result in full Mn removal.
The local surface composition of our dealloyed mesoporous material may affect its catalytic performance. Both EDS and WDS can be used to analyse the bulk stoichiometry of our mesoporous catalyst, but they do not provide information on the local surface composition. Therefore, XPS was used to analyse the local surface composition (see Fig. S2 in ESI†). XPS gives a surface metal composition of Ni76Fe16Mn8 at. % for a mesoporous catalyst with bulk metal composition Ni60Fe30Mn10 at. %. This data thus indicates that the surface is slightly depleated in the more oxidatively unstable elements: Fe and Mn. The effect of local surface composition and residual Mn will be further considered when studying the performance of our mesoporous catalyst towards water oxidation.
3.2. Phase and structural characterizations
Once formed, materials are characterized by a variety of methods. Fig. 1c shows the XRD patterns for the parent alloy before (black) and after (red) dealloying. While the parent alloy is crystalline with a cubic crystal lattice, the corresponding dealloyed structure is mostly amorphous, as indicated by the absence of sharp signals on the red XRD pattern. Interestingly, in a control experiment, mesoporous Ni90Mn10 at. % made from a parent alloy with composition Ni30Mn70 at. % using similar dealloying conditions to those employed for our mesoporous NiFeMn-based catalyst were crystalline by XRD in the porous, partly oxidized state (see Fig. S3 in ESI†). The poor crystallinity in our mesoporous NiFeMn-based catalyst is in agreement with literature reports on nanoscale NiFe oxides, such as the recent work of Qiu et al. on amorphous nanoparticles of NiyFe1-yOx supported on carbon.9 Furthermore, three metallic elements Ni, Fe, Mn are present in our materials system and such ternary systems having Ni and Fe as base elements are often amorphous.30,31,32
HRTEM was performed in order to further investigate the nanostructure of these catalysts. Figure 2a shows an oxide covered ligament of our NiFeMn-based catalyst. The oxide layer coats all surfaces and appears to be just a few nm thick. Interestingly, in the image, both the metal ligaments and the oxide coating show lattice fringes typical of a crystalline material. While the observed crystalline domains are quite small, a sample with this degree of crystallinity should show stronger diffraction than that observed for these materials (red curve in Fig. 1c). Based on these results, we hypothesize that the amorphous nature of these materials stems from the kinetic frustration of a ternary allow, combined with the low temperature dealloying conditions used to form the material. Upon electron irradiation in the TEM, some sample crystallization can apparently take place, but kinetical frustration prevent crystallization during room temperature dealloying. We thus conclude that the amorphous nature of the material is due to a combination of ternary metals and metal oxides, combined with the low dealloying temperature used to synthesize these materials.
Fig.2.

HRTEM image of a ligament in the NiFeMn-based catalyst. The ligament is covered with an oxide layer a few nm thick, demarcated by the dashed yellow like. In contrast to the data in figure 1C, both the metal ligament and the oxide coating show lattice fringes typical of a crystalline material. Crystallinity in both components like arises from electron beam induced crystallization.
In order to get more insight into the nature of the oxides present, Raman spectroscopy was performed on the dealloyed mesoporous Ni60Fe30Mn10 metal/metal oxide composite in powder form (see Fig. 3). Raman was chosen because it is most sensitive to local bonding, and can be used to characterize bonding motifs in materials that are amorphous by XRD. The observed Raman signals are dominantly attributed to oxide species and not to the metal core, as metals generally show weak Raman intensity because of poor light penetration. Specifically, the signals observed between 300 and 750 cm-1 are attributed to the superposition of various oxide and hydroxide phases. Below we discuss the three components that can be clearly identified from the scattering. As a starting point, we note that Ni(OH)2 can be doped with a variety of transition metals, including Mn and Fe.11,33 This results in a broad Raman signal between 530 and 560 cm-1, depending on the concentration of transition metal dopant.11 The peak around 560 cm-1 is thus partly attributed to Mn- and Fe-doped Ni(OH)2 (see brown arrow in Fig. 3). It is well-established that during oxygen evolution, Fe-doped Ni(OH)2 is converted into Fe-doped NiOOH.9,11 In a similar way, Mn-doped Ni(OH)2 can also be converted into Mn-doped NiOOH.33 (see Text S4 in ESI†). The two peaks at ~475 cm-1 and ~555 cm-1 (Fig. 3, blue arrows) are attributed to Mn- and Fe-doped NiOOH.11 Although these peaks usually arise from the conversion of Ni(OH)2 to NiOOH during oxygen evolution,9,11 they have also been reported in aged pristine NiFe-based catalysts.11 In our case, the presence of NiOOH peaks suggests that the surface of our pristine mesoporous NiFe-based catalyst is already partly optimized for oxygen evolution, as it should contain some sites that can act as active sites for oxygen evolution.9,11,33 The presence of NiOOH at the surface of our catalyst is also indicated by XPS data (ESI figure S2). Finally, besides Mn- and Fe-doped Ni(OH)2 and Mn- and Fe-doped NiOOH,9,11 the 4 peaks marked with orange stars match reasonably well with the characteristic signals of NiFe2O4,34 which shows reference peaks at 333, 487, 571, and 704 cm−1.34 NiFe2O4 shows good corrosion resistance during oxygen evolution,8 so it is an ideal oxide to serve as the support for the catalytically active hydroxide and oxyhydroxide phases.
Fig.3.

Raman spectrum of our mesoporous Ni60Fe30Mn10 metal/metal oxide composite.
In addition to examining local bonding geometries, we can also examine the network connectivity in our materials. Because our mesoporous Ni60Fe30Mn10 metal/metal oxide composite is only partially oxidized, its exhibits very good electrical conductivity. The bulk electrical resistance of a ~300 μm-thick mesoporous Ni60Fe30Mn10 metal/metal oxide composite catalyst was found to be on the order of 10 Ω/cm2. This value is 7 order of magnitudes lower than that of a fully oxidized NiFeMn counterpart (~108 Ω/cm2). For comparison, the electrical resistance of copper foil measure in the same way was found to be ~10-1 Ω/cm2.
Finally, the size of ligaments and pores size in our mesoporous catalyst were characterized using SEM. Fig. 4 shows two scanning electron micrographs of a fracture cross-section of our mesoporous Ni60Fe30Mn10-based catalyst at different magnifications. It can be seen that feature sizes are of the order of 10 nm. The layered pattern comes from cold-rolling the parent alloy down to the desired thickness of 300 μm. Such patterns are even more pronounced in cold-rolled soft noble metals, as previously reported elsewhere.22
Fig.4.

Microstructural characterization. Scanning electron micrographs showing a fracture cross-section of our 300 μm-thick mesoporous catalyst at different magnifications. The ligament size is on the order of 10 nm. The layered pattern comes from cold-rolling the parent alloy down to the desired thickness before dealloying.22
3.3. Nitrogen porosimetry
Nitrogen adsorption experiments were performed in order to further characterize the porosity in our dealloyed material. Fig. 5 shows nitrogen adsorption (black) and desorption (red) isotherms obtained for our mesoporous NiFeMn-based catalyst. Two distinct regions are observed. At high relative pressures, a hysteresis loop associated with capillary condensation is observed, corresponding to a Type IV isotherm, based on IUPAC classification. At lower relative pressures, linear behaviour is observed (see inset Fig. 5), associate with monolayer adsorption. The low pressure data was used to evaluate the specific surface area using the BET method. The corresponding BET surface area was found to be ~43 m2/g. This is more than 7 times higher than the average BET surface area of many noble nanoporous metals such as nanoporous silver.17,16,35 Volume weighted BJH pores size analysis puts the average pore size of our mesoporous NiFeMn-based catalyst at ~10nm (see Fig. S4 in ESI†). This value agrees well with the pores size estimated from SEM images. We note that mesoporous Ni90Mn10- and Fe90Mn10-based samples both made from binary parent alloy precursors (See Text S1 and S3, ESI†) and used in control experiments exhibit somewhat higher BET surface areas (103 m2/g for the mesoporous Ni90Mn10-based material and 206 m2/g for the Fe90Mn10-based material, see porosimetry data in Fig. S5 and Fig. S6 in ESI†). These higher surface area values are explained by slightly smaller pore size distributions (see Fig. S5 and Fig. S6 in ESI†) compared to our optimized mesoporous NiFeMn-based catalyst (See Fig. S4). These surface areas are of the same order as nanoporous Ni, Co, and Mn oxides made by hard templating methods using mesoporous silica.36
Fig.5.

Nitrogen adsorption (black) and desorption (red) isotherms. The linear regime at low relative pressures (Inset) was used to calculate the BET specific surface area of the mesoporous catalyst
The BET specific surface area of our NiFeMn-based mesoporous catalyst measured by nitrogen absorption was further compared to the one predicted by an analytical model for the specific surface area in a wide range of nanoporous materials:15,16,17
| 1 |
Here S corresponds to the specific surface area and ρ represents the solid bulk density of a NiFeMn ternary alloys with the same composition as our mesoporous catalyst (i.e. Ni60Fe30Mn10). In Eq. 1 we use ρ~8.4 g/cm3 (see Text S5 in ESI† for the determination of the solid bulk density ρ). Here, dL represents the average ligament size of our mesoporous catalyst. In Eq.1 we use dL~10 nm. We note that Eq. 1 only gives a good prediction of the specific surface area of a nanoporous material when the ligament diameter, dL, is comparable to the pore size dP (i.e. dL≈dP). Finally, C is a dimensionless constant, which depends on pore geometry. For disordered nanoporous materials like these, the value of C is equal to 3.7.15,16,17 Eq. 1 predicts a specific surface area of ~44 m2/g, which is in very good agreement with the value of 43 m2/g obtained from nitrogen absorption. This agreement, calculated using the density of the metal, not the metal oxide, further confirms that our catalyst is only partly oxidized.
We note that the specific surface area of our mesoporous catalyst (~43 m2/g) is quite high compared to those usually reported for the open cell nickel foams (<1 m2/g)12,13,14 commonly used to support oxygen evolution catalysts.1,2,3,4,5 Since the specific surface area in these materials is inversely proportional to the product ρdL(Eq. 1), the high specific surface area in our mesoporous NiFeMn-based system is a direct results of the small ligaments size (dL ~10 nm).
3.4. Electrochemical characterization of the mesoporous catalyst
3.4.1. Cyclic voltammetry
We next turn to electrochemical characterization of this new material, and evaluation of the performance of our mesoporous Ni60Fe30Mn10 metal/metal oxide catalyst towards water oxidation. We first examined the electrochemical signature of our free-standing thick films catalyst using successive cyclic voltammetry experiments in 0.3 M KOH, at a scan rate of 1 mV/s in the potential range between 0.1 V vs RHE (which is the open circuit voltage, VOC, for our system) and 2.0 V vs RHE. For comparison, similar cyclic voltammetry experiments were performed on mesoporous Ni90Mn10 and Fe90Mn10 metal/metal oxide sample thick films also made by free-corrosion dealloying (see Text S1 and S3 in ESI†). The voltammograms plotted in blue in Fig. 6 were recorded on a free-standing mesoporous Ni90Mn10 metal/metal oxide sample. Despite the residual Mn, the sample exhibits the typical electrochemical signature of a nickel oxide electrode in alkaline medium.9,11 A pair of redox peaks are observed at 1.17 V vs. RHE during the cathodic scan and at 1.47 V vs. RHE during the anodic scan. This pair of redox peaks corresponds to the conversion of Ni(OH)2 to NiOOH according to the following reaction:9,11
| 2 |
Fig.6.

Electrochemical characterization of various metal/metal-oxide catalysts in 0.3 M KOH. Successive cyclic voltammograms recorded on free-standing metal/metal-oxide mesoporous catalysts with metal stoichiometries of Ni90Mn10 (blue), Fe90Mn10 (black), and Ni60Fe30Mn10 (red). The Ni60Fe30Mn10 sample shows the lowest overpotential for oxygen evolution.
A positive oxidation current is then observed at higher voltages (blue voltammogram Fig. 6), beyond 1.6 V vs. RHE, corresponding to oxygen evolution on NiOOH catalytic sites. For comparison, the voltammograms plotted in black in Fig. 6 were recorded on a mesoporous Fe90Mn10 metal/metal-oxide thick film. Oxygen evolution takes place at much higher potentials for this sample, beyond 1.72 V vs. RHE. Finally, the successive cyclic voltammograms plotted in red in Fig. 6 were obtained from our free-standing mesoporous Ni60Fe30Mn10 metal/metal oxide catalyst. For this sample, oxygen starts to evolve at just 1.47 V vs RHE, which is much lower than potentials recorded for either the mesoporous Ni90Mn10 or Fe90Mn10 metal/metal-oxide materials. A similar trend of lower overpotential in mixed metal systems has been reported previously for nanoparticles and thin films of NiFeOx-based oxygen evolving catalysts.8,9,10,11
The current in this water oxidation reaction depends on the pH, and so for completeness, both cyclic and linear sweep voltammograms were performed on our mesoporous NiFeMn-based catalyst in 0.1 M and 1 M KOH (see Figs. S7 and S8). The freestanding porous films are mechanically somewhat fragile, so data was collected in the absence of mechanical stirring, which lowers the current because of gas bubble adhesion to the catalyst. Despite this fact, at a sweep rate of 1 mV/s, the free-standing mesoporous NiFeMn-based catalyst delivers a current density of 500 mA/cm2 at ~520 mV overpotential in 1 M KOH. We also examined a range of compositions, but found very weak dependence of the catalytic activity on the precise catalyst composition for material with approximately 2:1 Ni:Fe (see Fig. S9).
3.4.2. Effect of the high specific surface area
While the basic electrochemistry of these materials is similar to other nanoscale NiFeOx materials, it is the nanoscale architecture that sets the performance of this system apart. As mentioned above, the three-dimensional nickel foam scaffolds commonly exploited as supports for oxygen-evolving catalysts exhibit very low interfacial surface areas due to their large pore sizes. In contrast, the materials described here have much higher surface areas, and this produces significant enhancement of the catalytic activity of our NiFe-based oxygen evolution catalyst. To illustrate this, the activity of a ~300 μm-thick free-standing mesoporous Ni60Fe30Mn10 metal/metal-oxide catalyst was compared to that of a ~30 μm-thick free-standing dense Ni60Fe30Mn10 metal/metal-oxide foil counterpart. The dense foil was obtained simply by cold-rolling the mesoporous catalyst (sandwiched between pieces of stainless steel),17,22 to collapse the pores and produce a dense sample with the exact same composition as the porous material. Fig. 7 shows two linear sweep voltammograms recorded on the mesoporous (red) and the dense (black) catalysts at a sweep rate of 1 mV/s in 0.5 M KOH. The effective interface surface area of the mesoporous catalyst was estimated from its mass and the measured BET specific surface area of 43 m2/g to be ~3×104 cm2 per geometrical unit of film area (i.e. per cm2). Fig. 7 illustrates that the catalytic activity of the mesoporous sample is significantly enhanced – in 0.5 M KOH, only 200 mV overpotential is required to achieve a current density of 10 mA/cm2 at a sweep rate of 1 mV/s. For comparison, a 430 mV overpotential is needed for the dense catalyst counterpart to achieve the same current density (see inset Fig. 7). Note that since both catalysts were free-standing, the electrolyte solution was not stirred in order to prevent the unsupported catalysts from breaking.
Fig.7.

Catalytic activities in 0.5 M KOH. Linear sweep voltammograms obtained from our mesoporous Ni60Fe30Mn10 metal/metal-oxide catalyst (red) and a dense Ni60Fe30Mn10 catalyst counterpart (black) at a sweep rate of 1 mV/s in 0.5 M KOH. The mesoporous catalyst achieves 10 mA/cm2 at only 200 mV (inset), whereas the dense catalyst counterpart does not achieve 10 mA/cm2 until 430 mV (sweep rate of 1 mV/s; 0.5M KOH).
The intrinsic kinetic limitations of these catalysts can be further examined by calculating the Tafel slope. At relatively low overpotentials, the two catalysts exhibit the same Tafel slope of ~62 mV/decade, as shown in Fig. 8a. The fact that the Tafel slopes are identical is expected, given that the two catalysts are derived from the same material system.28 Our Tafel slope is somewhat higher than those reported in the literature for optimized NiFe-based oxygen-evolving catalysts, which are usually around 40 mV/decade or lower.9,11 The small increase in our Tafel slope can potentially be explained by the residual Mn present at the surface of our mesoporous NiFeMn-based catalyst. Although Ni(OH)2 can be doped with both Mn and Fe,11,33 the catalytic activity of Fe-doped Ni(OH)2 towards water oxidation is superior to that of Mn-doped Ni(OH)2.33 It is emphasized that the materials presented here were not optimized solely for catalytic activity, however, as is the case for many nanoparticle and thin film systems reported in the literature.9,11 Instead, our system is optimized for the best combination of robustness, ideal porosity, electrical conductivity, and catalytic activity.
Fig.8.

Tafel plots and catalyst stability in 1 M KOH. (a) Tafel plot for dense and porous catalysts. Here the solid lines are the experimental data and the dashed lines are the linear fits, offset from the data for clarity. Both the mesoporous and dense catalysts exhibit the same Tafel slope of ~62 mV/decade, but the exchange current of the mesoporous catalyst is 3 orders of magnitude higher than that of the dense catalyst. (b) In 1 M KOH, the mesoporous catalyst achieves a current density of 500 mA/cm2 at 360 mV overpotential with a stability window of over 11 days.
The exchange currents of our mesoporous and dense catalyst were also determined from the Tafel plots (see Fig. 8a). There is roughly 3 orders of magnitude difference in the exchange current of the mesoporous catalyst (Jo~10-2 A/ cm2) compared to that of the dense catalyst (Jo~10-5 A/cm2). This difference arises from the 4 orders of magnitude difference in the effective surface area of the mesoporous catalyst (~3×104 cm2 per cm2) and that of the dense catalyst (2 cm2 cement of the catalytic current comes mainly comes from the large interface surface area of the mesoporous material.28 The difference between Jo values (103 x) compared to the surface area values (104 x) can likely be explained either by internal surface area in the porous system that is accessible to nitrogen gas (during BET), but not to water because of the small pore size, or to some residual porosity in the rolled sample, which was assumed to be fully dense.
We note however, that the large internal surface area alone could not result in the observed catalytic performance if the ~300 μm-thick mesoporous NiFe-based electrode material was electrically insulating. The high performance of our ~300 μm-thick robust mesoporous NiFeMn-based electrode material is justified by the combination of that high surface are, the Fe- and Mn-doped NiOOH catalytic sites, and the high bulk electrical conductivity of the mesoporous materials system, which facilitates the collection of the 4 electrons involved in the oxygen evolution reaction. In addition to that electronic charge transfer, the transfer of chemical species (H2O, OH- and O2) at the catalyst/electrolyte interface is facilitated by the open pore architecture of the catalyst.
3.4.3. Faradaic efficiency
The Faradaic efficiency of our catalysts was estimated using the water displacement method to determine the amount of gas produced.18,19 Full details on the experimental set-up and the subsequent calculations can be found in the ESI in Text S2 and Fig. S1†. Briefly, evolved gas was equilibrated across two bubblers, and was collected in a water manometer. The total volume of oxygen evolved was then calculated using the total volume change in the manometer and the assumption of 2:1 hydrogen:oxygen evolution, corrected for the increase in oxygen solubility as a consequence of the increase in the gas pressure of the system during gas evolution. The Faradaic Efficiency (FE) for oxygen evolution was then deduced as the ratio between the anodic out-put electric charge (3.01 C) associated with the measure oxygen gas, divided by the anodic input charge (3.10 C) applied to oxidize the water. This gives a FE of ~97%. A similar FE value was previously measured on NiFe-based oxygen evolution catalyst using a different experimental method.9
3.4.4. Catalyst stability under an extreme high current density
As a final experiment, the stability of our mesoporous catalyst during oxygen evolution was investigated. Besides the relatively large overpotentials required by many oxygen-evolving catalysts, another key drawback of many systems is their rapid failure due to corrosion during oxygen evolution.37,38,39 The durability of our catalyst was evaluated during galvanostatic tests in 1 M KOH. A stability test is most interesting if the applied current density is comparable to those used for real applications, such as in commercial alkaline electrolyzers, where high electrical current densities are passed through water-based solutions to decompose them into hydrogen and oxygen as the only products.3,40,41 Therefore, we use a current density of 500 mA/cm2 to investigate the stability of our new mesoporous catalyst. To prevent the bulk mesoporous catalyst from cracking due to mechanical stresses associated with the large amount of oxygen gas released at this high current density, the catalyst was sandwiched between two pieces of open cell nickel foam foil (See Fig. S10 ESI†). This configuration also allows us to mechanically stir the electrolyte during the process using a magnetic stirring bar. Under these conditions, our mesoporous catalyst exhibited an activity of 500 mA/cm2 at 360 mV overpotential for over elven days (see Fig. 8b). The purpose of the nickel foam was only to add mechanical stability to our mesoporous catalyst, and so it is important to insure that the nickel foam does not contribute to the catalytic activity. As a result, we also tested the activity of the nickel foam alone (i.e. without a mesoporous Ni60Fe30Mn10-based catalyst thick film) at a current density of 500 mA/cm2 (See Fig. S11 in ESI†). Water oxidation on the nickel foam started at 1.79 V vs RHE (560 mV overpotential). Within an hour, the water oxidation potential further increases from 1.79 V vs RHE to the set upper voltage limit of 2V vs RHE, corresponding to an overpotential of 770 mV (See Fig S11 in ESI†). This increase, which was presumably due to oxidation of the nickel foam, indicates that under our experimental conditions (i.e. at a current density of 500 mA/cm2), the nickel foam itself is not stable for water oxidation.
In contrast to the pure nickel foam, the mesoporous Ni60Fe30Mn10 metal/metal-oxide catalyst- nickel foam sandwich exhibits very different time-voltage profiles. Typically, when the mesoporous catalyst is sandwiched between the nickel foam, water oxidation does not start immediately. Rather, the potential rapidly increases within the first 15 minutes from the open circuit voltage (0.0 V vs RHE) up to 1.59 V Vs RHE, corresponding to 360 mV overpotential (see Inset Fig. 8b). This initial stage can be attributed to equilibration of the cell. At that overpotential of 360 mV, oxygen starts to evolve. The voltage and the oxygen evolution then remain constant for 11 days as displayed in Fig. 8b. At that time, the catalyst showed no signs of degradation, but the experiment was intentionally stopped.
This stable performance with no sign of degradation is in stark contrast to many other reports in the literature. Typical NiFe based water oxidation catalysts operating in 1 M KOH have been observed to show lifetimes between 1 and 4 days at current densities of just 20 mA/cm2.42,43 While extended cycling on the months timescale has not yet been attempted to our knowledge, the results presented here clearly demonstrate the superior stability of this new catalyst material.
We speculate that the small amount of residual Mn may improve the overall corrosion resistance of our mesoporous NiFeMn-based catalyst in alkaline solution. Our hypothesis is supported by the high tendency of Mn to passivate in alkaline solutions. More generally, the oxophilicity trends of our 3d transition metals are as follows: Ni<Fe<Mn, and the oxophilicity of 3d transition metal oxyhydroxides have been reported to follow the same trends as that of the corresponds metallic element counterparts.44 Thus, passivation of both residual Mn and Mn oxides in alkaline solutions may prevent our mesoporous NiFeMn-based catalyst from further corrosion during water oxidation. As a result, while the residual Mn may be slightly detrimental in terms of catalytic efficiency, it could play a much more important and positive role in terms of catalyst stability in alkaline solutions.
4. Conclusions
In this work, we have used selective alloy corrosion to synthesize a robust and ultrafine mesoporous NiFeMn-based metal/metal oxide oxygen-evolving catalyst with ligament and pore sizes in the range of 10 nm and a BET surface area of 43 m2/g. Our mesoporous catalyst is unique in the sense that it exhibits high stability (>264 hours) at a high current density (500 mA/cm2) with a low overpotential (360 mV) using a moderate electrolyte concentration (1 M KOH). In addition, our catalyst is made from non-precious metal and its processing route is straight forward and directly applicable to large-scale synthesis. To the best of our knowledge, this is the first report on an oxygen-evolving catalyst that combines all these properties.
Currently the cheapest way to produce hydrogen gas for large-scale usage is by steam reforming of fossil fuel; about 94% of the global hydrogen stock is produced in that way. Even though hydrogen is a zero-emission energy carrier, its production from non-renewable resources still represents a significant threat to the environment. The high overpotential for the overall water splitting process makes the production of hydrogen from renewable resources more expensive, but it is our goal that findings like those presented here can boost the sustainable production of hydrogen. More specifically, our robust catalyst could be very attractive for alkaline electrolyzers, potentially as part of high-performance solar water splitting systems, where they could be coupled to a hydrogen evolution photocathode and photovoltaics cells to generate overall water splitting at low overpotential using sunlight.
Supplementary Material
Broader context.
Successful electrolysis of water for large-scale production of hydrogen fuel from renewable energy sources will require electrocatalysts that are highly active, cost-effective and durable. While some catalysts in nanoscale form satisfy these requirements, scaling up the synthesis of these nanostructured catalytic systems remains a challenge. More options for robust catalysts that work at varying pHs for large-scale storage of renewable energy are still needed. Nanoporous metals made by selective alloy corrosion represent a unique class of structural nanomaterials that combine both the mechanical robustness and electrical conductivity of dense metals and the exciting catalytic properties of nanoscale materials. This emerging class of nanomaterials may contribute to meeting our society's energy challenge.
Acknowledgements
The authors thank the Netherlands Organization for Scientific Research (NWO-The Hague, Rubicon Grant Dossiernr: 680–50-1214) for financial support of this work. Additional support was provided by the US Department of Energy through both the Center for Molecularly Engineered Energy Materials (MEEM), an Energy Frontier Research Center funded by the U.S. Department of Energy, Office of Science, Basic Energy Sciences under Award Number DE-SC0001342 and through individual grant DE-SC0014213 (S.H.T.). The authors also acknowledge the use of instruments at the Electron Imaging Center for NanoMachines supported by NIH grant 1S10RR23057 and located in the California NanoSystems Institute at UCLA.
Notes and references
- 1.Esswein AJ, Surendranath Y, Reece SY and Nocera DG, Energy Environ. Sci, 2011, 4, 499. [Google Scholar]
- 2.Luo J, Im J, Mayer MT, Schreier M, Nazeeruddin MK, Park N, Tilley SD, Fan HJ and Grätzel M, Science (80-.)., 2014, 345, 1593–1596. [DOI] [PubMed] [Google Scholar]
- 3.Lu X and Zhao C, Nat. Commun, 2015, 6, 1–7. [DOI] [PMC free article] [PubMed] [Google Scholar]
- 4.Zhou W, Wu X-J, Cao X, Huang X, Tan C, Tian J, Liu H, Wang J and Zhang H, Energy Environ. Sci, 2013, 6, 2921. [Google Scholar]
- 5.Wang J, Zhong H, Qin Y and Zhang X, Angew. Chemie, 2013, 125, 5356–5361. [Google Scholar]
- 6.Kanan MW and Nocera DG, Science (80-. )., 2008, 321, 1072–1075. [DOI] [PubMed] [Google Scholar]
- 7.McCrory CCL, Jung S, Peters JC and Jaramillo TF, J. Am. Chem. Soc, 2013. [DOI] [PubMed] [Google Scholar]
- 8.Gong M and Dai H, Nano Res, 2014, 8, 23–39. [Google Scholar]
- 9.Qiu Y, Xin L and Li W, Langmuir, 2014, 30, 7893–7901. [DOI] [PubMed] [Google Scholar]
- 10.Yu X, Zhang M, Yuan W and Shi G, J. Mater. Chem, 2015, 3, 6921–6928. [Google Scholar]
- 11.Louie MW and Bell AT, J. Am. Chem. Soc, 2013, 135, 12329–12337. [DOI] [PubMed] [Google Scholar]
- 12.Tang Z, Tang C and Gong H, Adv. Funct. Mater, 2012, 22, 1272–1278. [Google Scholar]
- 13.Zhu S, Yang X, Yang W, Zhang L, Wang J and Huo M, Int. J. Environ. Res. Public Health, 2012, 9, 548–563. [DOI] [PMC free article] [PubMed] [Google Scholar]
- 14.Jarrah NA, Van Ommen JG and Lefferts L, Prepr. Pap.-Am. Chem. Soc., Div. Fuel Chem., 2004, 49, 881–882. [Google Scholar]
- 15.Detsi E, De Jong E, Zinchenko a, Vuković Z, Vuković I, Punzhin S, Loos K, Ten Brinke G, De Raedt H. a., Onck PRand De Hosson JTM, Acta Mater, 2011, 59, 7488–7497. [Google Scholar]
- 16.Tan YH, Davis J. a., Fujikawa K, Ganesh NV, Demchenko AV and Stine KJ, J. Mater. Chem, 2012, 22, 6733. [DOI] [PMC free article] [PubMed] [Google Scholar]
- 17.Detsi E, Vuković Z, Punzhin S, Bronsveld PM, Onck PR and De Hosson JTM, CrystEngComm, 2012, 14, 5402. [Google Scholar]
- 18.Paracchino A, Laporte V, Sivula K, Grätzel M and Thimsen E, Nat. Mater, 2011, 10, 456–461. [DOI] [PubMed] [Google Scholar]
- 19.Chen Z, Lv C, Chen Z, Jin L, Wang J and Huang Z, 2014, 1200–1213.
- 20.Detsi E, Van De Schootbrugge M, Punzhin S, Onck PR and De Hosson JTM, Scr. Mater, 2011, 64, 319–322. [Google Scholar]
- 21.Erlebacher J, Aziz MJ, a Karma N Dimitrov and K. Sieradzki, Nature, 2001, 410, 450–453. [DOI] [PubMed] [Google Scholar]
- 22.Detsi E, Punzhin S, Rao J, Onck PR and De Hosson JTM, ACS Nano, 2012, 6, 3734–3744. [DOI] [PubMed] [Google Scholar]
- 23.Hakamada M and Mabuchi M, Procedia Eng, 2014, 81, 2159–2164. [Google Scholar]
- 24.Qiu HJ, Kang JL, Liu P, Hirata a., Fujita T and Chen MW, J. Power Sources, 2014, 247, 896–905. [Google Scholar]
- 25.Hakamada M and Mabuchi M, J. Alloys Compd, 2009, 485, 583–587. [Google Scholar]
- 26.Wahl P, Traußnig T, Landgraf S, Jin HJ, Weissmüller J and Würschum R, J. Appl. Phys, 2010, 108. [Google Scholar]
- 27.Viswanath RN, Kramer D and Weissmüller J, Electrochim. Acta, 2008, 53, 2757–2767. [Google Scholar]
- 28.Walter MG, Warren EL, McKone JR, Boettcher SW, Mi Q, a Santori E and Lewis NS, Chem. Rev, 2010, 110, 6446–6473. [DOI] [PubMed] [Google Scholar]
- 29.Xu C, Wang R, Zhang Y and Ding Y, Nanoscale, 2010, 2, 906–909. [DOI] [PubMed] [Google Scholar]
- 30.Gao CH, Trans. Nonferrous Met. Soc. China (English Ed., 2006, 16, 1325–1330. [Google Scholar]
- 31.Sanches LS, Marino CEB and Mascaro LH, Int. J. Electrochem. Sci, 2012, 7, 9213–9220. [Google Scholar]
- 32.Sziráki L, Kuzmann E, Lak GB, El-Sharif M, Chisholm CU, Stichleutner S, Havancsák K, Zih-Perényi K, Homonnay Z and Vértes a., Surf. Coatings Technol, 2012, 211, 184–187. [Google Scholar]
- 33.Diaz-morales O, Ledezma-yanez I, Koper MTM and Calle-vallejo F, ACS Catal, 2015, 5, 5380–5387. [Google Scholar]
- 34.Landon J, Demeter E, Nilay I, Keturakis C, Wachs IE, Vasic R, Frenkel AI and Kitchin JR, ACS Catal, 2012, 2, 1793–1801. [Google Scholar]
- 35.Song T, Gao Y, Zhang Z and Zhai Q, CrystEngComm, 2011, 13, 7058. [Google Scholar]
- 36.Abidat I, Bouchenafa-Saib N, Habrioux A, Comminges C, Canaff C, Rousseau J, Napporn TW, Dambournet D, Borkiewicz O and Kokoh KB, J. Mater. Chem. A, 2015, 3, 17433–17444. [Google Scholar]
- 37.Binninger T, Mohamed R, Waltar K, Fabbri E, Levecque P, Kötz R and Schmidt TJ, Sci. Rep, 2015, 5, 12167. [DOI] [PMC free article] [PubMed] [Google Scholar]
- 38.Chang SH, Danilovic N, Chang K-C, Subbaraman R, Paulikas AP, Fong DD, Highland MJ, Baldo PM, Stamenkovic VR, Freeland JW, a Eastman J and Markovic NM, Nat. Commun, 2014, 5, 4191. [DOI] [PubMed] [Google Scholar]
- 39.Diaz-Morales O, Calle-Vallejo F, de Munck C and Koper MTM, Chem. Sci, 2013, 4, 2334. [Google Scholar]
- 40.Symes D, Al-Duri B, Bujalski W and Dhir A, Int. J. Low-Carbon Technol, 2013, 1–8. [Google Scholar]
- 41.Smith RDL, Prevot MS, Fagan RD, Zhang Z, Sedach PA, Siu MKJ, Trudel S and Berlinguette CP, Science, 2013, 340, 60–63. [DOI] [PubMed] [Google Scholar]
- 42.Gong M, Zhou W, Tsai M, Zhou J, Guan M, Lin M, Zhang B, Hu Y, Wang D, Yang J, Pennycook SJ, Hwang B and Dai H, Nat. Commun, 2014, 5, 1–6. [DOI] [PubMed] [Google Scholar]
- 43.Gong M, Li Y, Wang H, Liang Y, Wu JZ, Jigang Z, Wang J, Regier T, Wei F and Dai H, J. Am. Chem. Soc, 2013, 135, 8452–8455. [DOI] [PubMed] [Google Scholar]
- 44.Subbaraman R, Tripkovic D, Chang K, Strmcnik D, Paulikas AP, Hirunsit P, Chan M, Greeley J, Stamenkovic V and Markovic NM, Nat. Mater, 2012, 11, 550–557. [DOI] [PubMed] [Google Scholar]
Associated Data
This section collects any data citations, data availability statements, or supplementary materials included in this article.