Abstract
Background:
This meta-analysis was conducted to assess the value of magnetic resonance spectroscopy imaging (MRSI) in the diagnosis of suspected prostate cancer (PC).
Methods:
We identified all the relevant papers from the EMBASE, PubMed, EBSCO, Web of Science, and Cochrane Library databases and screened the reference lists. The quality assessment of diagnostic accuracy studies-version 2 tool was used to assess the study quality. Publication bias was analyzed using Deeks’ funnel plot asymmetry test. We calculated the pooled sensitivities, specificities, positive likelihood ratios, negative likelihood ratios, diagnostic odds ratio (DOR), and 95% confidence intervals. The results were evaluated by summary receiver-operating characteristic curves (SROCs). Ultimately, a univariable meta-regression and subgroup analysis, Fagan plot, and likelihood matrix were used to analyze this review.
Results:
A total of 19 articles, which were based on patient-level analysis of PC, were included. These studies had a pooled sensitivity, specificity, DOR, and an area under the SROC of 0.86, 0.78, 22, and 0.89, respectively, by patient-level analysis. From the likelihood matrix, the summary negative likelihood ratio and positive likelihood ratio for MRSI diagnosis of PC were concentrated on the right lower quadrant, which neither confirmed nor excluded the diagnosis of cancer.
Conclusion:
MRSI has a relative application value in the diagnosis of cases of suspected PC. While MRSI is still required for diagnosis along with other clinical data and comprehensive analysis.
Keywords: magnetic resonance spectroscopy imaging, meta-analysis, prostate cancer
1. Introduction
Prostate cancer (PC) is the second most frequently diagnosed cancer in men worldwide. It is also the most frequently diagnosed cancer among men in developed countries; >180,000 men are diagnosed with PC every year in the United States.[1] Digital rectal examination and estimation of the prostate-specific antigen (PSA) level in blood samples are the recommended techniques for PC screening at the clinical level. However, we cannot fully rely upon these screening techniques.[2] The accuracy of both methods is unsatisfactory; in particular, the specificity of PSA level estimation is very low. Furthermore, 70% to 80% of patients with PSA levels of >4 ng/ml do not have PC and 60% to 75% of them have to undergo unnecessary biopsies.[3,4] Furthermore, elevated PSA levels with negative transrectal ultrasound-guided biopsies cannot be regarded as noncancerous. Functional magnetic resonance imaging (MRI) techniques, such as magnetic resonance spectroscopy imaging (MRSI), diffusion-weighted MRI, dynamic contrast-enhanced MRI (DCE-MRI), have been demonstrated to be efficient in the diagnosis of PC. Chen et al demonstrated that although DCE-MRI can provide accurate supplementary diagnostic information for the detection of PC, it remains a confirmatory tool.[5]
MRSI is a noninvasive method based on spectroscopic analysis of tissue metabolism, which has been used to characterize metabolic changes associated with cancer. This aids clinicians’ understanding of the cellular biochemistry of cancer in different areas of the body. The diagnostic value of MRSI in cancer is typically based on the detection of high levels of choline compounds, as choline is a marker of proliferation and cell membrane turnover.[6,7] The MRSI technique is highly accurate in cases of suspected PC and provides details of tumor volume and metabolite behavior, which can be a decisive factor for further clinical approaches. Some meta-analyses have been conducted to evaluate the accuracy of MRSI in the diagnosis of PC. In 2008, Martin et al concluded that MRI combined with MRSI could be a rule-in test for low-risk patients.[8] However, this finding needs to be confirmed in larger studies, and the cost-effectiveness needs to be established. In 2016, Chen et al noted no difference between the efficiency of PC diagnosis by MRSI at 1.5T with an endorectal coil and MRSI with 3T external phased array coil, but this meta-analysis did not differentiate between the suspected and proven cases of PC. In addition, this meta-analysis was not conducted according to patient-level analysis and site-level analysis, which could cause bias. In recent years, most studies in this field have focused on the diagnostic accuracy of MRSI for suspected PC[9–15] based on the patient-level analysis. However, Ivan et al. concluded that the addition of MRSI does not improve the accuracy of 3T MRI for sextant localization of PC.[16] Therefore, a meta-analysis of the current literature is required to clarify the role of MRSI in the diagnosis of suspected PC.
2. Methods
2.1. Literature search
We performed all the analyses based on previously published studies, thus no ethical approval was required. We conducted and reported this meta-analysis in accordance with the preferred reporting items for systematic reviews and meta-analyses (PRISMA) guidelines for systematic reviews and meta-analyses (PRISMA checklist).[17] Two researchers (ZDY and CJ), who were blinded to the author information of the articles, conducted the study inclusion, data extraction, and assessment of the risk of bias independently. In case of disagreements, a third radiologist (LMY) was consulted.
2.2. Inclusion criteria
The inclusion criteria were as follows:
-
(1)
the study content related to the application of MRSI in the diagnosis of PC;
-
(2)
clinical suspicion of PC: elevated PSA levels of >4 ng/ml, and/or palpable nodules in the rectal examination, and/or abnormal findings on ultrasound;
-
(3)
all cases had a definite diagnosis with pathological results;
-
(4)
articles with stated or easily derived true-positive (TP), true negative (TN), false-positive (FP), and false-negative (FN) rates; and
-
(5)
regardless of the Gleason Score of PC according to the histopathology.
The following exclusion criteria were also applied:
-
(1)
all review articles, letters, comments, case reports, and nonclinical trials;
-
(2)
studies with <10 patients in the sample;
-
(3)
studies focused on biopsy-proven or site-level PC; and
-
(4)
studies featuring patients with previous recurrences and those who have received radiation therapy for PC.
2.3. Search strategy
The PubMed, Cochrane Library, EMBASE, Web of Science, and EBSCO databases were searched to identify diagnostic studies evaluating the accuracy of MRSI in the diagnosis of PC. The studies included were published from database inception to January 31, 2018. The reference lists of the included studies were checked and the writers were contacted when required. Our search was based on “prostate cancer,” with “MRI” and “MRSI.” The search records (titles and abstracts) were first scanned by 2 authors (ZDY and CJ). The full texts of the articles meeting the inclusion criteria were analyzed.
2.4. Data extraction
After the evaluation was completed, 2 authors extracted the following information from the selected literature:
-
(1)
literature data – the first author, publication date, study population, number of patients, field strength, study design, data collection, whether or not blinding was applied;
-
(2)
basic research information – age, Gleason Score, and PSA level; and
-
(3)
the TP, TN, FP, FN rate.
The authors independently graded the quality of the eligible studies using quality assessment of diagnostic accuracy studies-version 2 (QUADAS-2),[18] which was evaluated by Review Manager 5.3 (Nordic Cochrane Centre, Copenhagen, Denmark).
2.5. Quality assessment
The QUADAS-2 tool was used to rate the study quality, which comprises 4 sections: “patient selection,” “index test,” “reference standard,” and “flow and timing.” The processing of the quality assessment was conducted using Review Manager 5.3 software. Publication bias was assessed using Deeks’ funnel plot asymmetry test. A P-value of <.05 was considered statistically significant.
2.6. Statistical analysis
This meta-analysis was conducted using data analysis and statistical software (STATA) (version 14.0; Stata Corp, College Station, TX). Pooled estimates for sensitivity, specificity, FN, FP, TP, and TN with the corresponding 95% confidence intervals (CIs) were used to determine the accuracy of MRSI for diagnosing suspected PC. From these data, we generated a forest plot and a summary receiver-operating characteristic curve (SROC) from each study. The area under the curve (AUC) was used to describe the overall accuracy as a potential summary of the SROC. Heterogeneity among the 19 studies was assessed by calculation of the inconsistency index (I2) and evaluation of Cochran χ2 test (Q test). An I2 of ≥50% and P-value of <.10 on the Q test indicated substantial between-study heterogeneity. A meta-regression analysis was used to explore the source of the heterogeneity. Fagan plot analysis was also rendered to assess the relationship among the estimated pretest probability of the disease, likelihood ratio of the diagnostic test, and post-test probability of the disease. We assumed pretest probabilities of 43%, and the corresponding positive and negative post-test probabilities were estimated. More importantly, we generated a likelihood matrix which is presented as a scatter plot of the positive and negative likelihood ratios (NLR) with combined summary points. These plots were divided into quadrants based on the strength-of-evidence thresholds to ascertain interpretation of the measured test.
3. Results
3.1. Study characteristics
A total of 1020 articles were identified in our literature search. We excluded 930 of these articles for irrelevance based on information in the abstracts. The full texts of the remaining 120 articles were obtained for further evaluation. Considering all inclusion criteria in the study selection process (Fig. 1), 19 articles were selected for the meta-analysis. The general characteristics of each of the studies are presented in Table 1. The data related to MRSI diagnosis of PC are displayed in Table 2. The pooled sensitivity, specificity, and AUC are provided in Figures 2 and 3.
Figure 1.
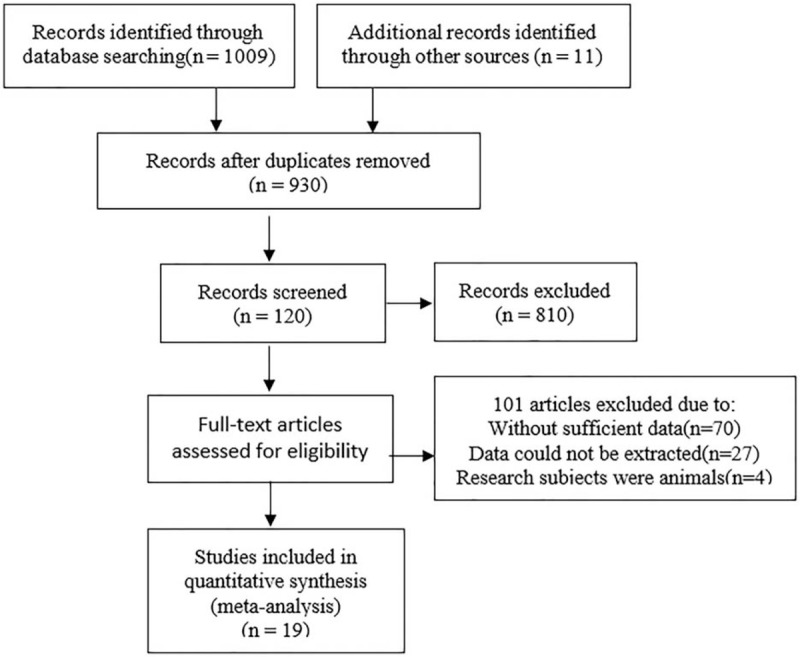
Flowchart for the identification of eligible studies.
Table 1.
Basic information of included articles.

Table 2.
Data of magnetic resonance spectroscopic imaging diagnosis of prostate cancer.
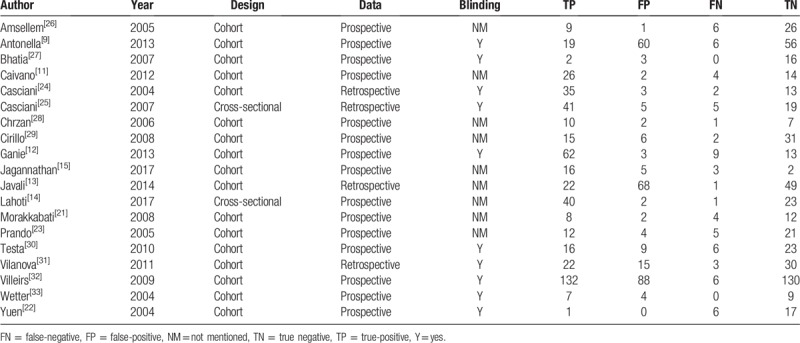
Figure 2.
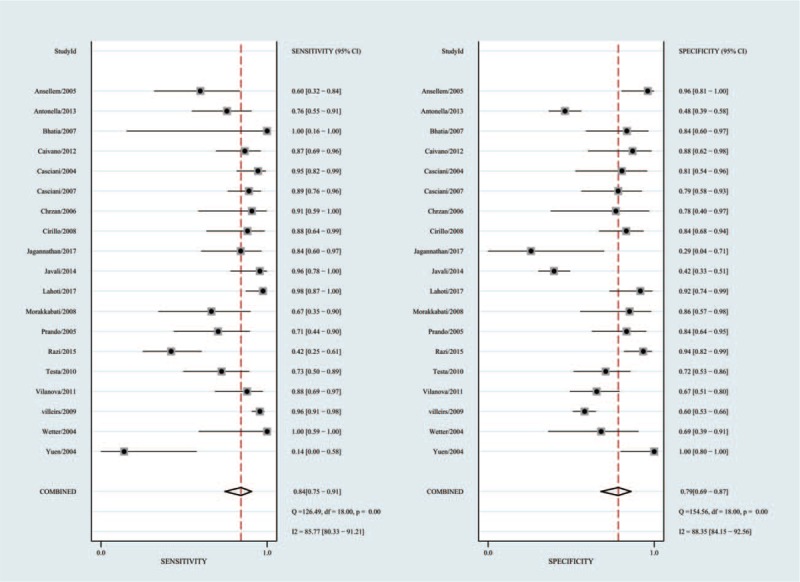
Forest plots of MRSI for the diagnosis of prostate cancer. MRSI = magnetic resonance spectroscopy.
Figure 3.
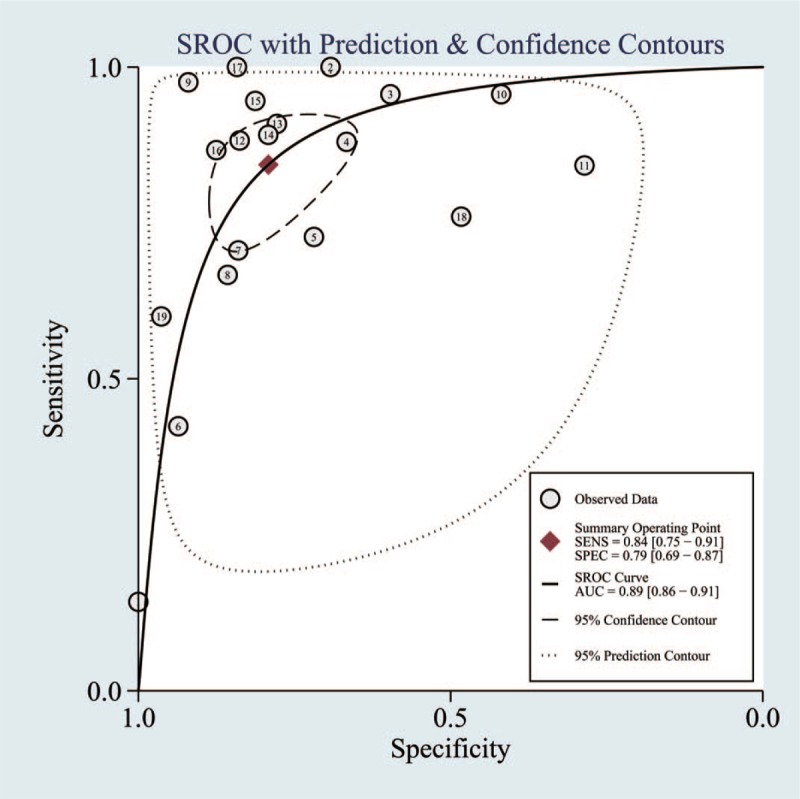
Summary receiver operating characteristic curve of patient analysis. Area under the curve represents accuracy of diagnosis.
3.2. Quality assessment in included studies
Figure 4 illustrates the methodological analysis of the included studies based on QUADAS-2 assessment, where the results indicate bias risk and applicability. All studies used an acceptable reference standard independent of the index test. All studies’ interpretation of the reference standard was concealed from the results of the physical examinations.
Figure 4.

The methodological analysis of the included studies based on QUADAS-2 assessment. QUADAS-2 = quality assessment of diagnostic accuracy studies-version 2.
3.3. Heterogeneity test
We analyzed 19 papers wherein the I2 for sensitivity and specificity was 58.3 and 56.5, respectively. A P-value of <.05 indicated that significant heterogeneity exists among these 19 studies (Fig. 2). As can be noted in Figure 5, the bivariate boxplot revealed that 6 articles were out with the circles, indicating that there was heterogeneity among the included articles. In addition, the mixed-model correlation was −0.58 and the proportion of heterogeneity potentially due to threshold effects was 0.46, suggesting that causes of variations other than threshold effects were present.
Figure 5.
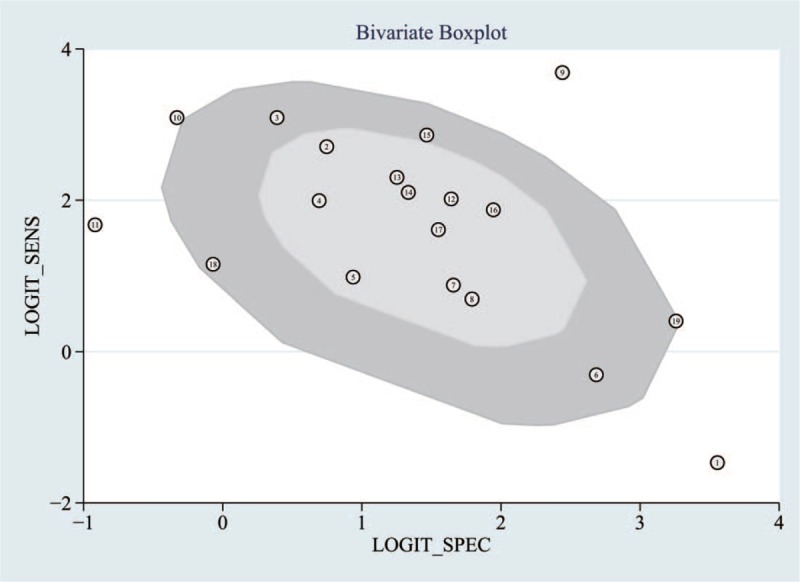
The bivariate boxplot about the heterogeneity was drawn. It demonstrated that 6 sets of data were out of the circles, which indicated there was heterogeneity between articles we included.
3.4. Publication bias
Random error and bias affect the diagnostic value of a test. The narrower the 95% CI, the more accurate the test is. Publication bias can be reflected by a funnel plot. The funnel plot of the included trials in Figure 6 was almost symmetrical, suggesting low publication bias (P = .56).
Figure 6.
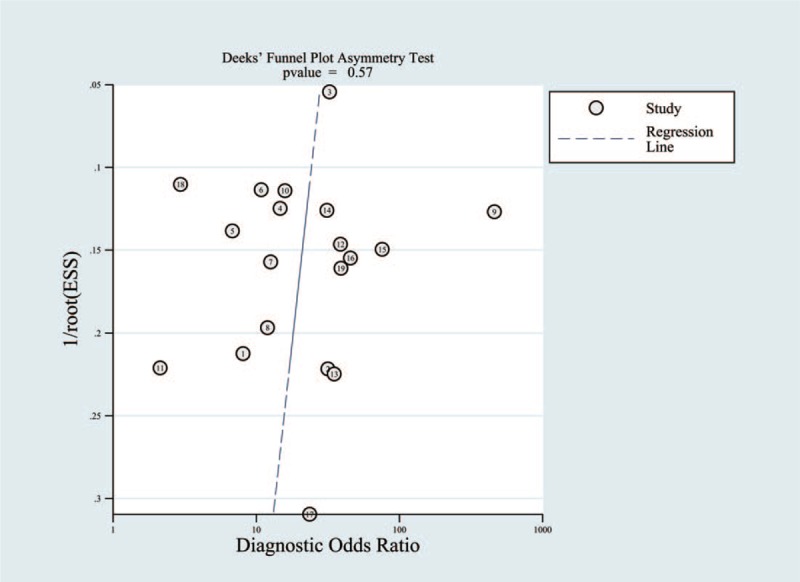
Deeks funnel plot asymmetry test to evaluate publication bias (P = .56).
3.5. Subgroup analysis
Our results indicated that heterogeneity from non-threshold effects was present in the sensitivity and specificity among the 19 included studies. To investigate the source of this heterogeneity, we use a meta-regression analysis to evaluate various covariates from these studies, including the “different mean PSA,” “different mean age,” “whether blinding was applied,” and “whether the study was conducted in a developed country.”
We first compared the performance of MRSI for the diagnosis of PC among different mean PSA levels. Four papers found mean PSA levels of >4 ng/ml, and 2 paper did not specify. Therefore, we excluded these 6 papers from the subgroup analysis. In studies reporting a mean PSA level of ≥10 ng/ml (n = 7), the pooled sensitivity was 78% (95% CI, 54–91%) and the pooled specificity was 85% (95% CI, 69–93%). In studies reporting a mean PSA level of <10 ng/ml (n = 6), the pooled sensitivity was 86% (95% CI, 78–92%) and the pooled specificity was 64% (95% CI, 49–77%). Second, 2 papers did not mention the mean age, and were excluded from the subgroup analysis. We compared the performance of MRSI in the diagnosis of PC between different mean ages. Two papers did not report the mean age. In studies reporting a mean age of ≥65 years (n = 6), the pooled sensitivity was 84% (95% CI, 77–89%) and the pooled specificity was 73% (95% CI, 55–85%). In studies reporting a mean age of <65 years (n = 11), the pooled sensitivity was 86% (95% CI, 71–94%) and the pooled specificity was 80% (95% CI, 65–89%). In studies conducted in developed countries (n = 11), the pooled sensitivity was 83% (95% CI, 69–91%) and the pooled specificity was 79% (95% CI, 65–89%). In studies conducted in developing countries (n = 8), the pooled sensitivity was 90% (95% CI, 82–94%) and the pooled specificity was 76% (95% CI, 59–87%). Finally, according to whether or not blinding was applied, we conduct the subgroup analysis. In studies conducted with blinding (n = 10), the pooled sensitivity was 86% (95% CI, 73–93%) and the pooled specificity was 74% (95% CI, 62–84%). In studies conducted with no blinding (n = 9), the pooled sensitivity was 86% (95% CI, 76–92%) and the pooled specificity was 81% (95% CI, 65–91%).
The detailed data for the meta-regression analysis are presented in Figure 7. From the sensitivity results, the covariates of “type of data collection” and “whether the study was conducted in a developed country” were statistically significant (P < .05). Thus, the results of this meta-regression analysis suggest that these covariates might be the potential sources of heterogeneity with regard to sensitivity.
Figure 7.
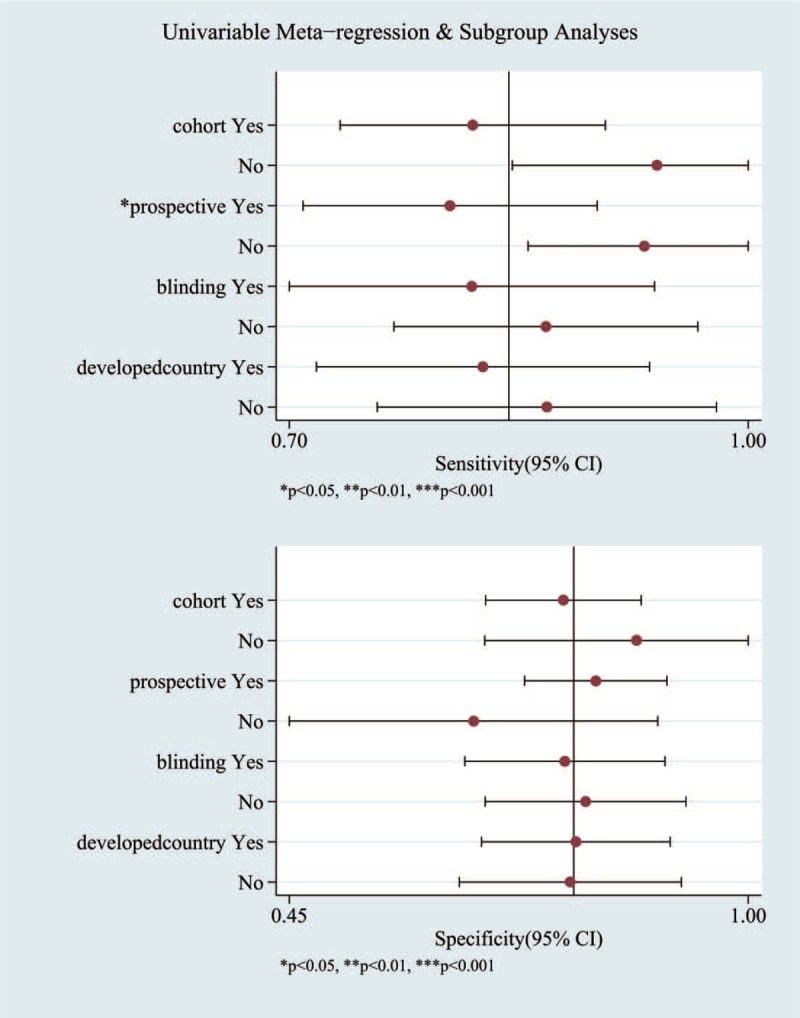
The detailed data for the univariable meta-regression analysis and subgroup analysis.
3.6. Fagan plot analysis
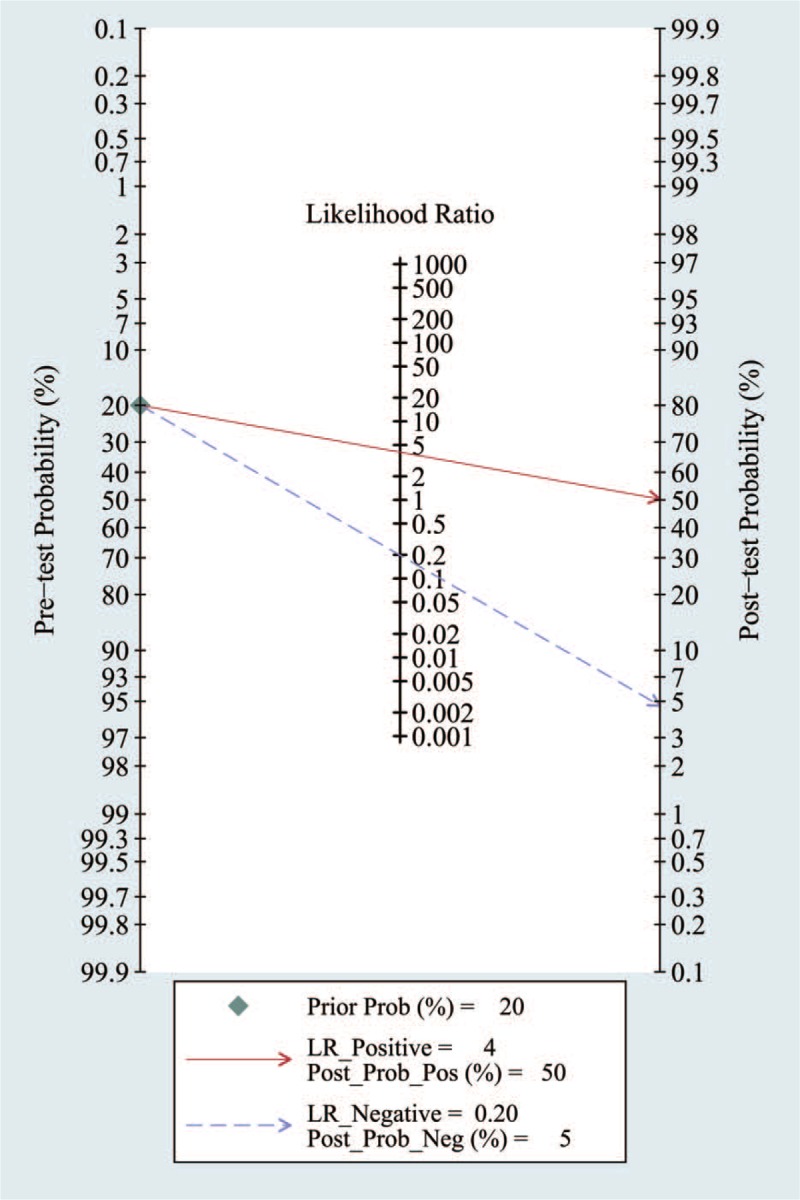
Likelihood ratios and post-test probabilities are also relevant for clinicians. They provide information on the likelihood that a patient with a positive or negative test actually has PC. In our study, both the likelihood ratio and post-test probability were moderate (Fig. 8). Given a pretest probability of 43%, the positive post-test probability is 75%, and the negative post-test probability is 12%. A PLR of 4 implies that a person with a disease is 4-times more likely to have a positive test result than is a healthy person.
Figure 8.
Forest plots of MRSI by patient analysis for the diagnosis of prostate cancer. MRSI = magnetic resonance spectroscopy.
3.7. Likelihood matrix
The summary PLR and NLR for MRSI diagnosis of PC with 95% CIs is concentrated in the right lower quadrant as demonstrated in Figure 9. This indicates that the PLR was <10 and the NLR was >0.1.
Figure 9.
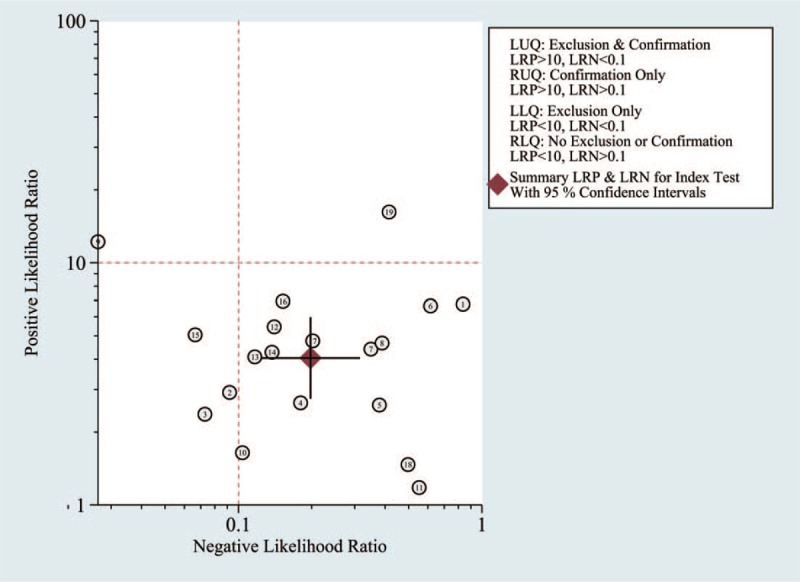
Likelihood matrix indicates that summary PLR and NLR for MRSI diagnosis of PC with 95% confidence intervals is concentrated on RLQ. MRSI = magnetic resonance spectroscopy, NLR = negative likelihood ratios, PC = prostate cancer, PLR = positive likelihood ratios, RLQ = right lower quadrant.
4. Discussion
Here, we assessed the performance of MRSI in the diagnosis of suspected PC. A thorough systematic literature search and verifying process resulted in 19 studies that satisfied all of the inclusion criteria. Several studies have reported that MRSI has good sensitivity and specificity.[19,20] The outcomes of our meta-analysis indicate that MRSI has high diagnostic power for the detection of PC (86% sensitivity and 78% specificity). Based on these values, we can calculate the diagnostic odds ratio (DOR), which is a single indicator of test accuracy. The DOR is the ratio of the PLR relative to the NLR; thus, the higher the DOR, the greater the accuracy of the diagnosis of PC. In our meta-analysis, the mean DOR was 22 (12, 38), which demonstrates a high level of overall accuracy. Finally, the AUC was 0.89, indicating a high level of overall diagnostic accuracy.
We found that heterogeneity from non-threshold effects was present in the sensitivity and specificity among the studies (I2 > 50%). The subgroup analysis and meta-regression analysis revealed that the covariates “type of data collection” and “whether the study was conducted in a developed country” might be the potential sources of heterogeneity with regard to sensitivity.
There are several possible explanations for this heterogeneity. First, only 2 studies used 3.0T MRI as a diagnostic tool.[11,21] Other studies used 1.5T MRI as a diagnostic tool. Second, the included patients had significantly different PSA levels. For instance, 1 study[22] reported a mean PSA level of 20.4 ng/ml, but 3 other studies[9,13,23] reported a mean PSA level of 6.8 ng/ml. The higher the PSA level, the greater the possibility of PC. Third, 3 studies[10,24,25] were of a retrospective design. A retrospective study decreases the quality of research articles. Lastly, 2 studies[14,25] were cross-sectional in design and the remaining studies were cohort studies.
Several other meta-analyses have summarized the data regarding MRSI and PC. For example, the analysis by Wang et al[20] found that MRSI has a sensitivity of 64% (95% CI, 55–72%), a specificity of 86% (95% CI, 76–91%), a PLR of 7.24 (95% CI, 6.04–8.69), and an NLR of 0.37 (95% CI, 0.33–0.42). Our findings are better than these results. In addition, our analysis adds additional objective data to support the application of MRSI for the diagnosis of PC. The overall result of this meta-analysis suggests that MRSI has significant power in the diagnosis of PC.
However, it is also important to determine how the diagnostic test utility varies with the perceived risk. For this reason, a Fagan plot analysis was performed and determined that with pretest probabilities of 43%, the positive post-test probability and the negative post-test probability are 75% and 12%, respectively. This analysis provides further support for the good value of MRSI for diagnosing PC.
In this study, a likelihood ratio plot was drawn to visually demonstrate that MRSI is effective in improving the accuracy of PC diagnosis. However, the efficacy of MRSI alone in the diagnosis and exclusion of PC is limited. MRSI alone cannot confirm or exclude malignancy; it is necessary to combine other clinical data and tests with the comprehensive analysis.
Our study was based on thorough literature searches and careful data extraction, and included assessments of the methodological quality of diagnostic test accuracy studies. We objectively analyzed the utility of MRSI in the diagnosis of suspected PC by calculating the pooled sensitivity and specificity and applying a likelihood matrix and Fagan plot. In addition, we performed stratified analyses to examine the variability of results among subgroups of patients.
It should be acknowledged that our study has several limitations. There is a lack of a formal validity testing procedures and a lack of quality assessment criteria for studies; however, to address this, we combined the relevant published guidelines with currently used tools. We did not analyze the intrinsic heterogeneity present within each study or the impact this had on the pooled diagnostic performance of MRSI. In addition, most of our included studies were single-center studies and our results are generated from different groups within the same analysis. Therefore, large-scale studies will be required to validate the clinical use of MRSI as a diagnostic tool for PC.
5. Conclusions
MRSI is a valuable imaging technique in the diagnosis of PC. It can provide powerful information for the early diagnosis of PC. While MRSI is still required for the diagnosis of PC along with other clinical data and a comprehensive analysis.
Author contributions
Conceptualization: Weiguo Cai, Meiyan Liao.
Data curation: Dongyong Zhu, Jie Chen.
Formal analysis: Jie Chen.
Methodology: Weiguo Cai, Dongyong Zhu.
Project administration: Weiguo Cai.
Resources: Hanfei Zhang.
Software: Yanfang Wang.
Validation: Meiyan Liao.
Writing – original draft: Weiguo Cai.
Writing – review and editing: Sama Byanju, Meiyan Liao.
Footnotes
Abbreviations: AUC = area under the curve, CI = confidence interval, DOR = diagnostic odds ratio, FN = false-negative, FP = false-positive, I2 = inconsistency index, MRI = magnetic resonance imaging, MRSI = magnetic resonance spectroscopy imaging, NLR = negative likelihood ratio, PC = prostate cancer, PLR = positive likelihood ratio, PRISMA = preferred reporting items for systematic reviews and meta-analyses, PSA = prostate-specific antigen, Q test = Cochran χ2 test, QUADAS-2 = quality assessment of diagnostic accuracy studies-version 2, SROC = summary receiver-operating characteristic curves, STATA = statistical analysis data analysis and statistical software, TN = true negative, TP = true-positive.
The authors have no conflicts of interest to disclose.
the authors of this work have nothing to disclose.
References
- [1].Siegel RL, Miller KD, Jemal A. Cancer statistics, 2016. CA Cancer J Clin 2016;66:7–30. [DOI] [PubMed] [Google Scholar]
- [2].Choi YJ, Kim JK, Kim N, et al. Functional MR imaging of prostate cancer. Int J Med Radiol 2007;27:63. [DOI] [PubMed] [Google Scholar]
- [3].Arcangeli CG, Ornstein DK, Keetch DW, et al. Prostate-specific antigen as a screening test for prostate cancer. The United States experience. Urol Clin North Am 1997;24:299–306. [DOI] [PubMed] [Google Scholar]
- [4].Thompson IM, Pauler DK, Goodman PJ, et al. Prevalence of prostate cancer among men with a prostate-specific antigen level < or = 4.0 ng per milliliter. N Engl J Med 2004;350:2239–46. [DOI] [PubMed] [Google Scholar]
- [5].Chen Z, Zheng Y, Ji G, et al. Accuracy of dynamic contrast-enhanced magnetic resonance imaging in the diagnosis of prostate cancer: systematic review and meta-analysis. Oncotarget 2017;8:77975–89. [DOI] [PMC free article] [PubMed] [Google Scholar]
- [6].Abdel Razek AA, Poptani H. MR spectroscopy of head and neck cancer. Eur J Radiol 2013;82:982–9. [DOI] [PubMed] [Google Scholar]
- [7].Razek AA, Nada N. Correlation of choline/creatine and apparent diffusion coefficient values with the prognostic parameters of head and neck squamous cell carcinoma. NMR Biomed 2016;29:483–9. [DOI] [PubMed] [Google Scholar]
- [8].Umbehr M, Bachmann LM, Held U, et al. Combined magnetic resonance imaging and magnetic resonance spectroscopy imaging in the diagnosis of prostate cancer: a systematic review and meta-analysis. Eur Urol 2009;55:575–90. [DOI] [PMC free article] [PubMed] [Google Scholar]
- [9].Petrillo A, Fusco R, Setola SV, et al. Multiparametric MRI for prostate cancer detection: performance in patients with prostate-specific antigen values between 2.5 and 10 ng/mL. J Magn Reson Imaging 2014;39:1206–12. [DOI] [PubMed] [Google Scholar]
- [10].Vilanova JC, Barceló-Vidal C, Comet J, et al. Usefulness of prebiopsy multifunctional and morphologic MRI combined with free-to-total prostate-specific antigen ratio in the detection of prostate cancer. Ajr Am J Roentgenol 2011;196:715–22. [DOI] [PubMed] [Google Scholar]
- [11].Caivano R, Cirillo P, Balestra A, et al. Prostate cancer in magnetic resonance imaging: diagnostic utilities of spectroscopic sequences. J Med Imaging Radiat Oncol 2012;56:606–16. [DOI] [PubMed] [Google Scholar]
- [12].Ganie FA, Wani MS, Shaheen F, et al. Endorectal coil MRI and MR-spectroscopic imaging in patients with elevated serum prostate specific antigen with negative trus transrectal ultrasound guided biopsy. Urol Ann 2013;5:172–8. [DOI] [PMC free article] [PubMed] [Google Scholar]
- [13].Javali TD, Dwivedi DK, Kumar R, et al. Magnetic resonance spectroscopy imaging-directed transrectal ultrasound biopsy increases prostate cancer detection in men with prostate-specific antigen between 4-10 ng/mL and normal digital rectal examination. Int J Urol 2014;21:257–62. [DOI] [PubMed] [Google Scholar]
- [14].Lahoti AM, Dhok AP, Rantnaparkhi CR, et al. Role of magnetic resonance imaging, magnetic resonance spectroscopy and transrectal ultrasound in evaluation of prostatic pathologies with focus on prostate cancer. Pol J Radiol 2017;82:827–36. [DOI] [PMC free article] [PubMed] [Google Scholar]
- [15].Jagannathan D, Indiran V. Accuracy of diffusion weighted images and MR spectroscopy in prostate lesions – our experience with endorectal coil on 1.5 T MRI. J Clin Diagn Res 2017;11:Tc10–4. [DOI] [PMC free article] [PubMed] [Google Scholar]
- [16].Platzek I, Borkowetz A, Toma M, et al. Multiparametric prostate magnetic resonance imaging at 3 T: failure of magnetic resonance spectroscopy to provide added value. J Comput Assist Tomogr 2015;39:674–80. [DOI] [PubMed] [Google Scholar]
- [17].Shamseer L, Moher D, Clarke M, et al. Preferred reporting items for systematic review and meta-analysis protocols (PRISMA-P) 2015: elaboration and explanation. Syst Rev 2015;4:1. [DOI] [PMC free article] [PubMed] [Google Scholar]
- [18].Whiting PF, Rutjes AW, Westwood ME, et al. QUADAS-2: a revised tool for the quality assessment of diagnostic accuracy studies. Ann Intern Med 2011;155:529–36. [DOI] [PubMed] [Google Scholar]
- [19].Chen H, Sutedjo J, Wang L, et al. Prostate cancer magnetic resonance spectroscopy imaging at 1.5 and 3.0 T: a meta-analysis. Technol Cancer Res Treat 2016;15:625–31. [DOI] [PubMed] [Google Scholar]
- [20].Wang P, Guo YM, Liu M, et al. A meta-analysis of the accuracy of prostate cancer studies which use magnetic resonance spectroscopy as a diagnostic tool. Korean J Radiol 2008;9:432–8. [DOI] [PMC free article] [PubMed] [Google Scholar]
- [21].Morakkabati-Spitz N, Bastian PJ, Gieseke J, et al. MR imaging of the prostate at 3.0T with external phased array coil - preliminary results. Eur J Med Res 2008;13:287–91. [PubMed] [Google Scholar]
- [22].Yuen JSP, Thng CH, Tan PH, et al. Endorectal magnetic resonance imaging and spectroscopy for the detection of tumor foci in men with prior negative transrectal ultrasound prostate biopsy. J Urol 2004;171:1482–6. [DOI] [PubMed] [Google Scholar]
- [23].Prando A, Kurhanewicz J, Borges AP, et al. Prostatic biopsy directed with endorectal MR spectroscopic imaging findings in patients with elevated prostate specific antigen levels and prior negative biopsy findings: early experience. Radiology 2005;236:903. [DOI] [PubMed] [Google Scholar]
- [24].Casciani E, Polettini E, Bertini L, et al. Prostate cancer: evaluation with endorectal MR imaging and three-dimensional proton MR spectroscopic imaging. Radiol Med 2004;108:530–41. [PubMed] [Google Scholar]
- [25].Casciani E, Polettini E, Bertini L, et al. Contribution of the MR spectroscopic imaging in the diagnosis of prostate cancer in the peripheral zone. Abdom Imaging 2007;32:796–802. [DOI] [PubMed] [Google Scholar]


