

Abstract
The present study examined the factor structure, invariance properties, reliability, and validity of the Anxiety Sensitivity Index-3 (ASI-3, Taylor et al., 2007). Participants were recruited from a large, ethnically diverse southwestern university (n = 3651; 77.8% female; Mage = 22.06 years; 28% non-Hispanic White). Findings supported a bifactor structure for the ASI-3, which demonstrated measurement invariance across sex, race/ethnicity, age, and sexual minority status. Furthermore, the ASI-3 demonstrated strong reliability and validity, with the anxiety sensitivity general and specific factors (physical, cognitive, and social concerns) evidencing unique patterns of relations with symptoms of depression, suicidality, anxious arousal, and social anxiety. Clinically, these findings generally support the validity of the ASI-3 in measuring anxiety sensitivity across sex, age, race/ethnicity, and sexual minority status. Future work is needed to better understand the role anxiety sensitivity plays within specific demographic subgroups, particularly African–Americans, Asian Americans, and sexual minorities.
Keywords: Anxiety sensitivity, Measurement invariance, Gender, Race/ethnicity, Sexual orientation
1. Introduction
Anxiety sensitivity refers to the fear of internal cues and external consequences of physiological sensations (Reiss and McNally, 1985). Anxiety sensitivity is distinct from anxiety symptoms and from the tendency to experience negative affect (McNally, 2002). To date, a growing body of evidence implicates anxiety sensitivity as a risk factor for a variety of mental health difficulties, including anxiety symptoms and disorders (Naragon-Gainey, 2010; Olatunji and Wolitzky-Taylor, 2009), depression (Naragon-Gainey, 2010; Olatunji and Wolitzky-Taylor, 2009), suicidality (Capron et al., 2012), as well as substance use problems (Dixon et al., 2014), alcohol use problems (Schmidt et al., 2007), and tobacco use (Zvolensky et al., 2007). Although the majority of work on anxiety sensitivity has been conducted among non-Hispanic White samples, additional work suggests it may be a robust explanatory construct among Latino (Zvolensky et al., 2015), African-American (Arnau et al., 2009), Asian (Ebesutani et al., 2016), and American Indian adults (Zvolensky et al., 2001).
Assessment of anxiety sensitivity has undergone several permutations since its development in the mid-1980s. The initial 16-item Anxiety Sensitivity Index was designed to be unifactorial (Reiss et al., 1986), but subsequent analysis demonstrated a variety of multifactorial structures (e.g., Schmidt and Joiner, 2002; Taylor et al., 1992). Later, a 36-item (Anxiety Sensitivity Index-Revised) and a 60-item (Anxiety Sensitivity Profile) were devised to assess multiple dimensions of anxiety sensitivity, specifically measuring cognitive dyscontrol and several forms of somatic concerns (e.g., cardiac, gastrointestinal). However, their respective intended factor structures were also called into question by subsequent research (Deacon et al., 2003; Schmidt et al., 2008; Zvolensky et al., 2003). The lack of consistency in factor structure across the anxiety sensitivity measures led to the development of the Anxiety Sensitivity Index-3 (ASI-3; Taylor et al., 2007). In contrast to the development and validation of the previous ASI scales, the ASI-3 underwent a much more extensive and scientifically rigorous validation process, including testing across four separate samples consisting of clinical and non-clinical subjects (Taylor et al., 2007). Ultimately, the ASI-3 evinced a three-factor solution consisting of somatic/physical concerns, cognitive concerns, and social concerns. The three-factor structure of the ASI-3 was verified in confirmatory factor analysis, the validity of the ASI-3 in relation to anxiety-related disorder was established, and the proportion of variance accounted for by the general factor (36%) and the subfactors (40%) was determined. In addition, multigroup invariance testing was used to verify that the ASI-3 assessed the same construct across men and women (Taylor et al., 2007).
Subsequent tests of the ASI-3 confirmed its validity and supported its three-factor structure (Allan et al., 2015; Ebesutani et al., 2014; Kemper et al., 2012; Osman et al., 2010; Rifkin et al., 2015; Wheaton et al., 2012). Later studies also demonstrated that the ASI-3 total scale score differentiates between individuals with and without anxiety disorders (Kemper et al., 2012; Wheaton et al., 2012), and the ASI-3 subfactors relate uniquely to specific depression and anxiety symptom presentations (Allan et al., 2015; Kemper et al., 2012; Osman et al., 2010; Wheaton et al., 2012). For instance, some work suggests fear-based affective problems (e.g., panic, specific phobias) may more highly correlate with anxiety sensitivity physical concerns and distress-based affective problems (e.g., generalized anxiety disorder, depression, suicidality) more highly correlate with anxiety sensitivity cognitive concerns, while anxiety sensitivity social concerns relate most strongly with social anxiety (Allan et al., 2014; Naragon-Gainey, 2010). Some evidence also suggested the ASI-3 total scale and its subscales may be sensitive to reductions in anxiety over the course of treatment (e.g., Capron and Schmidt, 2016; Rifkin et al., 2015).
Although preliminary work following the Taylor et al. (2007) development of the ASI-3 confirmed the initial three-factor structure (Kemper et al., 2012; Wheaton et al., 2012), an emerging body of evidence now supports a bi-factor structure for the ASI-3 (Allan et al., 2015; Chavarria et al., 2015; Ebesutani et al., 2014; Osman et al., 2010; Rifkin et al., 2015). A bi-factor model separates a general factor (e.g., anxiety sensitivity) that is orthogonal with a set of subfactors (e.g., physical concerns, cognitive concerns, and social concerns) and can determine, based upon the degree to which individual items load onto the general factor and the specific subfactors, whether a scale is better represented as multidimensional or unidimensional (Reise et al., 2010). When tested against the original correlated three-factor model (Allan et al., 2015; Ebesutani et al., 2014; Osman et al., 2010; Rifkin et al., 2015) and other theoretically relevant models (e.g., the hierarchical 2nd order model: Ebesutani et al., 2014), the bifactor model has resulted in the best model fit for the ASI-3.
Despite these advancements in understanding the factor structure of the ASI-3, other substantive questions remain about its psychometric performance across demographic groups.
Further assessment of the measurement invariance, or stability of the measure, is needed. Measurement invariance specifically tests the degree to which items load similarly onto the latent factors across groups, as well as the degree to which item intercepts (for continuous indicators) or thresholds (for categorical indicators) are similar across groups (Vandenberg and Lance, 2000). The lack of measurement invariance may introduce bias into the interpretation of findings and difficulty interpreting whether differences across groups result from merely differences in the measurement performance or actual differences in the construct (Edwards et al., 2017; Putnick and Bornstein, 2016). Aside from Taylor et al. (2007) original confirmation of measurement invariance across sex for the ASI-3, there have only been two other examinations of whether the ASI-3 functions similarly across men and women (Allan et al., 2017; Ebesutani et al., 2014), which also supported its measurement invariance. Moreover, little information is available comparing the factor structure of the ASI-3 across racial/ethnic identities, sexual identities, and age groups. Although much past work with the ASI-3 was conducted among predominantly non-Hispanic White, heterosexual samples, recent burgeoning attention to the role of anxiety sensitivity within different minority groups calls for greater information on the psychometric performance of the ASI-3 within these minority samples (Arnau et al., 2009; Ebesutani et al., 2016; Zvolensky et al., 2015).
Past work has noted differences in the presentation of anxiety across cultures (Marques et al., 2011), which supports further inquiry into whether the mechanisms underlying anxiety (such as anxiety sensitivity) may differ across cultures as well. Similarly, according to minority stress theory (Meyer, 2003), the disparate rates of anxiety among sexual minorities have been attributed to greater sexual identity concealment and discrimination experiences relative to heterosexual adults (Feinstein et al., 2017; Plöderl and Tremblay, 2015). Given how the stressors associated with the etiology of anxiety may differ for sexual minority adults relative to heterosexual peers, more work is needed to understand how factors like anxiety sensitivity function in the development of anxiety disorders among sexual minorities. Still, the strong support for the consistency of the underlying construct of anxiety cross-culturally despite variations in symptom presentation (Marques et al., 2011) would suggest that anxiety sensitivity may also prove invariant different demographic subgroups. However, without the systematic study of the measurement invariance properties of the ASI-3, questions will remain about the validity of conclusions drawn for how anxiety sensitivity functions within non-White, non-heterosexual samples.
Therefore, the purpose of the present study was to test the invariance of the factor structure of the ASI-3 in a large sample with sufficient diversity across sex, age, race/ethnicity, and sexual minority status. The specific aims of the study were threefold. First, the study was designed to assess the factor structure of the ASI-3. It was hypothesized that the present data would further affirm the bifactor structure of the ASI-3 that has gained support in recent work (Allan et al., 2015; Ebesutani et al., 2014; Osman et al., 2010; Rifkin et al., 2015). Fit indices for the bifactor model were expected to reflect good model fit, and relative model fit would be assessed in comparison with the original correlated three-factor model (Taylor et al., 2007) and the second order hierarchical model (Ebesutani et al., 2014). Second, the measurement invariance of the ASI-3 across sex (male versus female), age (assessed categorically by year up to age 24, with all participants ages 24 years or greater grouped together to achieve the number of free parameters necessary for analysis), race/ethnicity (non-Hispanic White, African–American, non-White Hispanic, Asian American), and sexual minority status (Heterosexual versus Gay/Lesbian/Bisexual/Other non-Heterosexual) would be tested. It was expected that the ASI-3 would demonstrate measurement invariance across each of the demographic groups examined. Finally, the validity of the ASI-3 would be tested in comparison with depression, suicidality, anxious arousal, and social anxiety, outcomes selected for the differentiable relations demonstrated between them and specific ASI-3 subfactors (Allan et al., 2014; Naragon-Gainey, 2010). Based upon past work (Allan et al., 2014), it was hypothesized that the general anxiety sensitivity factor would be related to elevations in all four symptom clusters; and among the subfactors, cognitive concerns would associate with elevated depression and suicidality symptoms, physical concerns with elevated anxious arousal symptoms, and social concerns with elevated social anxiety symptoms (Allan et al., 2015; Naragon-Gainey, 2010; Olatunji and Wolitzky-Taylor, 2009).
2. Method
2.1. Participants
University students (n = 3651; 77.8% female; Mage = 22.06 years; SD = 4.74) were recruited via flyers and the psychology subject pool of a large, ethnically diverse southwestern university (student body: 11% African–American, 22% Asian, 31% non-White Hispanic, 28% non-Hispanic White, 8% Other/Mixed) between January 2014 and April 2016 as part of a larger study examining mental and physical health among college students. Participants received extra credit towards their psychology course as compensation. Exclusion criteria included being younger than age 18, and non-proficiency in English (to ensure comprehension of study questions). Participants identified themselves as follows: 32% non-White Hispanic, 25.7% non-Hispanic White, 25.6% Asian, 11.9% African–American, 4.8% Other/Mixed race; 89.6% heterosexual, 1.8% gay, 1.9% lesbian, 5.8% bisexual, and 0.8% other/unsure.
2.2. Measures
A demographic questionnaire assessed the sex (male = 1, female = 2), age, race/ethnicity (1 = non-Hispanic White, 2 = African–American, 3 = non-White Hispanic, 4 = Asian, 5 = Other/Mixed), and sexual minority status (heterosexual = 0; gay/lesbian/bisexual/other/unsure = 1) of participants.
The Anxiety Sensitivity Index-3 (ASI-3; Taylor et al., 2007) is an 18-item measure developed based upon the original Anxiety Sensitivity Index (Peterson and Reiss, 1992). Respondents indicate the extent to which they are concerned about possible negative consequences of anxiety-related symptoms (e.g., “It scares me when my heart beats rapidly”). Responses are rated on a 5-point Likert scale ranging from 0 (Very Little) to 4 (Very Much) and summed to create a total score. The ASI-3 has three subscales: physical concerns, cognitive concerns, and social concerns. In past work, the ASI-3 has demonstrated sound psychometric properties as a valid assessment of anxiety sensitivity, with the total score and each of the subscales also exhibiting acceptable to good internal consistency (Taylor et al., 2007). The present sample had 50 cases with missing data on the ASI-3.
The Inventory of Depression and Anxiety Symptoms (IDAS; Watson et al., 2007) is a 64item self-report measure of depression and anxiety symptoms experienced during the previous two weeks. The IDAS contains 12 subscales: general depression (20 items), dysphoria (10 items), well-being (8 items), anxious arousal (8 items), lassitude (6 items), insomnia (6 items), suicidality (6 items), social anxiety (5 items), ill temper (5 items), traumatic intrusions (4 items), appetite loss (3 items), and appetite gain (3 items). Some subscales share overlapping items (e.g., items 7 and 15 are both contained in the general depression and suicidality subscales). In previous work, the IDAS subscales have shown good internal reliability (α = 0.80–0.89) and convergent validity with other measures of depression and anxiety among university students and psychiatric patients (Watson et al., 2007) and a diverse sample of community adults (Watson et al., 2012), as well as with depressive and anxiety diagnoses among psychiatric patients (Watson et al., 2008). The present study utilized as outcome variables the general depression (e.g. ‘I felt inadequate’; α = 0.92), suicidality (e.g., ‘I had thoughts of suicide,’ ‘I hurt myself purposely’; α = 0.86), anxious arousal (e.g., ‘I felt faint’; α = 0.90), and social anxiety (e.g., ‘I was worried about embarrassing myself socially’; α = 0.87) subscales, which demonstrated good to excellent internal consistency. In the present sample, 220 cases were missing data for the IDAS.
The Positive and Negative Affect Schedule (PANAS; Watson et al., 1988) is a self-report measure that assesses the degree to which participants typically experience 20 different positive (e.g., excited, proud) or negative affective states (e.g., afraid, distressed). Responses are based on a Likert scale ranging from 1 (Very Slightly or Not at All) to 5 (Extremely). The PANAS yields two subscales, positive affect (PA) and negative affect (NA), which have shown good internal consistency (PA: α = 0.86; NA: α = 0.90) and validity (Watson et al., 1988). The present study utilized the NA subscale (total sample: α = 0.90) as a covariate to adjust for the broad-based tendency to experience negative mood states. The present sample included 329 cases with missing data on the PANAS.
2.3. Procedures
Study procedures complied with the Institutional Review Board at the university in which the study was conducted. Each participant completed online informed consent before proceeding to an internet-based self-report survey. All study measures were completed online. Students were compensated with extra credit toward psychology coursework. No identifying information was retained linking participants to survey responses.
2.4. Data analytic strategy
Descriptive statistics, Cronbach’s alpha, and bivariate relations among study variables were examined using SPSS 24 (IBM Corp., 2015). Confirmatory factor analyses and path analyses within a structural equation modeling framework were conducted using Mplus 7.31 (Muthén and Muthén, 2012) using Weighted Least Squares Means and Variances (WLSMV) estimation, which is appropriate for ordinal categorical data (Flora and Curran, 2004; Muthén et al., 1997). Theta parameterization was utilized instead of the default delta parameterization because it allows for the estimation of residual variance for the latent construct and the independent testing of metric (factor loading) and scalar (thresholds) invariance, which is useful for multigroup analyses (Muthén and Muthén, 2012). To account for missing data while using WLSMV estimation, multiple imputation was completed using the Markov Chain Monte Carlo method within Mplus to pool parameter estimates across 20 separate data sets (Enders, 2013). Confirmatory factor analyses (CFA) were used to compare the three-factor correlated model of the ASI-3 (Taylor et al., 2007) with the bifactor model (Ebesutani et al., 2014). Model fit was assessed using the root mean square error of approximation (RMSEA), with values of less than 0.06 indicating excellent fit and values above 0.10 suggesting poor fit; and the Comparative Fit Index (CFI), with values between 0.95 and 1.00 indicating excellent fit and values between 0.90 and 0.94 indicating acceptable fit (Hu and Bentler, 1999). To compare the model fit of the two competing models, the “difftest” function in Mplus was used to calculate the χ2 difference test appropriate for WLSMV estimation, in which degrees of freedom and the χ2 distribution differ from the standard χ2 (Muthén and Muthén, 2012).
2.4.1. Measurement invariance
To evaluate measurement invariance across sex, age, race/ethnicity, and sexual minority status, the recommendations of Brown (2015) and Ebesutani et al. (2014) were followed. For each multigroup invariance test, model fit for the best-fitting model determined from the CFA was first examined within each group (e.g., males-only, females-only). Next, configural invariance was examined in the combined sample to determine whether the same number of factors and item-factor loading patterns were consistent across groups. Obtaining acceptable model fit according to the stated benchmarks was considered support for configural invariance (Brown, 2015). The ordinal categorical nature of the ASI-3 items necessitated examination of the metric (i.e., constraining item factor loadings to be equal across groups) and scalar (i.e., constraining item thresholds to be equal across groups) invariance simultaneously to aid interpretability (Muthén and Muthén, 2012). In contrast to scalar invariance testing via constraining item intercepts to be equal across groups with continuous data, categorical data requires item thresholds (i.e., expected value of latent construct at which a respondent most likely transitions from one response option to the immediately above option) be constrained. The number of thresholds modeled equals the number of response options minus one (Muthén and Muthén, 2012). To determine simultaneous metric and scalar invariance (i.e., differential item functioning), the change in CFI from the configural invariance model to the metric/scale invariance model was examined, with changes less than 0.01 indicating support for the absence of differential item functioning (i.e., invariance; Chen, 2007). Change in CFI has been shown to be more robust and less sensitive to sample size or model complexity compared with the χ2 difference test or change in RMSEA (Chen, 2007; Cheung and Rensvold, 2002).
2.4.2. Internal reliability
Because of its frequent use within the literature, Cronbach’s alpha was computed to assess the internal reliability of the ASI-3 general factor (i.e., total scale score) and each of the ASI-3 subfactors and assessed using the following criteria: α ≤ 0.9, excellent; α ≤ 0.8, good; α ≤ 0.7, adequate (Cohen, 1977). These calculations were conducted within the total sample, as well as within each demographic group for which measurement invariance testing was conducted.
2.4.3. Omega hierarchical coefficient
Following the recommendations of Raykov and Marcoulides (2011; see also: Reise, 2012), the omega coefficient (ωH) was estimated with bootstrapped standard errors and bias corrected confidence intervals to assess the degree of variance accounted for by the general factor and each of the ASI-3 subfactors. Maximum likelihood estimation of ωH was used without specifying the item indicators as categorical (Raykov and Marcoulides, 2011). The squared sum of the unstandardized factor loadings was divided by the sum of the unstandardized item residual variances with the squared sum of the unstandardized factor loadings. Thus, the numerator represented the variance accounted for by the specified items, while the denominator represented all sources of common variance for the specified items. In addition to estimating ωH for the general factor and each subfactor, the omega index was also estimated, which described the total amount of variance accounted for by the general factor and all three subfactors together (Reise, 2012). As initially specified, the model failed to converge. A review of the residual variances revealed a negative residual variance for item 2, and modification indices suggested correlating the disturbances of items 2 and 5. Examination of the wording of these items supported the correlation of their disturbances, as these were the only two items querying anxiety sensitivity related to not being able to keep one’s “mind on task.” The variance accounted for by the correlation of the disturbances of items 2 and 5 was included in the calculation of ωH for the Cognitive concerns subfactor, the general factor, and the omega index.
2.4.4. Validity path analysis
The convergent and divergent validity of the ASI-3 total score and subscales was examined within a structural equation modeling framework. First, a measurement model was specified that included the ASI-3 bifactor model with latently modeled IDAS-General Depression, IDAS-Suicidality, IDAS-Anxious Arousal, and IDAS-Social Anxiety, as well as the Negative Affect subscale of the PANAS as covariates. To model all scales other than the ASI-3, item parcels were created to reduce model complexity. Parcels were created by randomly assigning items to one of three (IDAS-Suicidality, IDAS-Social Anxiety) or four (IDAS-General Depression, IDAS-Anxious Arousal, PANAS-Negative Affect) parcels that subsequently were used to model their respective latent construct (Little et al., 2013). The parceling approach was taken to account for the lack of model identification when using only item-level data to model the latent factors of the validity constructs. The proportion of observed indicators relative to the sample size exceeded the rule-of-thumb of 10 participants for every estimated parameter, resulting in the model not being identified (Kline, 2011). Therefore, parceling was used to decrease model complexity (Little et al., 2013). Good model fit was determined based upon the same standards specified above (Hu and Bentler, 1999). Next, one path analytic model was specified with the ASI-3 total score and subscales (bifactor model) as the predictor variables; sex, age, race/ethnicity, sexual minority status, and negative affectivity as covariates; and the four IDAS subscales as criterion variables.
3. Results
3.1. Confirmatory factor analysis
Based upon past support for the three-factor correlated model (Taylor et al., 2007) and the bifactor model of the ASI-3 (Ebesutani et al., 2014; Osman et al., 2010), these models were estimated and their relative model fit compared. Both the three-factor correlated model (χ2[132] = 2769.106, p < .001; RMSEA = 0.074; CFI = 0.963; TLI = 0.958) and the bifactor model (χ2[117] = 2334.379, p < .001; RMSEA = 0.072; CFI = 0.969; TLI = 0.960) demonstrated acceptable model fit. Separate robust chi-square difference tests were conducted within a subset (five) of imputed data sets, which unanimously showed the bifactor model with superior model fit (Δ χ2[15] M = 461.433, SD = 7.528, ps < 0.001, range: 454.988 to 470.182). Therefore, subsequent measurement invariance tests were conducted using the bifactor model. In the bifactor model, factor loadings were generally larger on the general factor (range: 0.283 to 0.840) relative to the subfactors (Physical Concerns: 0.243 to 0.579; Cognitive Concerns: 0.173 to 0.484; Social Concerns: 0.281 to 0.462), though all factor loadings were significant (ps < 0.001; see Fig. 1 for all standardized loadings).
Fig. 1.
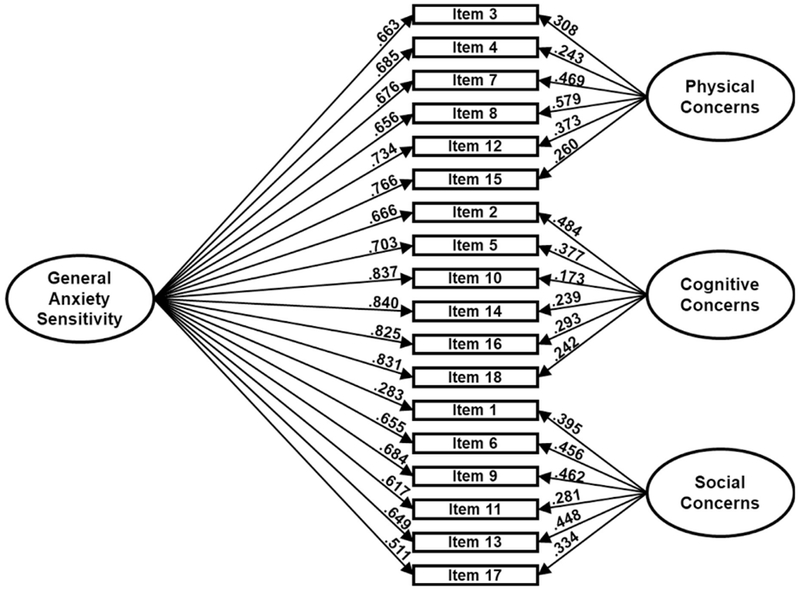
Bifactor measurement model for the Anxiety Sensitivity Index-3. Note: Parameter estimates are standardized.
3.2. Measurement invariance
3.2.1. Sex
The ASI-3 bifactor model fit well among males (n = 810; χ2[117] = 443.020, p < .001; RMSEA = 0.059; CFI = 0.977; TLI = 0.970) and females (n = 2,841; χ2[117] = 2021.070, p < .001; RMSEA = 0.076; CFI = 0.967; TLI = 0.957). Regarding test of equal form, configural invariance was demonstrated across males and females with strong model fit in the combined sample (χ2[234] = 2425.128, p < .001; RMSEA = 0.072; CFI = 0.969; TLI = 0.960). The test of equal factor loadings and equal item thresholds indicated invariance across males and females with ΔCFI = 0.007. Differential item functioning was not observed for the ASI-3 between males and females (see Table 1).
Table 1.
Confirmatory factor analysis and measurement invariance testing of the Anxiety Sensitivity Index-3.
| χ2 |
RMSEA |
TLI |
CFI |
Avg χ2 | ||||||||
|---|---|---|---|---|---|---|---|---|---|---|---|---|
| Model | n | M | SD | df | p | M | SD | M | SD | M | SD | Diff |
| 3-factor correlated | 3651 | 2769.106 | 19.741 | 132 | <.001 | 0.074 | <0.001 | 0.958 | <0.001 | 0.963 | <0.001 | |
| Bifactor | 3651 | 2334.379 | 22.082 | 117 | <.001 | 0.072 | <0.001 | 0.960 | <0.001 | 0.969 | <0.001 | 461.4334 |
| Measurement invariance testing | ||||||||||||
| Sex | ΔCFI | |||||||||||
| Men | 810 | 443.020 | 6.318 | 117 | <.001 | 0.059 | 0.001 | 0.970 | 0.001 | 0.977 | <0.001 | |
| Women | 2841 | 2021.070 | 22.690 | 117 | <.001 | 0.076 | <0.001 | 0.957 | 0.001 | 0.967 | <0.001 | |
| Sex - configural | 3651 | 2425.128 | 25.311 | 234 | <.001 | 0.072 | <0.001 | 0.960 | 0.001 | 0.969 | <0.001 | |
| Sex - metric/scalar | 3651 | 2018.611 | 20.270 | 316 | <.001 | 0.054 | <0.001 | 0.977 | <0.001 | 0.976 | <0.001 | 0.007 |
| Race/ethnicity | ||||||||||||
| Non-Hispanic White | 938 | 521.068 | 7.867 | 117 | <.001 | 0.061 | 0.001 | 0.970 | 0.001 | 0.977 | .001 | |
| African American* | 436 | 394.993 | 5.575 | 116 | <.001 | 0.074 | 0.001 | 0.951 | 0.001 | 0.963 | .001 | |
| Non-White Hispanic | 1168 | 744.495 | 6.188 | 117 | <.001 | 0.068 | <0.001 | 0.967 | <0.001 | 0.974 | <0.001 | |
| Asian American* | 933 | 689.084 | 7.394 | 116 | <.001 | 0.073 | <0.001 | 0.962 | 0.001 | 0.971 | <0.001 | |
| Race/ethnicity - configural | 3651 | 2354.485 | 16.143 | 468 | <.001 | 0.068 | <0.001 | 0.964 | <0.001 | 0.972 | <0.001 | |
| Race/ethnicity - metric/scalar | 3651 | 2376.766 | 14.789 | 714 | <.001 | 0.052 | <0.001 | 0.979 | <0.001 | 0.976 | <0.001 | 0.004 |
| Age | ||||||||||||
| 18–20 years | 1687 | 1119.606 | 13.933 | 117 | <.001 | 0.071 | <0.001 | 0.957 | 0.001 | 0.967 | .001 | |
| 21 + years* | 1964 | 1176.244 | 11.645 | 116 | <.001 | 0.068 | <0.001 | 0.967 | <0.001 | 0.975 | <0.001 | |
| Age - configural | 3651 | 2356.246 | 21.485 | 234 | <.001 | 0.070 | <0.001 | 0.962 | <0.001 | 0.971 | <0.001 | |
| Age - metric/scalar | 3651 | 1919.186 | 16.143 | 316 | <.001 | 0.053 | <0.001 | 0.979 | <0.001 | 0.978 | <0.001 | 0.007 |
| Sexual minority status | ||||||||||||
| Sexual minority | 378 | 268.737 | 3.626 | 117 | <.001 | 0.059 | .001 | 0.975 | 0.001 | 0.981 | <0.001 | |
| Heterosexual | 3273 | 2212.165 | 21.985 | 117 | <.001 | 0.074 | <0.001 | 0.957 | 0.001 | 0.967 | <0.001 | |
| Sexual identity - configural | 3651 | 2335.211 | 19.688 | 234 | <.001 | 0.070 | <0.001 | 0.961 | <0.001 | 0.970 | <0.001 | |
| Sexual identity - metric/scalar | 3651 | 1863.350 | 13.844 | 316 | <.001 | 0.052 | <0.001 | 0.979 | <0.001 | 0.978 | <0.001 | 0.008 |
Note: Items 2 and 5 correlated.
3.2.2. Race/ethnicity
The ASI-3 bifactor model fit well among individuals identifying as non-Hispanic White (n = 938; χ2[117] = 521.068, p < .001; RMSEA = 0.061; CFI = 0.977; TLI = 0.970), and Hispanic/Latino (n = 1,168; χ2 [117] = 744.495, p < .001; RMSEA = 0.068; CFI = 0.974; TLI = 0.967). For those identifying as Asian or African–American, the models were not identified. Examination of the modification indices in the non-imputed analyses suggested a correlation between items 2 and 5, and theory supported this correlation as both items pertain to “keeping [one’s] mind on a task.” After adding a correlation between items 2 and 5, the model fit well among Asians (n = 933; χ2[116] = 689.084, p < .001; RMSEA = 0.073; CFI = 0.971; TLI = 0.962) and African–Americans (n = 436; χ2[116] = 394.993, p < .001; RMSEA = 0.074; CFI = 0.963; TLI = 0.951). The correlation of items 2 and 5 was not required for the measurement invariance testing models to converge and, therefore, was not included. Regarding test of equal form, configural invariance was demonstrated across the four racial/ethnic groups with strong model fit in the combined sample (χ2[468] = 2354.485, p < .001; RMSEA = 0.068; CFI = 0.972; TLI = 0.964). The test of equal factor loadings and equal item thresholds indicated invariance across racial/ethnic groups with ΔCFI = 0.004. Taken together, there is evidence for partial invariance across racial/ethnic groups due to differential item functioning, as evidenced by the required correlation between items 2 and 5 to achieve model convergence within the Asian and African–American subsamples (see Table 1).
3.2.3. Age
The ASI-3 bifactor model fit well among all age categories (18 years: n = 358; χ2[117] = 281.045, p < .001; RMSEA = 0.063; CFI = 0.978; TLI = 0.971; 19 years: n = 692; χ2[117] = 527.001, p < .001; RMSEA = 0.071; CFI = 0.968; TLI = 0.958; 20 years: n = 637; χ2[117] = 507.832, p < .001; RMSEA = 0.072; CFI = 0.965; TLI = 0.954; 21 years: n = 545; χ2[117] = 454.899, p < .001; RMSEA = 0.073; CFI = 0.975; TLI = 0.967; 22 years: n = 384; χ2[117] = 367.098, p < .001; RMSEA = 0.075; CFI = 0.967; TLI = 0.956; 23 years: n = 263; χ2[117] = 329.335, p < .001; RMSEA = 0.083; CFI = 0.967; TLI = 0.956; 24 or more years: n = 772; χ2[117] = 414.055, p < .001; RMSEA = 0.057; CFI = 0.981; TLI = 0.975). Regarding test of equal form, configural invariance was demonstrated across older and younger individuals with good model fit in the combined sample (χ2[819] = 2858.776, p < .001; RMSEA = 0.069; CFI = 0.973; TLI = 0.964). The test of equal factor loadings and equal item thresholds indicated invariance across the age groups examined with ΔCFI = 0.006. Therefore, differential item functioning was not observed across the age groups examined (see Table 1).
3.2.4. Sexual minority status
The ASI-3 bifactor model fit well among those identifying as sexual minorities (n = 378; χ2[117] = 268.737, p < .001; RMSEA = 0.059; CFI = 0.981; TLI = 0.975) and among those identifying as heterosexual (n = 3273; χ2[117] = 2212.165, p < .001; RMSEA = 0.074; CFI = 0.967; TLI = 0.957), respectively. Regarding test of equal form, configural invariance was demonstrated across sexual minorities and heterosexuals with strong model fit in the combined sample (χ2[234] = 2335.211, p < .001; RMSEA = 0.070; CFI = 0.970; TLI = 0.961). The test of equal factor loadings and equal item thresholds indicated invariance across heterosexuals and sexual minorities with ΔCFI = 0.008. None of the ASI-3 items were associated with differential item functioning between sexual minorities and heterosexuals (see Table 1).
3.2.5. Internal reliability
The internal reliability of the ASI-3 general factor (i.e., total scale score) was excellent in the full sample and within each specific demographic group examined (see Table 2). Good internal reliability was observed within each of the subfactors of the ASI-3, with the exception of AS cognitive concerns among sexual minority participants (α = 0.909; excellent) and AS social concerns among men, Hispanic participants, and African–American participants (α = 0.783, 0.798, 0.776, respectively; all adequate).
Table 2.
Reliability of the Anxiety Sensitivity Index-3.
| Cronbach’s α | Full sample | Men | Women | 18–20 years | ≥21 years | Hetero- sexual | Sexual minority | White | African–American | Hispanic | Asian American |
|---|---|---|---|---|---|---|---|---|---|---|---|
| General factor | 0.924 | 0.921 | 0.925 | 0.920 | 0.927 | 0.923 | 0.927 | 0.917 | 0.918 | 0.925 | 0.932 |
| Physical concerns | 0.861 | 0.855 | 0.862 | 0.860 | 0.862 | 0.859 | 0.863 | 0.857 | 0.843 | 0.860 | 0.872 |
| Cognitive concerns | 0.895 | 0.891 | 0.896 | 0.890 | 0.898 | 0.892 | 0.909 | 0.895 | 0.885 | 0.893 | 0.896 |
| Social concerns | 0.804 | 0.783 | 0.810 | 0.804 | 0.803 | 0.801 | 0.819 | 0.798 | 0.776 | 0.813 | 0.807 |
| McDonald’s ω (SD) | Full sample | Men | Women | 18–20 years | ≥ 21 years | Hetero- sexual | Sexual minority | White | African–American | Hispanic | Asian American |
| General factor | 0.838 (0.006) | 0.842 (0.012) | 0.839 (0.007) | 0.823 (0.010) | 0.849 (0.008) | 0.833 (0.007) | 0.828 (0.018) | 0.807 (0.014) | 0.832 (0.022) | 0.839 (0.010) | 0.865 (0.010) |
| Physical concerns | 0.230 (0.029) | 0.238 (0.037) | 0.219 (0.034) | 0.214 (0.043) | 0.245 (0.032) | 0.241 (0.027) | 0.318 (0.076) | 0.326 (0.060) | 0.218 (0.063) | 0.202 (0.034) | 0.183 (0.046) |
| Cognitive concerns | 0.118 (0.034) | 0.056 (0.039) | 0.138 (0.037) | 0.178 (0.044) | 0.066 (0.036) | 0.102 (0.029) | 0.110 (0.093) | 0.068 (0.082) | 0.121 (0.068) | 0.176 (0.036) | 0.065 (0.043) |
| Social concerns | 0.320 (0.023) | 0.347 (0.031) | 0.311 (0.025) | 0.342 (0.021) | 0.303 (0.028) | 0.336 (0.021) | 0.345 (0.063) | 0.400 (0.047) | 0.325 (0.054) | 0.295 (0.030) | 0.296 (0.031) |
| All factors | 0.936 (0.003) | 0.936 (0.006) | 0.937 (0.002) | 0.934 (0.003) | 0.939 (0.003) | 0.935 (0.003) | 0.941 (0.006) | 0.932 (0.004) | 0.931 (0.007) | 0.938 (0.003) | 0.941 (0.004) |
3.2.6. Omega hierarchical coefficients
The omega coefficient (ωH) for the general factor was 0.838 (SE = 0.006), suggesting it accounted for the predominance of variance among the ASI-3 items. Each of the ASI-3 subfactors demonstrated considerably lower estimates of ωH (physical concerns: ωH = 0.230, SE = 0.029; cognitive concerns: ωH = 0.118, SE = 0.034; social concerns: ωH = 0.325, SE = 0.023).
Altogether, the omega index (accounting for all sources of common variance) demonstrated that the total proportion of variance accounted for across the general factor and all three subfactors was 93.6% of the variance in the items (ωH = 0.936, SE = 0.003). This general pattern was also observed within each demographic group examined (see Table 2 for details).
3.2.7. Comparison of ASI-3 general factor scores across demographics
With evidence of the measurement invariance of the ASI-3 across groups, two three-way ANOVAs were analyzed to examine group differences in the ASI-3 total scale score (general factor) across sex, sexual minority status, and age; as well as sex, sexual minority status and race/ethnicity. A Bonferroni correction was made such that the adjusted alpha was 0.025. In the model examining age, a main effect of age and sexual minority status was observed, and the two-way interaction of age by sexual minority status was also below the adjusted alpha level. A three-way interaction effect was not observed. In the model examining race/ethnicity, main effects of race/ethnicity and sexual minority status were observed, while no interaction effects were below the adjusted alpha level. See Table 3 for the means and standard deviations for each subgroup examined, as well as the model statistics for the two ANOVA models analyzed.
Table 3.
Comparison of ASI-3 total scores across groups.
| Men |
Women |
|||||||||||
|---|---|---|---|---|---|---|---|---|---|---|---|---|
| Sexual minority |
Heterosexual |
Sexual minority |
Heterosexual |
|||||||||
| Mean | SD | n | Mean | SD | n | Mean | SD | n | Mean | SD | n | |
| 18 years | 22.769 | 11.144 | 13 | 21.5412 | 12.78257 | 85 | 28.563 | 14.717 | 32 | 21.563 | 14.982 | 224 |
| 19 years | 26.235 | 18.250 | 17 | 20.175 | 14.247 | 166 | 26.804 | 16.962 | 46 | 20.578 | 13.586 | 455 |
| 20 years | 34.214 | 18.577 | 14 | 19.793 | 11.923 | 106 | 25.400 | 15.218 | 50 | 20.155 | 13.857 | 451 |
| 21 years | 17.625 | 13.005 | 8 | 21.377 | 14.675 | 114 | 25.353 | 17.548 | 34 | 20.682 | 14.346 | 381 |
| 22 years | 16.000 | 5.264 | 8 | 20.480 | 13.526 | 50 | 22.586 | 14.379 | 29 | 21.393 | 14.408 | 293 |
| 23 years | 36.500 | 15.460 | 4 | 20.977 | 14.050 | 43 | 28.484 | 17.311 | 31 | 20.549 | 14.597 | 184 |
| 24+ years | 20.303 | 12.895 | 33 | 17.870 | 13.620 | 138 | 20.246 | 13.921 | 57 | 17.624 | 14.119 | 535 |
| White | 25.120 | 13.103 | 25 | 17.782 | 11.912 | 188 | 26.103 | 15.148 | 97 | 18.763 | 13.584 | 620 |
| African–American | 21.750 | 7.906 | 8 | 21.092 | 13.451 | 76 | 21.520 | 15.525 | 25 | 18.270 | 13.683 | 318 |
| Hispanic | 23.447 | 17.707 | 38 | 17.618 | 12.322 | 170 | 23.295 | 17.251 | 95 | 19.895 | 14.361 | 853 |
| Asian | 24.333 | 15.689 | 24 | 23.940 | 14.989 | 232 | 28.447 | 14.948 | 38 | 22.205 | 14.544 | 624 |
Note: Main effects were observed for sexual minority status (Age model F = 4.949, p < .001; Race/ethnicity model F = 16.615, p < .001), age (F = 21.159, p < .001), and race/ethnicity (F = 3.46, p = .016) for ASI-3 total score. An interaction of sexual minority status with age group was also observed (F = 2.811, p = .010).
3.3. Validity
The measurement model including the bifactor model along with the latently modeled criterion variables and covariates demonstrated adequate model fit (χ2[546] = 4704.854, p < .001; RMSEA = 0.046; CFI = 0.947; TLI = 0.939), as did the path analytic model (χ2[674] = 4633.207, p < .001; RMSEA = 0.040; CFI = 0.953; TLI = 0.946). The general anxiety sensitivity factor was positively related to all four criterion variables (see Table 4). After controlling for the general anxiety sensitivity factor, AS cognitive concerns and AS social concerns were also positively related to general depression symptoms and inversely associated with anxious arousal symptoms. All three ASI-3 subfactors were negatively related to suicidality symptoms. AS social concerns were positively related to social anxiety symptoms. AS physical concerns were unrelated to general depression and anxious arousal symptoms, while cognitive concerns were unrelated to social anxiety symptoms.
Table 4.
Criterion validity of the Anxiety Sensitivity Index-3 in relation to symptoms of depression, suicidality, anxious arousal, and social anxiety.
| Bifactor model | IDAS-General Depression |
Suicidality |
Anxious Arousal |
Social Anxiety |
||||||||||||
|---|---|---|---|---|---|---|---|---|---|---|---|---|---|---|---|---|
| β | SE | z | p | β | SE | z | p | β | SE | z | p | β | SE | z | p | |
| AS-General | 0.301 | 0.027 | 11.169 | <.001 | 0.302 | 0.036 | 8.297 | <.001 | 0.389 | 0.030 | 13.013 | <.001 | 0.445 | 0.029 | 15.320 | <.001 |
| AS-Physical | 0.025 | 0.045 | 0.558 | .577 | −0.269 | 0.058 | −4.652 | <.001 | −0.028 | 0.041 | −0.670 | .503 | −0.132 | 0.042 | −3.167 | .002 |
| AS-Cognitive | 0.323 | 0.068 | 4.755 | <.001 | −0.262 | 0.074 | −3.543 | .002 | −0.133 | 0.056 | −2.351 | .019 | −0.028 | 0.056 | −0.505 | .614 |
| AS-Social | 0.235 | 0.049 | 4.786 | <.001 | −0.333 | 0.059 | −5.613 | <.001 | −0.143 | 0.043 | −3.333 | .001 | 0.391 | 0.043 | 9.050 | <.001 |
| NA | 0.721 | 0.035 | 20.714 | <.001 | 0.553 | 0.069 | 8.062 | <.001 | 0.555 | 0.043 | 12.818 | <.001 | 0.539 | 0.032 | 16.968 | <.001 |
| Age | −0.026 | 0.006 | −4.217 | <.001 | −0.018 | 0.006 | −2.923 | .003 | −0.015 | 0.006 | −2.465 | .014 | −0.028 | 0.006 | −4.361 | <.001 |
| Sex | 0.057 | 0.062 | 0.923 | .356 | −0.233 | 0.053 | −4.363 | <.001 | −0.070 | 0.053 | −1.321 | .186 | −0.054 | 0.061 | −0.885 | .376 |
| Sexual minority | 0.653 | 0.082 | 7.920 | <.001 | 0.530 | 0.066 | 8.009 | <.001 | 0.362 | 0.066 | 5.491 | <.001 | 0.591 | 0.075 | 7.909 | <.001 |
| Race/ethnicity | 0.028 | 0.021 | 1.330 | .183 | 0.024 | 0.019 | 1.277 | .202 | 0.024 | 0.018 | 1.285 | .199 | 0.029 | 0.020 | 1.435 | .151 |
| Post-hoc 3-factorc correlated model | IDAS-General Depression |
Suicidality |
Anxious Arousal |
Social Anxiety |
||||||||||||
| β | SE | z | p | β | SE | z | p | β | SE | z | p | β | SE | z | p | |
| AS-Physical | −0.235 | 0.046 | −5.094 | <.001 | −0.014 | 0.039 | −0.369 | .077 | 0.205 | 0.037 | 5.461 | <.001 | −0.265 | 0.046 | −5.804 | <.001 |
| AS-Cognitive | 0.398 | 0.050 | 7.917 | <.001 | 0.333 | 0.041 | 8.143 | <.001 | 0.183 | 0.042 | 4.362 | <.001 | 0.039 | 0.050 | 0.771 | .441 |
| AS-Social | 0.217 | 0.040 | 5.462 | <.001 | −0.142 | 0.035 | −4.014 | <.001 | −0.030 | 0.036 | −0.838 | .402 | 0.768 | 0.047 | 16.285 | <.001 |
| NA | 0.746 | 0.028 | 26.799 | <.001 | 0.387 | 0.022 | 17.625 | <.001 | 0.480 | 0.023 | 20.603 | <.001 | 0.528 | 0.026 | 19.924 | <.001 |
| Age | −0.025 | 0.006 | −4.229 | <.001 | −0.016 | 0.005 | −2.941 | .003 | −0.014 | 0.006 | −2.468 | .014 | −0.028 | 0.006 | −4.361 | <.001 |
| Sex | 0.055 | 0.060 | 0.922 | .356 | −0.205 | 0.046 | −4.437 | <.001 | −0.067 | 0.051 | −1.322 | .186 | −0.054 | 0.061 | −0.885 | .376 |
| Sexual minority | 0.635 | 0.079 | 8.022 | <.001 | 0.468 | 0.055 | 8.474 | <.001 | 0.349 | 0.063 | 5.507 | <.001 | 0.594 | 0.075 | 7.904 | <.001 |
| Race/ethnicity | 0.027 | 0.021 | 1.330 | .183 | 0.022 | 0.017 | 1.280 | .201 | 0.023 | 0.018 | 1.286 | .198 | 0.029 | 0.020 | 1.435 | .151 |
Note: Parameter estimates are unstandardized.
All italicized values indicate significant associations observed in the model.
The associations of the three AS specific factors with the criterion variables, while controlling for the AS general factor, were unexpected. Therefore, to examine whether the AS general factor may be influencing these unexpected relations of the AS specific factors with the criterion variables, a post-hoc path analytic model was examined using the correlated three-factor model instead of the bifactor model. The post-hoc measurement model yielded adequate model fit (χ2[566] = 4940.363, p < .001; RMSEA = 0.046; CFI = 0.944; TLI = 0.938), as did the path analytic model (χ2 [694] = 5018.370, p < .001; RMSEA = 0.041; CFI = 0.949; TLI = 0.943). Only changes from the original model that included the bifactor configuration to the post-hoc model with the three-factor correlated configuration are reported below. For a full report of the associations observed in the post-hoc model, see Table 4. After removing the AS general factor from the model, AS physical concerns was inversely associated with general depression symptoms, unrelated to suicidality symptoms, and positively associated with anxious arousal symptoms. AS cognitive concerns switched directions of association, from negative when controlling for the AS general factor (bifactor model) to positive when leaving out the AS general factor (post-hoc model), with both suicidality symptoms and anxious arousal symptoms. AS social concerns was unrelated to anxious arousal symptoms after removing the AS general factor from the model.
4. Discussion
The aims of the present study were to (1) examine the factor structure of the ASI-3; (2) test the measurement invariance properties of the ASI-3 across sex, age, race/ethnicity, and sexual minority status; and (3) to further support the validity of the ASI-3. The first hypothesis, that a bifactor model would be the factor structure yielding the best fit, was supported. As has been reported from past findings (Allan et al., 2015; Ebesutani et al., 2014; Osman et al., 2010; Rifkin et al., 2015), the bifactor model of the ASI-3 demonstrated superior fit relative to the three-factor correlated model among this highly diverse young adult sample. Within the bifactor model, all items simultaneously loaded onto an AS general factor and one of three AS specific factors, with the AS general factor and all AS specific factors orthogonal to one another. Additionally, measurement invariance testing of the bifactor model generally supported the second hypothesis. Across each demographic group, tests of configural invariance and equal factor loadings and item thresholds all converged and changes in CFI (i.e., model fit) were less than 0.01, within the acceptable range to demonstrate measurement invariance (Chen, 2007). However, when model fit was examined within each demographic subgroup, the bifactor model failed to converge within the African–American and Asian American subsamples—until items 2 and 5 from the AS cognitive concerns subfactor were correlated. The need to correlate items 2 and 5 within these specific subgroups may suggest only partial measurement invariance. Notably, items 2 and 5 are the only items in the ASI-3 to specifically reference “keeping one’s mind on task,” which may partially explain the difference in performance of these items relative to the remainder of the ASI-3. Generally, factor loadings on the AS Cognitive Concerns factor for items 2 and 5 were among the lowest for African–Americans and Asian Americans (data available upon request). It may be that some cultures place less value on linear thought processes, having greater tolerance for circular or tangential thought processes as within normative, non-pathological experience. Perhaps also specific mention of “the mind” may not be perceived as relevant to emotional distress for members of cultures that tend to somaticize rather than psychologize anxiety symptoms (Marques et al., 2011). These findings suggest that more work is needed to clarify the ASI-3 factor structure across age and race.
Evidence for the bifactor model of the ASI-3 would seem to suggest the ASI-3 is a multidimensional measure. However, additional evidence from the present study lends more support for a primarily unidimensional structure of the ASI-3. In accord with past work (Ebesutani et al., 2014; Osman et al., 2010), the McDonald’s Omega Hierarchical coefficient observed that 83.8% of the variance in the ASI-3 items was accounted for by the AS general factor, while the coefficients for the AS specific factors were much lower (ω’s = 0.118–0.320). Moreover, like past work (Allan et al., 2015; Ebesutani et al., 2014), all items but Item 1 demonstrated higher factor loadings on the AS general factor relative to their respective AS specific factors. Finally, in assessing the validity of the ASI-3, the relation of the AS general factor and each of the AS specific factors with each of the criterion variables was analyzed in one model. Analyzing these paths within the same model isolated the unique relation of each factor on each criterion variable by controlling for all other AS factors. Within this model, the AS general factor was consistently positively associated with each criterion variable and often exhibited the greatest magnitude of association (particularly in relation to anxiety symptomology). Together, these findings support the conclusions by Ebesutani et al. (2014) that the AS general factor strongly accounts for the variation in item scores and does so more strongly than the AS specific factors.
Given the evidence of the measurement invariance of the ASI-3 across sex, age, sexual minority status, and race/ethnicity (partial invariance), the ASI-3 total scores were compared across groups via two separate three-way ANOVAs. Main effects were observed for sexual minority status, age, and race/ethnicity were observed, while among the interaction effects examined only a sexual minority status by age interaction was observed. Scores for participants 24 years or older were lower than all other ages (range of mean differences = −4.254 to −2.852, p’s = 0.004 to <0.001; with no other differences observed across age groups), while sexual minorities generally evidenced higher scores across age groups. Greater decline in scores across age was observed among sexual minorities relative to heterosexual adults, although sexual minorities continued to have higher scores among participants 24 years or older. In comparisons across race/ethnicity, Asian Americans demonstrated higher scores than all other groups (non-Hispanic Whites:mean difference = 3.456, p < .001; African Americans: mean difference = 3.929, p < .001; non-White Hispanics: mean difference = 3.002, p < .001); no differences were observed among non-Hispanic Whites, African–Americans, and non-White Hispanics (data available upon request).
In addition to providing further evidence for the unidimensionality of the ASI-3, the present validity findings may provide some insight into the nature of the AS specific factors. When controlling for the AS general factor, AS cognitive concerns was related to both depressive and social anxiety symptoms, and AS social concerns was associated with depressive symptoms. Like some previous findings (Allan et al., 2015; Osman et al., 2010), these data would suggest the added utility of assessing the AS specific factors alongside the AS general factor. However, several negative associations between AS specific factors with suicidality and anxious arousal symptoms contrasted with past work on the ASI-3 (Allan et al., 2015). After accounting for the AS general factor and the other respective AS specific factors, AS physical concerns were inversely associated with symptoms of suicidality and social anxiety and unrelated to symptoms of depression and anxious arousal, a finding that supports work conducted without utilizing a bifactor modeling framework (Capron et al., 2012). It may be that greater AS physical concerns increases sensitivity to pain, which protects against perceived suicide ability per the Interpersonal Theory of Suicide (Fink et al., 2013; Van Orden et al., 2005).
In contrast to the report of Allan et al. (2015) suggesting AS cognitive concerns were positively associated with suicidality, AS cognitive concerns in the present study were inversely related to suicidal symptoms, as well as inversely related to anxious arousal. Moreover, AS social concerns were inversely related to suicidality, which contrasted with work guided by the Interpersonal Theory of Suicide suggesting AS social concerns may increase suicidality via increased thwarted belongingness (Hudiburgh et al., 2017). While past work utilizing a bifactor model had documented the AS specific factors being unrelated to trait anxiety (Ebesutani et al., 2014), or positively associated with depression, worry, and social anxiety (Allan et al., 2015), no past findings have documented inverse associations between AS specific factors and criterion variables. Given the uniqueness of this finding, more work is needed to confirm that these inverse associations are not spurious. One possibility is that the inclusion of the AS general factor in the bifactor model yielded a suppression effect upon the relations of the ASI-3 subfactors with the criterion variables. Moreover, these data suggested that the ASI-3 subfactors accounted for relatively small amount of variance in ASI-3 items (ω’s = 0.118–0.320) when examined in the bifactor model alongside the ASI-3 general factor. This unidimensionality of the ASI-3 may suggest that the ASI-3 subfactors exhibit low reliability relative to the ASI-3 general factor when examined within the bifactor model, which may have led to less reliable relations with the criterion variables in the present study. Another possible explanation may be the use of a single assessment instrument, the IDAS, to measure multiple affective constructs, rather than utilizing separate measures for each construct, as was done in past work that utilized a bifactor model of the ASI-3 and reported positive relations between the ASI-3 subfactors and affective criterion variables (Allan et al., 2015). A further consideration may be the inclusion of negative affect as a covariate in the present analyses, which also may have resulted in a suppression effect that, given the significantly greater observed ω value for the AS general factor, may have disproportionately impacted the associations between the AS specific factors with the study criterion variables. Thus, while these findings suggest a central role for the AS general factor in the symptom presentations of depression, suicidality, anxious arousal, and social anxiety relative to the AS specific factors, more work is needed examining the relation of AS general and specific factors with affective symptomology within a bifactor model of the ASI-3. This work is particularly important given past work that has shown domain specificity of the AS construct across diverse methodology, including biologic challenge paradigms (Eifert et al., 1999; Zvolensky et al., 2002).
From a practical perspective, the AS general factor seems to exhibit greater reliability and validity and, therefore, greater potential clinical utility. Moreover, from a research standpoint, the present findings support past work (Ebesutani et al., 2014) that suggests the unique relations of the AS specific factors with psychopathology will be best understood when controlling the AS general factor. Examinations of the AS specific factors without employing a bifactor model of the ASI-3 to control for the AS general factor will likely lead to an inflation of the effects of the AS specific factors upon the outcomes examined.
The present findings should be interpreted in the context of the study’s limitations. The data reported were cross-sectional and cannot speak to causation, nor to measurement invariance across time. Future work utilizing a longitudinal study design is needed to examine how factor structure of the ASI-3 performs over time. While the study participants were ethnically diverse, the college sample is overly representative of young adults and women and may not generalize well to the general population. More work is needed to examine the measurement invariance properties of the ASI-3 in more age- and gender-balanced samples. Furthermore, the number of sexual minorities within the sample was low and necessitated analysis of measurement invariance across a composite demographic variable of all sexual minority identities relative to heterosexual students. Future work is needed to examine the psychometric properties of the ASI-3 across specific sexual identities. In addition, the present study did not assess whether English was a participant’s first language, which may have influenced the results of the measurement invariance testing across ethnicity. Moreover, all participants were required to speak English, such that findings may not generalize to speakers of other languages. Future work may benefit from examining measurement invariance across first-language status and across language groups. Similarly, the data were collected from a non-clinical sample, limiting generalizability of findings to a clinical population. Ideally, future work will employ both clinical and non-clinical samples to examine the ASI-3’s measurement invariance across these contexts, as has been done for the ASI (Zinbarg and Schmidt, 2002). Finally, as has been mentioned elsewhere (Ebesutani et al., 2014), interpreting findings from the bifactor model in which all factors are uncorrelated with one another is unfamiliar to many researchers and clinicians and presents challenges. This is particularly true when interpreting the unique effects of the AS general factor relative to the AS specific factors. Given the psychometric justification for the bifactor model, future work is needed examining the unique relations of the AS general and specific factors with mental health outcomes within a bifactor framework. For example, research could usefully explore whether the current model helps understand differential risk to various disorders in the various groups as a function of AS. This type of test(s), although beyond the scope of the current report, would be most useful using longitudinal methodology.
Despite these limitations, the present findings provide further support for the bifactor structure of the ASI-3, in addition to showing generally that the ASI-3 is a reliable and valid assessment tool. This study also replicated and extended past work by demonstrating the measurement invariance of the ASI-3 across not only sex (Ebesutani et al., 2014), but race/ethnicity, age, and sexual minority status. Such invariance suggests scores on the ASI-3 can be meaningfully compared across each of these identity domains by completing the same computation regardless of the group examined. Additionally, the data identified distinct facets of anxiety sensitivity, each of which demonstrated a unique pattern of relations with symptoms of depression, suicidality, anxious arousal, and social anxiety. From a clinical perspective, these findings suggest that the utility of the specific AS facets may depend upon the presenting problem/referral question, with each AS facet varying in significance for depressive versus anxiety-related problems. However, across depression and anxiety outcomes, the AS general factor may be universally important as a vulnerability factor and potential target for intervention. Future work is needed to examine the invariance properties of the ASI-3 across time and clinical versus non-clinical populations.
Footnotes
Conflicts of interest
None.
Supplementary materials
Supplementary material associated with this article can be found, in the online version, at doi:10.1016/j.psychres.2018.07.007.
References
- Allan NP, Albanese BJ, Short NA, Raines AM, Schmidt NB, 2015. Support for the general and specific bifactor model factors of anxiety sensitivity. Personality Individual Differences 74, 78–83. [Google Scholar]
- Allan NP, Capron DW, Raines AM, Schmidt NB, 2014. Unique relations among anxiety sensitivity factors and anxiety, depression, and suicidal ideation. J. Anxiety Disord. 28 (2), 266–275. 10.1016/j.janxdis.2013.12.004. [DOI] [PubMed] [Google Scholar]
- Allan NP, Oglesby ME, Uhl A, Schmidt NB, 2017. Cognitive risk factors explain the relations between neuroticism and social anxiety for males and females. Cogn. Behav. Ther 46 (3), 224–238. [DOI] [PubMed] [Google Scholar]
- Arnau RC, Broman-Fulks JJ, Green BA, Berman ME, 2009. The Anxiety Sensitivity Index—revised: confirmatory factor analyses, structural invariance in Caucasian and African American samples, and score reliability and validity. Assessment 16 (2), 165180. [DOI] [PubMed] [Google Scholar]
- Brown TA, 2015. Confirmatory Factor Analysis For Applied Research, second ed. Guilford Press, New York, NY, US. [Google Scholar]
- Capron DW, Cougle JR, Ribeiro JD, Joiner TE, Schmidt NB, 2012. An interactive model of anxiety sensitivity relevant to suicide attempt history and future suicidal ideation. J. Psychiatr. Res 46 (2), 174–180. [DOI] [PMC free article] [PubMed] [Google Scholar]
- Capron DW, Schmidt NB, 2016. Development and randomized trial evaluation of a novel computer-delivered anxiety sensitivity intervention. Behav. Res. Ther 81, 47–55. 10.1016/j.brat.2016.04.001. [DOI] [PubMed] [Google Scholar]
- Chavarria J, Allan NP, Boffa JW, Albanese BJ, Schmidt NB, Zvolensky MJ, 2015. Decomposing the relationship between anxiety sensitivity and alcohol use. J. Stud. Alcohol Drugs 76 (6), 957–961. 10.15288/jsad.2015.76.957. [DOI] [PMC free article] [PubMed] [Google Scholar]
- Chen FF, 2007. Sensitivity of goodness of fit indexes to lack of measurement invariance. Struct. Equ. Model. 14 (3), 464–504. [Google Scholar]
- Cheung GW, Rensvold RB, 2002. Evaluating goodness-of-fit indexes for testing measurement invariance. Struct. Equ. Model. 9 (2), 233–255. [Google Scholar]
- Cohen J, 1977. Statistical Power Analysis For the Behavioral sciences, Rev. ed. Hillsdale, NJ, US, Lawrence Erlbaum Associates, Inc. [Google Scholar]
- Deacon BJ, Abramowitz JS, Woods CM, Tolin DF, 2003. The Anxiety Sensitivity Index - revised: psychometric properties and factor structure in two nonclinical samples. Behav. Res. Ther 41 (12), 1427–1449. 10.1016/S00057967(03)00065-2. [DOI] [PubMed] [Google Scholar]
- Dixon LJ, Stevens EN, Viana AG, 2014. Anxiety sensitivity as a moderator of the relationship between trait anxiety and illicit substance use. Psychol. Addict. Behav 28 (4), 1284–1289. 10.1037/a0037643. [DOI] [PubMed] [Google Scholar]
- Ebesutani C, Kim M, Park H-H, 2016. The utility of the bifactor model in understanding unique components of anxiety sensitivity in a South Korean sample. Asian. J. Psychiatr 22 (Supplement C), 116–123. [DOI] [PubMed] [Google Scholar]
- Ebesutani C, McLeish AC, Luberto CM, Young J, Maack DJ, 2014. A bifactor model of anxiety sensitivity: analysis of the Anxiety Sensitivity Index-3. J. Psychopathol. Behav. Assess 36 (3), 452–464. [Google Scholar]
- Edwards MC, Houts CR, Wirth RJ, 2017. Measurement invariance, the lack thereof, and modeling change. Qual. Life Res 10.1007/s11136-017-1673-7. [DOI] [PubMed] [Google Scholar]
- Eifert GH, Zvolensky MJ, Sorrell JT, Hopko DR, Lejuez CW, 1999. Predictors of self-reported anxiety and panic symptoms: an evaluation of anxiety sensitivity, suffocation fear, heart-focused anxiety, and breath-holding duration. J. Psychopathol. Behav. Assess 21, 293–305. [Google Scholar]
- Enders CK, 2013. Analyzing structural equation models with missing data. Structural Equation Modeling: A Second Course, second ed. IAP Information Age Publishing, Charlotte, NC, US, pp. 493–519. [Google Scholar]
- Feinstein BA, Davila J, Dyar C, 2017. A weekly diary study of minority stress, coping, and internalizing symptoms among gay men. J. Consult. Clin. Psychol 85 (12), 1144–1157. 10.1037/ccp0000236. [DOI] [PMC free article] [PubMed] [Google Scholar]
- Fink E, Bodell L, Smith A, Joiner T, 2013. The joint influence of disordered eating and anxiety sensitivity on the acquired capability for suicide. Cognit. Therapy Res 37 (5), 934–940. 10.1007/s10608-012-9502-3. [DOI] [Google Scholar]
- Flora DB, Curran PJ, 2004. An empirical evaluation of alternative methods of estimation for confirmatory factor analysis with ordinal data. Psychol. Methods 9 (4), 466–491. [DOI] [PMC free article] [PubMed] [Google Scholar]
- Hu LT, Bentler PM, 1999. Cutoff criteria for fit indexes in covariance structure analysis: conventional criteria versus new alternatives. Struct. Equ. Model. 6 (1), 1–55. 10.1080/10705519909540118. [DOI] [Google Scholar]
- Hudiburgh SE, Shaw AM, Arditte Hall KA, Timpano KR, 2017. Anxiety sensitivity differentially predicts factors of interpersonal–psychological suicide risk: a consideration of specificity. Suicide Life Threat. Behav 10.1111/sltb.12421. [DOI] [PubMed] [Google Scholar]
- IBM Corp., Released 2015. IBM SPSS Statistics for Windows, Version 24.0. IBM Corp, Armonk, NY. [Google Scholar]
- Kemper CJ, Lutz J, Bähr T, Rüddel H, Hock M, 2012. Construct validity of the anxiety sensitivity index–3 in clinical samples. Assessment 19 (1), 89–100. [DOI] [PubMed] [Google Scholar]
- Kline RB, 2011. Principles and Practice of Structural Equation Modeling. third ed. Guilford Press, New York, NY, US. [Google Scholar]
- Little TD, Rhemtulla M, Gibson K, Schoemann AM, 2013. Why the items versus parcels controversy needn’t be one. Psychol. Methods 18 (3), 285–300. [DOI] [PMC free article] [PubMed] [Google Scholar]
- Marques L, Robinaugh DJ, LeBlanc NJ, Hinton D, 2011. Cross-cultural variations in the prevalence and presentation of anxiety disorders. Expert Rev. Neurother 11 (2), 313–322. 10.1586/ern.10.122. [DOI] [PubMed] [Google Scholar]
- McNally RJ, 2002. Anxiety sensitivity and panic disorder. Biol. Psychiatry 52 (10), 938946. [DOI] [PubMed] [Google Scholar]
- Meyer IH, 2003. Prejudice, social stress, and mental health in lesbian, gay, and bisexual populations: conceptual issues and research evidence. Psychol. Bull 129 (5), 674–697. 10.1037/0033-2909.129.5.674. [DOI] [PMC free article] [PubMed] [Google Scholar]
- Muthén B, du Toit SHC, Spisic D, 1997. Robust inference using weighted least squares and quadratic estimating equations in latent variable modeling with categorical and continuous outcomes. Psychometrika. [Google Scholar]
- Muthén LK, Muthén BO, 2012. Mplus User’s Guide, Seventh ed. CA Muthén & Muthén, Los Angeles. [Google Scholar]
- Naragon-Gainey K, 2010. Meta-analysis of the relations of anxiety sensitivity to the depressive and anxiety disorders. Psychol. Bull 136 (1), 128–150. [DOI] [PubMed] [Google Scholar]
- Olatunji BO, Wolitzky-Taylor KB, 2009. Anxiety sensitivity and the anxiety disorders: a meta-analytic review and synthesis. Psychol. Bull 135 (6), 974–999. [DOI] [PubMed] [Google Scholar]
- Osman A, Gutierrez PM, Smith K, Fang Q, Lozano G, Devine A, 2010. The Anxiety Sensitivity Index-3: analyses of dimensions, reliability estimates, and correlates in nonclinical samples. J. Pers. Assess 92 (1), 45–52. [DOI] [PubMed] [Google Scholar]
- Peterson RA, Reiss S, 1992. Anxiety Sensitivity Index Revised Manual. IDS Publishing, Worthington, OH. [Google Scholar]
- Plöderl M, Tremblay P, 2015. Mental health of sexual minorities. A systematic review. Int. Rev. Psychiatry 27 (5), 367–385. 10.3109/09540261.2015.1083949. [DOI] [PubMed] [Google Scholar]
- Putnick DL, Bornstein MH, 2016. Measurement invariance conventions and reporting: the state of the art and future directions for psychological research. Dev. Rev 41, 71–90. 10.1016/j.dr.2016.06.004. [DOI] [PMC free article] [PubMed] [Google Scholar]
- Raykov T, Marcoulides GA, 2011. Introduction to Psychometric Theory. Routledge/Taylor & Francis Group, New York, NY, US. [Google Scholar]
- Reise SP, 2012. The rediscovery of bifactor measurement models. Multivariate Behav. Res 47 (5), 667–696. [DOI] [PMC free article] [PubMed] [Google Scholar]
- Reise SP, Moore TM, Haviland MG, 2010. Bifactor models and rotations: exploring the extent to which multidimensional data yield univocal scale scores. J. Pers. Assess 92 (6), 544–559. [DOI] [PMC free article] [PubMed] [Google Scholar]
- Reiss S, McNally RJ, 1985. Expectancy model of fear In: Reiss S, Bootzin RR (Eds.), Theoretical Issues in Behavior Therapy. Academic Press, New York, pp. 107–121. [Google Scholar]
- Reiss S, Peterson RA, Gursky DM, McNally RJ, 1986. Anxiety sensitivity, anxiety frequency and the predictions of fearfulness. Behav. Res. Ther 24 (1), 18. [DOI] [PubMed] [Google Scholar]
- Rifkin LS, Beard C, Hsu KJ, Garner L, Björgvinsson T, 2015. Psychometric properties of the anxiety sensitivity index-3 in an acute and heterogeneous treatment sample. J. Anxiety Disord 36, 99–102. [DOI] [PubMed] [Google Scholar]
- Schmidt NB, Buckner JD, Keough ME, 2007. Anxiety sensitivity as a prospective predictor of alcohol use disorders. Behav. Modif 31 (2), 202–219. 10.1177/0145445506297019. [DOI] [PubMed] [Google Scholar]
- Schmidt NB, Joiner TE, 2002. Structure of the Anxiety Sensitivity Index psychometrics and factor structure in a community sample. J. Anxiety Disord 16 (1), 33–49. 10.1016/S0887-6185(01)00087-1. [DOI] [PubMed] [Google Scholar]
- Schmidt NB, Keough ME, Timpano KR, Richey JA, 2008. Anxiety sensitivity profile: predictive and incremental validity. J. Anxiety Disord 22 (7), 1180–1189. 10.1016/j.janxdis.2007.12.003. [DOI] [PMC free article] [PubMed] [Google Scholar]
- Taylor S, Koch WJ, McNally RJ, Crockett DJ, 1992. Conceptualizations of anxiety sensitivity. Psychol. Assess 4 (2), 245–250. 10.1037/1040-3590.4.2.245. [DOI] [Google Scholar]
- Taylor S, Zvolensky MJ, Cox BJ, Deacon B, Heimberg RG, Ledley DR, … Cardenas SJ, 2007. Robust dimensions of anxiety sensitivity: development and initial validation of the Anxiety Sensitivity Index-3. Psychol. Assess 19 (2), 176–188. 10.1037/1040-3590.19.2.176.supp (Supplemental) [DOI] [PubMed] [Google Scholar]
- Van Orden KA, Merrill KA, Joiner TJ, 2005. Interpersonal-psychological precursors to suicidal behavior: a theory of attempted and completed suicide. Curr. Psychiatry Rev 1 (2), 187–196. 10.2174/1573400054065541. [DOI] [Google Scholar]
- Vandenberg RJ, Lance CE, 2000. A review and synthesis of the measurement invariance literature: suggestions, practices, and recommendations for organizational research. Organizational Res. Methods 3 (1), 4–69. [Google Scholar]
- Watson D, Clark LA, Tellegen A, 1988. Development and validation of brief measures of positive and negative affect: the PANAS scales. J. Pers. Soc. Psychol 54 (6), 1063–1070. 10.1037/0022-3514.54.6.1063. [DOI] [PubMed] [Google Scholar]
- Watson D, O’Hara MW, Chmielewski M, McDade-Montez EA, Koffel E, Naragon K, Stuart S, 2008. Further validation of the IDAS: evidence of convergent, discriminant, criterion, and incremental validity. Psychol. Assess 20 (3), 248–259. 10.1037/a0012570. [DOI] [PubMed] [Google Scholar]
- Watson D, O’Hara MW, Simms LJ, Kotov R, Chmielewski M, McDade-Montez EA, … Stuart S, 2007. Development and validation of the Inventory of Depression and Anxiety Symptoms (IDAS). Psychol. Assess 19 (3), 253–268. 10.1037/1040-3590/19.3.253.supp (Supplemental) [DOI] [PubMed] [Google Scholar]
- Watson D, O’Hara MW, Naragon-Gainey K, Koffel E, Chmielewski M, Kotov R, … Ruggero CJ, 2012. Development and validation of new anxiety and bipolar symptom scales for an expanded version of the IDAS (the IDAS-II). Assessment 19 (4), 399–420. [DOI] [PubMed] [Google Scholar]
- Wheaton MG, Deacon BJ, McGrath PB, Berman NC, Abramowitz JS, 2012. Dimensions of anxiety sensitivity in the anxiety disorders: evaluation of the ASI-3. J. Anxiety Disord 26 (3), 401–408. [DOI] [PubMed] [Google Scholar]
- Zinbarg RE, Schmidt NB, 2002. Evaluating the invariance of the structure of anxiety sensitivity over five weeks of basic cadet training in a large sample of Air Force cadets. Pers. Individual Differences 33, 815–832. [Google Scholar]
- Zvolensky MJ, Arrindell WA, Taylor S, Bouvard M, Cox BJ, Stewart SH, … Eifert GH, 2003. Anxiety sensitivity in six countries. Behav. Res. Ther 41 (7), 841–859. 10.1016/S0005-7967(02)00187-0. [DOI] [PubMed] [Google Scholar]
- Zvolensky MJ, Bakhshaie J, Garza M, Paulus DJ, Valdivieso J, Lam H, … Vujanovic A, 2015. Anxiety sensitivity and mindful attention in terms of anxiety and depressive symptoms and disorders among Latinos in primary care. Psychiatry Res 229 (1-2), 245–251. [DOI] [PubMed] [Google Scholar]
- Zvolensky MJ, Goodie JL, Ruggiero KJ, Black AL, Larkin KT, Taylor BK, 2002. Perceived stress and anxiety sensitivity in the prediction of anxiety-related responding: a multichallenge evaluation. Anxiety Stress Coping 15, 211–229. [Google Scholar]
- Zvolensky MJ, McNeil DW, Porter CA, Stewart SH, 2001. Assessment of anxiety sensitivity in young American Indians and Alaska Natives. Behav. Res. Ther 39 (4), 477–493. 10.1016/S0005-7967(00)00010-3. [DOI] [PubMed] [Google Scholar]
- Zvolensky MJ, Vujanovic AA, Miller MOB, Bernstein A, Yartz AR, Gregor KL, … Gibson LE, 2007. Incremental validity of anxiety sensitivity in terms of motivation to quit, reasons for quitting, and barriers to quitting among community-recruited daily smokers. Nicotine Tob. Res 9 (9), 965–975. [DOI] [PubMed] [Google Scholar]