Abstract
The neocortex contains a multitude of cell types that are segregated into layers and functionally distinct areas. To investigate the diversity of cell types across the mouse neocortex, here we analysed 23,822 cells from two areas at distant poles of the mouse neocortex: the primary visual cortex and the anterior lateral motor cortex. We define 133 transcriptomic cell types by deep, single-cell RNA sequencing. Nearly all types of GABA (γ-aminobutyric acid)-containing neurons are shared across both areas, whereas most types of glutamatergic neurons were found in one of the two areas. By combining single-cell RNA sequencing and retrograde labelling, we match transcriptomic types of glutamatergic neurons to their long-range projection specificity. Our study establishes a combined transcriptomic and projectional taxonomy of cortical cell types from functionally distinct areas of the adult mouse cortex.
The neocortex coordinates most flexible and learned behaviours1,2. In mammalian evolution, the cortex underwent greater expansion in the number of cells, layers and functional areas compared to the rest of the brain, coinciding with the acquisition of increasingly sophisticated cognitive functions3. On the basis of cytoarchitectonic, neurochemical, connectional and functional studies, up to 180 distinct cortical areas have been identified in humans4 and dozens in rodents5,6. Cortical areas have laminar structure (layers (L) 1–6), and are often categorized as sensory, motor or associational, on the basis of their connections with other brain areas. Different cortical areas show qualitatively different activity patterns. Primary visual (VISp) and other sensory cortical areas process sensory information with millisecond timescale dynamics7–9. Frontal areas, such as the anterior lateral motor cortex (ALM) in mice, show slower dynamics related to short-term memory, deliberation, decision-making and planning10–12. Categorizing cortical neurons into types, and studying the roles of different types in the function of the circuit, is an essential step towards understanding how different cortical circuits produce distinct computations13,14.
Previous studies have characterized various neuronal properties to define numerous types of glutamatergic (excitatory) and GABAergic (inhibitory) neurons in the rodent cortex15–20. Reconciling the morphological, neurophysiological and molecular properties into a consensus view of cortical types remains a major challenge. We leveraged the scalability of single-cell RNA sequencing (scRNA-seq) to define cell types in two distant cortical areas. We analysed 14,249 cells from the VlSp and 9,573 cells from the ALM to define 133 transcriptomic types and establish correspondence between glutamatergic neuron projection patterns and their transcriptomic identities. In the accompanying paper21, we show that transcriptomic L5 types with different subcortical projections have distinct roles in movement planning and execution.
Overall cell type taxonomy
Building on our previous study20, we established a standardized pipeline for scRNA-seq (Extended Data Figs. 1–4). Individual cells were isolated by fluorescence-activated cell sorting (FACS) or manual picking, cDNA was generated and amplified by the SMART-Seq v4 kit, and cDNA libraries were tagemented by Nextera XT and sequenced on the Illumina HiSeq2500 platform, resulting in the detection of approximately 9,500 genes per cell (median; Extended Data Fig. 4).
We report 23,822 single-cell transcriptomes with cluster-assigned identity, validated by quality control measures (Extended Data Fig. 2b). The cells were isolated from the VISp and ALM of adult mice (96.3% at postnatal day (P) 53–59, Supplementary Table 1) of both sexes, in the congenic C57BL/6J background (Extended Data Fig. 1a). We obtained 10,752 cells from layer-enriching dissections of ALM and VISp of pan-neuronal, pan-glutamatergic or pan-GABAergic recombinase driver lines crossed to recombinase reporters (referred to as the PAN collection; Extended Data Fig. 1, Supplementary Table 2). To sample non-neuronal cells, compensate for cell survival biases, and collect rare types, we supplemented the PAN collection with 10,414 cells isolated from a variety of recombinase driver lines and reporter-negative cells, with or without layer-enriching dissections (Extended Data Fig. 1b, h, i). To investigate the correspondence between transcriptomic types and neuronal projection properties, we analysed 2,656 retrogradely labelled cells (retro-seq dataset, Fig. 1a), resulting in 2,204 cells in the annotated retro-seq dataset (Extended Data Fig. 2c).
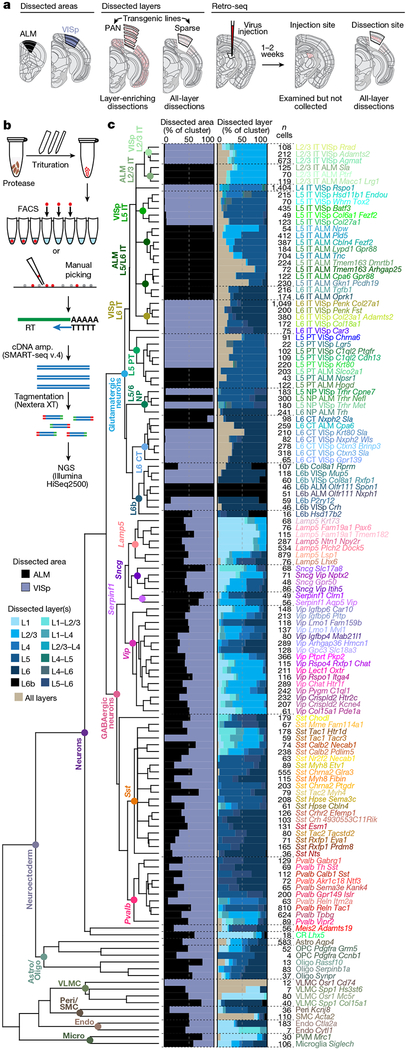
Fig. 1 |. Cell type taxonomy in ALM and VISp cortical areas.
a, Transgenically or retrogradely labelled cells and unlabelled cells were collected by layer-enriching or all-layer microdissections from the ALM or VISp. b, After dissociation, single cells were isolated by FACS or manual picking, mRNA was reverse transcribed (RT), amplified (cDNA amp.), tagmented and sequenced (next-generation sequencing, NGS). c, Clustering revealed 61 GABAergic, 56 glutamatergic, and 16 non-neuronal types organized in a taxonomy on the basis of median cluster expression for 4,020 differentially expressed genes, n = 23,822 cells and branch confidence scores > 0.4 (Extended Data Figs. 1–3). Cell classes and subclasses are labelled at branch points of the dendrogram. Bar plots represent fractions of cells dissected from the ALM and VISp, and from different layer-enriching dissections. Astro, astrocyte; CR, Cajal-Retzius cell; endo, endothelial cell; oligo, oligodendrocyte; OPC, oligodendrocyte precursor cell; peri, pericyte; PVM, perivascular macrophage; SMC, smooth muscle cell; VLMC, vascular lepotomeningeal cell; IT, intratelencephalic; PT, pyramidal tract; NP, near-projecting; CT, corticothalamic. Brain diagrams were derived from the Allen Mouse Brain Reference Atlas (version 2 (2011); downloaded from https://brain-map.org/api/index.html).
We defined 133 clusters by combining iterative, bootstrapped dimensionality reduction with clustering (Extended Data Fig. 2b). After clustering, we evaluated cluster membership to assign core versus intermediate identity to each cell: core cells (21,195 cells) are reliably classified into the original cluster (in more than 90 out of 100 trials); others are labelled intermediate20 (2,627 cells; Extended Data Fig. 2b).
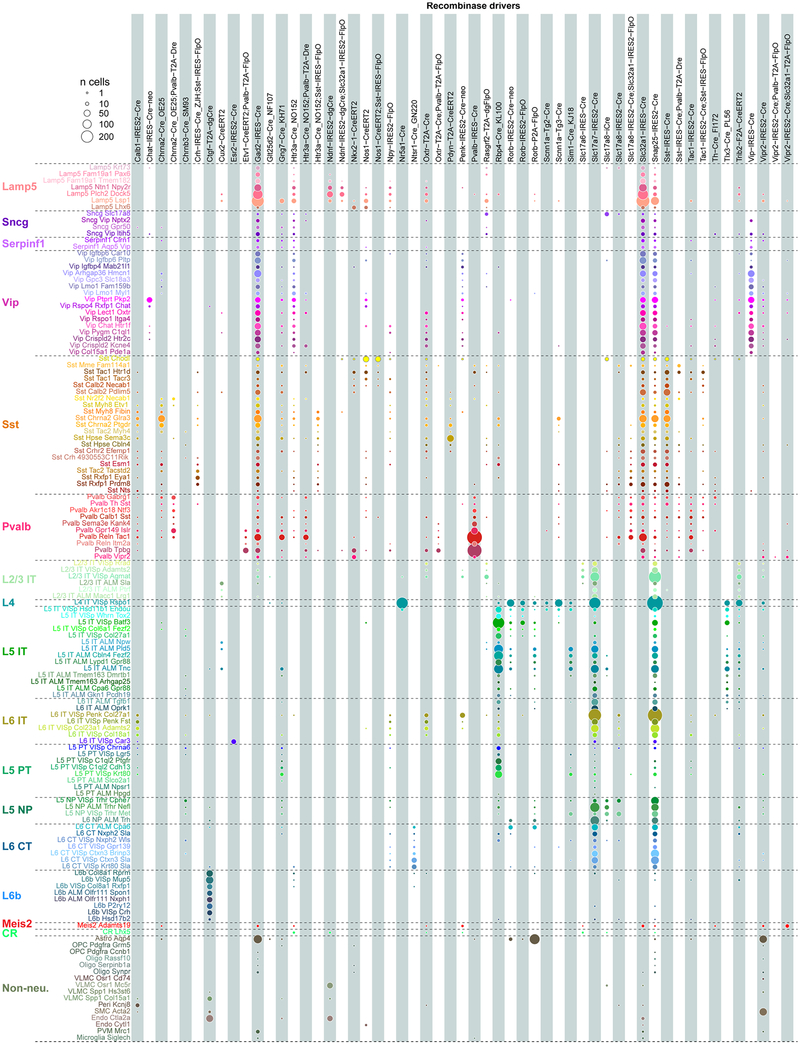
By assigning identity to each cluster based on previously reported and newly discovered differentially expressed genes (Extended Data Fig. 5), we identified 56 glutamatergic, 61 GABAergic and 16 non-neuronal types (Fig. 1). These types correspond well to the 49 types from our previous study20, with better resolution provided in the current dataset (Extended Data Fig. 6). Sub-sampling analysis shows that for most clusters, we sampled many more cells than needed to define them (Extended Data Fig. 7). The use of many transgenic lines enabled focused access to select rare types, and allowed us to define cell types labelled by each line (Extended Data Fig. 8).
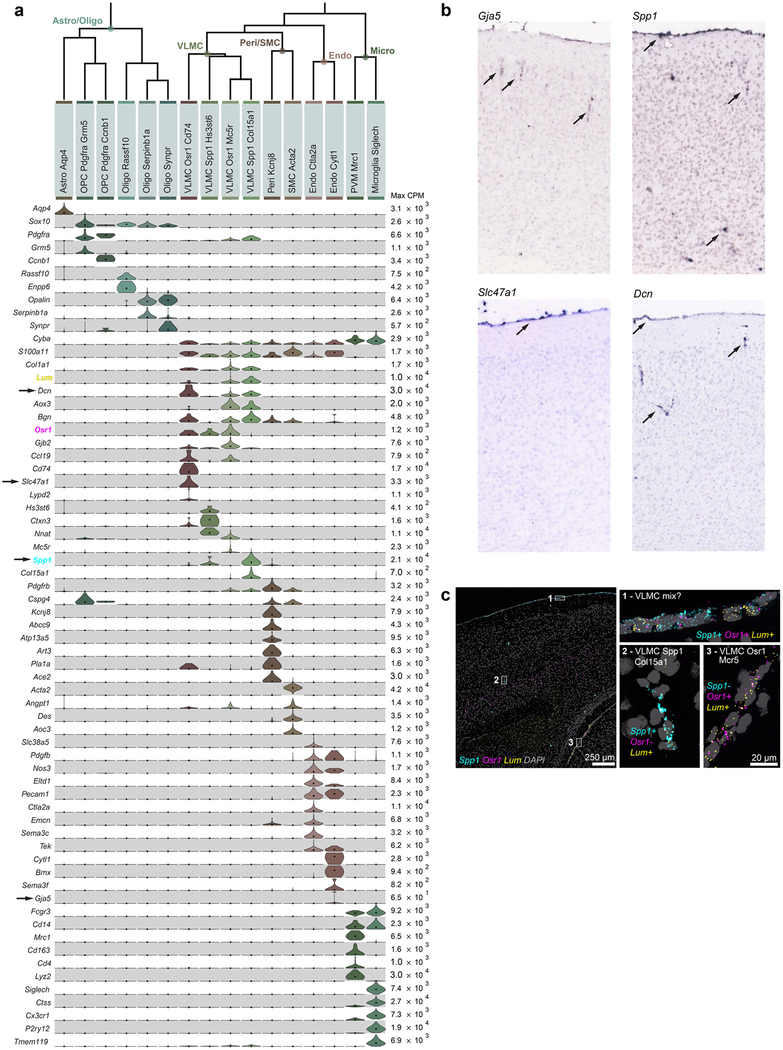
A clear hierarchy of transcriptomic cell types and their relationships emerged (Fig. 1). Consistent with previous reports19,20, the biggest differences are observed between non-neuronal (n = 1,383) and neuronal (n = 22,439) cells. We refer to major branches as classes (for example, glutamatergic class), and related groups of types as subclasses (for example, L6b subclass) (Fig. 1c). We do not assign subclass or class to isolated branches (for example, CR-Lhx5 cells). We detect all previously defined non-neuronal classes in the cortex (Extended Data Fig. 9).
Most neurons fall into two major branches corresponding to glutamatergic and GABAergic classes (Fig. 1). There are two exceptions: CR-Lhx5 and Meis2-Adamts19, two distant branches preceding the major glutamatergic and GABAergic split. On the basis of marker expression and cell source, Meis2-Adamts19 corresponds to the Meis2-expressing GABAergic neuronal type largely confined to white matter that originates from the embryonic pallial-subpallial boundary22. Among GABAergic types, this is the only type that reliably expresses the transcription factor Meis2 mRNA, and transcribes the smallest number of genes (median=4,965, Extended Data Fig. 4b). CR-Lhx5 corresponds to Cajal-Retzius (CR) cells based on their location in L1 and expression of known Cajal-Retzius markers, such as Trp73, Lhx5 and Reln23,24 (Extended Data Fig. 5). Almost all GABAergic types contain cells from both ALM and VISp (Figs. 1c, 2a) with the exception of Sst-Tac1-Tacr3 and Pvalb-Reln-Itm2a types, which are VISp-specific. By contrast, the glutamatergic types are mostly segregated by area (Figs. 1c, 2 a), with the exception of five shared types: one L6 CT type, three L6b types and the CR-Lhx5 type.
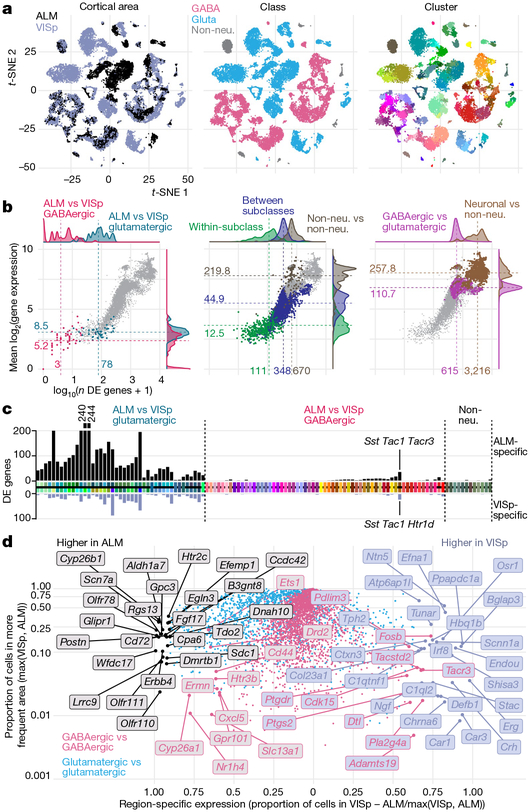
Fig. 2 |. Comparison of gene expression differences among types across cortical areas.
a, Two-dimensional t-distributed stochastic neighbour embedding (t-SNE) plots based on 4,020 differentially expressed genes for n = 23,822 cells, coloured by region, class and cluster. Most glutamatergic types are ALM- or VISp-specific. Most GABAergic types contain cells from both regions (salt-and-pepper clusters, left t-SNE). b, Number of differentially expressed (DE) genes (x axis) and mean difference in gene expression (y axis) for all 8,778 pairs of clusters. Left, comparisons between ALM and VISp portions of each GABAergic cluster (pink) and best- matched glutamatergic ALM and VISp clusters (blue). For comparison, centre and right panels show differences between: types within a subclass, types from different subclasses, non-neuronal types, types from different neuronal classes (GABA versus glutamate), and neuronal and nonneuronal types. Grey points represent all pairwise type comparisons; pink points are only in the left panel. c, Number of differentially expressed genes between best-matched ALM- and VISp-specific cell types (Extended Data Fig. 10c) or ALM and VISp portions for shared types. Cell types on the x axis are coloured as in Fig. 1; black horizontal line separates matched ALM and VISp types, but not the shared types. Black and grey bars denote the numbers of ALM- and VISp-enriched genes, respectively. d, ALM- or VISp-specific genes based on the proportion of cells in each region that express each gene, calculated separately for glutamatergic and GABAergic cells.
We performed differential gene expression tests between the best- matched ALM- and VISp-specific types (mostly glutamatergic; Extended Data Fig. 10c) and between ALM- and VISp-portions of shared types (mostly GABAergic and non-neuronal) (Fig. 2b). We find that the best-matched glutamatergic types have a median of 78 differentially expressed genes and average eightfold difference in expression (Fig. 2b, Supplementary Table 3). We find more ALM-enriched genes (Fig. 2c, d). We confirm the area-specific expression ofseveral genes by RNA in situ hybridization (ISH) from the Allen Brain Atlas25 (Extended Data Fig. 10d, e). By contrast, the GABAergic neurons from the two areas belonging to the same cluster have a median of 2 (and at most 19) differentially expressed genes, with an average 5.2-fold difference in expression (Fig. 2b, left).
Glutamatergic taxonomy by scRNA-seq and projections
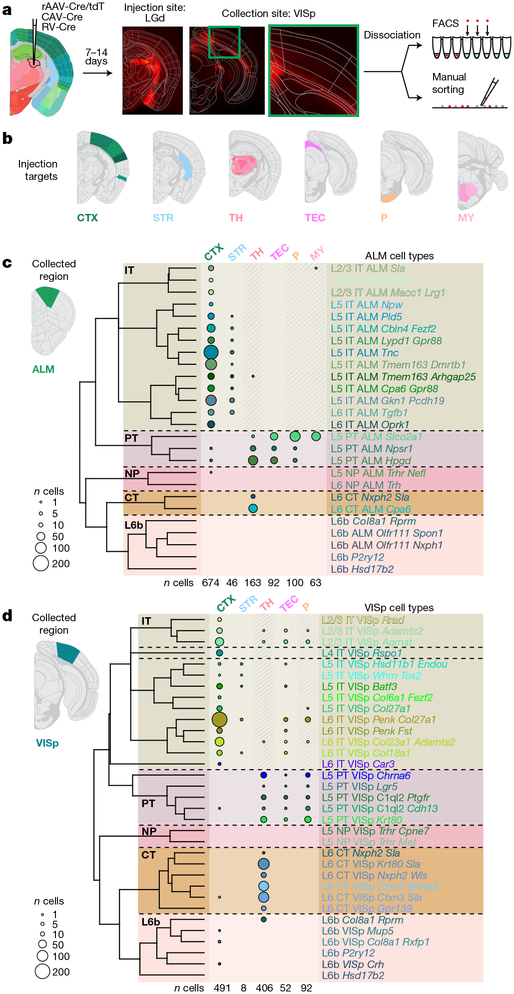
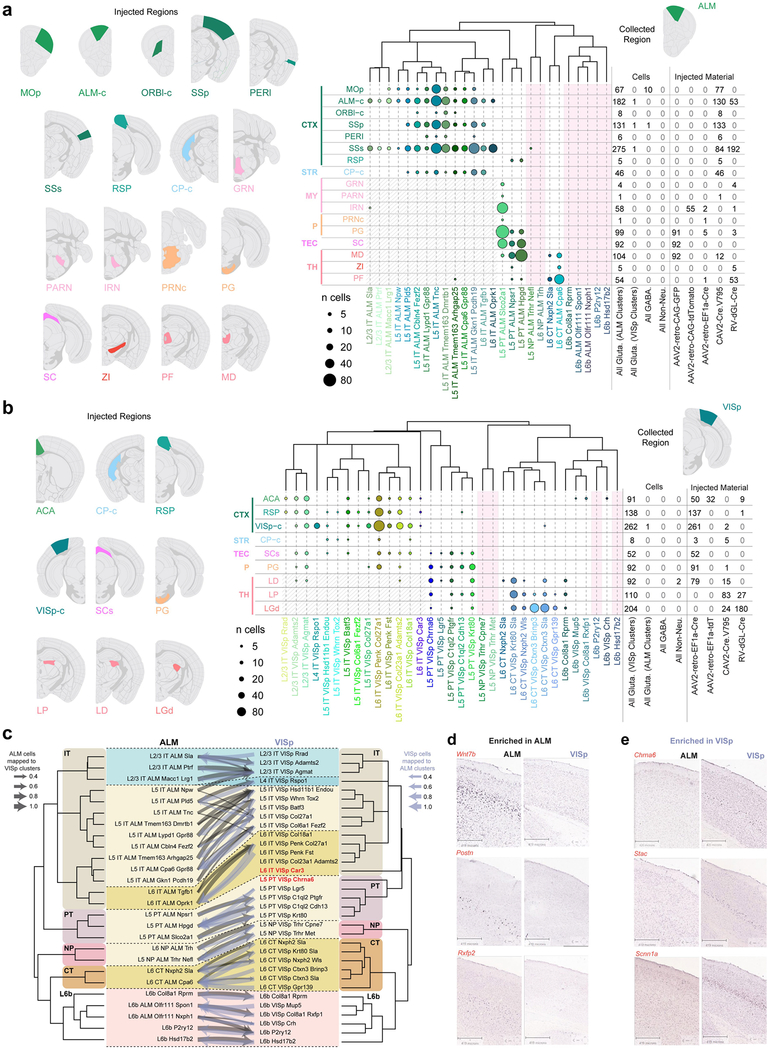
Most cortical glutamatergic neurons project outside of their resident area, and genetic markers have been correlated with projection properties15,26,27. To inform our transcriptomic taxonomy with neuronal projection properties, we analysed the transcriptomes of 2,204 cells labelled by retrograde injections (retro-seq dataset; Fig. 3a, Extended Data Fig. 2c). Projection targets (Fig. 3b, Extended Data Fig. 10) were selected based on the Allen Mouse Brain Connectivity Atlas28 and other anatomical data29. Retro-seq cells were processed through the same pipeline including clustering with all other cells.
Fig. 3 |. Glutamatergic cell types by scRNA-seq and projections.
a, Retro-seq: after virus injections and brain sectioning, injection sites were imaged to determine injection specificity. Tissue was microdissected from the collection site (ALM or VISp) and processed as shown in Fig. 1b. b, Injection targets grouped into broad regions: cortex (CTX), striatum (STR), thalamus (TH), tectum (TEC), pons (P) or medulla (MY). c, Dendrogram of glutamatergic cell types in ALM followed by numbers of cells (represented by disc area) originating from retrograde labelling from regions on top. Shaded regions denote cells labelled unintentionally, directly or retrogradely through the needle (injection) tract. d, As in c, but for VISp. Only glutamatergic cells from the annotated retro-seq dataset were included: n = 1,138 out of 1,152 annotated cells in c, and 1,049 out of 1,052 annotated cells in d. See Extended Data Fig. 10a, b for further details. Brain diagrams were derived from the Allen Mouse Brain Reference Atlas (version 2 (2011); downloaded from https://brain-map.org/api/index.html).
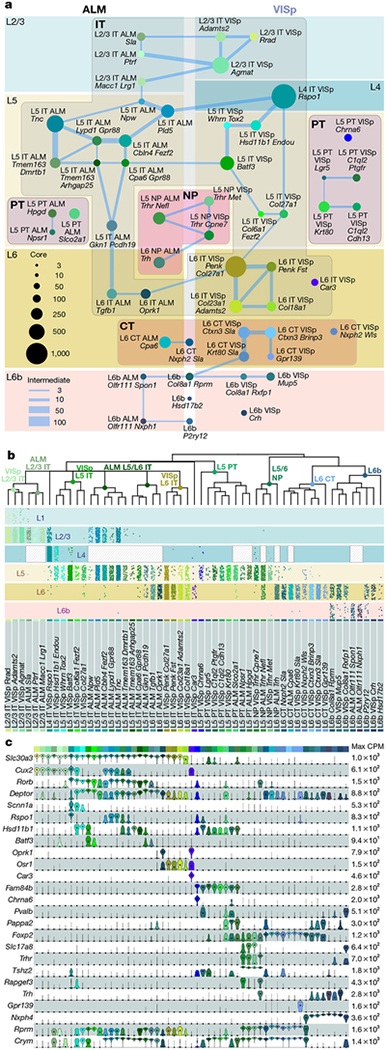
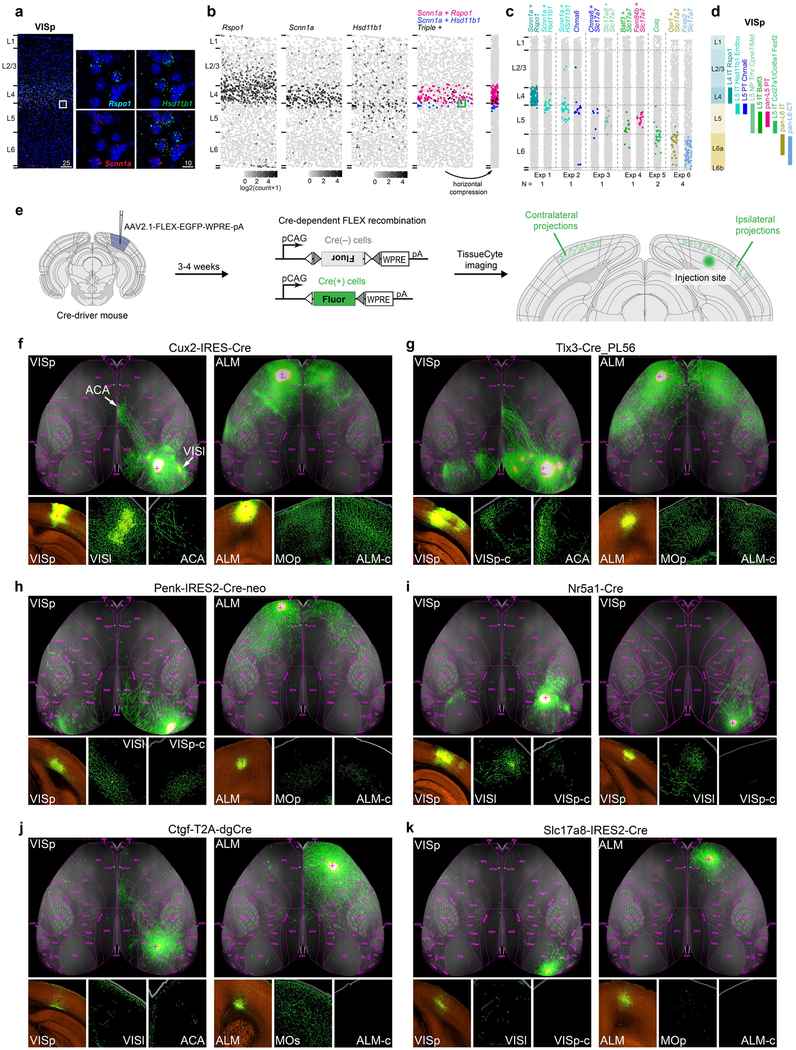
We assigned identities to glutamatergic neuron types based on their projection patterns (Fig. 3c, d), dominant layer-of-dissection (Figs. 1c, 4b), and expression of marker genes (Fig. 4c, Extended Data Fig. 5). We represent the relationships between types by a constellation diagram and a dendrogram (Fig. 4a,b). VISp and ALM contain common subclasses of projection neurons (Fig. 3c, d): intratelencephalic (IT), pyramidal tract (PT), near-projecting (NP) and corticothalamic (CT). We validated the preferential residence layer for neuronal cell bodies of select types by RNA fluorescent in situ hybridization (FISH) and neuronal projections by anterograde labelling (Extended Data Fig. 11).
Fig. 4 |. Glutamatergic cell types and markers.
a, Constellation diagram of ALM and VISp types. Disc areas represent core cell numbers for each cluster (n = 10,729), edge weights represent intermediate cell numbers (n = 1,136). L6-CT-Nxph2-Sla, L6b-Col8a1-Rprm, L6b-Hsd17b2 and L6b-P2ry12 are found in both areas. Cajal-Retzius type was omitted. b, Dendrograms correspond to glutamatergic portion of Fig. 1c. Layer distribution for each type was inferred from layer-enriching dissections (n = 8,477 out of 11,871 cells in glutamatergic clusters): each dot represents a cell positioned at random within each layer. Distributions are approximate owing to sampling strategy (Methods). c, Marker gene expression distributions within each cluster are represented by violin plots. Rows are genes, black dots are medians. Values within each row are normalized between 0 and maximum detected, displayed on a log10 scale (n = 11,827 cells).
Projection properties dominate the dendrogram structure. The IT types constitute the largest branch in both the VISp and ALM glutamatergic taxonomies (Figs. 1c, 3c, d), and span most layers. IT constellations include many intermediate cells, which connect types within a layer, between equivalent layers (for example, L2-L3 in ALM and VISp) or from neighbouring layers (Fig. 4a). We define many new markers (Fig. 4c), including a new pan-IT-type marker (Slc30a3) and a new L6-IT-type marker (Osrl). We also define a distinct IT type, L6-IT-VISp-Car3, which expresses a unique combination of markers including Car3, Oprkl and Nr2f2 (Fig. 4). Some of these genes have been previously detected in the claustrum30, and are detected in VISp L6 in the Allen Brain Atlas25. Anterograde labelling confirms these findings and refines our knowledge of cortico-cortical projections (Extended Data Fig. 11). For example, IT types preferentially target different laminae in same target areas—upper layers for L2-L3 and L5 IT types, and lower ones for L6 IT types (Extended Data Fig. 11f–h).
Pyramidal tract neurons, the descending output neurons in L5, share a separate branch in the taxonomy (Fig. 1c). They project to subcortical targets (Fig. 3c, d) and express the previously known marker Bcl626 and a new pan-pyramidal tract neuronal marker Fam84b (Fig. 4b, c). The three pyramidal tract transcriptomic types in the ALM correspond to two projection classes21: two project to the thalamus, whereas the third projects to the medulla (Extended Data Fig. 10a). The thalamus- and medulla-projecting ALM pyramidal tract neurons have distinct functions in planning and executing voluntary movements, respectively21. Similarly, it seems that pyramidal tract types from the VISp display differential subcortical projections (Extended Data Fig. 10b).
Corticothalamic (CT) L6 types (Fig. 3c, d) share the transcription factor marker Foxp2 (Fig. 4b, c), and may have cell-type-specific preferences for different thalamic nuclei (Extended Data Fig. 10b).
L6b types share many markers, such as Cplx3, Ctgf and Nxph425,31,32, but display differential projections to the thalamus or anterior cingulate (Fig. 3d). The thalamus-projecting L6b-Col8a1-Rprm type is related to the L6-CT-VISp-Krt80-Sla type (Fig. 4a), and expresses shared markers (for example, Rprm and Crym; Fig. 4c). This relationship is captured in the constellation diagram (Fig. 4a), but not in the dendrogram (Fig. 4b). Three other L6b types in the VISp project to the anterior cingulate area (Extended Data Fig. 10b). For the remaining L6b types, we observed no long-distance projections. As recently reported33, anterograde tracing in Ctgf-2A-dgcre knock-in mice (see Methods) confirms sparse long-range projections from the anterior VISp to the anterior cingulate area. In addition, it shows that L6b neurons in the VISp and ALM project to L1 within resident and neighbouring cortical areas (Extended Data Fig. 11j).
We define four related types in L5-L6 that express distinct markers including Slc17a8, Trhr, Tshz2, Sla2 and Rapgef3 (Fig. 4c). On the basis of the retro-seq dataset, they do not project to any of the assayed areas (Fig. 3c, d). Anterograde tracing of neurons labelled by a new Cre line Slc17a8-IRES2-cre, reveals only sparse projections to neighbouring areas (Extended Data Fig. 11k), earning this subclass the name ‘near projecting’. Some of these cells probably correspond to previously reported Slc17a8+ L5 cells26, as well as cells labelled by Efr3a-cre_NO10834.
GABAergic cell type taxonomy by scRNA-seq
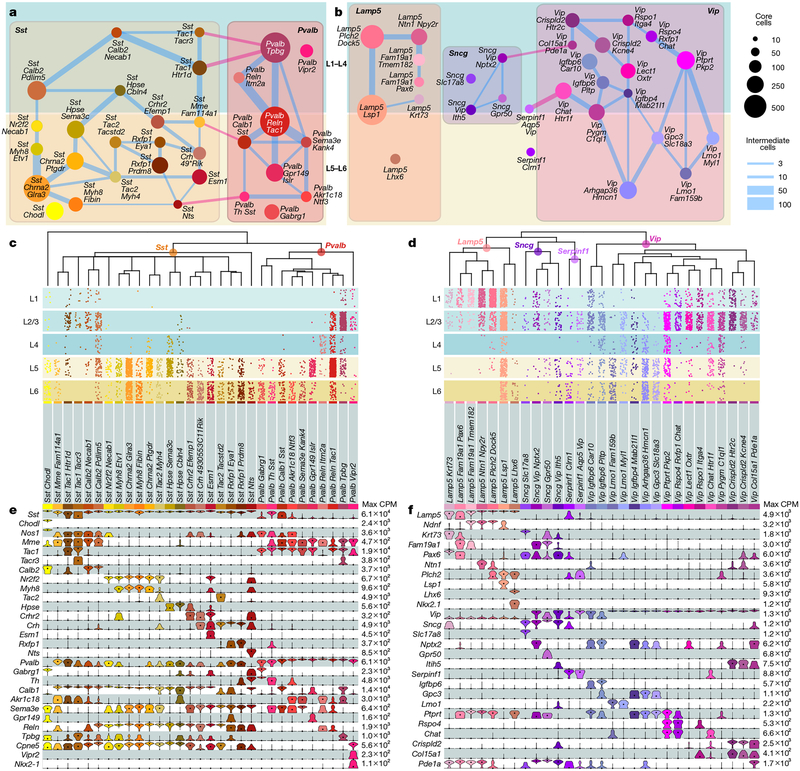
We define six subclasses of GABAergic cells: Sst, Pvalb, Vip, Lamp5, Sncg and Serpinf1, and two distinct types: Sst-Chodl and Meis2-Adamts19 (Fig. 1c). We represent the taxonomy by constellation diagrams, dendrograms, layer-of-isolation, and the expression of select marker genes (Fig. 5a–f). The major division among GABAergic types largely corresponds to their developmental origin in the medial ganglionic eminence (Pvalb and Sst subclasses) or caudal ganglionic eminence (Lamp5, Sncg, Serpinfl and Vip subclasses).
Fig. 5 |. GABAergic cell types by scRNA-seq.
a, b, Constellation diagrams for Sst and Pvalb (a) and Lamp5, Serpinfl, Sncgand Vip (b) types, as in Fig. 4a (n = 9,021 core cells; n = 1,457 intermediate cells). Edges connecting subclasses are pink. Meis2 type was omitted. c, d, Dendrograms are portions of Fig. 1c focused on the main GABAergic branch. Below the dendrograms, layer distribution for each type was inferred as in Fig. 4b; only cells from single-layer dissections were used: n = 4,675 out of 5,365 cells in c, and 3,908 out of 5,113 cells in d. Distributions are approximate owing to the sampling strategy (Methods). e, f, Marker gene expression distributions within each cluster are represented by violin plots as in Fig. 4c. n = 5,365 cells in e and 5,113 cells in f.
The Sst and Pvalb subclasses within the Sst and Pvalb constellation are connected by select upper and lower layer types (Fig. 5a, pink lines). The Lamp5, Vip, Serpinfl and Sncg subclasses are represented by four interconnected neighbourhoods in the constellation diagram (Fig. 5b). These complicated landscapes are the result of many genes expressed in a combinatorial and graded fashion (Extended Data Fig. 5), resulting in high co-clustering frequencies (Extended Data Fig. 3a) and many intermediate cells (Fig. 5a, b).
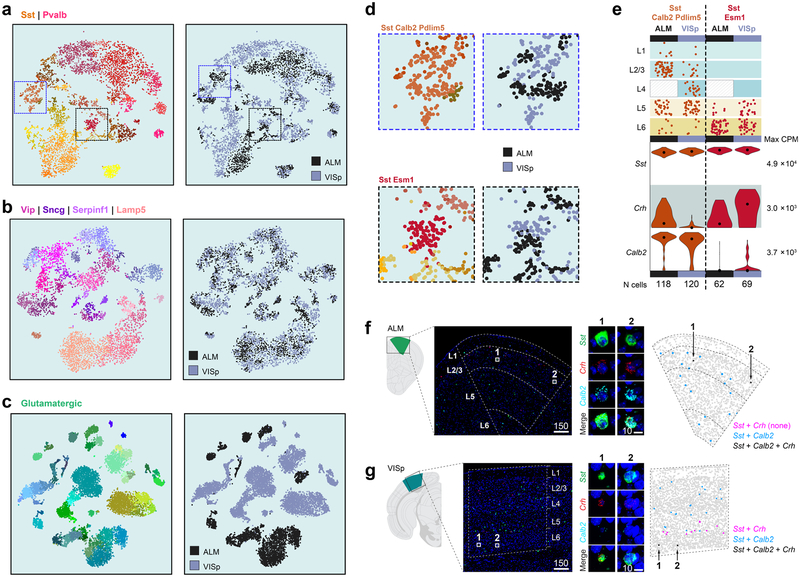
Our GABAergic transcriptomic taxonomy agrees with previously reported interneuron types based on marker gene expression, transgenic lines, published Patch-seq (patch-pipette-extracted single-cell RNA sequencing) and other scRNA-seq data (Supplementary Table 4, Extended Data Figs. 8, 12). Sst-Chodl corresponds to Nos1+ long-range projecting interneurons based on marker expression, location, Cre-line labelling, and other RNA-seq data20,35,36 (Supplementary Table 4, Extended Data Figs. 8, 12). Sst-Calb2-Pdlim5 corresponds to Sst+ and Calb2+ L2/3 Martinotti cells16,35,36 (Fig. 5e, Extended Data Fig. 12a), whereas some of the deep-layer Sst types (for example, Sst-Chrna2-Glra3) express Chrna2, a gene detected in L5 Martinotti cells37.
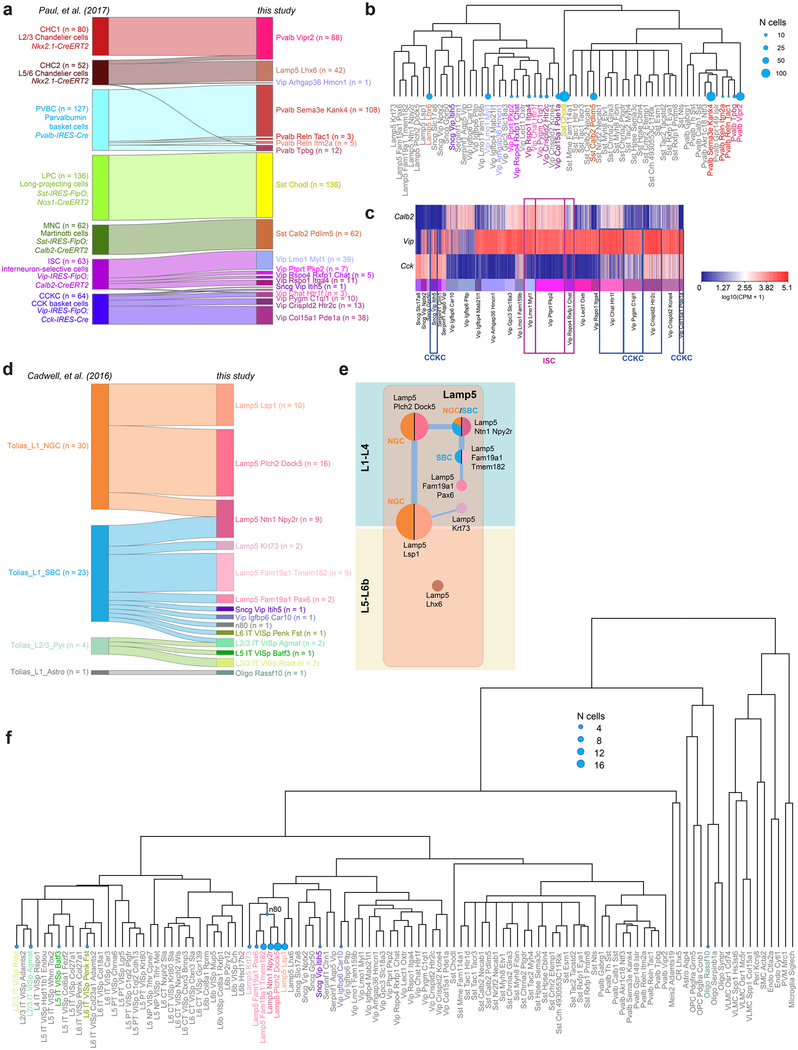
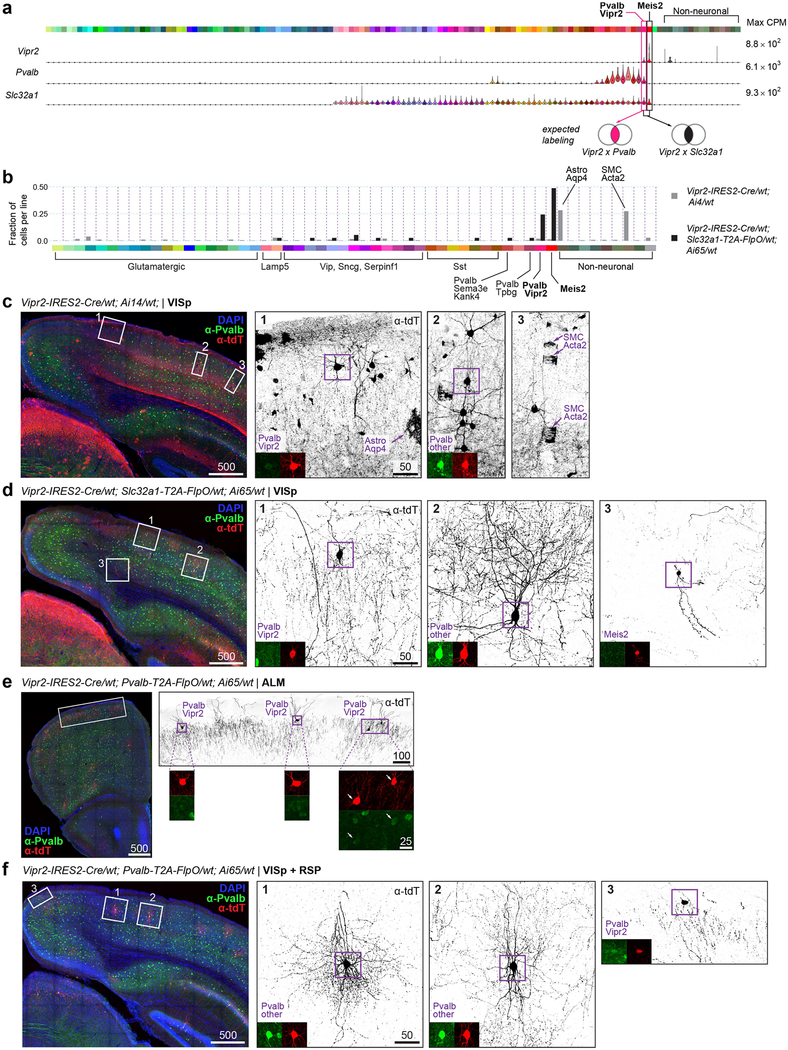
For the Pvalb subclass, we confirm that the Pvalb-Vipr2 type (Pvalb-Cpne5 in our previous study20), corresponds to chandelier cells by mapping of the recently reported chandelier cell (CHC1) RNA-seq data36 to our Pvalb-Vipr2 type (Extended Data Fig. 12a). We used the new genetic marker Vipr2 to develop Vipr2-IRES2-cre to access chandelier cells (Extended Data Figs. 8, 13a–f). Several other Pvalb types (Pvalb-Gpr149-Islr, Pvalb-Tpbg and Pvalb-Reln-Tac1) correspond to basket cells36 (Extended Data Fig. 12a, b).
Within the Lamp5, Vip, Sncg and Serpinfl subclasses, we find evidence for neurogliaform, bipolar, single bouquet and cholecystokinin (CCK) basket cell types (Supplementary Table 1). The Sncg subclass corresponds to the Vip+ and Cck+ multipolar or basket cells and is distinct from cells of the Vip subclass that are also Calb2+ and have bipolar morphologies16,35,36 (Fig. 5f, Extended Data Fig. 12a). We previously assigned neurogliaform cell identity to Ndnf types20, which correspond to several current Lamp5 types (Extended Data Fig. 6). We confirm this finding by mapping of published Patch-seq data38 to our data (Extended Data Fig. 12d–f) and find correspondence of neurogliaform cells to Lamp5-Plch2-Dock5 and Lamp5-Lsp1 types. In addition, we find that single bouquet cells map mostly to Lamp5-Fam19a1-Tmem182, and find a possible transitional single bouquet-neurogliaform cell type, Lamp5-Ntn1-Npy2r (Extended Data Fig. 12d).
The Lamp5-Lhx6 type is unusual because it clusters with other Lamp5 types, which are derived from the caudal ganglionic eminence, but expresses Nkx2.1 (also known as Nkx2–1) and Lhx6, which encode transcription factors of the medial ganglionic eminence. This type is labelled by tamoxifen induction at embryonic day (E) 18 of Nkx2.1-creERT2 mice (Extended Data Fig. 8) and was isolated previously36 from the same Cre line (Extended Data Fig. 12a–c). We find that the RNA-seq data of chandelier type 2 cells (CHC2)36 map primarily to our Lamp5-Lhx6 type (Extended Data Fig. 12a, b), which is transcriptomically most related to Lamp5 neurogliaform types.
Continuous variation and cell states
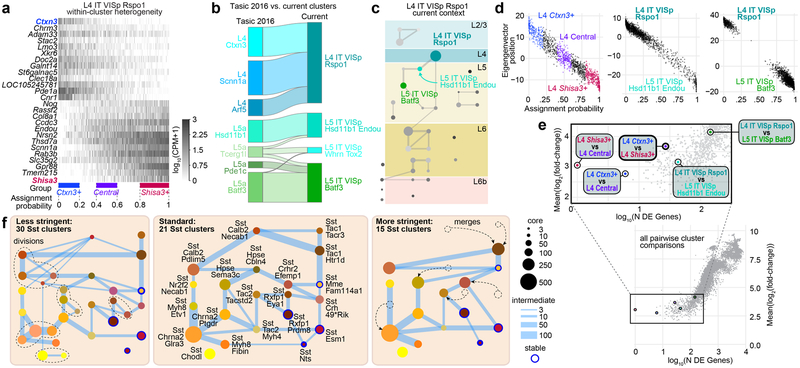
Cell classes are easily identified because they are driven by large differences in gene expression (Fig. 2b) and agree well with previous literature19,20. Gene expression differences between subclasses and types are smaller and sometimes graded (Fig. 2b), making interpretation more complicated. Constellation diagrams capture differences in gene expression among types as a combination of continuity and discreteness. However, they do not capture heterogeneity within types, which may be substantial. To illustrate this, we focus on the L4-IT-VISp-Rspo1 type, which consists of 1,404 cells and displays heterogeneity along the first principal component (Extended Data Fig. 14a–c). The extent of the heterogeneity between the ends of this type is similar to heterogeneity between this type and a neighbouring type (L4-IT-VISp-Rspo1 and L5-IT-VISp-Hsd11b1-Endou, Extended Data Fig. 14d, e). However, in this dataset, we were unable to split this cluster into subclusters using our clustering criteria. This cluster maps to three clusters connected by many intermediate cells in our previous study20 (Extended Data Fig. 14b). Therefore, the description of L4 cell heterogeneity changed from discrete with many intermediate cells20 to continuous, possibly owing to more extensive cell sampling and better gene detection. To demonstrate how clustering criteria affect the taxonomy, we performed clustering for Sst types at different stringencies. As expected, less stringent statistical criteria yield more types, and vice versa (Extended Data Fig. 14f).
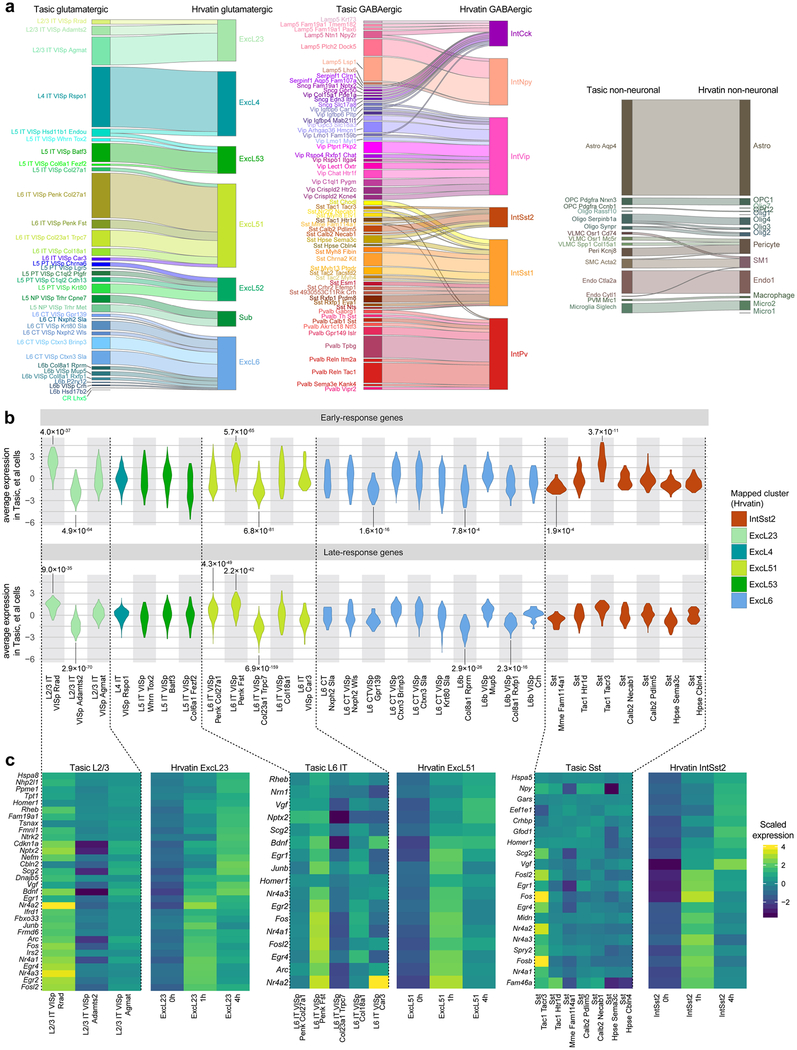
Transcriptomic profiles are also influenced by cell states, which can be defined as reversibly accessible locations a cell can occupy within a multidimensional gene expression space39. To determine whether we can detect activity-dependent changes that may be indicative of states in our cell types, we mapped our cells to VISp transcriptomic clusters from dark-reared animals, some of which were exposed to light before euthanasia40 (Extended Data Fig. 15). We find several glutamatergic and GABAergic types that display statistically significant enrichment or depletion of early- and/or late-response genes, showing that some of our types probably represent cell states. Therefore, our clustering criteria are appropriate to capture at least some cell states, whereas more stringent criteria may overlook them (Extended Data Fig. 14f; the Sst-Tac1-Tacr3 cluster merges with Sst-Tac1-Htr1d).
Discussion
We used single-cell transcriptomics to uncover the principles of cell type diversity in two functionally distinct areas of neocortex. We define 133 transcriptomic types, 101 types in the ALM and 111 in the VISp, 79 of which are shared between these areas. Most glutamatergic types are area-specific. By contrast, and as previously suggested19, non-neuronal and most GABAergic neuronal types are shared across cortical areas. Although we detect area-specific differences in gene expression within GABAergic types (Fig. 2, Extended Data Fig. 16), they are usually insufficient to define subtypes with our statistical criteria.
This dichotomy correlates with neuronal connectivity patterns and developmental origins. Most glutamatergic types in VISp or ALM project to different cortical and subcortical targets (Fig. 3, Extended Data Fig. 10), whereas nearly all GABAergic interneurons form local connections. Most glutamatergic neurons are born locally within the ventricular-subventricular zone of the developing cortex41, which is pre-patterned with developmental gradients—an embryonic protomap42,43—and further segregated into areas through differential thalamic input in development44,45. By contrast, types that are shared across areas are derived from extracortical sources, and migrate into the developing cortex: most GABAergic interneurons are from the medial ganglionic eminence or caudal ganglionic eminence16; Meis2 interneurons are from the pallial-subpallial boundary22; and Cajal-Retzius cells of the hippocampus and cortex are from the cortical hem46. It remains to be investigated whether some of the shared L6b types may originate from the rostro-medial telencephalic wall, a known source for a subset of subplate neurons that are distinct from those generated within the local ventricular-subventricular zone47, or whether further sampling may segregate them into area-specific types. Although our taxonomy mostly agrees with the developmental origins of the cells, there are exceptions. For example, tamoxifen induction of Nkx2.1-creERT2 mice at E18 labels not only chandelier cells, but also a suggested second chandelier type, CHC236. Our taxonomy suggests that CHC2 may be a neurogliaform type (Lamp5-Lxh6) that arises from the medial ganglionic eminence, and that neurogliaform types could arise through different developmental pathways and embryonic sources in an example of developmental convergence.
We observe both discrete and continuous gene expression variation among and within types. To accommodate both kinds of variation, we used post-clustering classifiers to construct constellation diagrams, and were able to capture cell states. Alternative analyses of these landscapes lead to more cluster splits (more discreteness) or merges (more continuous variation) (Extended Data Fig. 14f). The detected and described (versus actual) discreteness in the definition of cell types depend on gene detection, cell sampling, and noise estimates or statistical criteria39 (Extended Data Fig. 14b, f). Future experimental datasets would benefit from multimodal data acquisition, more efficient mRNA detection, and sampling cells according to their abundance in situ48 and in different states40. Our dataset provides a foundation for understanding the diversity of cortical cell types and dissecting circuit function. As an example, in the accompanying paper21, we show that ALM L5 pyramidal tract neurons map to transcriptomic clusters with distinct projection patterns that have different roles in the preparation and execution of movement.
METHODS
Mouse breeding and husbandry.
All procedures were carried out in accordance with Institutional Animal Care and Use Committee protocols 1508, 1510 and 1511 at the Allen Institute for Brain Science and Janelia Research Campus. Animals were provided food and water ad libitum and were maintained on a regular 12-h day/night cycle at no more than five adult animals per cage. Animals were maintained on the C57BL/6J background, and newly received or generated transgenic lines were backcrossed to C57BL/6J. Experimental animals were heterozygous for the recombinase transgenes and the reporter transgenes. Transgenic lines used in this study are summarized in Supplementary Table 5. Standard tamoxifen treatment for CreER lines included a single dose of tamoxifen (40 μl of 50 mg ml−1) dissolved in corn oil and administered via oral gavage at P10–14. Tamoxifen treatment for Nkx2.1-creERT2;Ai14 was performed at E17 (oral gavage of the dam at 1 mg per 10 g of body weight), pups were delivered by caesarean section at E19 and then fostered. Cux2-creERT2;Ai14 mice received tamoxifen treatment daily, for five consecutive days, between P30 and P40. Trimethoprim was administered to animals containing Ctgf-2A-dgcre by oral gavage daily, for three consecutive days, between P35 and P45 (0.015 ml per g of body weight using 20 mg ml−1 trimethoprim solution). Ndnf-IRES2-dgcre animals did not receive trimethoprim induction, because the baseline dgCre activity (without trimethoprim) was sufficient to label the cells with the Ai14 reporter20. The transgenic component dgcre encodes a destabilized Cre protein: it contains a destabilizing domain ‘d’, which is stabilized by trimethoprim, and a non-fluorescent portion of eGFP ‘g’. We excluded any animals with anophthalmia or microphthalmia. We used 352 animals to collect the set of 24,411 cells for clustering (Supplementary Table 1). Animals were euthanized at P53-P59 (n = 339), P51 (n = 1), and P63-P91 (n = 12). No statistical methods were used to predetermine sample size.
Generation of transgenic mice (Penk-IRES2-cre-neo, Slc17a8-IRES2-cre and Vipr2-IRES2-cre).
Vectors containing gene-specific homology arms and IRES2-cre-bGHpoly(A)-PGK-gb2-neo-PGKpoly(A) components were generated using gene synthesis (GenScript) and standard molecular cloning techniques. Targeting of the transgene cassette into the endogenous gene locus immediately downstream of the stop codon was accomplished by CRISPR-Cas9-mediated genome editing using circularized targeting vector in combination with a gene-specific guide vector (Addgene, plasmid 42230)49. The 129S6/B6 F1 embryonic stem (ES) cell line, G450, was used to generate all modified ES cells. Correctly targeted clones were identified using standard screening approaches (PCR, qPCR and Southern blots) and injected into blastocysts to obtain chimaeras and subsequent germline transmission. Resulting mice were crossed to the Rosa26-PhiC31o mice (JAX, 007743)51 to delete the PGK-neo selection cassette, and then backcrossed to C57BL/6J mice and maintained in the C57BL/6J background. The PGK-neo cassette could not be removed from Penk-IRES2-cre-neo by the PhiC31o integrase-mediated recombination.
Retrograde labelling.
We injected rAAV2-retro-EF1a-Cre52, RVΔGL-Cre53, or CAV2-Cre (gift from M. Chillon Rodrigues)54 into brains of heterozygous or homozygous Ai14 mice as previously described20. For ALM experiments, we also injected rAAV2-retro-CAG-GFP or rAAV2-retro-CAG-tdTomato52 into wildtype mice. Stereotaxic coordinates were obtained from Paxinos adult mouse brain atlas55(Supplementary Table 6). For two VISp experiments, we injected into the superior colliculus sensory-related area by inserting the needle through the cerebellum at a 45° angle in the posterior to anterior direction. TdT+ or GFP+ single cells were isolated from VISp or ALM, depending on the injection area. Detailed information on used viruses is available in Supplementary Table 7.
Anterograde labelling.
For anterograde projection mapping, we injected AAV2/1-pCAG-FLEX-eGFP-WPRE-pA28 into VISp or ALM of 8–12-week-old mice. Stereotaxic injection procedure was the same as for retrograde labelling above. In Ctgf-2A-dgcre mice, one week after AAV injection, trimethoprim induction was conducted for 3 consecutive days as described previously20. Mice were euthanized and brains perfused after 21 days (or 28 days in the case of Ctgf-2A-dgcre) after AAV injection, and brains were imaged using TissueCyte 1000 system as described previously28. Experiments can be viewed interactively on the Allen Institute data portal at http://connectivity.brain-map.org/.
Single-cell isolation.
We isolated single cells as previously described20,56,57 with modifications below. We usually used layer-enriching dissections, with focus on a single layer. Broader dissections (no layer enrichment or multiple layers combined) were used for lines that label small numbers of cells, to facilitate isolation of sufficient number of cells. We updated our artificial cerebrospinal fluid (ACSF) formulation compared to our previous study20 to include N-methyl-D-glucamine (NMDG) to improve neuronal survival58. Our ACSF consisted of CaCl2 (0.5 mM), glucose (25 mM), HCl (96 mM), HEPES (20 mM), MgSO4 (10 mM), NaH2PO4 (1.25 mM), myo-inositol (3 mM), N-acetylcysteine (12 mM), NMDG (96 mM), KCl (2.5 mM), NaHCO3 (25 mM), sodium L-ascorbate (5 mM), sodium pyruvate (3 mM), taurine (0.01 mM), thiourea (2 mM), and was bubbled with carbogen gas (95% O2 and 5% CO2). For samples collected after 16 December 2016, the ACSF formulation also included trehalose (13.2 mM). Mice were anaesthetized with isoflurane and perfused with cold carbogen-bubbled ACSF. The brain was dissected, submerged in ACSF, embedded in 2% agarose, and sliced into 250-μm coronal sections on a compresstome (Precisionary). Enzymatic digestion, trituration into single cell suspension, and FACS analysis of single cells were carried out as previously described20, with example sorting strategy shown in Extended Data Fig. 1e–g. Cells were sorted into 8-well strips containing lysis buffer from the SMART-Seq v4 kit (see below) with RNase inhibitor (0.17 U μl−1), immediately frozen on dry ice, and stored at −80 °C.
Note that the overall relative proportions of cell types in our dataset are not representative of those in the intact brain because of the targeted sampling approach using various Cre lines and possible cell type-specific differences in survival during the isolation procedure.
cDNA amplification and library construction.
We used the SMART-Seq v4 Ultra Low Input RNA Kit for Sequencing (Takara, 634894) to reverse transcribe poly(A) RNA and amplify full-length cDNA according to the manufacturer’s instructions. We performed reverse transcription and cDNA amplification for 18 PCR cycles in 8-well strips, in sets of 12–24 strips at a time. A small set of non-neuronal cell samples was amplified by 21 PCR cycles instead of 18 (Supplementary Table 10). At least 1 control strip was used per amplification set, which contained 4 wells without cells and 4 wells with 10 pg control RNA. Control RNA was either Mouse Whole Brain Total RNA (Zyagen, MR-201) or control RNA provided in the SMART-Seq v4 kit. All samples proceeded through Nextera XT DNA Library Preparation (Illumina FC-131–1096) using Nextera XT Index Kit V2 Set A (FC-131–2001). Nextera XT DNA Library prep was performed according to manufacturer’s instructions except that the volumes of all reagents including cDNA input were decreased to 0.4× or 0.5× by volume. The replacement of Clontech’s SMARTer v.159, which we used in our previous study20, with SMART-Seq v.4 kit, which is based on Smart-seq260, increases the efficiency of gene detection. This allowed us to reduce the median sequencing depth from approximately 8.7 million to 2.5 million reads per cell while still detecting 9,500 genes per cell (median) compared to 7,800 previously (Extended Data Fig. 2b). Subsampling of the reads to a median of 0.5 million per cell results in similar gene detection per cell (>89% of genes detected, data not shown), showing that we detect most of the genes at 2.5 million reads per cell. Details are available in ‘Documentation’ on the Allen Institute data portal at: http://celltypes.brain-map.org/.
Sequencing data processing and quality control.
Fifty-base-pair paired-end reads were aligned to GRCm38 (mm10) using a RefSeq annotation gff file retrieved from NCBI on 18 January 2016 (https://www.ncbi.nlm.nih.gov/genome/anno-tation_euk/all/). Sequence alignment was performed using STAR v2.5.361 in twopassMode. PCR duplicates were masked and removed using STAR option ‘bamRemoveDuplicates’ Only uniquely aligned reads were used for gene quantification. Gene counts were computed using the R GenomicAlignments package62 sumarizeOverlaps function using ‘IntersectionNotEmpty mode for exonic and intronic regions separately. In this study, we only used exonic regions for gene quantification. Cells that met any one of the following criteria were removed: <100,000 total reads, <1,000 detected genes (counts per million > 0), < 75% of reads aligned to genome, or CG dinucleotide odds ratio > 0.5. Doublets were removed by first classifying cells into broad classes of glutamatergic, GABAergic, and non-neuronal based on known markers. For each class, we selected a set of highly specific genes that are only present in this class compared to all other classes, and computed the eigengene (the first principle component based on the given gene set), normalized within the 0–1 range. Each cell was assigned to the class with the maximum eigengene. For each class, we computed the mean and standard deviation of the corresponding eigengene for cells outside this class. Any cell in which the eigengene was more than three standard deviations above the mean for the cells outside the class was assigned to be members of that class. On the basis of this criterion, cells that belong to more than one class were defined as doublets.
Mapping reads to synthetic constructs.
We mapped all non-genome-mapped reads to sequences in Supplementary Table 8. To avoid ambiguous counting due to stretches of sequence identity, we designated unique regions within these sequences to count mRNAs of interest. We counted only reads for which at least one of the paired ends had an overlap with the unique regions of at least 10 bp.
Clustering.
Cells that passed quality control criteria were clustered using an in-house developed iterative clustering R package hicat available via Github (https://github.com/AllenInstitute/hicat). It was described partially in previous studies20,63, and was modified to improve robustness and adapt to large numbers of cells. In brief, all quality control qualified cells were grouped into very broad categories using known markers, then clustered using high variance gene selection, dimensionality reduction, dimension filtering, and Jaccard-Louvain or hierarchical (Ward) clustering. This process was repeated within each resulting cluster until no more child clusters met differential gene expression or cluster size termination criteria. The entire clustering procedure was repeated 100 times using 80% of all cells sampled at random, and the frequency with which cells co-cluster was used to generate a final set of clusters, again subject to differential gene expression and cluster size termination criteria. A workflow diagram for this approach is presented in Extended Data Fig. 2. The key strength of this approach is its ability to provide high-resolution cell type categorization that withstands rigorous statistical tests to ensure reproducibility and biological relevance of the results. Below, we provide more details for the analysis carried out at each iteration of clustering:
1. Selection of high-variance genes.
We first removed predicted gene models (gene names that start with Gm), genes from the mitochondrial chromosome, ribosomal genes, sex-specific genes, as well as genes that were detected in fewer than four cells. To choose high variance genes, we used gene counts from each cell to fit a Loess regression curve between average scaled gene counts and dispersion (variance divided by mean). The regression residuals were then fit to a normal distribution based on 25% and 75% quantiles to calculate P values and adjusted P values (using Holm’s method), representing the probability that each gene had higher than expected variance. Genes were ranked by adjusted P value.
2. Dimensionality reduction.
We implemented two methods: principal component analysis (PCA) and weighted gene co-expression network analysis (WGCNA). In the PCA mode, top high variance genes with adjusted P < 0.5 were used to compute principal components. The proportion of variance for all principal components was converted to z-scores, and principal components with z-scores >2 were selected for clustering. In the WGCNA mode, the 4,000 genes with the most significant P values were used as input for W GCNA to identify gene modules. Here, we used a more relaxed criterion than in the PCA mode to allow more genes to be included for gene module detection. To determine the discriminative power of each module, we used the genes in each module to divide the cells into two clusters using Jaccard-Louvain clustering64 (for more than 4,000 cells) or a combination of k-means and Ward’s hierarchical clustering (for <4,000 cells). After dividing the cells into two clusters, we computed differential gene expression between the two clusters (see ‘Defining differentially expressed genes’ section). We then computed the differential expression score (deScore), defined as the sum of - log10 (adjusted P value) of all differentially expressed genes. For deScore calculations, the maximum value each gene was allowed to contribute was 20. Only modules with deScore greater than 150 were selected for use in downstream analysis, and module eigengenes were computed for selected modules as reduced dimensions. Up to 20 top reduced dimensions were selected for both methods. The two dimensionality reduction approaches are complementary: WGCNA detects rare clusters well, segregates well biological and technical variation, and provides cleaner cluster boundaries; PCA is more scalable to large datasets and captures combinatorial marker expression patterns better than WGCNA.
3. Dimension filtering.
We have identified systematic technical variation that affects expression of hundreds of genes that we believe is primarily driven by the quality of the single cell cDNA library. The first principal component of these genes is highly correlated with the log-transform of the number of genes detected in each cell, so we define the latter as the quality control eigen. We have also identified a list of genes that contribute to the batch effect for the first set of experiments for this study with subtle protocol differences. We computed batch eigen as the first principal component based on these batch specific genes. We removed any principal components or module eigengenes that have correlation greater than 0.7 with either the quality control eigen or the batch eigen.
4. Initial clustering.
For clustering, we applied either the Jaccard-Louvain method64 using the Rphenograph package (for >4,000 cells), or Ward’s method (for ≤4,000 cells). Although the Louvain algorithm scales well with large datasets, it has been shown to have a resolution limit65, and small clusters tend to be missed. Therefore, as a complementary approach, we applied Ward’s minimum variance method for hierarchical clustering when fewer than 4,000 cells were to be clustered. The initial number of clusters was set at twice the number of reduced dimensions from step 3.
5. Cluster merging.
To make sure the resulting clusters all have distinguishable transcriptomic signatures, we defined differentially expressed genes between every cluster and their two nearest neighbours in the reduced dimension space (using Euclidean distance if there were 1 or 2 dimensions, or 1 minus Pearson correlation for more dimensions). A pair of clusters was considered separable if the deScore (described in step 2) for all differentially expressed genes was greater than 150. If a cluster did not pass this criterion, it was merged with the nearest neighbour cluster, and differentially expressed gene scores were recomputed using the merged clusters. Clusters with fewer than four cells were also merged with their nearest neighbours. This iterative merging process was repeated until all remaining clusters were separable and contained at least 4 cells.
Steps 1–5 were repeated for each resulting cluster until no further partitions were found.
6. Defining consensus clusters.
To determine the robustness of the clustering results, the entire clustering procedure was repeated 100 times using 80% of all cells sampled at random in both the PCA and WGCNA modes. We then generated the frequency matrix for co-clustering of every pair of cells in both modes. The final cell-cell co-clustering matrix was defined as the element-by-element minimum of these two matrices, which implies that if two cells belong to the same cluster by one method, but to different clusters by another method, then their co-clustering probability is considered low and they should be separated into different clusters. We inferred the consensus clusters by iteratively splitting the co-clustering matrix. In any given step, we used the co-clustering matrix as the similarity matrix and performed clustering by either the Louvain (≥4000 cells) or Ward’s algorithm (<4,000 cells). We defined Nk,l as the average probabilities of cells within cluster k to co-cluster with cells within cluster l. We merged clusters k, l if Nk,l > max(Nk,k, Nl,l) - 0.25. We merged remaining clusters based on differentially expressed genes as described in step 5 using a deScore threshold of 150.
7. Cluster refinement.
For each cell i, we computed the average probability that it co-clustered with cells in each cluster k as Mi,k, and we reassigned every cell i to the cluster k with maximum Mi,k. We repeated this process until convergence.
8. Exclusion of outlier clusters.
After defining consensus clusters, we examined our clustering results to identify outlier clusters that are likely to be due to technical artefacts. These clusters fall into three categories: clusters of doublets, clusters of low-quality cells, and clusters driven by batch effects. A cluster was defined as a doublet cluster if it had signatures from two distinctive cell subclasses, for example, smooth muscle cells and neurons. Low-quality clusters were defined as clusters with significantly lower gene counts compared to the nearest cluster in taxonomy, and with few or no significantly enriched genes. We also identified two clusters that contain only retrogradely labelled cells. These two clusters are very similar to two other distinctive clusters, but contain shared additional signatures that we suspect were due to technical variation in retrograde experiments, so they were annotated as outlier clusters.
Constructing the cell type taxonomy tree.
To build the cell type tree, we computed up to top 50 differentially expressed genes in both directions for every pair of clusters, and assembled unique entrees into a marker list of 4,020 genes. We calculated median expression of these marker genes per cluster as cluster centroid, and applied hierarchical clustering with average linkage on the correlation matrix of cluster centroids to infer the cell type taxonomy tree. The confidence for each branch of the tree was estimated by the bootstrap resampling approach from the R package pvclust v.2.0. A comparison between the uncollapsed dendrogram and collapsing at >0.4 is presented in Extended Data Fig. 3. For display in figures, we collapsed the dendrogram to branches with a confidence score >0.4.
Assigning core and intermediate cells.
In our previous study, post-clustering, we applied a random forest classifier to test our cluster assignments, and to define core and intermediate cells20. We found that random forest classification penalized small clusters, so we used a nearest-centroid classifier, which assigns a cell to the cluster whose centroid is the closest (with the highest correlation) to the cell. Here, the cluster centroid is defined as the median expression of 4,020 differentially expressed genes. To define core versus intermediate cells, we performed fivefold cross-validation 100 times: in each round, the cells were randomly partitioned into five groups, and cells in each group of 20% of the cells were classified by a nearest-centroid classifier trained using the other 80% of the cells. A cell classified to the same cluster more than 90 times was defined as a core cell, the others were designated intermediate cells. We define 21,195 core cells and 2,627 intermediate cells, which, in most cases, classify to only two clusters, one of which is the original cluster (2,492 out of 2,627; 94.9%).
Assigning cluster names.
The marker genes included in cluster names were selected to be unique either individually or as a combination within our universe of cell types. We considered differentially expressed genes (see ‘Defining differentially expressed genes’ section below) at different levels of taxonomy: globally specific, within-class specific, within-subclass specific, and specific compared to the nearest sibling cluster. We also evaluated marker genes for the completeness of expression within the cluster that would be named after that gene. From this list of markers, we visually inspected marker specificity by examining gene expression at the single-cell level in clusters of interest. Many genes satisfied criteria of good marker genes, and therefore many alternatives for cluster naming exist. We gave preferences to globally unique genes (for example, Chodl, included in the Sst-Chodl cluster name) and markers that are expressed in all or a large proportion of cells within the cluster. For example, Lamp5-Lxh6, could also be called Lamp5-Nkx2.1. We chose Lxh6 as it is expressed in every cell of this cluster whereas Nkx2.1 is not, although Nkx2.1 is expressed in a smaller number of cell types overall.
Defining differentially expressed genes.
Differentially expressed genes were detected using the R package limma v.3.30.1366 using log2(CPM + 1) of expression values. We did not perform any tests of normality before performing differentially expressed gene tests. Differentially expressed genes were defined as genes with a more than twofold change and adjusted P < 0.01. We also required these genes to have a relatively bimodal expression pattern, expressed predominately in one cluster relative to the other. To do that, we computed Pi,j as the fraction of cells in cluster j expressing gene i with CPM ≥ 1, and required upregulated genes i in cluster c1 relative to c2 to have Pi,c1 > q1.th (q1.th = 0.5), and (Pi,c1 – Pi,c2)/max((Pi,c1, Pi,c2) > q.diff.th (q.diff.th = 0.7). We define the deScore as the sum of the - log10(adjusted P value) of all differentially expressed genes. For deScore calculations, the maximum value each gene was allowed to contribute was 20. The deScores used for Extended Data Fig. 14f are: 80, low stringency; 150, standard; and 300, high stringency.
Retro-seq quality control and analysis.
All retrogradely labelled cells were subjected to the same experimental and data processing, quality control, and clustering with all other quality control-qualified single-cell transcriptomes. Clustering was performed blinded to the experimental source of retrogradely labelled cells. After clustering, we performed an additional quality control step, in which we examined the dissection images and annotated the injection sites for specificity. We excluded single cell samples derived from incorrectly targeted injections or injections which displayed significant labelling through needle tract to define the ‘annotated retro-seq dataset’ (Extended Data Fig. 2e). Figure 3 and Extended Data Fig. 10 were generated based on this dataset.
Correspondence between VISp and ALM glutamatergic clusters.
To establish correspondence in both directions, we classified VISp glutamatergic cells using ALM glutamatergic clusters as training data, and vice versa. In both cases, we trained the nearest centroid classifier based on common set of glutamatergic markers (pool of top 50 differentially expressed genes in each direction between glutamatergic clusters within VISp or within ALM) shared by both regions, and calculated the fraction of cells in each VISp clusters that mapped to each of the ALM clusters, and vice versa. For each cell, we computed the correlation score of the best mapping cluster, and transformed the correlation scores into z-scores. If the average z-score of cells from one cluster mapped to another cluster in the other region was below −1.64 (roughly 5% confidence interval), this cluster was considered to be unique to one region, with no corresponding cluster in the other region. For Fig. 2c, we used matched types as described in the paragraph above, or split each type into its ALM and VISp portions. Differentially expressed genes were calculated for all pairwise comparisons between type-specific and region-specific portions within glutamatergic samples and GABAergic samples. For each gene, two measures were calculated: a ratio of proportions (proportion of cells in ALM - proportion in VISp divided by whichever is higher, x axis) and the proportion of cells in whichever region has a greater proportion of cells expressing each gene (y axis). Proportions were computed separately for glutamatergic and GABAergic cells.
Assessing correspondence to the Paul et al. (2017)36 dataset.
We mapped cells from Gene Expression Omnibus (GEO) accession GSE9252236 to our GABAergic clusters using the nearest centroid classifier based on a set of shared GABAergic markers that were detected in both datasets (expression >0). To estimate the robustness of mapping, we repeated classification 100 times, each time using 80% of randomly sampled markers, and computed the probabilities for every cell to map to every reference cluster.
Assessing correspondence to Cadwell et al. (2016)38 Patch-seq dataset.
We mapped cells from the ArrayExpress accession E-MTAB-4092 dataset38 to our clusters (using only VISp cells) using the nearest centroid classifier with 100 sub-sampling rounds as described in paragraph above. Cells mapped to clusters with probabilities <80% were mapped to the parent nodes of the mapped clusters within the cell type hierarchy, until aggregated confidence at the parent node was > 80%.
Assessing correspondence to Hrvatin et al. (2018)40 dataset.
We mapped VISp cells from our dataset to GEO accession GSE10282740 using the same strategy described above. We chose the Hrvatin et al.40 dataset as reference because the cells profiled by inDrop have lower gene detection, and cannot be mapped to our high-resolution clusters confidently, whereas our cells can be mapped to clusters from the previous dataset40 with high confidence. To define early-response genes (ERGs) and late-response genes (LRGs) within each cluster in the previously published dataset40, differentially expressed genes were computed between samples with 1 h or 4 h after exposure to light versus no exposure. We used the approach described above, with the following criteria: > twofold change, adjusted P < 0.01, q1.th = 0.05, q.diff.th = 0.5. We computed average ERGs and LRGs for all our VISp cells mapped to the this cluster, and plotted their distribution based on our cluster annotation. We then used two-sided t-test to compute the significance for enrichment/depletion of average ERG and LRG expression for each of our cell types against the other types mapped to the same Hrvatin cluster, and defined significant values as having a P < 0.01, after correction for multiple hypotheses using the Holm method, and average fold change greater than 2.
Measures of heterogeneity within L4-IT-VISp-Rspo1 and between L4-IT-VISp-Rspo1 and related clusters.
To explore the heterogeneity of the L4-IT-VISp-Rspo1 cluster, which corresponds to three separate cell types in our previous study20 (Extended Data Fig. 5), we first removed the quality control-dependent gene expression signatures by regressing the expression of each gene against the quality control index, defined as the ratio between the fraction of the reads mapped to intronic regions over the reads mapped to exonic regions. Compared to other cell types, L4 cells have a high fraction of intronic reads, likely indicating high nuclear content. There is also considerable variation of this quality control index among L4 cells, which confounds other transcriptomic signatures. After normalization, we performed WGCNA to find co-expressed gene modules within cells from L4-IT-VISp-Rspo1. We found that the eigengene for the top gene module within L4-IT-VISp-Rspo1 corresponds to the gradient that drove separation of L4 subtypes previously20. We then took the 50 cells at both ends of the eigengene-defined gradient, trained a random forest classifier using the genes from the WGCNA gene module, and tested it on the remaining cells to assign them to the ends of the gradient. The classification probabilities by random forest strongly correlated with the gradient eigengene (Extended Data Fig. 14d). We repeated the same analysis between L4-IT-VISp-Rspo1 and the neighbouring L5-IT-VISp-Hsd11b1-Endou cluster, and between L4-IT-VISp-Rspo1 and more distant L5-IT-VISp-Batf3 cluster. The eigengenes for these comparisons were defined as the first principle component of the top 50 differentially expressed genes in both directions. In both cases, the classifier was trained on 50 sampled cells from each cluster based on the selected differentially expressed genes, and tested on the remaining cells. We applied Kolmogorov-Smirnov tests to determine whether the distribution of classification probabilities is uniform for each of the three cases above. To account for the differences in sample size, we sampled 400 tested L4-IT-VISp-Rspo1 cells for the first case, and up to 200 cells from each cluster for the latter two cases. The Kolmogorov-Smirnov test gave P = 2.64 × 10⁻⁵ within the L4-IT-VISp-Rspo1 gradient. Between neighbouring cluster L4-IT-VISp-Rspo1 and L5-IT-VISp-Batf3, the random forest classification probabilities deviated from uniform distribution more significantly (Kolmogorov-Smirnov test P = 4.37 × 10⁻¹³). When cells in the L4-IT-VISp-Rspo1 cluster were compared with the more distant L5- IT-VISp-Batf3 cluster, the separation was clear (Kolmogorov-Smirnov test P = 0): classification probabilities have a bimodal distribution and cluster separation is discrete. Finally, we split the L4-IT-VISp-Rspo1 cells into five bins based on random forest classification probabilities and computed the differentially expressed genes between the two bins at the both ends of the gradient and the bin at the middle of the gradient (Extended Data Fig. 14d).
RNA FISH.
We performed RNA FISH using RNAscope Multiplex Fluorescent v1 and v2 kits (Advanced Cell Diagnostics) according to the manufacturer’s protocols. We used fresh frozen sections, which we prepared by dissecting fresh brains, embedding the brains in optimum cutting temperature compound (OCT; Tissue-Tek), and storing OCT blocks at −80 °C. Ten-micrometre coronal sections were cut using a cryostat and collected on SuperFrost slides (ThermoFisher Scientific). Sections were allowed to dry for 30 min at −20 °C in a cryostat chamber, placed into pre-chilled plastic slide boxes, wrapped in a zipped plastic bag, and stored at −80 °C. Slides were used within one week. Nuclei were labelled by DAPI and nuclear signal was used to segment cells in images. We imaged mounted sections at 40x on a confocal microscope (Leica SP8). Maximum projections of z-stacks (1-μm intervals) were processed using CellProfiler (http://www.cellprofiler.org)67 to identify nuclei, quantify the number of fluorescent spots, and assign fluorescent spots to each cell/nucleus.
Immunohistochemistry.
Mice were perfused with 4% paraformaldehyde (PFA). Brains were dissected and post-fixed with 4% PFA at room temperature for 3–6 h followed by overnight at 4 °C. Brains were rinsed with PBS and cryoprotected in 10% sucrose (w/v) in PBS with 0.1% sodium azide overnight at 4 °C. One-hundred-micrometre coronal slices were sectioned on a microtome (Leica, SM2010R), washed with PBS, blocked with 5% normal donkey serum in PBS and 0.3% Triton X-100 (PBST) for 1 h, and stained with rabbit anti-dsRed (1:1,000, Clontech, 632496) and goat anti-PVALB (1:1,000, Swant, PVG-213) overnight at room temperature. Sections were washed three times in PBST and incubated with anti-rabbit Alexa 594 (1:500, Jackson ImmunoResearch, 711-585-152) and antigoat Alexa 488 (1:500, Jackson ImmunoResearch, 705-605-147) for 4 h at room temperature. Sections were washed three times with PBST and stained with 5 pM DAPI in PBS for 20 min. After washing in PBST, sections were mounted onto slides, allowed to dry, rehydrated in PBS, dipped in water and coverslips were added with Fluoromount G (SouthernBiotech, 0100–01) mounting medium.
Data analysis and visualization software.
Analysis and visualization of transcriptomic data were performed using R v.3.3.0 and greater68, assisted by the Rstudio IDE (Integrated Development Environment for R v.1.1.442; https://www.rstudio.com/) as well as the following R packages: cowplot v.0.9.2 (https://rdrr.io/cran/cowplot/), dendextend v.1.5.269, dplyr v.0.7.4 (https://dplyr.tidyverse.org/), feather v0.3.1 (https://rdrr.io/cran/feather/), FNN v.1.1 (https://cran.r-project.org/web/packages/FNN/index.html), ggbeeswarm v.0.6.0 (https://cran.r-project.org/web/packages/ggbeeswarm/index.html), ggExtra v.0.8 (https://rdrr.io/cran/ggEx-tra/), ggplot2 v.2.2.170, ggrepel v.0.7.0 (https://cran.r-project.org/web/packages/ggrepel/vignettes/ggrepel.html), googlesheets v.0.2.2 (https://cran.r-project.org/web/packages/googlesheets/vignettes/basic-usage.html), gridExtra v.2.3 (https://cran.r-project.org/web/packages/gridExtra/index.html), Hmisc v.4.1–1 (https://cran.r-project.org/web/packages/Hmisc/index.html), igraph v.1.2.1 (https://www.rdocumentation.org/packages/igraph/versions/1.2.1), limma v.3.30.1366,71, Matrix v.1.2–12 (https://rdrr.io/rforge/Matrix/), matrixStats v.0.53.1 (https://cran.rstudio.com/web/packages/matrixStats/index.html), pals v.1.5 (https://rdrr.io/cran/pals/), purrr v.0.2.4 (https://purrr.tidyverse.org/), pvclust v.2.0–0 (http://stat.sys.i.kyoto-u.ac.jp/prog/pvclust/), randomForest v.4.6–1472, reshape2 v.1.4.2 (https://www.statmethods.net/management/reshape.html), Rphenograph v.0.99.1 (https://rdrr.io/github/JinmiaoChenLab/Rphenograph/), Rtsne v.0.14. (https://cran.r-project.org/web/packages/Rtsne/citation.html), Seurat v.2.1.073, viridis v.0.5.0 (https://rdrr.io/cran/viridisLite/man/viridis.html), WGCNA v.1.6174, and xlsx v.0.5.7 (https://cran.r-project.org/web/packages/xlsx/index.html). Scripts for the R implementation of FIt-SNE75 were used for t-SNE analyses.
Reporting summary.
Further information on research design is available in the Nature Research Reporting Summary linked to this paper.
Code availability.
Software code used for data analysis and visualization is available from GitHub at https://github.com/AllenInstitute/tasic2018analysis/. An R package for iterative clustering (hicat) is available on GitHub at https://github.com/AllenInstitute/scrattch.hicat. The dataset is available for download and browsing on the Allen Institute for Brain Science website: http://celltypes.brain-map.org/rnaseq.
Data availability
Single-cell transcriptomic data are available at the N CBI Gene Expression Omnibus (GEO) under accession GSE115746. Summary of all transcriptomic types and markers is available in Supplementary Table 9. Full metadata for all samples are available in Supplementary Table 10. Newly generated mouse lines have been deposited to the Jackson Laboratory: Vipr2-IRES2-cre (JAX stock number 031332), Slc17a8-IRES2-cre (JAX stock number 028534), Penk-IRES2-cre-neo (JAX stock number 025112).
Extended Data
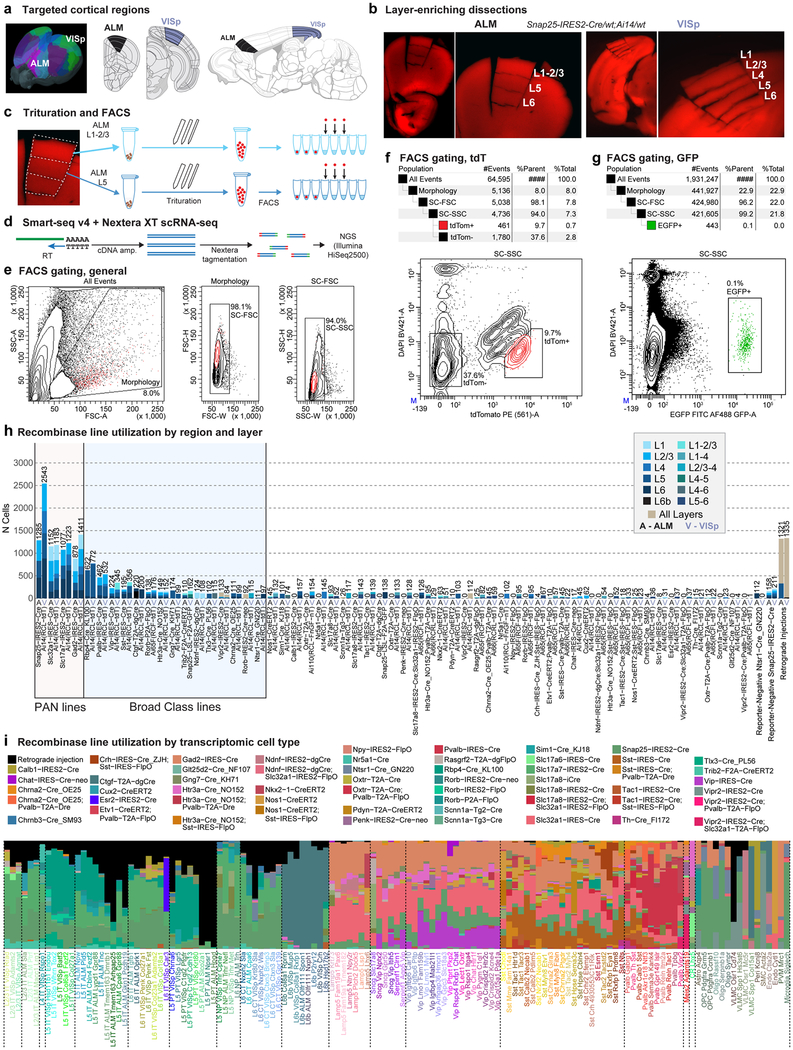
Extended Data Fig. 1 |. Overview of sample collection.
a, One of the two brain regions, ALM or VISp, was dissected from an adult mouse (P53-P59 (n = 339), P51 (n = 1), and P63-P91 (n = 12), Supplementary Table 1). b, Example microdissection images from the most heavily sampled mouse genotype, Snap25-IRES2-cre/wt;Ai14/wt, from both cortical regions. For many samples, microdissection was used to isolate layer-enriched portions of the cortex. ALM lacks L4. The dissection images are representative of n = 21 processed Snap25-IRES2-cre/wt;Ai14/wt brains. c, Microdissected layers were processed separately for single-cell suspension. Each sample was digested with pronase, then triturated with pipettes of decreasing tip diameter (600, 300 and 150 μm). Individual cells were sorted into 8-well strip PCR tubes by FACS. d, SMART-Seq v4 was used to reverse-transcribe and amplify full-length cDNAs from each cell. cDNAs were then tagmented by Nextera XT, PCR-amplified, and sequenced on Illumina HiSeq2500. e, Common gates used for all FACS sorts: (1) Morphology gate excludes events with high side scatter and low forward scatter, which are largely cellular debris, and (2) SC-FSC and SC-SSC gates exclude samples with high forward scatter width and high side scatter width, respectively, to exclude cell doublets and multiplets. f, Example gating for live tdTomato+ or tdTomato− cells. Cells sorted using the tdTom+ gate express the tdTomato reporter and have low DAPI fluorescence. This plot was generated from cell suspension isolated from a Snap25-IRES2-cre/wt;Ai14/wt animal, which expresses tdTomato in all neurons. The tdTom− gate in this genotype was the main source of non-neuronal cells, which have low DAPI fluorescence and low tdTomato expression. Gating hierarchy and sorting statistics are shown above the FACS scatter plot. This gating strategy is representative of n = 21 processed Snap25-IRES2-cre/wt;Ai14/wt brains. g, To sort eGFP+ cells, we used the same debris and doublet gating described in e, then collected cells with high eGFP and low DAPI fluorescence (eGFP+ gate). This plot was generated from cell suspension isolated from VISp of a Ctgf-2A-dgcre/wt;Snap25-LSL-F2A-GFP/wt animal, which expresses eGFP in L6b neurons. Gating hierarchy and sorting statistics are shown above the FACS scatter plot. This gating strategy is representative of n = 4 processed Ctgf-2A-dgcre/wt;Snap25-LSL-F2A-GFP/wt brains. h, Genotype and layer sampling frequencies for all cluster-assigned cells (n = 23,822). PAN Cre-lines were used to broadly sample neurons in the cortex. Non-PAN lines were included to (1) enrich for cells that displayed poor survival in the isolation process (for example, Rbp4-cre_KL100 for L5 types and Pvalb-IRES-cre for Pvalb types); (2) enrich for rare cell types (for example, Ctgf-2A-dgcre for L6b); and (3) transcriptomically characterize cell types labelled by these lines. Bar plots show the number of cells sampled from each genotype and region (A, ALM; V, VISp). Bars are coloured according to the number of samples from microdissected layers or combinations of layers. i, Transgenic driver composition with respect to cell types for all cluster-assigned cells (n = 23,822). The stacked bar plot shows the proportion of cells in each cluster that were collected from each Cre line. Black bars represent cells collected from retrograde tracing experiments. These cells were labelled by a fluorophore-expressing virus or by a Cre-expressing virus together with a Cre-reporter transgenic line. Brain diagrams were derived from the Allen Mouse Brain Reference Atlas (version 2 (2011); downloaded from https://brain-map.org/api/index.html).
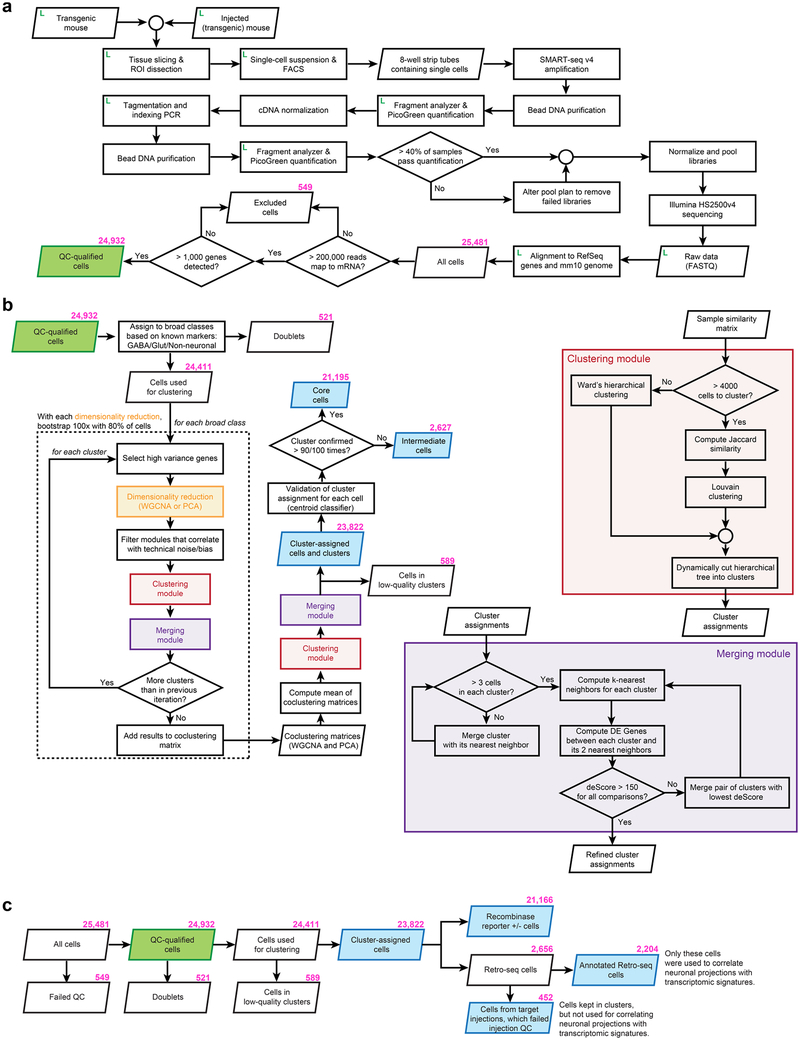
Extended Data Fig. 2 |. scRNA-seq pipeline and analysis workflow.
a, Workflow diagram outlines the path from individual experimental animals to quality control-qualified scRNA-seq data. At multiple points throughout sample processing, cell and sample metadata were recorded in a laboratory information management system (LIMS, labelled as L), which informs quality control processes. Samples must pass quality control benchmarks to continue through sample processing. b, Clustering procedure. Cells were first divided into broad cell classes based on known marker gene expression, then were segregated into clusters 100 times using a bootstrapped procedure that sampled 80% of cells each time. Within each iteration, cells were split by selection of high variance genes followed by PCA or WGCNA dimensionality reduction. Principal components and WGCNA eigengenes were then used to cluster samples by hierarchical clustering or graph-based Jaccard-Louvain clustering algorithm, depending on the number of cells (clustering module, red box). Clusters were checked for over-splitting or termination criteria (merging module, purple box). Each cluster was used as input for a further round of splitting until termination criteria were met. After 100 rounds of clustering, the frequencies with which samples were clustered together were used as a similarity measure to hierarchically cluster the samples. The resulting hierarchical clustering tree was then dynamically cut, and the resulting clusters were checked for over-splitting. Finally, cells were subjected to validation by a centroid classifier. After 100 rounds of validation, cells that were mapped to the same cluster in more than 90 out of 100 trials were assigned ‘core’ cell identity (n = 21,195), and cells with lower scores were assigned ‘intermediate’ cell identity (n = 2,627). Most intermediate cells were mapped to only two clusters (2,492 out of 2,627; 94.9%). c, The number of cells at each step in our analysis pipeline. The identification of doublets and low-quality clusters is described in the Methods. Some high-quality cells (n = 452) from the retro-seq dataset were not used for projection analysis because stereotaxic injections were determined postbrain section to be unsatisfactory, because: (1) the incorrect target was injected, (2) the injection was too close to the collection site, or (3) strong injection tract labelling was detected (Methods). These cells were kept in transcriptomic clusters, but were not used to inform the specificity of glutamatergic projections. Only cells from the annotated retro-seq dataset (n = 2,204) were used for connectivity analyses in Fig. 3 and Extended Data Fig. 10a, b.
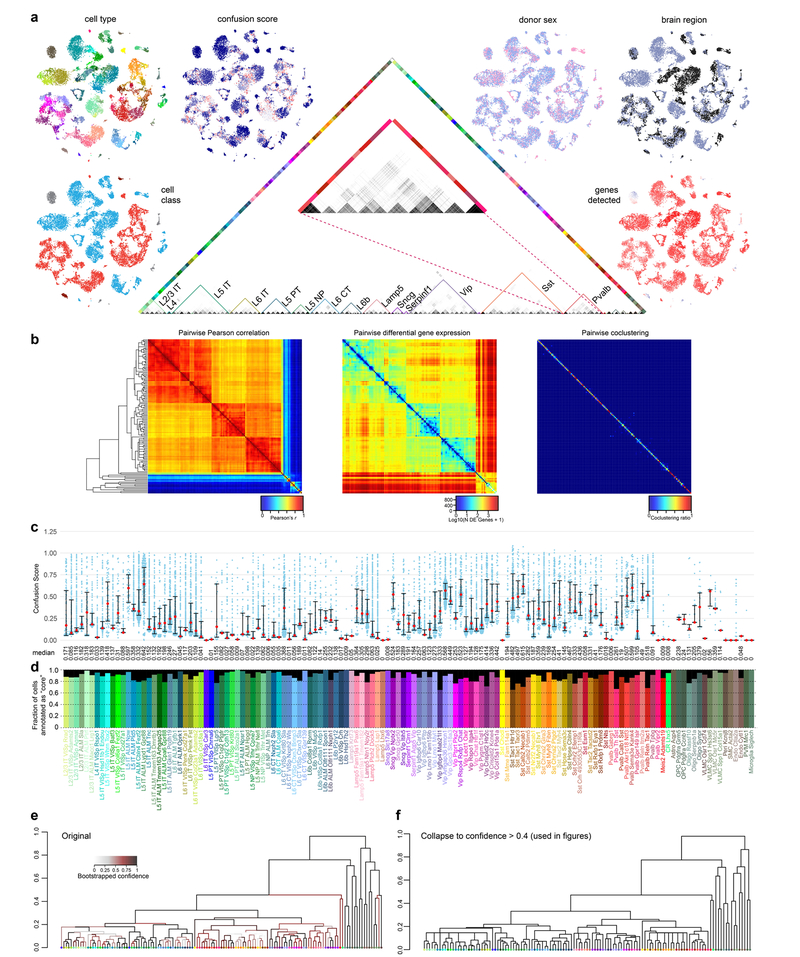
Extended Data Fig. 3 |. Co-clustering frequency matrix, confusion scores and intermediate cells.
a, The co-clustering frequency matrix (centre) for up to 100 cells per cluster selected at random (n = 10,820). Some cell types, for example certain Pvalb types (middle of enlarged panel), display pronounced co-clustering. t-SNE was used to visualize the similarity of gene expression patterns in two dimensions for all cluster- assigned cells (n = 23,822). Individual cells in t-SNE plots were coloured by: cell class (GABAergic, red; glutamatergic, blue; glia, grey; endothelial cells, brown), animal donor sex (female, pink; male, purple), dissected brain region (ALM, black; VISp, grey), confusion score (low-blue, highred), and the number of genes detected (low-blue, high-red). b, Pairwise correlation, differential gene expression and co-clustering for all 133 clusters using all cluster-assigned cells (n = 23,822). c, Confusion scores for all cluster-assigned cells (n = 23,822) segregated by clusters. For each cell, the confusion score is defined as the ratio of the probabilities for that cell to be clustered with the cells from its second best cluster and with the cells from the final cluster (also the best cluster except for rare exceptions). Thus, confusion score is a measure of the confidence of cell type assignment: the lower the value, the less frequently a cell was grouped with cells from a different cluster. Each blue dot is a confusion score for a single cell, median values are shown as red dots; whiskers are twenty-fifth and seventy-fifth percentiles. d, Fraction of cluster-assigned cells (n = 23,822) annotated as core (coloured) or intermediate (black) for each cluster. In total, 21,195 cells (88.97%) were assigned core, whereas 2,627 (11.03%) were assigned intermediate identity. e, f, We performed 100 rounds of bootstrapped clustering to determine the confidence of our hierarchical clustering structure (Methods). The final dendrogram generated by this method (e), with branches coloured by their bootstrapped confidence: light grey (low confidence), maroon (moderate confidence), and black (high confidence). For figures, we used the dendrogram in f, in which we collapsed branches with confidence lower than 0.4.
Extended Data Fig. 4 |. Sequencing depth and gene detection for quality-control-qualified cells segregated by cluster.
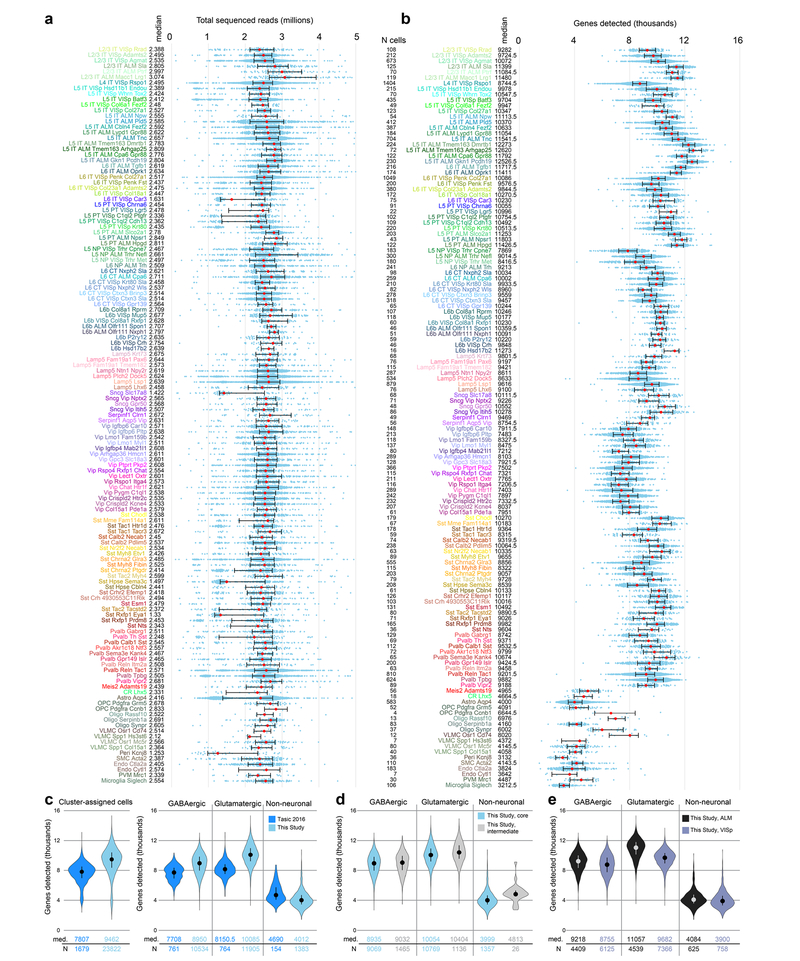
a, Sequencing depth for all cluster-assigned cells (n = 23,822), grouped by cell type. Cells were sequenced to a median depth of 2.54 million reads (min = 0.103 M; max = 13.84 M). Median values in millions of reads are adjacent to the cell type labels. Median values are shown as red dots; whiskers are twenty-fifth and seventy-fifth percentiles. b, The number of detected genes (reads detected in exons >0) varies by cell type. Gene detection is shown for each cluster-assigned cell (n = 23,822). Median values are shown adjacent to the cell type labels. Median number of genes detected across all cells is 9,462 per cell (min = 1,445; max = 15,338). Median values are shown as red dots; whiskers are twenty-fifth and seventy-fifth percentiles. Samples with less than1,000 detected genes were excluded at a prior quality control step (Extended Data Fig. 2). c, Comparison of gene detection between our previous study20 and this study for all cluster-assigned cells (left) and cells grouped according to major classes (right). d, Comparison of gene detection between cell classes for core and intermediate cells. The higher gene detection for intermediate non-neuronal cells may be due to contamination with other non-neuronal cells. e, Comparison of gene detection within cell classes between VISp and ALM. In c-e, medians are shown as dots and values are listed below each distribution; whiskers are twenty-fifth and seventy-fifth percentiles. Sample size (number of cells) for each analysed group is listed between panels a and b, and below the graphs for panels c-e.
Extended Data Fig. 5 |. Markers used for cell type assignment.
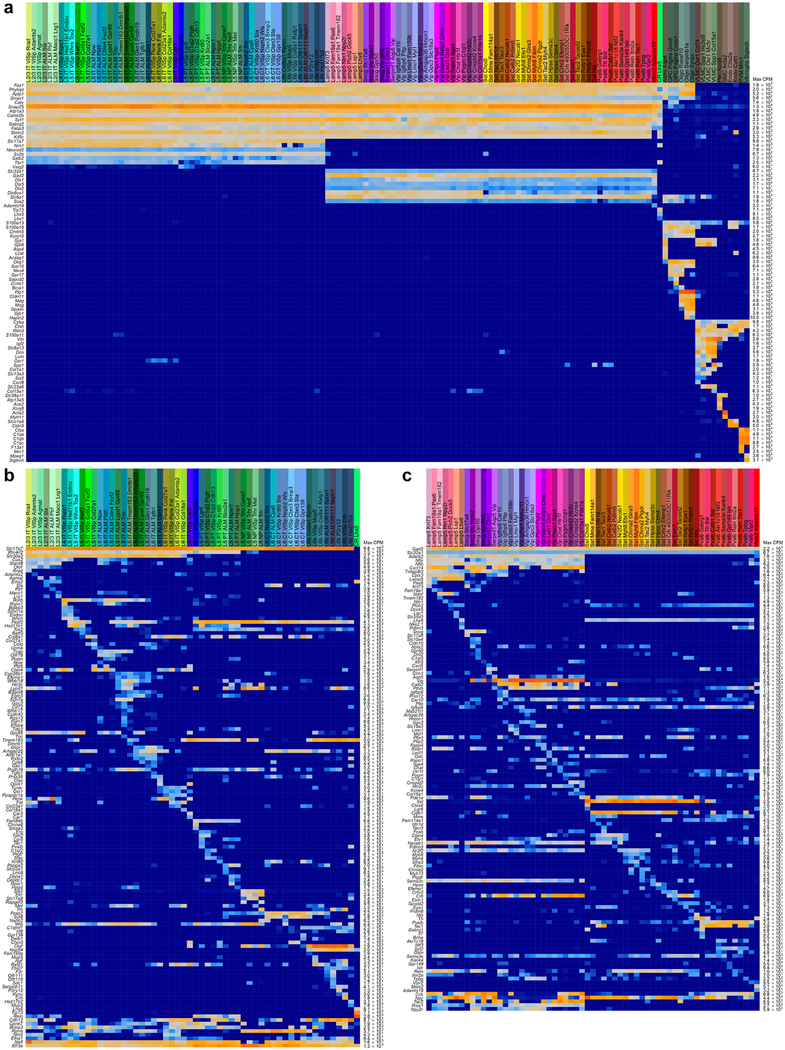
a, Marker panel of 88 genes for cell classes. For each cluster, 25% trimmed mean expression values are shown (n = 23,822 cluster-assigned cells; 133 clusters). Maximum expression values (counts per million reads, CPM) are shown to the right of the heat map. Pan-neuronal markers (for example, Snap25) were used to assign neuronal type identity. Glutamatergic (for example, Slc17a7 and Slc17a6) and pan-GABAergic (for example, Gadl, Gad2 and Slc32a1) markers were used to assign glutamatergic and GABAergic identity, respectively. Known non-neuronal markers were used to assign non-neuronal identities. b, Marker panel for glutamatergic cell types. For each cluster, 25% trimmed mean expression values are shown (n = 11,905 cells; 56 clusters). Layer-specific markers were used to assign layer identity (for example, Cux2, Rorb, Deptor and Foxp2). To assign final names to types, subclass and/or layer-markers were combined with unique or other specific markers, many of which are novel. Once the identity was assigned, previously unknown genetic bases of phenotypes could be discovered. For example, for the Cajal-Retzius cell type CR-Lhx5, which has been shown by immunohistochemistry to contain glutamate but not GABA76, we show that its glutamatergic phenotype stems from the expression of mRNA encoding VGLUT2 (Slc17a6), and not from the other glutamate transporters (Slc17a7 and Slc17a8). Note that some markers that appear non-specific, provide preferential labelling of specific types when used to make random-insertion transgenic BAC lines. For example, Efr3a-cre_NO10834 specifically labels near-projecting types, although Efr3a mRNA is ubiquitously detected in all neurons. However, its expression is about fivefold higher in near-projecting types; this may contribute to preferential labelling of the near-projecting types by this BAC transgenic Cre line. c, Marker panel for GABAergic cell types. For each cluster, 25% trimmed mean expression values are shown (n = 10,534 cells; 61 clusters). GABAergic subclasses were assigned based on the expression of Lamp5, Serpinf1, Sncg, Vip, Sst and Pvalb. Final names were assigned based on unique combinations of markers.
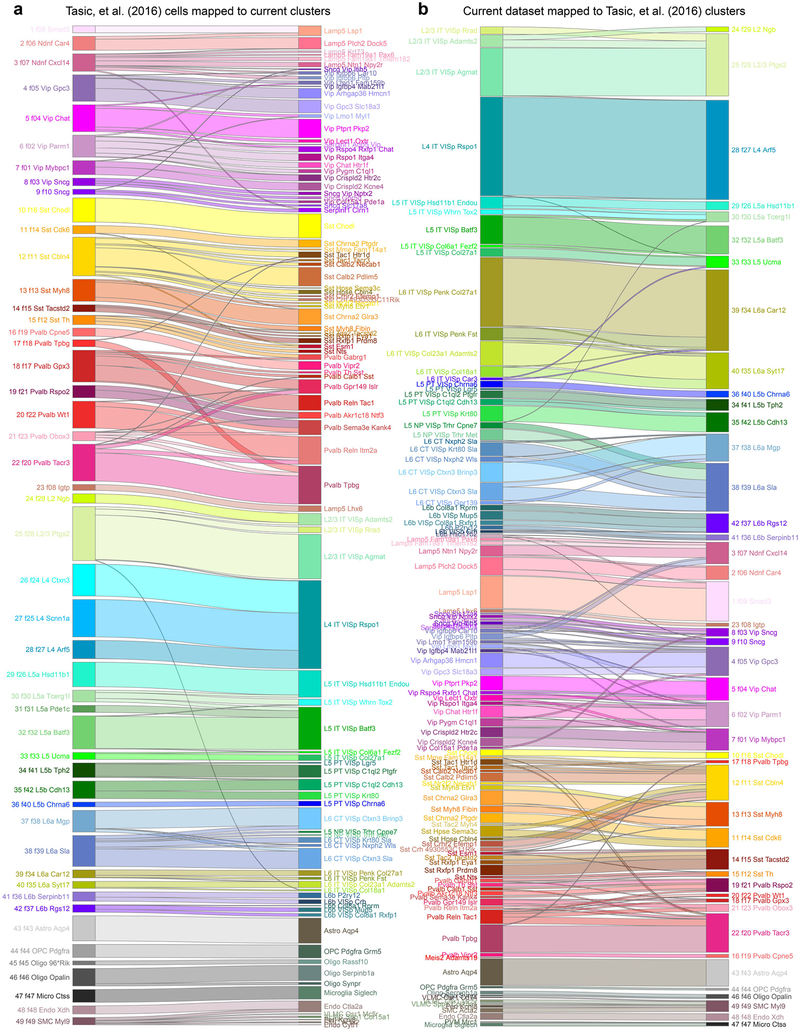
Extended Data Fig. 6 |. Comparison of cell types to those defined previously20.
We compared the similarity of clustering results for our current dataset and our previous dataset by nearest centroid classification (Methods). We mapped the 1,424 cells from the previous dataset20 to 133 clusters from the current study (a) and vice versa: 23,822 current cells to 49 previous clusters20. b, Some types were largely absent from our previous study. For example, the Meis2 type was not detected probably owing to rarity and white-matter confinement, whereas the L5 near-projecting types were missed owing to reliance on Rbp4-cre_KL100 to isolate L5 cells. We now find that, in contrast to pan-neuronal (Snap25-IRES-cre) or pan-glutamatergic Cre lines (Slc17a7-IRES-cre), Rbp4-cre_KL100 labels all L5 types except L5 near-projecting (Extended Data Fig. 8).
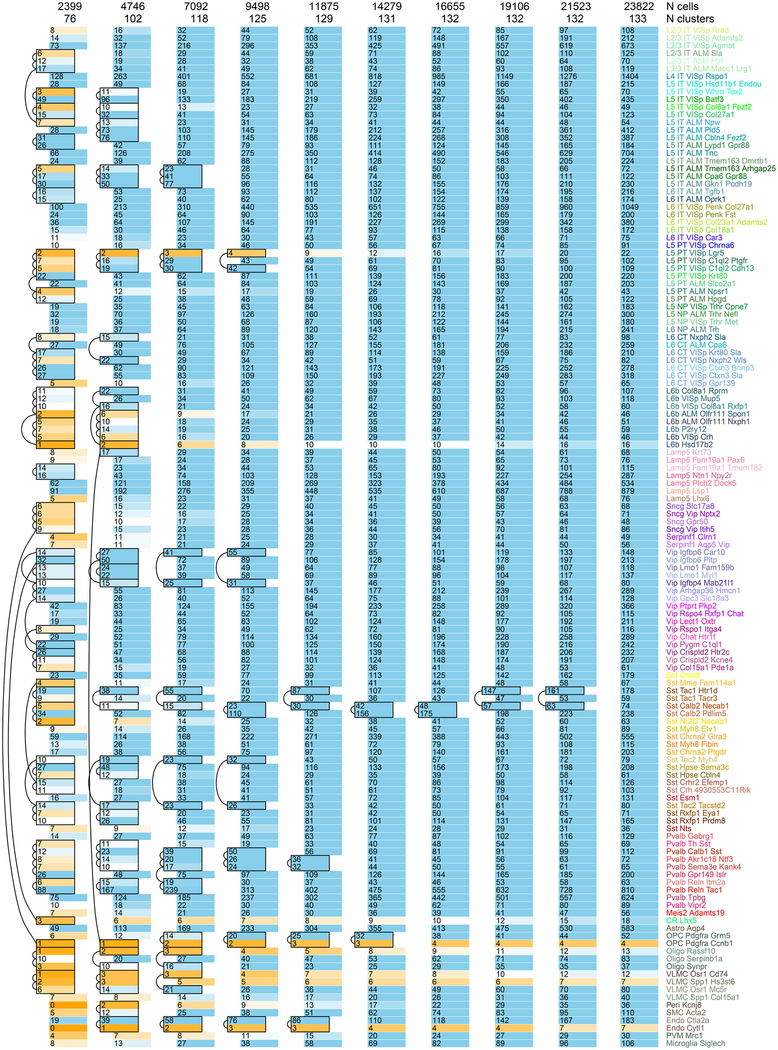
Extended Data Fig. 7 |. Saturation of cell type detection.
We tested the ability of our of computational approach to segregate cell types based on our standard cluster separation criteria (Methods) upon decreasing cell numbers included in clustering. The total number of sampled cells and derived clusters in each trial is shown at the top of each column. Each row is a cluster from our full dataset analysis. Each coloured box represents the number of cells from each cluster (row) that were included in the specific downsampled dataset (column). Clusters that merge are shifted to the left of their respective columns and merging is indicated by arcs and/or removal of lines between adjacent clusters. For most types, we were able to segregate them from their related types with many fewer cells than present in the complete dataset. Further cell sampling may reveal additional diversity, especially for rare cell types.
Extended Data Fig. 8 |. Cell-type labelling by recombinase driver lines.
Driver line names are listed on top (columns, n = 55) and cell types on the left (rows, n = 133). Coloured discs represent the numbers of cells detected for each type (cell numbers are proportional to disc surface area). This plot is based on 20,758 cells isolated from transgenic mice that were collected as tdT+ or GFP+ by FACS. Note that the relative proportions of cell types obtained in these experiments are likely to be affected by cell type-specific differences in survival during the isolation procedure and by samping via layer-enriching dissections.
Extended Data Fig. 9 |. Non-neuronal cell types.
a, Non-neuronal cells (n = 1,383 cells) are divided into two major branches according to their developmental origin: neuroectoderm-derived branch, which contains astrocytes and oligodendrocytes (left), and non-neuroectoderm-derived, which includes immune cells (microglia, perivascular macrophages), blood vessel-associated cells (smooth muscle cells, pericytes and endothelial cells), and vascular leptomeningeal cells (VLMCs, right). All have been detected in both ALM and VISp, except VLMC-Osr1-Cd74, which may be rare (12 cells total) and may also be detected in ALM with further sampling. Violin plots represent distributions of individual marker gene expression in single cells within each cluster. Rows are genes, median values are black dots, and values within rows are normalized between 0 and the maximum expression value for each gene (right edge of each row) and displayed on a linear scale. We identify astrocytes based on expression of Aqp477. Oligodendrocyte lineage cells express Sox1078. Oligodendrocyte precursor cells are marked by expression of Pdgfra and absence of Col1a177,78, with dividing oligodendrocyte precursor cells expressing Ccnb1. Newly generated oligodendrocytes (Oligo-Rassf10) express Enpp6, whereas myelinating oligodendrocytes (Oligo-Serpinb1a/Synpr) express Opalin79. Two related types of immune cells coexpress Cd14 and Fcgr3, and can be identified as microglia by expression of Siglech80 and Tmem11981, and perivascular macrophages by expression of Mrc1, Lyve119 and Cd16381. We identify two related types of blood vessel- associated cells as pericytes and smooth muscle cells (SMCs) based on their expression of Cspg4 and Acta2 (reviewed previously82). We assign SMC identity to SMC-Acta2, which strongly expresses Acta2 (smooth muscle actin). We assign pericyte identity to the Peri-Kcnj8 cluster based on specific expression of pericyte markers Kcnj8 and Abcc983. We define additional markers uniquely expressed in this cell type (Atp13a5, Art3, Pla1a and Ace2) that may help solidify pericyte identity in future studies. We identify one type of endothelial cells (Endo-Slc38a5) based on expression of previously characterized endothelial markers, Tek, Pdgfb, Nos3, Eltd1 and Pecam1. We identify VLMC types based on their unique expression of Lum and Col1a178,84. We define four types based on differential gene expression. Markers examined in b and c are highlighted by arrows and colours, respectively. b, RNA ISH for some of non-neuronal markers from the Allen Brian Atlas25. Images contain regions of interest from representative sections selected from individual whole-brain RNA ISH experiments. Spp1 mRNA is detected in the meninges and scattered in the cortex, corresponding to VLMCs, as well as select Pvalb and Sst types. Gja5 mRNA labels vessel-like structures in the grey matter, probably corresponding to the Endo-Slc38a5 cluster. Slc47a1 is specific to the VLMC-Osr1-Cd74 type, which appears to be restricted to pia. Dcn is expressed in three VLMC types, and its expression is seen in the pia and vessel-like structures in the cortex. The number of whole-brain experiments per gene available in the Allen Brain Atlas is as follows: Spp1: n = 4 brains (2 sagittal, 2 coronal); Gja5: n = 2 brains (2 sagittal); Slc47a1: n = 1 brain (sagittal); Dcn: n = 3 brains (2 sagittal, 1 coronal). c, Single-molecule RNA FISH by RNAscope for Osr1, Spp1 and Lum mRNAs shows labelling at the pial surface and surrounding vessel-like structures. Images are representative of two independent RNAscope experiments on n = 2 brains. On the basis of the coexpression of marker genes shown in a, VLMCs within the grey matter (expanded region 2) are probably the VLMC-Spp1-Col15a1 type, whereas VLMCs in pia between cortex and tectum (expanded region 3) are probably VLMC-Osr1-Mc5r. The surface VLMCs (expanded region 1) appear to express all three markers, which are usually not co-detected in single cells by RNA-seq (a). This finding could be explained by a possibility that region 1 may contain two or more types of spatially appositioned VLMCs, for example, VLMC-Osr1-Cd74 (based on Slc47a1 expression shown in b), as well as one of the Lum+ types (VLMC-Osr1-Mc5r and/or VLMC-Spp1-Col15a1).Extended Data Fig. 10 | See next page for caption.
Extended Data Fig. 10 |. Retro-seq and comparison of cell types across regions.
a, b, Injection targets for retro-seq, represented by select Allen Reference Atlas images are displayed on the left. The plots on the right show injection targets in rows and cell types in columns for annotated retro-seq cells collected from the ALM (n = 1,152) (a) or VISp (n = 1,052) (b). Cell numbers are represented as discs, coloured according to detected cell types. Cell numbers from each target segregated by categories (based on broad type or virus injected) are shown to the right. We used three types of viral tracers expressing Cre: CAV2-Cre, rAAV2-retro-EF1a-Cre and RVΔGL-Cre, and injected them into a Cre-reporter line Ai14. For ALM experiments, we also injected rAAV2-retro-CAG-GFP or rAAV2-retro-CAG-tdT into wild-type mice. To ensure diverse coverage of projection neuron types, at least two virus types were used for most broad target regions (except for striatum and tectum for ALM, and tectum for VISp), as different viruses may display different tropisms. Cell types that were never isolated from the retrograde tracing experiments are shaded pink. Grey-hatched regions denote cells that may have been labelled unintentionally (but unavoidably) through the needle injection tract. For most subcortical injections into VISp-projection areas, the needle goes through the cortex, and some IT cells are labelled through the virus deposited along the needle tract. One exception is the injection into the superior colliculus for VISp experiments, in which we avoided cortical labelling by injecting at an angle through the cerebellum (Methods). Each injection target is labelled according to the centre of the corresponding injection site, however, neighbouring regions are often infected (Supplementary Table 5). Reference atlas abbreviations are as follows: ACA, anterior cingulate area; ALM-c, contralateral anterior lateral motor area; CP-c, contralateral caudoputamen; CTX, cortex; GRN, gigantocellular reticular nucleus; IRN, intermediate reticular nucleus; LD, lateral dorsal nucleus of the thalamus; LGd, dorsal lateral geniculate complex; LP, lateral posterior nucleus of the thalamus; MD, mediodorsal nucleus of the thalamus; MOp, primary motor area; MY, medulla; ORBl-c, contralateral orbital area, lateral part; P, pons; PARN, parvicellular reticular nucleus; PERI, perirhinal area; PF, parafascicular nucleus; PG, pontine grey; PRNc, pontine reticular nucleus dorsal part; RSP, retrospenial area; SC, superior colliculus; SCs, superior colliculus sensory related area; SSp, primary somatosensory area; SSs, supplementary somatosensory area; STR, striatum; TEC, tectum; TH, thalamus; VISp-c, contralateral primary visual area; ZI, zona incerta. c, Mapping of glutamatergic cells from ALM onto VISp glutamatergic cell types (grey arrows) using a random forest classifier trained on VISp types, and vice versa (blue-grey arrows; Methods). The fraction of cells that mapped with high confidence onto clusters from the other region is represented by the weight of the arrows. The best matched types were used in Fig. 2c. For this comparison, the 4,519 ALM cells and 7,352 VISp cells from glutamatergic types excluding CR-Lhx5 were used. d, e, RNA ISH from the Allen Mouse Brain Atlas25 for select markers confirms areal gene expression specificity. Images contain regions of interest from representative sections selected from individual whole-brain RNA ISH experiments. The number of whole-brain experiments per gene available in the Allen Brain Atlas is as follows: Wnt7b: n = 3 brains (1 sagittal, 2 coronal); Postn: n = 2 brains (1 sagittal, 1 coronal); Rxfp2: n = 2 brains (1 sagittal, 1 coronal); Chrna6: n = 3 brains (1 sagittal, 2 coronal); Stac: n = 2 brains (1 sagittal, 1 coronal); Scnn1a: n = 2 brains (1 sagittal, 1 coronal). Brain diagrams were derived from the Allen Mouse Brain Reference Atlas (version 2 (2011); downloaded from https://brain-map.org/api/index.html).
Extended Data Fig. 11 |. Validation of glutamatergic marker gene expression and cell type location by RNA FISH and projection subclasses by anterograde tracing.
a-c, Single-molecule RNA FISH with RNAscope was used to validate marker expression and cell type distribution. a, Example image shows fluorescent spots that correspond to Rspo1 (cyan), Hsd11b1 (green) and Scnn1a (red) mRNA molecules in a 10-μm coronal VISp section. Scale bars are in micrometres. b, Example of processed data from a; white square in a corresponds to green square in b. Data processing steps involved creation of maximum projection of a montage of confocal z-stacks, identifying nuclei, quantifying the number of fluorescent spots, assignment of spots to each nucleus by CellProfiler67 and horizontal compression of the data to emphasize layer enrichment of examined cells. Each dot in the panel represents a cell plotted according to the detected nucleus position. Each cell was coloured according to the quantified fluorescent labelling. The first three panels show cells shaded according to the quantified number of spots per cell: Rspo1 and Scnn1a mRNAs are enriched in L4 and Hsd11b1 at the L4-L5 border. The fourth panel shows location of cells co-labelled with two or more probes and confirms scRNA-seq data: coexpression of Rspo1 and Scnn1a is expected in the L4-IT-VISp-Rspo1 type and coexpression of Hsd11b1 and Scnn1a in the L5-IT-VISp-Hsd11b1-Endou type. c, Condensed plots for six individual representative RNA scope experiments (Exp) in VISp for select glutamatergic cell type markers. The number of times (n) each experiment was performed independently to produce similar results is listed below each experiment. Layers were delineated based on cell density. Data in a and b correspond to Exp1. d, A schematic of laminar distributions of VISp glutamatergic types according to experiments in c corroborates previous evidence85 showing that L5 IT and L5 pyramidal tract cells are not well separated into 5a and 5b sublayers in the visual cortex, compared to the primary somatosensory cortex. Note that in ALM, even subtypes of L5b with different projections are well segregated into upper and lower sublayers (see accompanying study)21. e, To confirm the projection patterns of several transcriptomic types and examine them in greater detail, we performed anterograde tracing by Cre- dependent adeno-associated virus (AAV) in select Cre lines. We have previously characterized cell type labelling by these Cre lines (Extended Data Fig. 8). In one case, we used a Cre line with a similar pattern of expression with viral reporter in adulthood (Cux2-IRES-cre instead of Cux2-IRES-creERT2)86. f-k, Each image is a projection generated from a series of images obtained by TissueCyte 1000 from a representative anterograde tracing experiment; additional experiments are available at http://connectivity.brain-map.org/. f, L5 and L2/3 IT types as labelled in Tlx3-cre_PL56, and Cux2-IRES-cre lines display extensive long-range projections that cover all layers with preference for upper layers. h, By contrast, L6 IT types, labelled by the newly generated Penk-IRES2-cre-neo line (Extended Data Fig. 8), project to many of the same areas as the L2-L3 and L5 IT types, but their projections are confined to lower layers in all areas examined, including higher visual areas and contralateral VISp and ALM. i, As revealed by the retro-seq data (Extended Data Fig. 10b), we confirm that L4-IT-VISp-Rspo1 type, which represents most cells labelled by Nr5a1-cre (Extended Data Fig. 8) projects to contralateral VISp (Fig. 3d). Notably, this projection is observed only when injection is performed in the most anterior portion of VISp (compare left and right panels in i). j, L6b types labelled by Ctgf-2A-dgcre have sparse projections to the anterior cingulate area. k, Consistent with the retro-seq data, the near-projecting types labelled by Slc17a8-IRES2-cre (Extended Data Fig. 8) do not have long-distance projections, but only local projections and sparse projections to nearby areas. Brain diagrams were derived from the Allen Mouse Brain Reference Atlas (version 2 (2011); downloaded from https://brain-map.org/api/index.html).
Extended Data Fig. 12 |. Mapping of previously published scRNA-seq samples36 and Patch-seq samples38 to our dataset.
scRNA-seq data obtained from sorted cells or cell content extracted by patching were mapped to our transcriptomic types using a centroid classifier (Methods). a, River plot showing the mapping of single-cell transcriptomes described previously36 (n = 584 cells) to our types. b, Alternative representation of the results in a, with blue discs representing the number of single-cell transcriptomes published previously36 onto a dendrogram of GABAergic cell types in this study. Each blue disc area represents the total number of single-cell transcriptomes mapped to one of our cell types. c, Expression of Calb2, Vip and Cck in single cells from our Sncg and Vip subclasses (n = 3,225). Transgenic recombinase lines based on these genes were used to label CCK basket cells (CCKC) and interneuron-selective cells (ISC) described previously36. Boxes highlight our types to which the CCK basket cells and interneuron-selective cells described previously36 were mapped to. CCK basket cells and interneuron-selective cells as defined previously36 each correspond to several of our transcriptomics types. d, Patch-seq data for 58 cells described previously38 were mapped to our transcriptomic types. Some cells could not be mapped with high confidence to terminal leaves of our taxonomy, and were therefore mapped to an internal node (cluster labels on the right that start with ‘n’ for node, see f). e, Constellation diagram showing corresponding types described previously38 and Lamp5 cell types from this study. Correspondences with the neurogliaform cells (NGC, orange) and single-bouquet cells (SBC, blue) defined previously38 are shown by the colours applied to the left side of each disc. f, Alternative representation of the result in d, with blue discs representing the number of single cell transcriptomes described previously38 mapped onto a dendrogram of GABAergic cell types in this study. Each blue disc area represents the total number of single cell transcriptomes mapped to a type (terminal leaf) or node in our taxonomy.
Extended Data Fig. 13 |. A new tool, Vipr2-IRES2-Cre, for access to select transcriptomically defined cell types.
a, Expression of select marker genes in our transcriptomically defined cell types (colour bar on top) represented as violin plots for all cluster-assigned cells (n = 23,822 cells; 133 clusters). Median values are black dots. Each row is scaled to the maximum expression value shown to the right of the plot (in CPM), and displayed on a linear scale. Venn diagrams represent expected cell type labelling by genetic tools described below. A new transgenic line, Vipr2-IRES2-cre, was created to label Pvalb-Vipr2 and Meis2 types. Unlike the previously developed Nkx2.1-creERT2 line87, this line does not require tamoxifen induction for chandelier cell labelling (corresponding to Pvalb-Vipr2). b-f, Specificity of this recombinase line was tested by scRNA-seq and immunohistochemistry. b, scRNA-seq and clustering with other cells revealed cell types labelled by two mouse genotypes on the right. Types are labelled on the bottom in standard colours. Only cell types with at least one cell labelled are displayed. n = 329 cells from Vipr2-IRES2-cre/wt;Ai14/wt; n = 38 cells from Vipr2-IRES2-cre/wt;Slc32a1-T2A-FlpO/wt;Ai65/wt. c-f, Representative images of immunohistochemistry results; each image is representative of n = 2 experimental animals with stated genotypes. High- magnification images show tdT labelling in black, anti-PVALB in green and anti-tdTomato in red. Tissue sections (100 μm) were stained with anti- PVALB, anti-dsRed (labels tdTomato), and DAPI. Images are maximum intensity projections of confocal z-stacks. Scale bars are in micrometres. In Vipr2-IRES2-cre/wt;Ai14/wt mice (b, grey bars), apart from the expected labelling of chandelier cells (Pvalb-Vipr2), many non-neuronal cells are labelled (especially, Astro-Aqp4 and SMC-Aoc3 types, panel c). d, To improve labelling specificity, we created and examined Vipr2-IRES2-cre/wt;Slc32a1-T2A-FlpO/wt;Ai65/wt mice. As expected, labelling was more specific, now confined to chandelier cells, basket cells and Meis2 interneurons (dark bars in b and morphologically identified types in d). Notably, the chandelier cells within VISp did not express PVALB protein (d, panel 1). e, Genetic intersection of Vipr2 and Pvalb expression labelled cells with chandelier morphology corresponding to Pvalb-Vipr2 in ALM. f, However, Vipr2-IRES2-cre/wt;Pvalb-T2A-FlpO/wt;Ai65/wt did not label chandelier cells in VISp, but PVALB+ cells of basket morphology. This unexpected labelling may reflect historical expression of Vipr2 in a subset of other Pvalb cells or low adult Vipr2 expression that is not detected by scRNA-seq. In VISp-containing sections, some chandelier cells are labelled, but are observed outside of VISp (f, panel 3). RSP, retrosplenial cortex.
Extended Data Fig. 14 |. Discreteness and continuity in cell type definition.
a, Within the L4-IT-VISp-Rspo1 type, n = 1,442 cells were arranged according to graded expression of 35 genes (only 26 are shown). b, Mapping of n = 394 L4 and L5 IT cells from our previous study20 to cell types in this study. The three L4 clusters from our previous study20 map primarily to the L4-IT-VISp-Rspo1 type. c, Position of L4-IT-VISp-Rspo1 within the VISp glutamatergic constellation diagram. d, Computational split of the L4-IT-VISp-Rspo1 type into three parts along the continuum. For comparison, equivalent plots indicate better separation between this cluster and select L5 IT clusters. n = 1,404 cells for L4-IT-VISp-Rspo1, 215 for L5-IT-Hsd11b1-Endou, and 435 for L5-IT-VISp-Batf3. e, Comparison of gene expression differences among the parts of L4-IT-VISp-Rspo1, as well as this type with select L5 IT types. By this measure, similar differences are detected between the two ‘end’ parts of L4-IT-VISp-Rspo1, and between L4-IT-VISp-Rspo1 and L5-IT-Hsd11b1-Endou. f, Constellation diagrams for n = 2,880 Sst subclass cells reflect clusters defined at three different deScores corresponding to clustering stringency: low, standard and high, starting with the same number of genes (n = 30,862, Methods). For low stringency, newly split clusters are enclosed by dashed contours. For high stringency, arrows indicate dominant merges.
Extended Data Fig. 15 |. Cell types with activity-dependent transcriptomic signatures.
a, River plots representing the mapping of 14,205 VISp cells from this study to a previously published dataset40 using a centroid classifier (Methods). b, Violin plots show the distribution of log2-scaled and centred average expression of late-response genes (LRGs) and early-response genes (ERGs) in select cell types from this study that are in a subclass with at least one type that is significantly correlated with LRG or ERG expression. From the published dataset40, only the clusters with expression of at least four ERGs and LRGs were included. In total, values for n = 6,956 cells from our study are displayed in the violin plots. We performed a two-sided t-test to assess enrichment or depletion of expression of LRGs or ERGs, and defined significant values as P < 0.01 after correction for multiple hypotheses using the Holm method, and average fold change greater than 2. Significant P values for enrichment and depletion are displayed above and below each row, respectively. Complete statistics for all t-tests is included in Supplementary Table 11. c, Heat maps of log2-scaled and centred average gene expression for ERGs and LRGs in select cell types from our study and from the published dataset40.
Extended Data Fig. 16 |. Areal gene expression differences in GABAergic types.
a-c, t-SNE plots for Sst and Pvalb (n = 5,113 cells, generated using 1,244 differentially expressed genes), Lamp5, Serpinf1, Sncg and Vip (n = 5,365 cells, generated using 1,184 differentially expressed genes) and glutamatergic types (n = 11,905 cells, generated using 1,984 differentially expressed genes) showing cells labelled in cluster colours on the left and area-of-origin on the right. Glutamatergic cells show the most marked segregation by area of origin. Sst and Pvalb types show small but noticeable area-specific segregation, which is even less obvious for the Lamp5, Sncg and Vip types. d, Areas from the Sst and Pvalb t-SNE plots were enlarged to show partial segregation of cells within two Sst types by area of origin. e, Layer distribution and violin plots for marker genes Sst, Crh and Calb2 in cells from the same transcriptomic type divided by area. The number of cells in each type and region are shown below each column (n = 118 cells for ALM Sst-Calb2-Pdlim5; 120 for VISp Sst-Calb2-Pdlim5; 62 for ALM Sst-Esm1; and 69 for VISp Sst-Esm1). Violin plots are shown on a logi0 scale, scaled to the maximum value for each gene (right of the plot in CPM); black dots are medians. In ALM, triple positive Sst+Crh+Calb2+ cells belong to Sst-Calb2-Pdlim5 type and are enriched in upper layers. In VISp, this same type does not express Crh, but a different type may account for Sst+Crh+Calb2+ cells: Sst-Esm1, and would be expected in lower layers. f, g, RNA FISH by RNAscope for Sst (green), Crh (red) and Calb2 (cyan) in ALM and VISp. Scale bars are in micrometres. In agreement with e, we find triple-positive cells by RNA FISH in ALM in upper layers, and in VISp in lower layers. Images are representative of a single experiment including multiple tissue sections from ALM and VISp. Brain diagrams were derived from the Allen Mouse Brain Reference Atlas (version 2 (2011); downloaded from https://brain-map.org/api/index. html).
Supplementary Material
Acknowledgements
We thank M. Chillon Rodrigues for providing CAV2-Cre, Karpova for providing rAAV2-retro, A. Williford for technical assistance, and the Transgenic Colony Management and Animal Care teams for animal husbandry. This work was funded by the Allen Institute for Brain Science, and by US National Institutes of Health grants R01EY023173 and U01MH105982 to H.Z. We thank the Allen Institute founder, P. G. Allen, for his vision, encouragement and support.
Reviewer information Nature thanks P. Carninci, C. Chau Hon and the anonymous reviewer(s) for their contribution to the peer review of this work.
Online content
Any methods, additional references, Nature Research reporting summaries, source data, statements of data availability and associated accession codes are available at https://doi.org/10.1038/s41586-018-0654-5.
Competing interests The authors declare no competing interests.
Additional information
Extended data is available for this paper at https://doi.org/10.1038/s41586-018-0654-5.
Supplementary information is available for this paper at https://doi.org/10.1038/s41586-018-0654-5.
Correspondence and requests for materials should be addressed to B.T.
Publisher’s note: Springer Nature remains neutral with regard to jurisdictional claims in published maps and institutional affiliations.
References
- 1.Fuster J The Prefrontal Cortex 5th edn (Academic Press, Cambridge, MA, 2015). [Google Scholar]
- 2.Mountcastle VB Perceptual Neuroscience: The Cerebral Cortex (Harvard Univ. Press, Cambridge, MA, 1998). [Google Scholar]
- 3.DeFelipe J The evolution of the brain, the human nature of cortical circuits, and intellectual creativity. Front. Neuroanat 5, 29 (2011). [DOI] [PMC free article] [PubMed] [Google Scholar]
- 4.Glasser MF et al. A multi-modal parcellation of human cerebral cortex. Nature 536, 171–178 (2016). [DOI] [PMC free article] [PubMed] [Google Scholar]
- 5.Kolb B & Tees RC The Cerebral Cortex of the Rat (MIT Press, Cambridge, MA, 1990). [Google Scholar]
- 6.Ng L et al. An anatomic gene expression atlas of the adult mouse brain. Nat. Neurosci 12, 356–362 (2009). [DOI] [PubMed] [Google Scholar]
- 7.Cardin JA, Kumbhani RD, Contreras D & Palmer LA Cellular mechanisms of temporal sensitivity in visual cortex neurons. J. Neurosci 30, 3652–3662 (2010). [DOI] [PMC free article] [PubMed] [Google Scholar]
- 8.Durand S et al. A Comparison of visual response properties in the lateral geniculate nucleus and primary visual cortex of awake and anesthetized mice. J. Neurosci 36, 12144–12156 (2016). [DOI] [PMC free article] [PubMed] [Google Scholar]
- 9.Liu H, Agam Y, Madsen JR & Kreiman G Timing, timing, timing: fast decoding of object information from intracranial field potentials in human visual cortex. Neuron 62, 281–290 (2009). [DOI] [PMC free article] [PubMed] [Google Scholar]
- 10.Chen TW, Li N, Daie K & Svoboda K A map of anticipatory activity in mouse motor cortex. Neuron 94, 866–879.e4 (2017). [DOI] [PubMed] [Google Scholar]
- 11.Guo ZV et al. Maintenance of persistent activity in a frontal thalamocortical loop. Nature 545, 181–186 (2017). [DOI] [PMC free article] [PubMed] [Google Scholar]
- 12.Guo ZV et al. Flow of cortical activity underlying a tactile decision in mice. Neuron 81, 179–194 (2014). [DOI] [PMC free article] [PubMed] [Google Scholar]
- 13.Svoboda K & Li N Neural mechanisms of movement planning: motor cortex and beyond. Curr. Opin. Neurobiol 49, 33–41 (2018). [DOI] [PubMed] [Google Scholar]
- 14.Zeng H & Sanes JR Neuronal cell-type classification: challenges, opportunities and the path forward. Nat. Rev. Neurosci 18, 530–546 (2017). [DOI] [PubMed] [Google Scholar]
- 15.Molyneaux BJ, Arlotta P, Menezes JR & Macklis JD Neuronal subtype specification in the cerebral cortex. Nat. Rev. Neurosci 8, 427–437 (2007). [DOI] [PubMed] [Google Scholar]
- 16.Rudy B, Fishell G, Lee S & Hjerling-Leffler J Three groups of interneurons account for nearly 100% of neocortical GABAergic neurons. Dev. Neurobiol 71, 45–61 (2011). [DOI] [PMC free article] [PubMed] [Google Scholar]
- 17.Jiang X et al. Principles of connectivity among morphologically defined cell types in adult neocortex. Science 350, aac9462 (2015). [DOI] [PMC free article] [PubMed] [Google Scholar]
- 18.Markram H et al. Reconstruction and simulation of neocortical microcircuitry. Cell 163, 456–492 (2015). [DOI] [PubMed] [Google Scholar]
- 19.Zeisel A et al. Brain structure. Cell types in the mouse cortex and hippocampus revealed by single-cell RNA-seq. Science 347, 1138–1142 (2015). [DOI] [PubMed] [Google Scholar]
- 20.Tasic B et al. Adult mouse cortical cell taxonomy revealed by single cell transcriptomics. Nat. Neurosci 19, 335–346 (2016). [DOI] [PMC free article] [PubMed] [Google Scholar]
- 21.Economo MN et al. Distinct descending motor cortex pathways and their roles in movement. Nature 10.1038/s41586-018-0642-9 (2017). [DOI] [PubMed] [Google Scholar]
- 22.Frazer S et al. Transcriptomic and anatomic parcellation of 5-HT3AR expressing cortical interneuron subtypes revealed by single-cell RNA sequencing. Nat. Commun 8, 14219 (2017). [DOI] [PMC free article] [PubMed] [Google Scholar]
- 23.Abellan A, Menuet A, Dehay C, Medina L & Rétaux S Differential expression of LIM-homeodomain factors in Cajal-Retzius cells of primates, rodents, and birds. Cereb. Cortex 20, 1788–1798 (2010). [DOI] [PubMed] [Google Scholar]
- 24.Kirischuk S, Luhmann HJ & Kilb W Cajal-Retzius cells: update on structural and functional properties of these mystic neurons that bridged the 20th century. Neuroscience 275, 33–46 (2014). [DOI] [PubMed] [Google Scholar]
- 25.Lein ES et al. Genome-wide atlas of gene expression in the adult mouse brain. Nature 445, 168–176 (2007). [DOI] [PubMed] [Google Scholar]
- 26.Sorensen SA et al. Correlated gene expression and target specificity demonstrate excitatory projection neuron diversity. Cereb. Cortex 25, 433–449 (2015). [DOI] [PubMed] [Google Scholar]
- 27.Harris KD & Shepherd GM The neocortical circuit: themes and variations. Nat. Neurosci 18, 170–181 (2015). [DOI] [PMC free article] [PubMed] [Google Scholar]
- 28.Oh SW et al. A mesoscale connectome of the mouse brain. Nature 508, 207–214 (2014). [DOI] [PMC free article] [PubMed] [Google Scholar]
- 29.Li N, Chen TW, Guo ZV, Gerfen CR & Svoboda K A motor cortex circuit for motor planning and movement. Nature 519, 51–56 (2015). [DOI] [PubMed] [Google Scholar]
- 30.Wang Q et al. Organization of the connections between claustrum and cortex in the mouse. J. Comp. Neurol 525, 1317–1346 (2017). [DOI] [PMC free article] [PubMed] [Google Scholar]
- 31.Zeng H et al. Large-scale cellular-resolution gene profiling in human neocortex reveals species-specific molecular signatures. Cell 149, 483–496 (2012). [DOI] [PMC free article] [PubMed] [Google Scholar]
- 32.Ayoub AE & Kostovic I New horizons for the subplate zone and its pioneering neurons. Cereb. Cortex 19, 1705–1707 (2009). [DOI] [PubMed] [Google Scholar]
- 33.Hoerder-Suabedissen A et al. Subset of cortical layer 6b neurons selectively innervates higher order thalamic nuclei in mice. Cereb. Cortex 28, 1882–1897 (2018). [DOI] [PMC free article] [PubMed] [Google Scholar]
- 34.Kim EJ, Juavinett AL, Kyubwa EM, Jacobs MW & Callaway EM Three types of cortical layer 5 neurons that differ in brain-wide connectivity and function. Neuron 88, 1253–1267 (2015). [DOI] [PMC free article] [PubMed] [Google Scholar]
- 35.He M et al. Strategies and tools for combinatorial targeting of GABAergic neurons in mouse cerebral cortex. Neuron 92, 555 (2016). [DOI] [PubMed] [Google Scholar]
- 36.Paul A et al. Transcriptional architecture of synaptic communication delineates GABAergic neuron identity. Cell 171, 522–539.e20 (2017). [DOI] [PMC free article] [PubMed] [Google Scholar]
- 37.Hilscher MM, Leâo RN, Edwards SJ, Leâo KE & Kullander K Chrna2-Martinotti Cells synchronize layer 5 type a pyramidal cells via rebound excitation. PLoS Biol 15, e2001392 (2017). [DOI] [PMC free article] [PubMed] [Google Scholar]
- 38.Cadwell CR et al. Electrophysiological, transcriptomic and morphologic profiling of single neurons using Patch-seq. Nat. Biotechnol 34, 199–203 (2016). [DOI] [PMC free article] [PubMed] [Google Scholar]
- 39.Tasic B, Levi BP & Menon V in Decoding Neural Circuit Structure and Function: Cellular Dissection Using Genetic Model Organisms (eds Çelik A & Wernet MF) 437–468 (Springer International Publishing, New York, 2017). [Google Scholar]
- 40.Hrvatin S et al. Single-cell analysis of experience-dependent transcriptomic states in the mouse visual cortex. Nat. Neurosci 21, 120–129 (2018). [DOI] [PMC free article] [PubMed] [Google Scholar]
- 41.Gao P et al. Deterministic progenitor behavior and unitary production of neurons in the neocortex. Cell 159, 775–788 (2014). [DOI] [PMC free article] [PubMed] [Google Scholar]
- 42.O’Leary DD, Chou SJ & Sahara S Area patterning of the mammalian cortex. Neuron 56, 252–269 (2007). [DOI] [PubMed] [Google Scholar]
- 43.Rakic P Specification of cerebral cortical areas. Science 241, 170–176 (1988). [DOI] [PubMed] [Google Scholar]
- 44.Vue TY et al. Thalamic control of neocortical area formation in mice. J. Neurosci 33, 8442–8453 (2013). [DOI] [PMC free article] [PubMed] [Google Scholar]
- 45.Chou SJ et al. Geniculocortical input drives genetic distinctions between primary and higher-order visual areas. Science 340, 1239–1242 (2013). [DOI] [PMC free article] [PubMed] [Google Scholar]
- 46.Yoshida M, Assimacopoulos S, Jones KR & Grove EA Massive loss of Cajal-Retzius cells does not disrupt neocortical layer order. Development 133, 537–545 (2006). [DOI] [PubMed] [Google Scholar]
- 47.Pedraza M, Hoerder-Suabedissen A, Albert-Maestro MA, Molnar Z & De Carlos JA Extracortical origin of some murine subplate cell populations. Proc. Natl Acad. Sci. USA 111, 8613–8618 (2014). [DOI] [PMC free article] [PubMed] [Google Scholar]
- 48.Lein E, Borm LE & Linnarsson S The promise of spatial transcriptomics for neuroscience in the era of molecular cell typing. Science 358, 64–69 (2017). [DOI] [PubMed] [Google Scholar]
- 49.Cong L et al. Multiplex genome engineering using CRISPR/Cas systems. Science 339, 819–823 (2013). [DOI] [PMC free article] [PubMed] [Google Scholar]
- 50.George SH et al. Developmental and adult phenotyping directly from mutant embryonic stem cells. Proc. Natl Acad. Sci. uSa 104, 4455–4460 (2007). [DOI] [PMC free article] [PubMed] [Google Scholar]
- 51.Raymond CS & Soriano P High-efficiency FLP and PhiC31 site-specific recombination in mammalian cells. PLoS One 2, e162 (2007). [DOI] [PMC free article] [PubMed] [Google Scholar]
- 52.Tervo DG et al. A designer AAV variant permits efficient retrograde access to projection neurons. Neuron 92, 372–382 (2016). [DOI] [PMC free article] [PubMed] [Google Scholar]
- 53.Chatterjee S et al. Nontoxic, double-deletion-mutant rabies viral vectors for retrograde targeting of projection neurons. Nat. Neurosci 21, 638–646 (2018). [DOI] [PMC free article] [PubMed] [Google Scholar]
- 54.Hnasko TS et al. Cre recombinase-mediated restoration of nigrostriatal dopamine in dopamine-deficient mice reverses hypophagia and bradykinesia. Proc. Natl Acad. Sci. USA 103, 8858–8863 (2006). [DOI] [PMC free article] [PubMed] [Google Scholar]
- 55.Paxinos G and Franklin KBJ Mouse Brain In Stereotaxic Coordinates 3rd edn (Academic Press, Cambridge, MA, 2008). [Google Scholar]
- 56.Sugino K et al. Molecular taxonomy of major neuronal classes in the adult mouse forebrain. Nat. Neurosci 9, 99–107 (2006). [DOI] [PubMed] [Google Scholar]
- 57.Hempel CM, Sugino K & Nelson SB A manual method for the purification of fluorescently labeled neurons from the mammalian brain. Nat. Protoc 2, 2924–2929 (2007). [DOI] [PubMed] [Google Scholar]
- 58.Ting JT, Daigle TL, Chen Q & Feng G Acute brain slice methods for adult and aging animals: application of targeted patch clamp analysis and optogenetics. Methods Mol. Biol 1183, 221–242 (2014). [DOI] [PMC free article] [PubMed] [Google Scholar]
- 59.Ramsköld D et al. Full-length mRNA-Seq from single-cell levels of RNA and individual circulating tumor cells. Nat. Biotechnol 30, 777–782 (2012). [DOI] [PMC free article] [PubMed] [Google Scholar]
- 60.Picelli S et al. Smart-seq2 for sensitive full-length transcriptome profiling in single cells. Nat. Methods 10, 1096–1098 (2013). [DOI] [PubMed] [Google Scholar]
- 61.Dobin A et al. STAR: ultrafast universal RNA-seq aligner. Bioinformatics 29, 15–21 (2013). [DOI] [PMC free article] [PubMed] [Google Scholar]
- 62.Lawrence M et al. Software for computing and annotating genomic ranges. PLOS Comput. Biol 9, e1003118 (2013). [DOI] [PMC free article] [PubMed] [Google Scholar]
- 63.Yao Z et al. A single-cell roadmap of lineage bifurcation in human ESC models of embryonic brain development. Cell Stem Cell 20, 120–134 (2017). [DOI] [PMC free article] [PubMed] [Google Scholar]
- 64.Shekhar K et al. Comprehensive classification of retinal bipolar neurons by single-cell transcriptomics. Cell 166, 1308–1323 (2016). [DOI] [PMC free article] [PubMed] [Google Scholar]
- 65.Fortunato S & Barthélemy M Resolution limit in community detection. Proc. Natl Acad. Sci. USA 104, 36–41 (2007). [DOI] [PMC free article] [PubMed] [Google Scholar]
- 66.Ritchie ME et al. limma powers differential expression analyses for RNA-sequencing and microarray studies. Nucleic Acids Res 43, e47 (2015). [DOI] [PMC free article] [PubMed] [Google Scholar]
- 67.Lamprecht MR, Sabatini DM & Carpenter AE CellProfiler: free, versatile software for automated biological image analysis. Biotechniques 42, 71–75 (2007). [DOI] [PubMed] [Google Scholar]
- 68.R Development Core Team. R: A Language and Environment for Statistical Computing (R Foundation for Statistical Computing, Vienna, 2018). [Google Scholar]
- 69.Galili T dendextend: an R package for visualizing, adjusting and comparing trees of hierarchical clustering. Bioinformatics 31, 3718–3720 (2015). [DOI] [PMC free article] [PubMed] [Google Scholar]
- 70.Wickham H ggplot2: Elegant Graphics for Data Analysis (Springer-Verlag, New York, 2009). [Google Scholar]
- 71.Law CW, Alhamdoosh M, Su S, Smyth GK & Ritchie ME RNA-seq analysis is easy as 1-2-3 with limma, Glimma and edgeR. F1000 Res 5, 1408 (2016). [DOI] [PMC free article] [PubMed] [Google Scholar]
- 72.Liaw A & Weiner M Classification and regression by randomForest. R News 2, 18–22 (2002). [Google Scholar]
- 73.Macosko EZ et al. Highly parallel genome-wide expression profiling of individual cells using nanoliter droplets. Cell 161, 1202–1214 (2015). [DOI] [PMC free article] [PubMed] [Google Scholar]
- 74.Langfelder P & Horvath S WGCNA: an R package for weighted correlation network analysis. BMC Bioinformatics 9, 559 (2008). [DOI] [PMC free article] [PubMed] [Google Scholar]
- 75.Linderman GC, Rachh M, Hoskins JG, Steinberberger S & Kluger Y Efficient algorithms for t-distributed stochastic neighborhood embedding Preprint at https://arXiv.org/abs/1712.09005 (2017).
- 76.Hevner RF, Neogi T, Englund C, Daza RA & Fink A Cajal-Retzius cells in the mouse: transcription factors, neurotransmitters, and birthdays suggest a pallial origin. Brain Res. Dev. Brain Res 141, 39–53 (2003). [DOI] [PubMed] [Google Scholar]
- 77.Cahoy JD et al. A transcriptome database for astrocytes, neurons, and oligodendrocytes: a new resource for understanding brain development and function. J. Neurosci 28, 264–278 (2008). [DOI] [PMC free article] [PubMed] [Google Scholar]
- 78.Marques S et al. Oligodendrocyte heterogeneity in the mouse juvenile and adult central nervous system. Science 352, 1326–1329 (2016). [DOI] [PMC free article] [PubMed] [Google Scholar]
- 79.Zhang Y et al. An RNA-sequencing transcriptome and splicing database of glia, neurons, and vascular cells of the cerebral cortex. J. Neurosci 34, 1192911947 (2014). [DOI] [PMC free article] [PubMed] [Google Scholar]
- 80.Kopatz J et al. Siglec-h on activated microglia for recognition and engulfment of glioma cells. Glia 61, 1122–1133 (2013). [DOI] [PubMed] [Google Scholar]
- 81.Bennett ML et al. New tools for studying microglia in the mouse and human CNS. Proc. Natl Acad. Sci. USA 113, E1738–E1746 (2016). [DOI] [PMC free article] [PubMed] [Google Scholar]
- 82.Armulik A, Genové G & Betsholtz C Pericytes: developmental, physiological, and pathological perspectives, problems, and promises. Dev. Cell 21, 193–215 (2011). [DOI] [PubMed] [Google Scholar]
- 83.Bondjers C et al. Microarray analysis of blood microvessels from PDGF-B and PDGF-Rß mutant mice identifies novel markers for brain pericytes. FASEB J 20, 1703–1705 (2006). [DOI] [PubMed] [Google Scholar]
- 84.Campbell JN et al. A molecular census of arcuate hypothalamus and median eminence cell types. Nat. Neurosci 20, 484–496 (2017). [DOI] [PMC free article] [PubMed] [Google Scholar]
- 85.Groh A et al. Cell-type specific properties of pyramidal neurons in neocortex underlying a layout that is modifiable depending on the cortical area. Cereb. Cortex 20, 826–836 (2010). [DOI] [PubMed] [Google Scholar]
- 86.Harris JA et al. Anatomical characterization of Cre driver mice for neural circuit mapping and manipulation. Front. Neural Circuits 8, 76 (2014). [DOI] [PMC free article] [PubMed] [Google Scholar]
- 87.Taniguchi H, Lu J & Huang ZJ The spatial and temporal origin of chandelier cells in mouse neocortex. Science 339, 70–74 (2013). [DOI] [PMC free article] [PubMed] [Google Scholar]
Associated Data
This section collects any data citations, data availability statements, or supplementary materials included in this article.
Supplementary Materials
Data Availability Statement
Single-cell transcriptomic data are available at the N CBI Gene Expression Omnibus (GEO) under accession GSE115746. Summary of all transcriptomic types and markers is available in Supplementary Table 9. Full metadata for all samples are available in Supplementary Table 10. Newly generated mouse lines have been deposited to the Jackson Laboratory: Vipr2-IRES2-cre (JAX stock number 031332), Slc17a8-IRES2-cre (JAX stock number 028534), Penk-IRES2-cre-neo (JAX stock number 025112).


