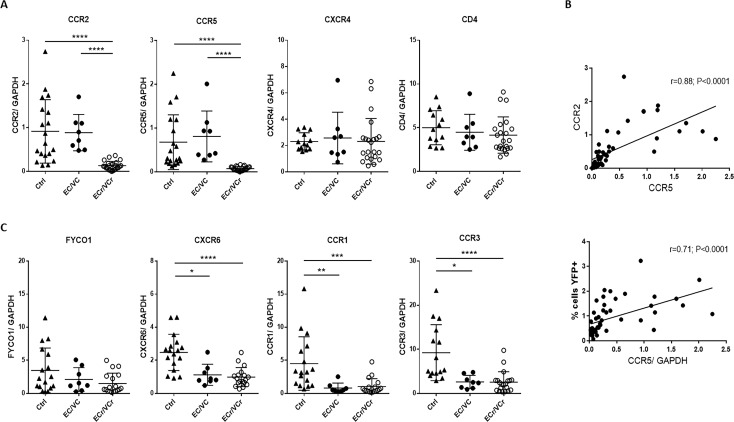
Figure 2. Decreased mRNA levels of several chromosomal three genes in ECr/VCrs.
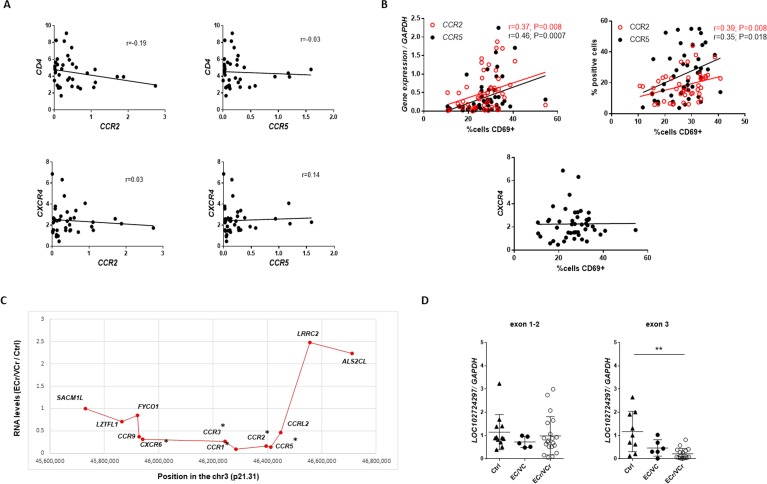
(A) Decreased ccr2/ccr5 RNA levels in activated CD4 +T cells from EC/VCs with the resistance phenotype, with comparable cxcr4 and cd4 RNA levels in all groups. Shown are individual values with Means ± SD. Pooled results from different experiments are shown with representative samples per group, n = 19 (Ctrl), n = 8 (EC/VC) and n = 21 (ECr/VCr) per group. (B) Positive correlation between ccr2 and ccr5 RNA levels in activated CD4 +T cells. ccr5 RNA levels positively correlated with % of YFP +infected cells by single cycle assay using R5-tropic viruses but not with cd4 or cxcr4 (Figure 2—figure supplement 1A). (C) Decreased RNA levels in multiple chromosomal 3p21 genes in T cells of HIV +infected individuals (Figure 2—figure supplement 1C). Statistical analysis performed using Kruskal-Wallis test and Dunn’s multiple-comparison test. r value calculated using the non-parametric Spearman correlation test. Graphs show individual values with Means ± SD. *p<0.05; **p<0.01; ***p<0.001; ****p<0.0001.


