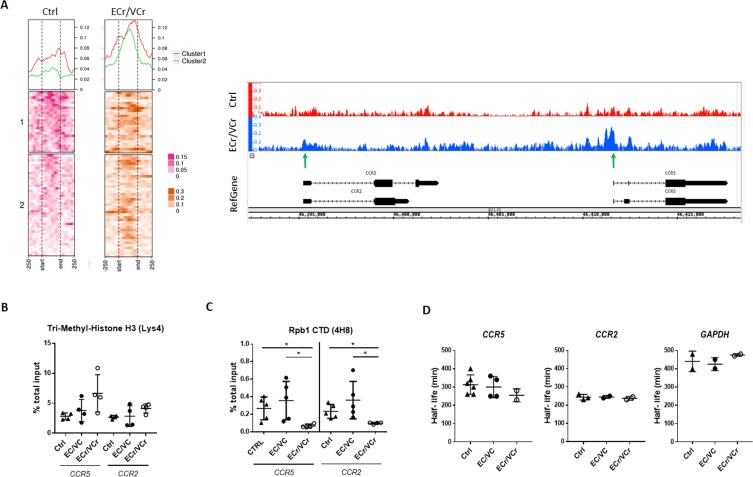
Figure 6. Increased chromatin accessibility and lower active transcription in activated CD4 +T cells from ECr/VCr.
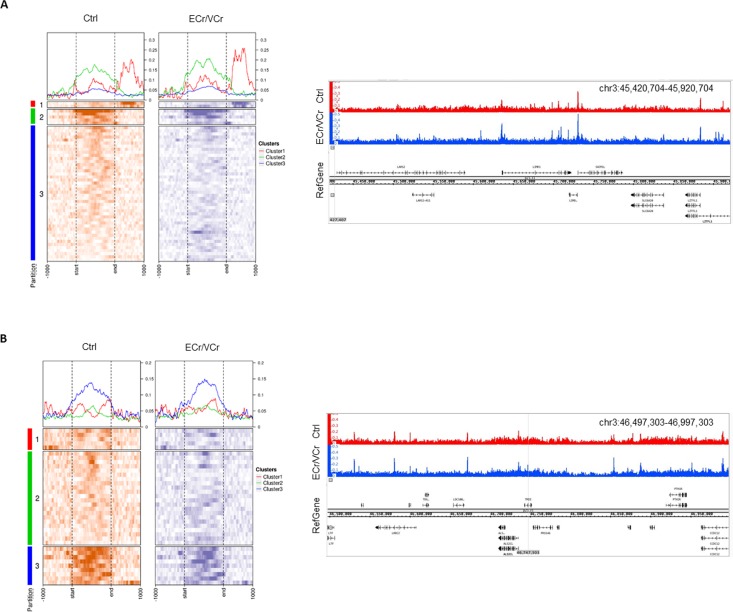
(A) Left panel: ATAC-Seq coverage profiles of region of chr 3p21 (45,920,704-46,497,303) of ECr/VCr CD4 +T cells, compared to those of Ctrl (n = 4 replicates per group). Heat map showing gene TSS aligned, with a window of −250 bp to +250 bp, calculated as a normalized coverage around each TSS. Matrix was divided it into two clusters, based upon Ctrl data. At top is average coverage profile for each of the clusters (cluster one in red and cluster two in green). Right panel: ATAC-Seq peaks of chr 3p21 (46,392,331-46,418,348) of ECr/VCr vs Ctrl visualized using Integrated Genome Browser (IGB), see also Figure 6—figure supplement 1. Green arrows highlight increased peaks near the TSS of both genes, ccr2/ccr5, in ECr/VCr relative to Ctrl. (B–C) ChIP-qPCR, using either Tri-Methyl-Histone H3 (Lys4) (B) or Rpb1 (C) antibodies, with ccr2 and ccr5 DNA quantified by qPCR. Data normalized by the % total input DNA. Shown are Means ± SD (n = 4 and n = 5 per group in B and C, respectively), with statistical analysis performed using Kruskal-Wallis with Dunn’s multiple-comparison test. *p<0.05. (D) Quantitation of mRNA half-lives of indicated genes in activated CD4 +T cells, using Act D as a transcription inhibitor. T cells were incubated with Act D and harvested (from time 0 to 8 hr). RNA was extracted, and RNA levels quantified by RT-qPCR and half-life calculated using GraphPad PRISM software.


