

SUMMARY
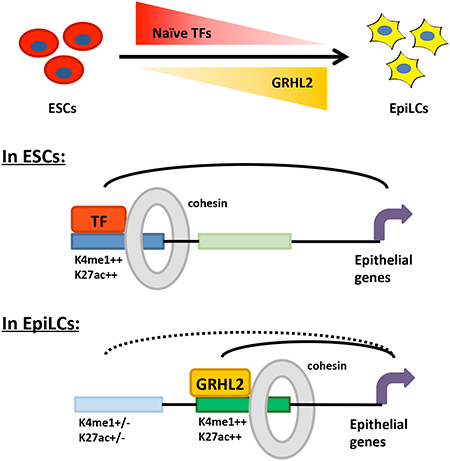
The enhancer landscape of pluripotent stem cells undergoes extensive reorganization during early mammalian development. The functions and mechanisms behind such reorganization, however, are unclear. Here, we show the transcription factor GRHL2 is necessary and sufficient to activate an epithelial subset of enhancers as naïve embryonic stem cells (ESCs) transition into formative epiblast-like cells (EpiLCs). Surprisingly, many GRHL2 target genes do not change in expression during the ESC-EpiLC transition. Instead, enhancers regulating these genes in ESCs diminish in activity in EpiLCs while GRHL2-dependent alternative enhancers become activated to maintain transcription. GRHL2 therefore assumes control over a subset of the naive network via enhancer switching to maintain expression of epithelial genes upon exit from naive pluripotency. These data evoke a model where the naïve pluripotency network becomes partitioned into smaller, independent networks regulated by EpiLC-specific transcription factors, thereby priming cells for lineage specification.
Keywords: naïve pluripotency, formative pluripotency, early mammalian development, gene regulation, transcriptional control, enhancer regulation, epigenetics
Graphical Abstract
INTRODUCTION
During mammalian development, pluripotent cells that have the ability to generate all cells of an organism arise with formation of the early epiblast at the time of implantation (Nichols and Smith, 2012; Rossant and Tam, 2009). Following implantation, epiblast cells undergo epigenetic, gene expression and morphological changes, while remaining pluripotent (Bedzhov and Zernicka-Goetz, 2014; Boroviak et al., 2015; Hayashi et al., 2011; Nakamura et al., 2016; Rastan, 1982). In mice, this transition from pre-implantation to post-implantation epiblast can be reproduced in vitro with the differentiation of ESCs to EpiLCs (Buecker et al., 2014; Hayashi et al., 2011; Krishnakumar et al., 2016). Reporter systems distinguishing the two cell states have enabled near homogeneous reproduction of this transition (Buecker et al., 2014; Krishnakumar et al., 2016; Parchem et al., 2014).
ESCs maintained in the presence of LIF cytokine and inhibitors to GSKβ and MEK (2i) are transcriptionally similar to cells of the E4.5 pre-implantation epiblast and are commonly called naïve ground state pluripotent stem cells (Boroviak et al., 2015; Nichols and Smith, 2009). EpiLCs arise during ESC differentiation two to three days following removal of 2i+LIF, with or without addition of FGF2 and Activin (Buecker et al., 2014; Hayashi et al., 2011; Krishnakumar et al., 2016). EpiLCs are transcriptionally similar to cells of the E5.5 post-implantation epiblast and have been called primed pluripotent cells as they represent a homogenous population of cells that are about to undergo lineage specification with the initiation of gastrulation (Hayashi et al., 2011; Nakamura et al., 2016). However, more recently they have been renamed formative pluripotent cells to differentiate them from primed epiblast stem cells (EpiSCs) (Smith, 2017), which more closely resemble anterior primitive streak cells in vivo (Kojima et al., 2014). The ESC to EpiLC transition provides a rare opportunity to study the molecular basis of an in vivo transition in vitro at near homogeneity.
The transition from naïve to formative pluripotency involves extensive epigenetic remodeling as cells prepare for lineage specification. Previous epigenetic studies in this transition have focused on changes in global DNA methylation levels, transcription factor (TF) localization and enhancer histone states (Auclair et al., 2014; Borgel et al., 2010; Buecker et al., 2014; Krishnakumar et al., 2016). However, enhancer activation also involves recruitment of architectural proteins such as the mediator and cohesin complexes (Kagey et al., 2010). Since enhancers can typically be located anywhere between 1kb-1Mb from their target gene promoters (Calo and Wysocka, 2013), these complexes play a central role in anchoring 3D physical interactions between enhancers and their target gene promoters to drive gene expression (Kagey et al., 2010; Phillips-Cremins et al., 2013). Given the key role of these architectural proteins in regulating enhancer activity, we aimed to identify mechanisms regulating changes in enhancer activity during the naïve to formative transition by examining changes in cohesin localization.
Here, we identify Grainyhead-like 2 (GRHL2) as a TF associated with cohesin localization during differentiation from ESCs to EpiLCs. GRHL2 activates new enhancers in EpiLCs to maintain expression of target genes. Interestingly, many GRHL2 target genes are already expressed in ESCs and are located near alternative ESC enhancers that are becoming inactivated in EpiLCs. Enhancer deletion experiments confirm that these genes switch from regulation by an ESC enhancer to a GRHL2-regulated enhancer during differentiation. These targets are enriched for epithelial and cell adhesion genes. Accordingly, GRHL2 loss results in an epithelial to mesenchymal-like transition (EMT) in EpiLCs, but not ESCs. These findings show that GRHL2 assumes regulation of a subset of the larger naive network during differentiation to the formative state to maintain expression of an epithelial program that is characteristic of both naïve and formative pluripotency, as well as certain downstream lineages. We propose a model in which the large naïve pluripotency network becomes partitioned into smaller networks that become regulated by distinct EpiLC TFs in the formative state, allowing them to be differentially regulated upon gastrulation.
RESULTS
OTX2 and GRHL2 motifs are associated with cohesin relocalization during the ESC to EpiLC transition
To follow changes in enhancer activation during the ESC to EpiLC transition, we used a previously established differentiation system where naïve ESCs are differentiated into a near homogeneous population of formative EpiLCs (Krishnakumar et al., 2016). Principal component analysis of the expression profiles of these in vitro cell populations with those in the pre- and post-implantation epiblast showed that our ESCs and EpiLCs closely resemble their in vivo counterparts (Figure S1A). Using this system, we examined cohesin localization in the two states by performing ChIP-seq for the cohesin core subunit SMC1 and identifying SMC1 binding sites relative to an IgG control. We identified 10,705 ESC sites and 12,690 EpiLC sites using the MACS2 software package with a FDR < 0.05 (Zhang et al., 2008). Cohesin is found at insulator regions as well as enhancers (Kagey et al., 2010). To enrich for enhancers in our analyses, we depleted insulator sites by removing all sites co-bound by CTCF, a protein that is enriched at insulators and has relatively constant binding sites between cell types (Kim et al., 2007). Following subtraction of these sites (identified in Kagey et al., 2010), there remained 5160 SMC1-bound sites in ESCs and 5563 sites in EpiLCs, with many of these sites being distinct in the two states (Figure 1A, Table S1).
Figure 1. ChIP-seq for SMC1 identifies candidate TFs that regulate cohesin relocalization during the ESC to EpiLC transition.

A) Left: SMC1 signal at ESC-specific, EpiLC-specific, and common SMC1 sites called with MACS2 (FDR<0.05). To deplete insulators, sites co-bound by CTCF are not included. RPM = reads per million. Right: Venn diagram showing overlap of SMC1 sites in ESCs and EpiLCs. We identified 2955 ESC-specific, 3358 EpiLC-specific, and 2205 common SMC1 sites. B) SMC1 ChIP-seq tracks at Esrrb and Fgf5 genomic loci, with blue bars indicating significant differential peaks between ESCs and EpiLCs as called by MACS2. C) Top transcription factor motifs enriched at EpiLC-specific SMC1 sites, using all ESC SMC1 sites as a background. D) Expression fold change in EpiLCs vs ESCs for top 5 transcription factor candidates as quantified by qPCR. Error bars represent standard deviation of n=3 biological replicates. p <0.05 for OTX2 and GRHL2 by student t-test.
Esrrb and Fgf5 represent genes that are specifically expressed in ESCs and EpiLCs respectively. Therefore, we examined the genomic regions surrounding Esrrb and Fgf5 during this transition (Figure 1B). In the region surrounding the naïve marker, Esrrb, there were several SMC1 binding sites that were significantly enriched in ESCs relative to EpiLCs based on differential peak calling using MACS2. Conversely, there was an SMC1 binding site that was significantly enriched in EpiLCs relative to ESCs near Fgf5, a gene highly up-regulated in the formative state. Together, these results suggest that our SMC1 ChIP-seq data reflect changing enhancer activity and that cohesin binding at enhancers is highly dynamic during the ESC to EpiLC transition.
Cohesin has no known sequence specificity and therefore is likely recruited either directly or indirectly to its binding sites by sequence-specific TFs. To identify candidate TFs that may recruit cohesin, we performed a motif enrichment analysis on the EpiLC-specific SMC1 peaks using the Homer software package (Heinz et al., 2010). This analysis uncovered several motifs that were enriched in EpiLC-specific sites relative to the ESC-specific and common SMC1 sites. One of these enriched motifs was the binding motif for the TF OTX2 (Figure 1C). Otx2 is up-regulated during the ESC to EpiLC transition and plays an important role in re-localizing OCT4 (Buecker et al., 2014). Quantitative RT-PCR confirmed the up-regulation of Otx2 during this transition (Figure 1D). The motif for another TF, GRHL2, was also highly enriched in the EpiLC SMC1 peaks and GRHL2 showed an almost 10-fold increase in expression with the ESC to EpiLC transition. GRHL2 belongs to the Grainyhead-like family of TFs, composed of GRHL1–3, which have partially redundant roles in development (Boglev et al., 2011; Rifat et al., 2010). Unlike Grhl2, Grhl3 is down-regulated during ESC differentiation, although relatively low in both states (Figure S1B). Grhl1 is not expressed during this window. These findings identify GRHL2 as a potential regulator of enhancer activity during the ESC to EpiLC transition.
GRHL2 binding correlates with nucleosome removal, acquisition of active histone marks, and cohesin binding
Given the strong enrichment of the GRHL2 motif at EpiLC-specific SMC1 peaks, we next asked whether GRHL2 is binding these sites and, if so, what epigenetic events are associated with GRHL2 binding. To identify GRHL2 binding sites, we performed ChIP-seq for the endogenous GRHL2 protein in wildtype EpiLCs as well as GRHL2 KO EpiLCs as a background control. GRHL2 KO EpiLCs were generated by CRISPR targeting of exon 2 of the Grhl2 gene to generate stable knockout ESC lines, and then differentiating the ESCs into EpiLCs. Homozygous null GRHL2 clones were identified by sequencing of the targeted region and western blot analysis (Figure S1C). When using an IgG ChIP in wildtype EpiLCs as a background control, we identified 1686 significant GRHL2 peaks (FDR < 0.05), with about 60% of these sites containing a canonical GRHL2 motif. However, when using a GRHL2 ChIP in GRHL2 KO EpiLCs rather than IgG as the background control, we identified 332 peaks, with 86% containing a canonical GRHL2 binding motif (Table S2). The ChIP signal intensities at these peaks across two biological replicates were highly correlated (Spearman’s correlation = 0.90, Figure 2A). Due to the much higher enrichment for the GRHL2 motif at peaks identified using GRHL2 KO cells as the background control, these sites were used in all further downstream analysis, although the same trends were observed with all peaks identified relative to IgG that contain the GRHL2 motif, as shown in matching supplemental figures.
Figure 2. GRHL2 binding correlates with nucleosome removal and full enhancer activation.

A) Average GRHL2 ChIP-seq signal for a 200bp window surrounding GRHL2 sites in replicate 1 vs replicate 2, plotted as reads per million. Spearman’s correlation = 0.90 B) Genome annotation of GRHL2 binding sites defined by UCSC mouse genome annotation v5.4. C) Heatmaps at EpiLC GRHL2 sites for enhancer marks in ESCs and EpiLCs. All plots are shown for an 8kb window centered at GRHL2 binding sites. Sites are shown in descending order based on mean GRHL2 ChIP signal intensity. D) Metagene analysis of average signal across GRHL2 sites for heatmaps shown in (C). All plots are shown for an 8000bp window centered at GRHL2 binding sites. RPM = reads per million. K4me1 p = 1.36E-41; K27ac p = 6.80E-15; SMC1 p = 3.73E-34; ATAC-seq p = 2.78E-65 (paired t-test).
Genomic annotation of GRHL2 binding sites showed that GRHL2 binds primarily at intergenic and intronic regions, consistent with a predominant regulatory role at enhancers as opposed to promoters (Figure 2B). This was further supported by the low levels of the promoter histone mark, H3K4me3, at GRHL2 sites relative to active promoters (Figure S1D). Next, we asked what epigenetic changes occur with GRHL2 binding to these enhancer sites. Along with our SMC1 ChIP-seq data, we evaluated published H3K4me1 and H3K27ac ChIP-seq data performed under identical culture conditions (Krishnakumar et al., 2016). We also performed ATAC-seq to measure changes in nucleosome occupancy. A low ATAC-seq signal represents a nucleosome-occluded site, while high signal represents the removal of nucleosomes (Buenrostro et al., 2013). Active enhancers were identified by the combination of high ATAC-seq, high SMC1, and high flanking H3K4me1 and H3K27ac signal (Buenrostro et al., 2013; Creyghton et al., 2010; Kagey et al., 2010; Rada-Iglesias et al., 2011). In ESCs, future GRHL2 sites showed low levels of all active enhancer marks, including low ATAC-seq and absence of H3K4me1, H3K27ac, and SMC1 signal, indicating that these enhancers have little to no activity in ESCs (Figures 2C and D). In contrast, upon GRHL2 binding during the ESC to EpiLC transition, the same sites gained all marks of fully activated enhancers (high ATAC signal, H3K4me1, H3K27ac, and SMC1). This difference between ESCs and EpiLCs was diminished with increasingly lower confidence GRHL2 binding sites (Figure S1E – IgG background with motif, Figure S1F – IgG background without motif). Our findings were corroborated by H3K4me1 and H3K27ac ChIP-seq data from an alternative naïve-to-formative differentiation system (Figure S1G and H; Buecker et al. 2014). As a control, we found little change in these marks at SMC1 sites common to both states (Figure S1I). These results indicate that GRHL2 binding correlates with full enhancer activation, suggesting a role for GRHL2 not only in regulation of cohesin binding, but also in regulation of other crucial steps in enhancer activation.
GRHL2 is necessary and sufficient for full enhancer activation
Given the strong association between GRHL2 binding and various events in enhancer activation, we asked whether GRHL2 binding is necessary for each of these events. To address this question, we assessed levels of each active enhancer mark in wildtype and GHRL2 KO EpiLCs by performing ATAC-seq and ChIP-seq for H3K4me1, H3K27ac, and SMC1. There was a strong reduction in all active enhancer marks (chromatin accessibility, H3K4me1, H3K27ac, and SMC1 levels) at GRHL2 sites in GRHL2 KO EpiLCs, suggesting a near complete block in enhancer activation in the absence of GRHL2 (Figure 3A and B). These effects were diminished with increasingly lower confidence GRHL2 binding sites (Figure S2A – IgG background with motif, Figure S2B – IgG background without motif). Loss of GRHL2 also did not change levels of these marks at other cohesin sites gained during differentiation into EpiLCs (Figure S2C). Furthermore, the loss of marks was not secondary to a defect in differentiation, as common naïve and formative markers were expressed at levels indistinguishable from wild-type during differentiation to EpiLCs (Figure S2D). Together, these results indicate an absolute requirement for GRHL2 for enhancer activation specifically at its target sites.
Figure 3. GRHL2 is necessary and sufficient for full enhancer activation.

A) Metagene analysis of average signal across GRHL2 sites in GRHL2 knockout and wildtype (V6.5) EpiLCs. All plots are shown for an 8000bp window centered at GRHL2 binding sites. RPM = reads per million. K4me1 p = 8.79167E-50; K27ac p = 1.77148E-52; SMC1 p = 3.08123E-40; ATAC: p = 7.13881E-72 (paired t-test). B) Heatmaps at GRHL2 sites for enhancer marks in GRHL2 knockout and wildtype (V6.5) EpiLCs. All plots are shown for an 8kb window centered at GRHL2 binding sites. Sites are shown in descending order based on mean GRHL2 ChIP signal intensity. C) Fraction of endogenous GRHL2 binding sites in EpiLCs that are bound by GRHL2 overexpression in ESCs (GRHL2 sites bound). D) Metagene analysis of average signal across endogenous GRHL2 sites that are ectopically bound in GRHL2 overexpressing ESCs in untargeted (WT) cells and dox-inducible GRHL2 ESCs, both treated with doxycycline. RPM = reads per million. K4me1 p = 1.56194E-45; K27ac p = 3.69415E-24; SMC1 p = 1.0148E-34 (paired t-test). E) Heatmaps showing all individual loci in (D). All plots are shown for an 8kb window centered at GRHL2 binding sites. Sites are shown in descending order based on mean GRHL2 ChIP signal intensity.
Since GRHL2 binding sites are nucleosome-occluded in ESCs and lack all marks of enhancer activity, the full activation associated with GRHL2 binding suggests it is able to access closed chromatin to activate target enhancers during differentiation. If true, ectopic expression of GRHL2 in ESCs should be sufficient to fully activate these enhancers. To test this, we generated two independent ESC lines containing Rosa26-M2rtTA and a doxycycline-inducible HA-tagged Grhl2 in the ColA1 locus (Figure S3A and B) (Beard et al., 2006). When treated with doxycycline, this resulted in a 60-fold overexpression of HA-tagged Grhl2 in ESCs relative to endogenous EpiLC levels (Figure S3C). We performed ChIP-seq for HA and active enhancer marks (H3K4me1, H3K27ac, and SMC1) in untargeted and dox-inducible HA-GRHL2 ESCs, both treated with doxycycline for 24 hours. The ectopically expressed GRHL2 protein was able to access and bind most endogenous GRHL2 EpiLC sites (Figure 3C, Table S3). These sites gained high levels of active enhancer marks (H3K4me1, H3K27ac, and SMC1) and had a marked depletion of nucleosomes at the center of histone peaks, indicative of an active enhancer state (Figure 3D and E). Ectopic GRHL2 bound numerous additional ectopic sites, likely due to the high levels of expression associated with doxycycline induction. Interestingly, these ectopic sites also gained high levels of active enhancer marks with ectopic GRHL2 binding (Figure S3D), further supporting the ability of GRHL2 to access closed chromatin and fully activate target sites. To determine whether these results could be explained by differentiation of cells overexpressing GRHL2, we measured changes in expression of canonical naïve and formative markers with 24-hour induction of GRHL2 expression in ESCs. We confirmed that there were minimal or no changes in expression of these markers, except for a 5-fold increase in the formative marker, Dnmt3b (Figure S3E). The increase in Dnmt3b is likely due to direct regulation by GRHL2 as it is also significantly down-regulated in EpiLCs upon GRHL2 loss (Figure S2D). Together, these results show that GRHL2 is not only necessary, but also sufficient to bind and fully activate latent enhancers.
GRHL2-regulated genes are similarly expressed during the transition from naïve to formative pluripotency
Our finding that GRHL2 activates latent enhancers suggested that GRHL2 functions in transcriptional activation of its target genes. Therefore, we evaluated expression of predicted GRHL2 targets during the transition from ESCs to EpiLCs. Recent high-resolution chromatin interaction analyses in ESCs supports the use of nearest neighbor as an approximation of enhancer-target gene pairs at the genome-wide level, even though many exceptions occur at the individual gene level (Dowen et al., 2014; Schoenfelder et al., 2015). Studies have also shown that TAD boundaries restrict enhancer activity to genes within the same TAD (Dowen et al., 2014; Ji et al., 2016). Therefore, we assigned enhancers to target genes that were the nearest gene within the same TAD. We used TAD boundaries previously identified in ESCs. These TAD boundaries were shown to be generally stable across different cell types (Dixon et al., 2012). The median distance between GRHL2-bound enhancers and the nearest gene within the same TAD was 27kb, well within the range for a typical enhancer-promoter interaction (Figure S4A, Table S4) (Calo and Wysocka, 2013; Dowen et al., 2014). To evaluate if GRHL2 drives expression of its predicted target genes, we performed expression profiling of 4 independent clones of wild-type and GRHL2 KO EpiLCs. Hierarchical clustering analysis separated GRHL2 KO from wildtype EpiLCs, showing a significant impact of GRHL2 loss on the transcriptome of these cells (Figure S4B). With GRHL2 loss, a similar number of genes were significantly up- and down-regulated (1016 genes up and 1020 genes down with adjusted p-value < 0.05), likely representative of both direct and indirect effects (Figure 4A, Table S5). Seventeen percent of the predicted GRHL2 gene targets were significantly changed upon GRHL2 loss. The predicted gene targets showing little to no change in expression could be due to any combination of incorrect target prediction, lack of probes that reliably detect these genes on the Illumina Bead array, and redundancy in gene regulation with other transcription factors. For those genes that did significantly change upon GRHL2 loss, over 80% were down-regulated, consistent with GRHL2 being a transcriptional activator (Figure 4A).
Figure 4. GRHL2 target genes are similarly expressed during the ESC to EpiLC transition and are regulated by distinct enhancers in ESCs.

A) Boxplots of expression changes in GRHL2 KO vs WT EpiLCs for all significantly changed genes (with adjusted p <0.05) relative to all significantly changed genes nearest to GRHL2 sites, indicating a relative down-regulation of GRHL2 targets in GRHL2 KO cells (p = 1.195E-9 by Mann-Whitney-Wilcoxon test). B) Boxplots showing distribution of expression for all candidate GRHL2 target genes in ESCs and EpiLCs based on RNA-seq data. CPM = counts per million. C) Boxplots of the log2 fold change in expression in EpiLCs vs ESCs for all genes, candidate GRHL2 target genes based on nearest neighboring gene within the same TAD, verified GRHL2 targets based on down-regulation in GRHL2 KO cells, and candidate targets of EpiLC-enriched SMC1 sites. EpiLC-enriched SMC1 sites were identified relative to ESC SMC1 sites using bdgdiff in MACS2. * indicates p <0.05 and *** indicates p < 0.005 by students t-test. D) Pie chart showing percentage of GRHL2 target genes in EpiLCs that are nearest to an alternative active enhancer in ESCs. E) Heatmaps for enhancer marks in ESCs and EpiLCs at the alternative ESC enhancers in (D). All plots are shown for an 8kb window centered on the enhancer site. Note that multiple alternative enhancers exist per GRHL2 target, resulting in 1009 alternative enhancers total. F) Metagene analysis showing average signal for the heatmaps shown in (E). A significant decrease in the levels of each active enhancer mark is observed (ATAC p = 2.59E-25; K4me1 p = 6.07E-09; K27ac p=3.30E-59; SMC1 p=5.50E-18 by paired t-test). All plots are shown for an 8kb window centered at the enhancer sites. RPM = reads per million.
Surprisingly, despite our results showing that GRHL2 activates latent enhancers and positively regulates expression of a number of its candidate target genes, we found that predicted GRHL2 targets were already expressed in ESCs at similar levels to EpiLCs (Figure 4B). While there was a slight average up-regulation of predicted GRHL2 targets relative to all genes during the ESC to EpiLC transition, the magnitude of up-regulation of GRHL2 targets was significantly less than the up-regulation observed for all genes nearest to EpiLC-enriched SMC1 binding sites. This remained true when focusing only on predicted GRHL2 targets that were significantly down-regulated with GRHL2 loss in EpiLCs (Figure 4C). The fact that there was a down-regulation of GRHL2 targets in EpiLCs but little change in expression during the ESC-to-EpiLC transition suggested alternative mechanisms of regulation of these genes in ESCs. Using quantitative RT-PCR, we confirmed that GRHL2 targets that are significantly down-regulated with GRHL2 loss in EpiLCs are regulated independently of GRHL2 in ESCs (Figure S4C and D). Together, these findings indicate that many GRHL2 target genes are positively regulated by GRHL2 in EpiLCs, but show little change in the ESC to EpiLC transition, suggesting that they are regulated by other transcription factors in ESCs.
GRHL2-regulated genes are controlled by distinct enhancers in ESCs and undergo an enhancer switch during differentiation to EpiLCs
Given that GRHL2-induced enhancer activation during the ESC to EpiLC transition was required for transcriptional maintenance of neighboring genes rather than transcriptional activation, we next asked whether expression of these genes was driven by alternative enhancers in ESCs. To identify potential alternative enhancers that drive expression of GRHL2 target genes in ESCs, we looked for active enhancers in ESCs that are likely associated with these genes based on the enhancer having a GRHL2 target gene as the nearest gene within the same TAD (Figure S4E). We identified active ESC enhancers based on the presence of a significant ATAC-seq peak (FDR < 0.05) marked by both H3K4me1 and H3K27ac. We found such enhancers near 67% of predicted GRHL2 target genes, and almost all of these were at least 1kb away from the GRHL2-bound site (Figure 4D, Table S6). These potential alternative ESC enhancers were a median distance of 42kb away from the GRHL2 target gene (Figure S4F). Upon differentiation into EpiLCs, these enhancers exhibited small but significant decreases in ATAC-seq signal, H3K4me1, and SMC1, along with a marked reduction in H3K27ac, consistent with the enhancers becoming inactivated during the transition (Figure 4E and F). Indeed, H3K27ac is generally thought to be one of the first marks lost during enhancer inactivation (Bogdanovic et al., 2012; Bonn et al., 2012). Since GRHL2-bound enhancers are becoming activated as these alternative ESC enhancers are becoming inactivated, these findings suggest that GRHL2-regulated genes undergo a switch in enhancer usage during the ESC to EpiLC transition, typically maintaining rather than altering gene expression.
To identify candidate TFs that regulate the predicted alternative ESC enhancers, we used Homer to identify enriched sequence motifs at these sites. The top hits included numerous pluripotency TF motifs (Figure 5A). Particularly intriguing was a motif common to several KLF TFs (KLF4, KLF5, EKLF). The KLF TFs are rapidly downregulated as naïve ESCs transition to the EpiLCs (Figure S2D). Using available KLF4 ChIP-seq data in ESCs grown in similar culture conditions (LIF+2i) (Liu et al., 2017), we found that 30% of GRHL2 targets in EpiLCs are the nearest neighbor to a KLF4-bound enhancer in ESCs (Figure 5B, Table S6). The median distance between the KLF4-bound enhancer and GRHL2 target promoter was about 29kb (Figure S5A). Almost all of these KLF4-bound enhancers were at least 1kb away from the GRHL2 enhancer sites, indicating that they are distinct enhancers. These enhancers showed reduced H3K4me1, H3K27ac and SMC1 during differentiation, consistent with their inactivation just as the GRHL2 bound sites become activated (Figure 5C and D).
Figure 5. Pluripotency transcription factors are enriched at alternative ESC enhancers near GRHL2 targets.

A) Motif analysis at the alternative enhancers for GRHL2 targets in ESCs to identify candidate TF motifs that are enriched at these sites. B) Pie chart showing percentage of GRHL2 target genes in EpiLCs that are nearest to a KLF4-bound site in ESCs. KLF4 binding sites at promoters were excluded to enrich for enhancers. C) Heatmaps for enhancer marks in ESCs and EpiLCs at ESC KLF4 sites that have a GRHL2 target as its nearest gene. All plots are shown for an 8kb window centered at KLF4 binding sites. D) Metagene analysis showing average signal for the heatmaps in (C). A significant decrease in signal in the EpiLC state was observed for each enhancer mark except for ATAC-seq signal. (K4me1 p = 2.81E-3; K27ac p = 4.83E-12; SMC1 p = 1.87E-10).
To further test whether GRHL2 targets are regulated by the KLF TFs in ESCs, we generated double knockout (DKO) ESCs for KLF2 and KLF4 (Figure S5B). However, RNA-seq analysis showed that while many of these targets were changed in expression, there were a similar number that were up-regulated and down-regulated (Figure S5C). The lack of preferential down-regulation of GRHL2 targets could be a result of secondary effects from the constitutive nature of the knockouts, as well as compensation by other KLF proteins. Therefore, we decided to take an alternative approach and directly delete the enhancer binding sites for GRHL2 and KLF4 at several of the target genes.
To delete the TF binding sites, we used CRISPR editing to generate approximately 200bp deletions surrounding the KLF4 or GRHL2 sequence motif at the bound sites near three target genes: desmoplakin (Dsp), E-cadherin (Cdh1), and junctional adhesion molecule 1 (Jam1). At the Dsp locus, there were two KLF4 binding sites and one GRHL2 binding site near the Dsp promoter (Figure 6A). We generated ESC lines with deletions for one of the two KLF4 sites (K1), both KLF4 sites (K1+K2), or the GRHL2 site (G). We then assessed the effects of each enhancer deletion on Dsp expression in ESCs and EpiLCs by quantitative RT-PCR. If a true enhancer switch occurs between the KLF4-bound and GRHL2-bound enhancers during the ESC-to-EpiLC transition, the enhancer deletions should only affect expression of Dsp in the state in which they are supposedly active. Indeed, we found that deletion of one or both KLF4-bound enhancers led to a significant reduction in Dsp expression in ESCs but had no effect in EpiLCs (Figure 6B). Conversely, deletion of the GRHL2-bound enhancer resulted in significantly reduced Dsp expression in the EpiLC state but had no effect in ESCs (Figure 6B). We observed similar state-specific reductions in target gene expression with deletions of the KLF4-bound and GRHL2-bound enhancers at the Cdh1 and Jam1 loci (Figure 6C and D, S6A and B). While our enhancer deletions could potentially delete binding motifs of other TFs that are important for regulating these enhancers, the loss of active enhancer marks with GRHL2 loss and the gain of these marks with ectopic binding of GRHL2 strongly suggest a direct role for GRHL2 in regulating these enhancers. Together, our results show that expression of these GRHL2 target genes is maintained during the ESC-to-EpiLC transition via an enhancer switch that is regulated by the KLF and GRHL2 transcription factors.
Figure 6: Functional validation of enhancer switching at GRHL2 target genes during the ESC to EpiLC transition.
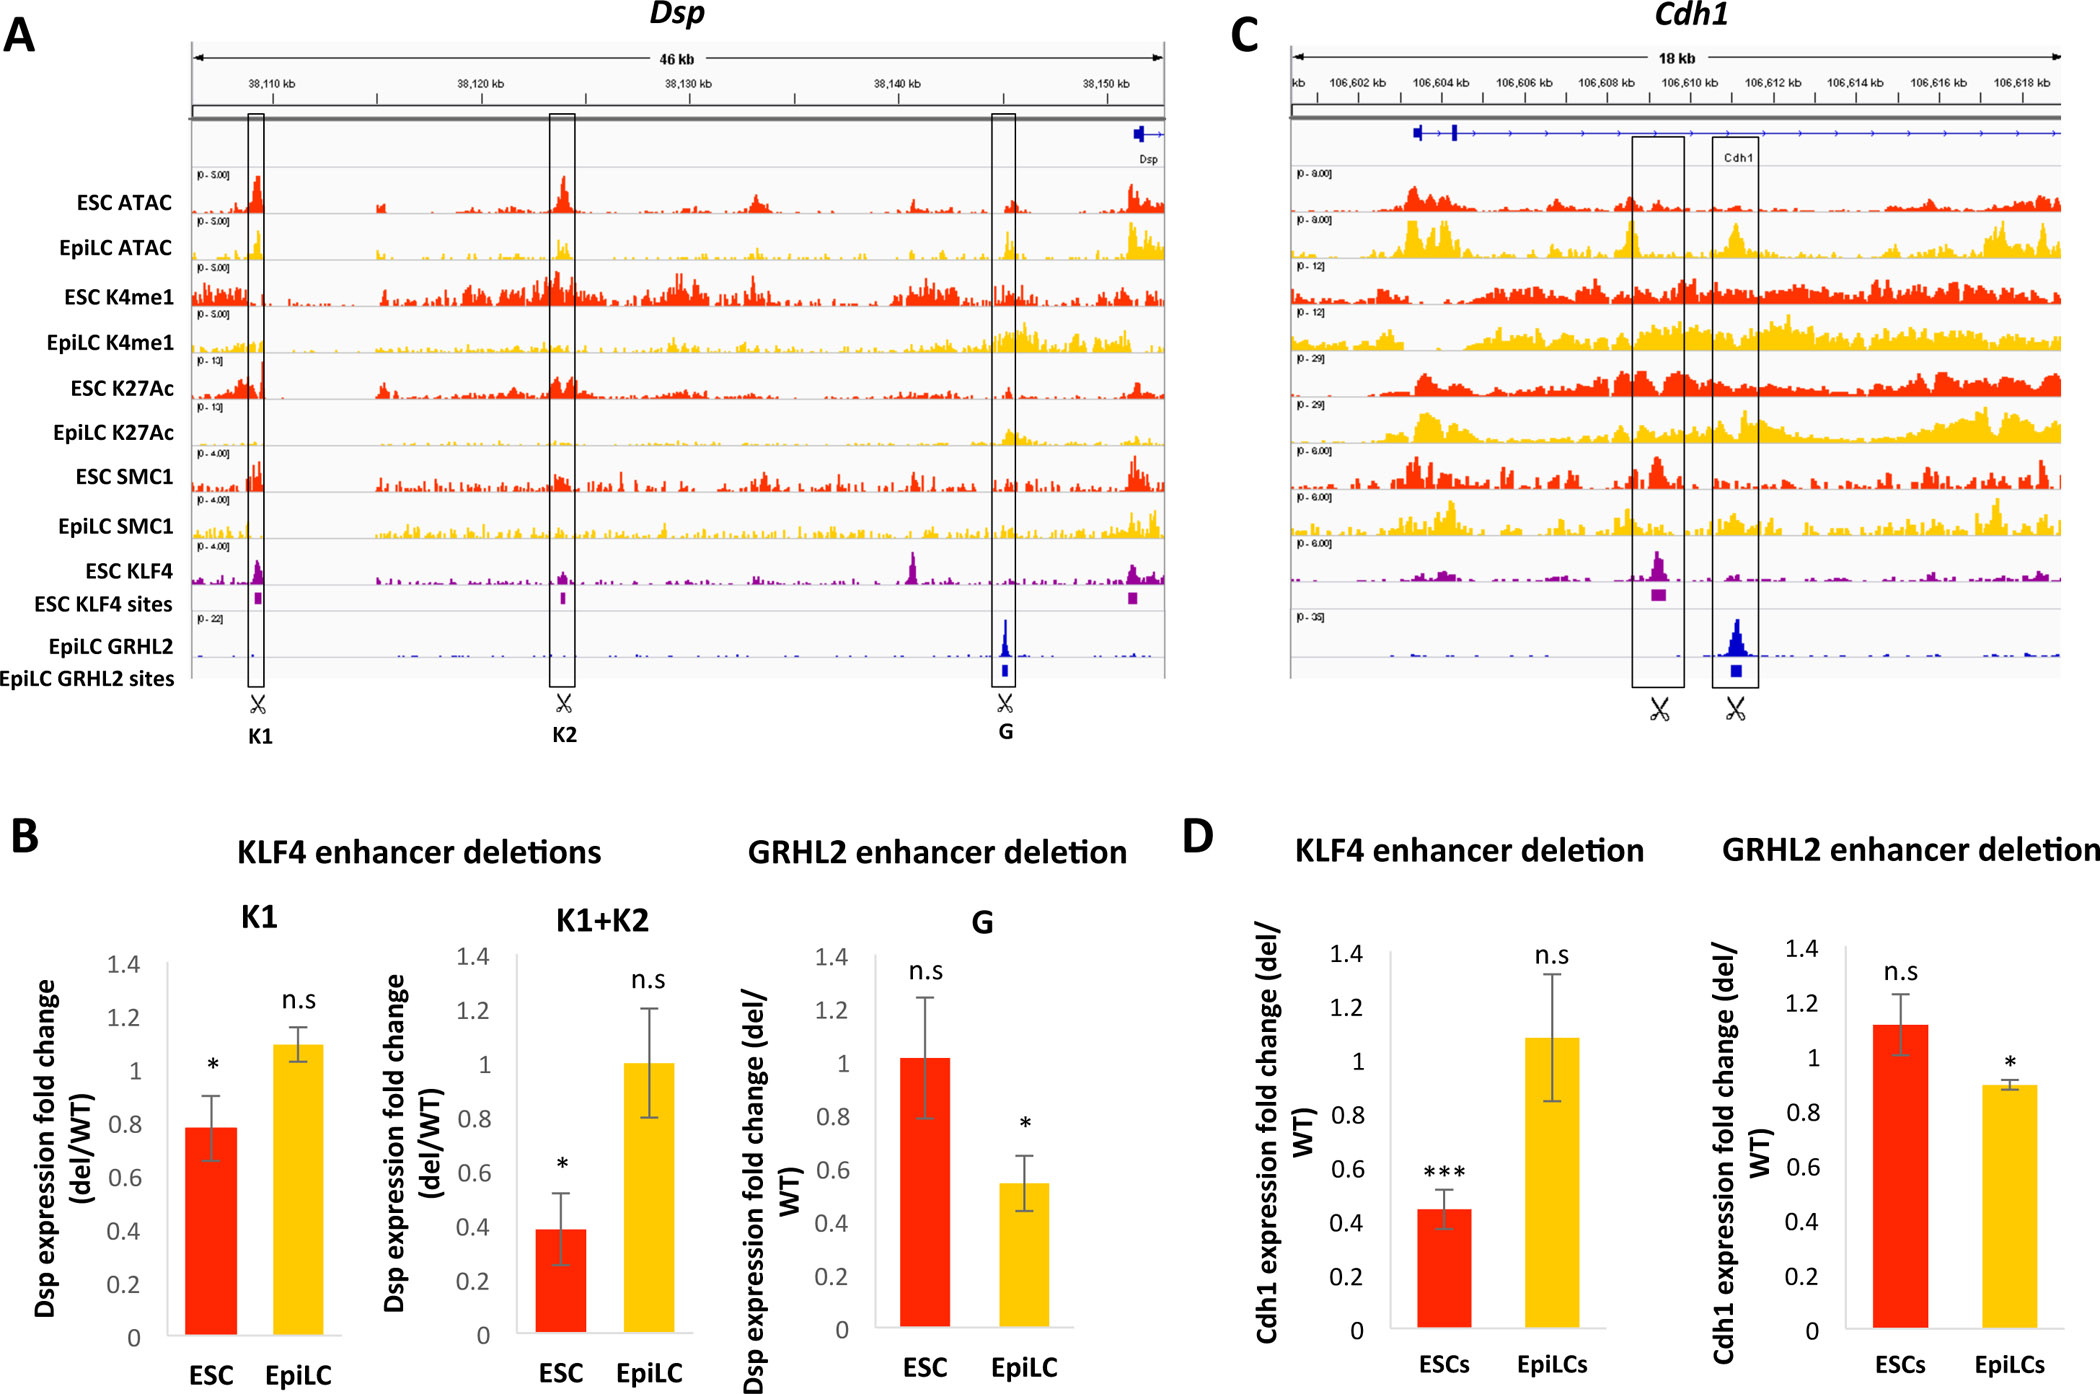
A) ChIP-seq and ATAC-seq tracks in WT ESCs and EpiLCs at the Dsp locus, with significant KLF4 and GRHL2 binding sites indicated by purple or blue bars, respectively. KLF4 and GRHL2 sites deleted using CRISPR are indicated. B) Fold change in Dsp expression with deletion of the indicated KLF4 enhancers (K1 alone, or K1 and K2) or GRHL2 enhancer in ESCs and EpiLCs. Astericks (*) indicate p < 0.05 by Student’s t-test. C) Same as in (A) but for the Cdh1 locus. D) Fold change in Cdh1 expression with deletion of the nearby KLF4-bound enhancer (left) or GRHL2-bound enhancer (right) in ESCs and EpiLCs. * indicates p < 0.05 and *** indicates p< 0.005 by Student’s t-test.
GRHL2 suppresses an epithelial-mesenchymal transition in EpiLCs
Next, we examined the biological role of enhancer switching at GRHL2 target genes. As expected, GRHL2 KO ESCs did not have any obvious morphological phenotype under self-renewal growth conditions, since GRHL2 expression is low or undetectable at this stage (Figure S7A). However, upon differentiation to EpiLCs, unlike wildtype cells, the KO cells did not remain in compact colonies, suggestive of a mesenchymal-like transition. GREAT analysis of GRHL2-regulated enhancers showed an enrichment for basolateral plasma membrane, cell-cell junction, and apical junction complex genes characteristic of an epithelial state (Figure S7B) (McLean et al., 2010). These ontology groups were also among the top enriched terms when performing GO analysis of genes nearest to GRHL2 enhancers using Enrichr (Figure S7C) (Chen et al., 2013; Kuleshov et al., 2016). These data suggested that GRHL2 is maintaining expression of genes specifically involved in promoting an epithelial state and cell adhesion in EpiLCs.
To test the role of GRHL2 in maintaining EpiLCs in an epithelial-like state, we measured several markers of both the epithelial and mesenchymal states. Consistent with morphological changes, microarray data showed a decrease in epithelial markers and a gain in mesenchymal markers with GRHL2 loss (Figure 7A). Quantitative RTPCR confirmed the down-regulation of the epithelial markers Cdh1, Cldn6, and to a small degree, Tjp2. In contrast, the mesenchymal markers, Vim, Cdh2, and Slug were up-regulated (Figure 7B). The overexpression of Grhl2 in ESCs led to an opposite result with the same markers showing altered expression in the opposing direction (Figure 7C). With the exception of Cldn6, these markers do not normally change with the ESC to EpiLC transition (Figure S7D). Additionally, consistent with the lack of GRHL2 expression in ESCs and absence of morphological changes in GRHL2 KO ESCs, the expression of EMT markers was unchanged in GRHL2 KO ESCs (Figures S7E). Therefore, morphological, enhancer, and gene expression changes were all consistent with GRHL2 functioning in the maintenance of an epithelial state in EpiLCs. Together, these results show that GRHL2 replaces naïve factors in EpiLCs to regulate a subset of the naïve pluripotency network that drives an epithelial program largely shared between the naïve and formative pluripotent states.
Figure 7. GRHL2 loss prevents maintenance of the epithelial expression program and results in EMT of EpiLCs.

A) Clustered heatmap of common epithelial and mesenchymal markers that are significantly changed (adjusted p<0.05) in 4 independent clones of GRHL2 KO EpiLCs vs WT (V6.5) EpiLCs. B) qPCR validation of expression changes for epithelial (Cdh1, Cldn6, Tjp2) and mesenchymal (Vim, Cdh2, Slug, Snail) markers in WT (V6.5) vs GRHL2 KO EpiLCs. Error bars show standard deviation for n=4 biological replicates. p<0.05 for all markers except Snail by t-test. C) Expression of epithelial and mesenchymal markers in WT and dox-inducible GRHL2 overexpressing ESCs treated with doxycycline for 0 or 48 hours as quantified by qPCR. Expression is normalized to respective 0 hr doxycycline samples for each cell line. Error bars indicate standard deviation for n=3 biological replicates. p<0.05 for all markers except Vim (p = 0.056) and Snail. D) A model where naïve-specific pluripotency factors including the KLF TFs regulate a broad repertoire of genes in ESCs, many that need to be maintained in the formative state. TFs up-regulated in the formative state activate new enhancers to maintain expression of these genes while the ESC-specific enhancers become inactivated. In the case of GRHL2, the target genes promote an epithelial state characteristic of both naïve and formative pluripotent cells. We speculate that other EpiLC-specific TFs regulate additional subsets of the larger naïve network.
DISCUSSION
Here, we identify a transcription factor, GRHL2, that plays a key role in rewiring enhancers during the ESC to EpiLC transition with minimal transcriptional changes. GRHL2 binding to its target sites in EpiLCs is both necessary and sufficient to fully activate latent enhancers. In the absence of GRHL2 in EpiLCs, a number of genes closest to these sites within the same TAD show reduced expression. However, these genes are already expressed at similar levels in ESCs and exhibit small changes in expression during the ESC to EpiLC transition. At least in part, the lack of major expression changes is due to the presence of alternative enhancers driven by transcription factors specific to naïve ESCs, such as members of the KLF family. These enhancers are becoming inactivated just as the GRHL2 target enhancers are becoming activated. Given that GRHL2 only targets a very small subset of genes driven by the naïve pluripotency network, we propose that it is part of a larger group of EpiLC TFs that assume control of the naïve pluripotency program as cells of the epiblast prepare for lineage diversification (Figure 7D).
In support of the GRHL2-bound enhancers functioning specifically in EpiLCs, analysis of recently published promoter capture HiC data showed very few significant interactions between GRHL2 enhancers and predicted target genes in ESCs (Novo et al., 2018). However, interpretation of this finding is limited by the ability of the assay to robustly detect enhancer-promoter interactions that are in close linear proximity or that are not super-enhancers. We unfortunately could not confirm the presence of these enhancer-promoter interactions in promoter capture HiC data in EpiSCs from the same study, as GRHL2 is not expressed in EpiSCs (Factor et al., 2014), which resemble a cell type distinct from EpiLCs.
While it is widely known that genes can be driven by distinct enhancers in different tissues and developmental stages, there are few known examples of changes in enhancer usage during a continuous developmental transition where a gene stays relatively constantly expressed. One example is the Oct4 gene, whose regulation is thought to switch from a distal to proximal enhancer during the transition from the early to late epiblast (Yeom et al., 1996). More recently, globally profiling of histone marks in naïve ESCs versus primed EpiSCs suggested extensive enhancer switching between these two cell states. However, unlike EpiLCs, EpiSCs are a distinct cell state derived through the prolonged passage rather than homogeneous transition of differentiating ESCs and they represent a significantly later developmental stage (Kojima et al., 2014). Importantly, the mechanisms driving enhancer switching and the purpose for genes to undergo enhancer switching during a tight developmental window with little change in gene expression remain unclear. The results presented here support a regulatory mechanism where a naïve and a formative pluripotency TF coordinate enhancer switching to maintain an epithelial program required in both states.
GRHL2 and other GRHL family members have been shown to be key regulators of the epithelial state during development (Pyrgaki et al., 2011; Ray and Niswander, 2016; Werth et al., 2010). They have also been shown to play a role in cancer progression. Tumors with loss of function mutations in GRHL proteins often correlate with EMT, leading to metastasis (Chung et al., 2016; Cieply et al., 2013; Cieply et al., 2012; Werner et al., 2013; Xiang et al., 2012). GRHL2 KO mice have the most severe phenotype of the three Grainyhead proteins, resulting in embryonic lethality by E9.5 or E11.5, depending on the mouse strain (Pyrgaki et al., 2011; Rifat et al., 2010; Werth et al., 2010). Those that survive past E9.5 have defects in fusion of a variety of tissues and organs, including an open neural tube, and lung and heart defects. These overt phenotypes are likely preceded several days by molecular defects, especially given the molecular changes seen in the GRHL2 KO EpiLCs. In vitro, we show a partial EMT associated with the loss of GRHL2, including a partial down-regulation of epithelial genes and up-regulation of mesenchymal genes. For example, approximately fifty percent of E-cadherin expression remained in the GRHL2 KO EpiLCs. These changes may not be enough to completely deregulate EMT during gastrulation and/or there could be additional redundant pathways in vivo, explaining the slightly later overt phenotypes.
Previous work on the regulation of three-dimensional architecture by cohesin have focused on long range interactions that form TADs, which are larger loop structures that partition the genome into insulated regulatory units. Enhancers are contained within TADs and are often restricted to activating genes within the same TAD (Dowen et al., 2014; Ji et al., 2016; Mumbach et al., 2016). TAD boundaries are marked by cohesin and the sequence-specific factor, CTCF, and are largely similar in different cell types (Dixon et al., 2012). Enhancer-promoter interactions that occur within TADs are much more dynamic across cell types and therefore require regulation by different sequence-specific factors in different cell types (Ji et al., 2016). Here, we aimed to identify sequence-specific factors that regulate cohesin localization to new enhancers during differentiation to the EpiLC state. We originally focused on GRHL2 as a TF that may regulate this process. While we found that GRHL2 is indeed necessary and sufficient for cohesin binding at target enhancers, it is also necessary and sufficient for nucleosome removal and deposition of H3K4me1 and H3K27ac. It is unclear whether GRHL2 is required for each of these events or functions early in the process to initiate a cascade of events.
One of the earliest events in enhancer activation is removal of nucleosomes from the enhancer, allowing other TFs to bind (Calo and Wysocka, 2013). Our ATAC-seq data showed that GRHL2 target sites are mostly nucleosome-occluded in ESCs; yet GRHL2 overexpression is able to fully activate these enhancers. GRHL2 overexpression in ESCs also led to binding and activation of many additional sites that are not native GRHL2 binding sites in the EpiLC state. This suggests a possible role for GRHL2 as a pioneer factor, binding nucleosome-occluded DNA and opening up the enhancer region. However, GRHL2 may not be functioning alone, but could instead be interacting with other transcription factors that are expressed in both naïve and formative states to cooperatively bind and activate its target sites. For example, GRHL2 has been shown to interact with the pioneer TF, FOXA1, which recruits MLL3 to enhancer binding sites in MCF7 cells (Jozwik et al., 2016). Biochemical experiments to identify candidate collaborative factors and acute depletion of these factors will be required to answer this question.
Our findings raise the question of why these cells have evolved such a complex mechanism to simply maintain gene expression. Given that ESCs and EpiLCs are both pluripotent, it is not surprising that they express many of the same genes and at similar levels. However, it is less obvious why these genes become controlled by distinct enhancers. We propose that the large naïve pluripotency network must be subdivided into smaller networks in preparation for lineage specification to form the three germinal layers during gastrulation (Figure 7D). That is, by partitioning genes into smaller networks, their regulation becomes uncoupled, providing EpiLCs with more flexibility to differentiate into these distinct cell fates. GRHL2 regulates just one of these subnetworks, one important in maintaining an epithelial state characteristic of downstream ectoderm cells. Consistent with this model, analysis of single cell RNA-seq data from the E6.5 gastrulating embryo (Scialdone et al., 2016) shows a positive correlation between expression of GRHL2 and markers of anterior epiblast cells that give rise to ectoderm, and a negative correlation with markers of the posterior epiblast and primitive streak that give rise to mesendoderm (Figure S7F). We therefore speculate that a more general mechanism exists where different EpiLC TFs take over regulation of multiple distinct networks to allow for precise control of cell fate as the embryo prepares for gastrulation.
STAR METHODS
CONTACT FOR REAGENT AND RESOURCE SHARING
Further information and requests for resources and reagents should be directed to and will be fulfilled by the Lead Contact, Robert Blelloch (robert.blelloch@ucsf.edu).
EXPERIMENTAL MODEL AND SUBJECT DETAILS
Cell culture conditions
V6.5 ESCs were cultured in Knockout DMEM (Invitrogen) supplemented with 15% FBS, LIF (1000U/mL), and 2i (1uM MEK inhibitor PD0325901 and 3uM GSK3 inhibitor CHIR99021). EpiLCs were generated by removal of LIF and 2i as described in Krishnakumar et al. 2016. Briefly, 400,000 ESCs were plated per 15cm plate on day −1 in ESC media. To initiate differentiation, LIF and 2i were removed approximately 24 hours after seeding (day 0). EpiLCs were collected on day 3 of differentiation, approximately 65 hours after removal of LIF and 2i. GRHL2 expression was induced in the dox-inducible Rosa26-M2rtTA; TetO-HA-GRHL2 ESCs with 0.5ug/mL final concentration of doxycycline for 24 hours prior to collection for ChIP-seq.
METHOD DETAILS
Targeting of GRHL2 knockout and overexpression lines
GRHL2 knockout ESCs were generated using CRISPR technology roughly as described in Ran et al. 2013. Pairs of guide RNAs compatible for Cas9 nicking were designed against exon 2 of Grhl2 using the CRISPR Design Tool (http://tools.genome-engineering.org). Each guide RNA was cloned into a plasmid containing Cas9 nickase-2A-GFP (Addgene plasmid ID: 48140). Paired plasmids were then nucleofected into V6.5 ESCs (Lonza mouse ESC nucleofector kit). GFP positive ESCs were single cell sorted into 96 well plates the next day. Individual clones were genotyped for shifts in PCR product size in both alleles, and the resulting products were gel extracted and sequenced to verify that a truncated protein was generated. Positive clones were expanded and the absence of GRHL2 protein was confirmed by western blot.
ESCs containing dox-inducible HA-tagged GRHL2 were generated using a system developed by Beard et al. 2006. V6.5 ESCs targeted with Rosa26-M2rtTA and a FRT site downstream of the ColA1 3’UTR were electroporated with the Pgk-ATG-FRT plasmid (Addgene plasmid #20734) containing HA-GRHL2 cloned into the EcoRI site (Beard et al., 2006). Cells were plated onto irradiated MEFs and selected with hygromycin (140ug/mL) after 24 hours. Surviving clones were genotyped for insertion of the construct at the correct locus and confirmed to induce expression of HA-GRHL2 with addition of 0.5ug/mL doxycycline (Figure S3B).
KLF2 and KLF4 knockout ESC generation
KLF2 and KLF4 double KO ESCs were generated similarly to GRHL2 KO ESCs using CRISPR technology, except that a Cas9 nuclease-2A-GFP (Addgene plasmid #48138) was used. A pair of guides targeting exon 1 of Klf2 were cloned into the plasmid and introduced into V6.5 ESCs. GFP positive cells were sorted two days later and plated at clonal density for colony picking. Individual clones were genotyped for shifts in product size in both alleles, and the resulting products were gel extracted and sequenced to verify that a truncated protein was generated. Positive clones were expanded and the absence of KLF2 protein was confirmed by western blot. To generate the double knockout, we then introduced a pair of guides targeted at the region flanking exon 3 of Klf4 into a KLF2 KO line. Individual clones were genotyped and loss of KLF4 protein was verified by western blot.
Generation of enhancer deletions
To generate deletions of individual KLF4 and GRHL2-bound enhancers, we designed pairs of guides spaced approximately 200bp apart surrounding the KLF4 or GRHL2 sequence motif and cloned these into Cas9 nuclease-2A-GFP plasmids (Addgene plasmid #48138). We then expanded GFP-positive clones and genotyped them for shifts in product size for both alleles as described above. Positive clones were then sequenced to verify deletion of the TF sequence motif.
ChIP-seq
Cells were fixed in 1.5mM EGS for 30 mins, and then 1% PFA for 5 mins. Nuclei were isolated using nuclear extraction buffer (5mM PIPES pH 8.0, 85mM KCl, 0.5% NP-40) and lysed in shearing buffer (10mM Tris-HCl pH 7.6, 1mM EDTA, 0.1% SDS). Chromatin was sheared using a Covaris S2 sonicator (Duty cycle: 10%, Intensity: 4, Cycles/burst: 200, Mode: Frequency sweeping, 12 mins) and fragments were verified by gel electrophoresis to be predominantly between 100–500 bp. Antibodies were pre-incubated with a mix of 20ul Protein A and 20ul Protein G Dynabeads (Invitrogen) and then incubated overnight with sheared chromatin under IP conditions (0.5% Tritox X-100, 2mM EDTA, 20mM Tris, 150mM NaCl, 0.1% SDS). Approximately 10 million cells were used per IP. The next day, beads were sequentially washed with the following buffers: Low salt wash buffer (20mM Tris pH 7.9, 2mM EDTA, 125mM NaCl, 0.05% SDS, 1% Triton X-100); High salt wash buffer (20mM Tris pH 7.9, 2mM EDTA, 500mM NaCl, 0.05% SDS, 1% Triton X-100); LiCl wash buffer (10mM Tris pH 7.9, 1mM EDTA, 250mM LiCl, 1% NP-40, 1% sodium deoxycholate); and 1X TE. Immunoprecipitated DNA was then eluted (100mM sodium bicarbonate, 1% SDS) and de-crosslinked overnight at 65 degrees Celsius before being purified. Protease and phosphatase inhibitors were added to each buffer prior to elution. Purified DNA was then used for generation of ChIP-seq libraries as described in Krishnakumar et al. 2016.
ATAC-seq
ATAC-seq libraries were generated as described in (Buenrostro et al., 2015). Briefly, 50000 cells were washed, resuspended in cold lysis buffer, and spun down to pellet nuclei. Isolated nuclei were then resuspended in Tn5 transposase reaction mix from Nextera (Illumina FC-121–1030) and incubated at 37 degrees for 30 mins. The reaction was purified using Qiagen MinElute columns and then amplified for 8 cycles to produce libraries for sequencing.
Antibodies
Antibodies used for ChIP-seq and/or western blotting are as follows: Normal Rabbit IgG (Invitrogen 10500C, 10ug/IP); H3K4me1 (Abcam ab8895, 5ug/IP), H3K27ac (Abcam ab4729, 5ug/IP), SMC1 (Bethyl A300–055A, 10ug/IP), HA (Abcam ab9110 5ug/IP), GRHL2 (Sigma HPA004820 5ug/IP), TATA-binding protein (Abcam ab51841), KLF4 (R&D AF3158), KLF2 (Millipore 09–820). All antibodies were used at 1:1000 for western blotting.
ChIP-seq and ATAC-seq data analysis
Fastq files were mapped to mm10 using Bowtie 2 (Langmead and Salzberg, 2012) and converted to bam and bed files using samtools (Li et al., 2009) and bedtools (Quinlan and Hall, 2010). Only uniquely mapping (map quality > 30), deduplicated reads were used for analysis. Peaks were identified with MACS2 using the following parameters: --nomodel --extsize 200 -s 50 --bw 200 -f BAM -g mm -B -q 0.05. In the case of KLF4 ChIP-seq from Liu et al, a q-value of 5E-5 was used, and only sites containing a KLF motif were considered true KLF4 sites. For SMC1 peaks, an IgG control was used as background. For GRHL2 peaks, a GRHL2 ChIP in GRHL2 knockout cells was used as background. For KLF4, input DNA was used as a background. Metagene analyses were performed as described in Krishnakumar et al. 2016, except a moving average was calculated using a window size of 400bp and a step size of 100bp. Heatmaps of ChIP signal were generated using deepTools2 (Ramírez et al., 2016). Homer was used for motif-finding (Heinz et al., 2010). GREAT was used for GO analysis of likely target genes of GRHL2-bound enhancers. Candidate target genes were assigned based on nearest gene within the same TAD based on TAD boundaries identified in ESCs by Dixon et al. 2012. Two biological replicates were sequenced for each condition and initially analyzed separately to ensure results were consistent between replicates, and then analyses were repeated by combining the reads from each replicate. At least 20 and 7 million uniquely mapping, deduplicated reads were used for ChIP-seq and ATAC-seq analysis per condition, respectively (Table S7). To visualize ChIP-seq tracks at specific loci, bam files were converted to read normalized bedgraph files using bedtools and then converted to bigwig files and uploaded onto the Integrative Genome Viewer from the Broad Institute.
Microarray profiling
Total RNA was Trizol extracted from 4 independent wildtype and GRHL2 knockout clones differentiated into the EpiLC state. RNA was sent to the UCLA Neuroscience Genomics Core for hybridization to the Illumina Mouse Ref 8 v 2.0 Beadchip. Data was quantile normalized using the beadarray package on Bioconductor and differential gene expression in GRHL2 knockout vs wildtype EpiLCs was determined using the limma package.
RNA-seq library preparation and analysis
RNA-seq libraries of KLF2/4 double KO ESCs were generated using the QuantSeq 3’ mRNA-Seq Library Prep Kit FWD for Illumina (Lexogen) as per their protocol. Total RNA was Trizol extracted from four wildtype samples and five KLF2/4 double KO samples (three independent clones; two samples for two clones and one sample for one clone). 600ng of total RNA was used as input for each library. For RNA-seq of ESCs and EpiLCs, RNA was collected using Trizol and rRNA was depleted using the Ribo-Zero Gold kit (Illumina). ~ 100 ng of rRNA depleted RNA was used as input for the Kapa Stranded RNA-Seq kit (Kapa). Libraries were sequenced on a HiSeq 4000.
Reads were trimmed to remove adapter sequences using cutadapt and mapped to the genome (mm10) with STAR (Dobin et al., 2013) using the following parameters: --outFilterMultimapNmax 1 --outFilterMismatchNoverReadLmax 0.05 --seedSearchStartLmax 25 --winAnchorMultimapNmax 100. Reads mapping to exons were then counted using featureCounts (Liao et al., 2014). Differential expression analysis was performed using DESeq2 (Love et al., 2014).
For principal component analysis of data from Boroviak et al. 2015, processed Bam files were downloaded from ftp://ftp.ebi.ac.uk/pub/databases/microarray/data/experiment/MTAB/E-MTAB-2958/. Counts were generated using featureCounts v1.5.0 and the mouse Gencode annotation with default options except for strandedness (-s 2). Read count data were used for principal component analysis as follows. First, a count value cutoff of 10 was imposed to remove low-count data (i.e., only genes receiving ≥10 counts in ≥1 sample were included in downstream analyses). Count data surpassing this threshold were normalized for total number of counts per sample, as well as for the length of the CDS as measured in base pairs (generating an RPKM-like value). The samples were batch normalized using an empirical Bayes method (Johnson et al., 2007), based on sample source metadata. We used the prcomp function in R, the data were mean-variance scaled, and the results were plotted in 3D (PC1 vs PC2 vs PC3).
Western blotting
Nuclear extracts were prepared by first resuspending cell pellets in cytoplasmic extraction buffer (10mM HEPES, 60mM KCl, 1mM EDTA, 0.075% Igepal, adjusted to pH7.6) to lyse cells and pellet nuclei, and then resuspending nuclei in nuclear extraction buffer (20mM Tris-HCl, 420mM NaCl, 1.5mM MgCl2, 0.2mM EDTA, and 25% glycerol, adjusted to pH 8.0). Nuclear lysates were quantified and equal amounts of protein were loaded for each sample onto 7.5% Tris-glycine gels. Proteins were transferred onto a PVDF membrane, blocked with Odyssey blocking buffer, and sequentially blotted with primary and secondary antibody. Membranes were then imaged on an Odyssey imaging system (LI-COR)
Quantitative RT-PCR
Trizol extraction was performed to isolate total RNA. RNA was then reverse transcribed using the Superscript III First-strand Synthesis kit or Maxima First Strand cDNA Synthesis kit (Thermofisher). Quantitative PCR reactions were performed using the SensiFAST SYBR Hi-ROX kit (Bioline) or PowerUp SYBR Green Master Mix (Thermofisher) on an ABI 7900HT 384-well PCR machine.
QUANTIFICATION AND STATISTICAL ANALYSIS
Statistical details of experiments can be found in the figure legends, including the statistical test used, value of n, meaning of error bars, and p-values. For all figures, the value of n indicates number of biological replicates, defined as distinct dishes of cultured cells. For qPCR experiments, the bar graphs indicate mean of n biological replicates. For microarray and sequencing data, significant differences were defined as an adjusted p-value < 0.05, unless otherwise noted in the appropriate Method Details sub-section. Statistical analyses were performed in Microsoft Excel or R.
DATA AND SOFTWARE AVAILABILITY
All microarray and sequencing data have been deposited in GEO under the accession number GSE93147.
Supplementary Material
Table S1. Related to Figure 1. SMC1 binding sites in ESCs and EpiLCs.
Table S2. Related to Figure 2. GRHL2 binding sites in EpiLCs identified relative to GRHL2 KO cells.
Table S3. Related to Figure 3. Ectopic GRHL2 binding sites in GRHL2 overexpressing ESCs.
Table S4. Related to Figure 4. Genes nearest to GRHL2 binding sites within the same TAD.
Table S5. Related to Figure 4. All significantly changed genes in GRHL2 KO vs WT EpiLCs (adjusted p-value < 0.05).
Table S6. Related to Figures 4 and 5. Alternative active ESC enhancers or KLF4 binding sites with a GRHL2 target as the nearest gene within the same TAD.
Table S7. Related to STAR Methods. ChIP-seq sample information and oligonucleotide sequences.
ACKNOWLEDGEMENTS
We thank the UCSF Institute for Human Genetics for technical support and use of their sonicator. We thank Archana Shenoy, Deniz Goekbuget, and Ryan Boileau for critical reading of the manuscript. We thank Dr. Stephen Jane of Monash University for providing the GRHL2 construct. This work was funded by NIH (R01 GM101180) to RB. A.F.C was funded by a CIRM predoctoral fellowship. R.K was funded by the A.P Giannini Foundation postdoctoral fellowship.
Footnotes
Publisher's Disclaimer: This is a PDF file of an unedited manuscript that has been accepted for publication. As a service to our customers we are providing this early version of the manuscript. The manuscript will undergo copyediting, typesetting, and review of the resulting proof before it is published in its final citable form. Please note that during the production process errors may be discovered which could affect the content, and all legal disclaimers that apply to the journal pertain.
DECLARATION OF INTERESTS
The authors declare no competing interests.
REFERENCES
- Auclair G, Guibert S, Bender A, and Weber M (2014). Ontogeny of CpG island methylation and specificity of DNMT3 methyltransferases during embryonic development in the mouse. Genome Biology 15, 545. [DOI] [PMC free article] [PubMed] [Google Scholar]
- Beard C, Hochedlinger K, Plath K, Wutz A, and Jaenisch R (2006). Efficient method to generate single-copy transgenic mice by site-specific integration in embryonic stem cells. genesis 44, 23–28. [DOI] [PubMed] [Google Scholar]
- Bedzhov I, and Zernicka-Goetz M (2014). Self-organizing properties of mouse pluripotent cells initiate morphogenesis upon implantation. Cell 156, 1032–1044. [DOI] [PMC free article] [PubMed] [Google Scholar]
- Bogdanovic O, Fernandez-Minan A, Tena JJ, de la Calle-Mustienes E, Hidalgo C, van Kruysbergen I, van Heeringen SJ, Veenstra GJ, and Gomez-Skarmeta JL (2012). Dynamics of enhancer chromatin signatures mark the transition from pluripotency to cell specification during embryogenesis. Genome Res 22, 2043–2053. [DOI] [PMC free article] [PubMed] [Google Scholar]
- Boglev Y, Wilanowski T, Caddy J, Parekh V, Auden A, Darido C, Hislop NR, Cangkrama M, Ting SB, and Jane SM (2011). The unique and cooperative roles of the Grainy head-like transcription factors in epidermal development reflect unexpected target gene specificity. Developmental Biology 349, 512–522. [DOI] [PubMed] [Google Scholar]
- Bonn S, Zinzen RP, Girardot C, Gustafson EH, Perez-Gonzalez A, Delhomme N, Ghavi-Helm Y, Wilczyński B, Riddell A, and Furlong EEM (2012). Tissue-specific analysis of chromatin state identifies temporal signatures of enhancer activity during embryonic development. Nature genetics 44, 148. [DOI] [PubMed] [Google Scholar]
- Borgel J, Guibert S, Li Y, Chiba H, Schubeler D, Sasaki H, Forne T, and Weber M (2010). Targets and dynamics of promoter DNA methylation during early mouse development. Nature genetics 42, 1093–1100. [DOI] [PubMed] [Google Scholar]
- Boroviak T, Loos R, Lombard P, Okahara J, Behr R, Sasaki E, Nichols J, Smith A, and Bertone P (2015). Lineage-Specific Profiling Delineates the Emergence and Progression of Naive Pluripotency in Mammalian Embryogenesis. Dev Cell 35, 366–382. [DOI] [PMC free article] [PubMed] [Google Scholar]
- Buecker C, Srinivasan R, Wu Z, Calo E, Acampora D, Faial T, Simeone A, Tan M, Swigut T, and Wysocka J (2014). Reorganization of Enhancer Patterns in Transition from Naive to Primed Pluripotency. Cell Stem Cell 14, 838–853. [DOI] [PMC free article] [PubMed] [Google Scholar]
- Buenrostro JD, Giresi PG, Zaba LC, Chang HY, and Greenleaf WJ (2013). Transposition of native chromatin for fast and sensitive epigenomic profiling of open chromatin, DNA-binding proteins and nucleosome position. Nat Meth 10, 1213–1218. [DOI] [PMC free article] [PubMed] [Google Scholar]
- Buenrostro JD, Wu B, Chang HY, and Greenleaf WJ (2015). ATAC-seq: A Method for Assaying Chromatin Accessibility Genome-Wide In Current Protocols in Molecular Biology (John Wiley & Sons, Inc.). [DOI] [PMC free article] [PubMed] [Google Scholar]
- Calo E, and Wysocka J (2013). Modification of Enhancer Chromatin: What, How, and Why? Molecular Cell 49, 825–837. [DOI] [PMC free article] [PubMed] [Google Scholar]
- Chen EY, Tan CM, Kou Y, Duan Q, Wang Z, Meirelles GV, Clark NR, and Ma’ayan A (2013). Enrichr: interactive and collaborative HTML5 gene list enrichment analysis tool. BMC Bioinformatics 14, 128. [DOI] [PMC free article] [PubMed] [Google Scholar]
- Chung VY, Tan TZ, Tan M, Wong MK, Kuay KT, Yang Z, Ye J, Muller J, Koh CM, Guccione E, et al. (2016). GRHL2-miR-200-ZEB1 maintains the epithelial status of ovarian cancer through transcriptional regulation and histone modification. Scientific Reports 6, 19943. [DOI] [PMC free article] [PubMed] [Google Scholar]
- Cieply B, Farris J, Denvir J, Ford HL, and Frisch SM (2013). Epithelial–Mesenchymal Transition and Tumor Suppression Are Controlled by a Reciprocal Feedback Loop between ZEB1 and Grainyhead-like-2. Cancer Research 73, 6299–6309. [DOI] [PMC free article] [PubMed] [Google Scholar]
- Cieply B, Riley P, Pifer PM, Widmeyer J, Addison JB, Ivanov AV, Denvir J, and Frisch SM (2012). Suppression of the Epithelial–Mesenchymal Transition by Grainyhead-like-2. Cancer Research 72, 2440–2453. [DOI] [PMC free article] [PubMed] [Google Scholar]
- Creyghton MP, Cheng AW, Welstead GG, Kooistra T, Carey BW, Steine EJ, Hanna J, Lodato MA, Frampton GM, Sharp PA, et al. (2010). Histone H3K27ac separates active from poised enhancers and predicts developmental state. Proceedings of the National Academy of Sciences 107, 21931–21936. [DOI] [PMC free article] [PubMed] [Google Scholar]
- Dixon JR, Selvaraj S, Yue F, Kim A, Li Y, Shen Y, Hu M, Liu JS, and Ren B (2012). Topological domains in mammalian genomes identified by analysis of chromatin interactions. Nature 485, 376–380. [DOI] [PMC free article] [PubMed] [Google Scholar]
- Dobin A, Davis CA, Schlesinger F, Drenkow J, Zaleski C, Jha S, Batut P, Chaisson M, and Gingeras TR (2013). STAR: ultrafast universal RNA-seq aligner. Bioinformatics (Oxford, England) 29, 15–21. [DOI] [PMC free article] [PubMed] [Google Scholar]
- Dowen Jill M., Fan Zi P., Hnisz D, Ren G, Abraham Brian J., Zhang Lyndon N., Weintraub Abraham S., Schuijers J, Lee Tong I., Zhao K, et al. (2014). Control of Cell Identity Genes Occurs in Insulated Neighborhoods in Mammalian Chromosomes. Cell 159, 374–387. [DOI] [PMC free article] [PubMed] [Google Scholar]
- Factor Daniel C., Corradin O, Zentner Gabriel E., Saiakhova A, Song L, Chenoweth Josh G., McKay Ronald D., Crawford Gregory E., Scacheri Peter C., and Tesar Paul J. (2014). Epigenomic Comparison Reveals Activation of “Seed” Enhancers during Transition from Naive to Primed Pluripotency . Cell Stem Cell 14, 854–863. [DOI] [PMC free article] [PubMed] [Google Scholar]
- Guo G, Yang J, Nichols J, Hall JS, Eyres I, Mansfield W, and Smith A (2009). Klf4 reverts developmentally programmed restriction of ground state pluripotency. Development 136, 1063–1069. [DOI] [PMC free article] [PubMed] [Google Scholar]
- Hayashi K, Ohta H, Kurimoto K, Aramaki S, and Saitou M (2011). Reconstitution of the Mouse Germ Cell Specification Pathway in Culture by Pluripotent Stem Cells. Cell 146, 519–532. [DOI] [PubMed] [Google Scholar]
- Heinz S, Benner C, Spann N, Bertolino E, Lin YC, Laslo P, Cheng JX, Murre C, Singh H, and Glass CK (2010). Simple Combinations of Lineage-Determining Transcription Factors Prime cis-Regulatory Elements Required for Macrophage and B Cell Identities. Molecular Cell 38, 576–589. [DOI] [PMC free article] [PubMed] [Google Scholar]
- Ji X, Dadon Daniel B., Powell Benjamin E., Fan Zi P., Borges-Rivera D, Shachar S, Weintraub Abraham S., Hnisz D, Pegoraro G, Lee Tong I., et al. (2016). 3D Chromosome Regulatory Landscape of Human Pluripotent Cells. Cell Stem Cell 18, 262–275. [DOI] [PMC free article] [PubMed] [Google Scholar]
- Johnson WE, Li C, and Rabinovic A (2007). Adjusting batch effects in microarray expression data using empirical Bayes methods. Biostatistics (Oxford, England) 8, 118–127. [DOI] [PubMed] [Google Scholar]
- Jozwik KM, Chernukhin I, Serandour AA, Nagarajan S, and Carroll JS (2016). FOXA1 Directs H3K4 Monomethylation at Enhancers via Recruitment of the Methyltransferase MLL3. Cell Reports 17, 2715–2723. [DOI] [PMC free article] [PubMed] [Google Scholar]
- Kagey MH, Newman JJ, Bilodeau S, Zhan Y, Orlando DA, van Berkum NL, Ebmeier CC, Goossens J, Rahl PB, Levine SS, et al. (2010). Mediator and cohesin connect gene expression and chromatin architecture. Nature 467, 430–435. [DOI] [PMC free article] [PubMed] [Google Scholar]
- Kim TH, Abdullaev ZK, Smith AD, Ching KA, Loukinov DI, Green Roland D., Zhang MQ, Lobanenkov VV, and Ren B (2007). Analysis of the Vertebrate Insulator Protein CTCF-Binding Sites in the Human Genome. Cell 128, 1231–1245. [DOI] [PMC free article] [PubMed] [Google Scholar]
- Kojima Y, Kaufman-Francis K, Studdert Joshua B., Steiner Kirsten A., Power Melinda D., Loebel David A.F., Jones V, Hor A, de Alencastro G, Logan Grant J., et al. (2014). The Transcriptional and Functional Properties of Mouse Epiblast Stem Cells Resemble the Anterior Primitive Streak. Cell Stem Cell 14, 107–120. [DOI] [PubMed] [Google Scholar]
- Krishnakumar R, Chen Amy F., Pantovich Marisol G., Danial M, Parchem Ronald J., Labosky Patricia A., and Blelloch R (2016). FOXD3 Regulates Pluripotent Stem Cell Potential by Simultaneously Initiating and Repressing Enhancer Activity. Cell Stem Cell 18, 104–117. [DOI] [PMC free article] [PubMed] [Google Scholar]
- Kuleshov MV, Jones MR, Rouillard AD, Fernandez NF, Duan Q, Wang Z, Koplev S, Jenkins SL, Jagodnik KM, Lachmann A, et al. (2016). Enrichr: a comprehensive gene set enrichment analysis web server 2016 update. Nucleic Acids Research 44, W90–W97. [DOI] [PMC free article] [PubMed] [Google Scholar]
- Langmead B, and Salzberg SL (2012). Fast gapped-read alignment with Bowtie 2. Nature Methods 9, 357. [DOI] [PMC free article] [PubMed] [Google Scholar]
- Li H, Handsaker B, Wysoker A, Fennell T, Ruan J, Homer N, Marth G, Abecasis G, and Durbin R (2009). The Sequence Alignment/Map format and SAMtools. Bioinformatics (Oxford, England) 25, 2078–2079. [DOI] [PMC free article] [PubMed] [Google Scholar]
- Liao Y, Smyth GK, and Shi W (2014). featureCounts: an efficient general purpose program for assigning sequence reads to genomic features. Bioinformatics 30, 923–930. [DOI] [PubMed] [Google Scholar]
- Liu Y, Pelham-Webb B, Di Giammartino DC, Li J, Kim D, Kita K, Saiz N, Garg V, Doane A, Giannakakou P, et al. (2017). Widespread Mitotic Bookmarking by Histone Marks and Transcription Factors in Pluripotent Stem Cells. Cell Reports 19, 1283–1293. [DOI] [PMC free article] [PubMed] [Google Scholar]
- Love MI, Huber W, and Anders S (2014). Moderated estimation of fold change and dispersion for RNA-seq data with DESeq2. Genome Biology 15, 550. [DOI] [PMC free article] [PubMed] [Google Scholar]
- McLean CY, Bristor D, Hiller M, Clarke SL, Schaar BT, Lowe CB, Wenger AM, and Bejerano G (2010). GREAT improves functional interpretation of cis-regulatory regions. Nat Biotech 28, 495–501. [DOI] [PMC free article] [PubMed] [Google Scholar]
- Mumbach MR, Rubin AJ, Flynn RA, Dai C, Khavari PA, Greenleaf WJ, and Chang HY (2016). HiChIP: efficient and sensitive analysis of protein-directed genome architecture. Nat Meth 13, 919–922. [DOI] [PMC free article] [PubMed] [Google Scholar]
- Nakamura T, Okamoto I, Sasaki K, Yabuta Y, Iwatani C, Tsuchiya H, Seita Y, Nakamura S, Yamamoto T, and Saitou M (2016). A developmental coordinate of pluripotency among mice, monkeys and humans. Nature 537, 57–62. [DOI] [PubMed] [Google Scholar]
- Nichols J, and Smith A (2009). Naive and Primed Pluripotent States. Cell Stem Cell 4, 487–492. [DOI] [PubMed] [Google Scholar]
- Nichols J, and Smith A (2012). Pluripotency in the embryo and in culture. Cold Spring Harb Perspect Biol 4, a008128. [DOI] [PMC free article] [PubMed] [Google Scholar]
- Novo CL, Javierre B-M, Cairns J, Segonds-Pichon A, Wingett SW, Freire-Pritchett P, Furlan-Magaril M, Schoenfelder S, Fraser P, and Rugg-Gunn PJ (2018). Long-Range Enhancer Interactions Are Prevalent in Mouse Embryonic Stem Cells and Are Reorganized upon Pluripotent State Transition. Cell Reports 22, 2615–2627. [DOI] [PMC free article] [PubMed] [Google Scholar]
- Parchem Ronald J., Ye J, Judson Robert L., LaRussa Marie F., Krishnakumar R, Blelloch A, Oldham Michael C., and Blelloch R (2014). Two miRNA Clusters Reveal Alternative Paths in Late-Stage Reprogramming. Cell Stem Cell 14, 617–631. [DOI] [PMC free article] [PubMed] [Google Scholar]
- Phillips-Cremins Jennifer E., Sauria, Michael EG, Sanyal A, Gerasimova Tatiana I., Lajoie Bryan R., Bell Joshua S.K., Ong C-T, Hookway Tracy A., Guo C, Sun Y, et al. (2013). Architectural Protein Subclasses Shape 3D Organization of Genomes during Lineage Commitment. Cell 153, 1281–1295. [DOI] [PMC free article] [PubMed] [Google Scholar]
- Pyrgaki C, Liu A, and Niswander L (2011). Grainyhead-like 2 regulates neural tube closure and adhesion molecule expression during neural fold fusion. Developmental Biology 353, 38–49. [DOI] [PMC free article] [PubMed] [Google Scholar]
- Quinlan AR, and Hall IM (2010). BEDTools: a flexible suite of utilities for comparing genomic features. Bioinformatics (Oxford, England) 26, 841–842. [DOI] [PMC free article] [PubMed] [Google Scholar]
- Rada-Iglesias A, Bajpai R, Swigut T, Brugmann SA, Flynn RA, and Wysocka J (2011). A unique chromatin signature uncovers early developmental enhancers in humans. Nature 470, 279–283. [DOI] [PMC free article] [PubMed] [Google Scholar]
- Ramírez F, Ryan DP, Grüning B, Bhardwaj V, Kilpert F, Richter AS, Heyne S, Dündar F, and Manke T (2016). deepTools2: a next generation web server for deep-sequencing data analysis. Nucleic Acids Research 44, W160–W165. [DOI] [PMC free article] [PubMed] [Google Scholar]
- Rastan S (1982). Timing of X-chromosome inactivation in postimplantation mouse embryos. Journal of Embryology and Experimental Morphology 71, 11–24. [PubMed] [Google Scholar]
- Ray HJ, and Niswander LA (2016). Grainyhead-like 2 downstream targets act to suppress epithelial-to-mesenchymal transition during neural tube closure. Development 143, 1192–1204. [DOI] [PMC free article] [PubMed] [Google Scholar]
- Rifat Y, Parekh V, Wilanowski T, Hislop NR, Auden A, Ting SB, Cunningham JM, and Jane SM (2010). Regional neural tube closure defined by the Grainy head-like transcription factors. Developmental Biology 345, 237–245. [DOI] [PubMed] [Google Scholar]
- Rossant J, and Tam PPL (2009). Blastocyst lineage formation, early embryonic asymmetries and axis patterning in the mouse. Development 136, 701–713. [DOI] [PubMed] [Google Scholar]
- Schoenfelder S, Furlan-Magaril M, Mifsud B, Tavares-Cadete F, Sugar R, Javierre B-M, Nagano T, Katsman Y, Sakthidevi M, Wingett SW, et al. (2015). The pluripotent regulatory circuitry connecting promoters to their long-range interacting elements. Genome Research 25, 582–597. [DOI] [PMC free article] [PubMed] [Google Scholar]
- Scialdone A, Tanaka Y, Jawaid W, Moignard V, Wilson NK, Macaulay IC, Marioni JC, and Gottgens B (2016). Resolving early mesoderm diversification through single-cell expression profiling. Nature 535, 289–293. [DOI] [PMC free article] [PubMed] [Google Scholar]
- Smith A (2017). Formative pluripotency: the executive phase in a developmental continuum. Development 144, 365. [DOI] [PMC free article] [PubMed] [Google Scholar]
- Werner S, Frey S, Riethdorf S, Schulze C, Alawi M, Kling L, Vafaizadeh V, Sauter G, Terracciano L, Schumacher U, et al. (2013). Dual Roles of the Transcription Factor Grainyhead-like 2 (GRHL2) in Breast Cancer. Journal of Biological Chemistry 288, 22993–23008. [DOI] [PMC free article] [PubMed] [Google Scholar]
- Werth M, Walentin K, Aue A, Schönheit J, Wuebken A, Pode-Shakked N, Vilianovitch L, Erdmann B, Dekel B, Bader M, et al. (2010). The transcription factor grainyhead-like 2 regulates the molecular composition of the epithelial apical junctional complex. Development 137, 3835–3845. [DOI] [PubMed] [Google Scholar]
- Xiang X, Deng Z, Zhuang X, Ju S, Mu J, Jiang H, Zhang L, Yan J, Miller D, and Zhang H-G (2012). Grhl2 Determines the Epithelial Phenotype of Breast Cancers and Promotes Tumor Progression. PLOS ONE 7, e50781. [DOI] [PMC free article] [PubMed] [Google Scholar]
- Yeom YI, Fuhrmann G, Ovitt CE, Brehm A, Ohbo K, Gross M, Hubner K, and Scholer HR (1996). Germline regulatory element of Oct-4 specific for the totipotent cycle of embryonal cells. Development 122, 881–894. [DOI] [PubMed] [Google Scholar]
- Zhang Y, Liu T, Meyer CA, Eeckhoute J, Johnson DS, Bernstein BE, Nusbaum C, Myers RM, Brown M, Li W, et al. (2008). Model-based Analysis of ChIP-Seq (MACS). Genome Biology 9, R137. [DOI] [PMC free article] [PubMed] [Google Scholar]
Associated Data
This section collects any data citations, data availability statements, or supplementary materials included in this article.
Supplementary Materials
Table S1. Related to Figure 1. SMC1 binding sites in ESCs and EpiLCs.
Table S2. Related to Figure 2. GRHL2 binding sites in EpiLCs identified relative to GRHL2 KO cells.
Table S3. Related to Figure 3. Ectopic GRHL2 binding sites in GRHL2 overexpressing ESCs.
Table S4. Related to Figure 4. Genes nearest to GRHL2 binding sites within the same TAD.
Table S5. Related to Figure 4. All significantly changed genes in GRHL2 KO vs WT EpiLCs (adjusted p-value < 0.05).
Table S6. Related to Figures 4 and 5. Alternative active ESC enhancers or KLF4 binding sites with a GRHL2 target as the nearest gene within the same TAD.
Table S7. Related to STAR Methods. ChIP-seq sample information and oligonucleotide sequences.
Data Availability Statement
All microarray and sequencing data have been deposited in GEO under the accession number GSE93147.