Abstract
The activation of the toll-like receptor 4 (TLR4)/nuclear factor-kappa B (NF-κB) signaling pathway has been found to play a critical role in many inflammatory diseases by controlling the expression of many cytokines. However, this pathway’s role in the pathological process of intervertebral disc degeneration (IDD) has not been reported to date. In the present study, we found universal activation of the TLR4/NF-κB signaling pathway and elevated levels of pro-inflammatory cytokines in IDD patients. The in vitro analyses in human nucleus pulposus cells (hNPC) and annulus fibrosus cells (hAFC) also indicated that Lipopolysaccharide (LPS) treatment could activate TLR4/NF-κB signaling and induce pro-inflammatory cytokine levels. By comparing the results of two microRNA (miRNA)-based microarrays, we identified 15 miRNAs that were dysregulated in both IDD tissues and LPS-treated cells. Of these miRNAs, the most prominently up-regulated was miR-625-5p, which was predicted to bind to the three prime untranslated region (3’-UTR) of collagen type I alpha 1 (COL1A1). In vitro overexpression or down-regulation of miR-625-5p was able to repress or induce the expression of COL1A1, respectively. The in vitro analyses showed that treatment with LPS, recombinant IL-6 or TNF-α could induce miR-625-5p levels but decrease COL1A1 expression. In contrast, the treatments with their corresponding inhibitors, CLI095, siltuximab and D2E7, respectively, resulted in the exact opposite effects. Taken together, our results suggest that activation of the TLR4/NF-κB signaling pathway induces pro-inflammatory cytokines, which further up-regulates the expression of miR-625-5p, resulting in the down-regulation of COL1A1 and eventually contributing to the pathological process of IDD.
Keywords: Intervertebral disc degeneration, inflammation, TLR4, NF-κB, miR-625-5p, COL1A1
Introduction
Intervertebral disks (IVDs), also known as intervertebral fibrocartilages, are fibrocartilaginous structures that function as ligaments to connect vertebrae [1-3]. IVDs consist of three parts, listed from the outside to the inside: the outer endplates, the inner annulus fibrosus (AF) and the central nucleus pulposus (NP). The AF is tough and fibrous and composed of both type I and type II collagen [1-5]. The inner core of the NP is soft and gelatinous, and functions to distribute pressure evenly across the discs [4,5]. With the aging process, the boundary between the AF and NP becomes less obvious and more disorganized, which is known as intervertebral disk degeneration (IDD) [5,6]. The most common symptom of IDD is back pain, which seriously threatens the quality of life of patients [4-6]. A variety of different mechanisms have been identified for IDD, such as genetic factors [4,6], cell death [5], and inflammation [7,8]. By sequencing the genomic DNA from IDD patients, some single nucleotide polymorphisms (SNPs) of collagen type I alpha 1 and 2 (COL1A1 and A2) were found. The mutated COL1A1 and A2 are associated with an elevated risk of IDD pathogenesis because they result in collagen deficiency and disrupt AF function [9,10]. The in vivo and in vitro analyses also found disruptions in the apoptotic and autophagic signaling pathways in IDD patients and in cells under different conditions (e.g., nutrient depletion and bacterial and viral infections, as well as biotic and abiotic stress) [5]. Chronic inflammation is associated with a cascade of degenerative events including IDD [7,8]. A number of studies have highlighted the major role of many pro-inflammatory mediators in the development of IDD [7,8,11]. For instance, the pro-inflammatory cytokines tumor necrosis factor alpha (TNF-α) and interleukin-1 beta (IL-1β) are important mediators of IDD [7,8,11]. The blockage of these pro-inflammatory cytokines using IL-10 and TGF-β in a Beagle model can significantly suppress the expression of IL-1β and TNF-α and inhibit inflammatory responses [11]. TNF-α can promote the enrichment of nuclear factor of activated T-cells 5 (NFAT5) and selectively control inflammatory responses in NP cells [12]. In addition, microRNAs (miRNAs) also play a critical role in the pathological process of IDD [13-16]. miRNAs directly bind to the 3’-untranslated region (3’-UTR) of their target mRNAs, triggering either translation inhibition or mRNA degradation [17]. A set of differentially expressed miRNAs have been identified in IDD patients; for instance, miR-125a is able to target BCL2 antagonist/killer 1 (BAK1) and regulate the apoptosis status of the NP cells [14]. MicroRNA-589 is involved in the IDD process by targeting SMAD family member 4 (SMAD4) [18].
The toll-like receptors (TLRs), a family of conserved transmembrane proteins in mammals, mediate a series of important inflammatory signaling pathways [19-21]. TLRs recognize pathogen-associated molecular patterns (PAMPs) derived from various microbes [19-21]. Of the 11 TLR members (1 to 11), TLR4 is the most well-known member because it regulates several major inflammatory signaling pathways, such as the TLR4/NF-κB (nuclear factor kappa-light-chain-enhancer of activated B cells) axis signaling, TLR4/IRF3 (interferon regulatory transcription factor 3) and the TLR4/PI3K/Akt (phosphatidylinositol-4,5-bisphosphate 3-kinase/AKT serine/threonine kinase 1) pathways [19-21]. Initially, lipopolysaccharide (LPS), a major component secreted by Gram-negative bacteria, binds to TLR4 on the cell membrane [22]. The activated TLR4 forms a super complex with several intracellular proteins, including TIR domain-containing adaptor protein (TIRAP), myeloid differentiation primary response gene 88 (MyD88), Bruton’s tyrosine kinase (BTK), TRIF-related adaptor molecule (TRAM), and TIR-domain-containing adapter-inducing interferon-β (TRIF), which further activates TNF receptor associated factor 6 (TRAF6) and downstream events, including activation of the IκB kinases (IKKs) and NF-κB signaling [23,24]. The NF-κB family comprises five members: RelA (p65), RelB, C-Rel, p105 (NFKB1; p50 precursor) and p100 (NFKB2; p52 precursor) [25]. This transcription factor family binds to DNA sequences through conserved sites known as κB sites (5’-GGGRNNYYCC-3’; R, purine; Y, pyrimidine; N, any nucleotide) [26]. Under LPS stimulation, NF-κB members translocate from the cytoplasm to the nucleus, which initiates the transactivation of a variety of downstream targets, such as the pro-inflammatory cytokines TNF-α, IL-1β and IL-6 [27-30]. The release of these elevated expression genes further enhances the inflammatory response [27-30].
In the present study, we aimed to identify the miRNAs that play a role in the pathogenesis of IDD and are regulated by inflammation to explore their targets, as well as demonstrating their functional mechanisms. By comparing the results of two independent miRNA-based microarray analyses, we identified a total of 15 interesting miRNAs. We then focused our studies on revealing the regulatory mechanism of miR-625-5p, the miRNA with the most up-regulated expression. Our results demonstrated that pro-inflammatory cytokines up-regulated miR-625-5p and caused the down-regulation of its target COL1A1. The dysregulation of COL1A1 might impair the stability of IVDs, eventually resulting in the occurrence of IDD.
Materials and methods
Venous blood collection and plasma cytokine measurement
Venous blood samples were drawn from a total of 96 participants, including 24 healthy volunteers and 72 IDD patients under Pfirrmann grades 1, 3 and 5 (24 patients per grade) according to magnetic resonance imaging (MRI) diagnosis. The basic characteristics of the participants, including age and gender, are summarized in Table S1. The study protocol was reviewed and approved by the ethical board of the First People’s Hospital of Yunnan Province, China. Informed consent was obtained from all participants. After collection, blood samples were stored in EDTA tubes. Plasma was obtained after centrifugation at 1000 g for 10 min and then stored in 1 mL aliquots at -70°C until testing. The concentrations of serum LPS, lipopolysaccharide binding protein (LBP), and cytokines including IL-1β, IL-4, IL-6 and IL-13 were measured by their corresponding enzyme-linked immunosorbent assay (ELISA) kits. These kits were obtained from the following sources: LPS (MyBiosource, USA, Cat. #MBS266722), LBP (Abcam, USA, Cat. #ab213805), IL-1β (Invitrogen, USA, Cat. #BMS224-2), IL-4 (Invitrogen, Cat. #BMS225HS), IL-6 (Invitrogen, Cat. #BMS213HS) and IL-13 (Invitrogen, Cat. #BMS231-3).
Cell culture, treatment and transfection
Two commercial human cell lines, the annulus fibrosus cell line (hAFC, Cat. #4810) and nucleus pulposus cell line (hNPC, Cat. #4800) were purchased from ScienCell Research Laboratories (SCRL, USA). Both cell lines were grown in Nucleus Pulposus Cell Medium (NPCM) (SCRL, Cat. #4801) supplemented with 10% fetal bovine serum (FBS) (Sigma, USA, Cat. #F2442) and 1% of a penicillin-streptomycin mixture (Sigma, Cat. #P4333). After reaching 80% confluence, cells were treated with different concentrations (0, 50, 100 or 200 ng/mL) of LPS (Sigma, Cat. #L2630) for 2 hr, followed by different concentrations (0, 5, 10 or 20 ng/mL) of recombinant human TNF-α (rhTNF-α) (Sigma, USA, Cat. #SRP3177), and different concentrations (0, 10, 20 or 30 ng/mL) of recombinant human IL-6 (Sigma, USA, Cat. #GF338) for 8 h. Cells were then harvested and subjected to RNA isolation and protein extraction. Cell transfection was carried out as described previously [31]. In brief, miR-NC, miR-625-5p-mimic and anti-miR-625-5p were transfected into cells using the HiPerFect Transfection Reagent (QIAGEN, USA, Cat. #301704) following the manufacturer’s guidelines. The transfected cells were incubated at 37°C for 24 hr, followed by subjection to the required experiments.
RNA isolation and microarray analysis
RNA isolation and microarray analyses were performed as described previously [31,32]. In brief, total RNA was isolated from IDD patient tissues and the hNPC cells were treated with LPS using the miRNeasy mini kit (QIAGEN, Cat. #217004) following the manufacturer’s protocol. For microarray analysis, 1 μg RNA from each sample was labeled using the FlashTagTM Biotin RNA Labeling Kit (ThermoFisher Scientific, USA, Cat. #901910). Following this step, the labeled RNA was quantified, fractionated, and hybridized to the miRNA microarray following previous protocols. The microarray chips were scanned with the GeneChip Scanner 3000 7 G (Thermo Fisher Scientific, Cat. #000213) using Command Console v3.2.4 software.
Quantitative reverse-transcription polymerase chain reaction (qRT-PCR)
For IL-1β, IL-6 and COL1A1 mRNA level detection, 1.0 μg RNA of each sample was subjected to synthesize the first-strand cDNA using the M-MuLV reverse transcriptase kit (New England Biolabs, USA, Cat. #M0253S). The resulting cDNA was subjected to qRT-PCR analyses with the following primers: IL-1B Forward: TGGTGTTCTCCATGTCCTTTGTAC, IL-1B Reverse: TGATGTACCAGTTGGGGAACTGGG; IL-6 Forward: CAAGCCAGAGCTGTGCAGATGAGT, IL-6 Reverse: CCTCAGGCTGGACTGCAGGAACTC; COL1A1 Forward: CCACCTCAAGAGAAGGCTCACGAT, COL1A1 Reverse: CACTCTTCCAGTCAGAGTGGCACA. The relative expression of these three genes were normalized using β-actin as an internal control. The individual miRNA expression level was determined by qRT-PCR following previous protocols. Briefly, RNA samples were used to generate cDNA with the TaqMan MicroRNA Reverse Transcription kit (ThermoFisher Scientific, Cat. #4366596). The expression levels of miR-10b, miR-100, miR-212, miR-412, miR-511, miR-625-5p and miR-668 were then measured by qRT-PCR using the TaqMan microRNA assay following the manufacturer’s protocol. The relative miRNA expression levels were calculated using the comparative Ct (ΔΔCt) method and RNU6B was used as an internal control for normalization.
Protein extraction and immunoblot analysis
The total protein from IDD patient tissues and cultured cells were extracted using whole cell lysis buffer containing 50 mM KCl, 1% NP-40, 25 mM HEPES (pH 7.8), 100 μg/mL leupeptin, 20 μg/mL aprotinin, 125 μM DTT, 1 mM PMSF, and 1 mM Na3VO4. Tissues and cells were then homogenized and kept on ice for 30 min. After centrifugation at 13,000 rpm for 10 min, the supernatant was subjected to quantification of the protein concentration. The cytoplasmic and nuclear proteins were separated using a NE-PERTM Nuclear and Cytoplasmic Extraction Kit (ThermoFisher Scientific, Cat. #78833) following the manufacturer’s guidelines. Equal protein amounts from each sample were boiled in Laemmli SDS-sample buffer (Sigma, Cat. #3401) at 95°C for 5 min, followed by electrophoresis, transferring to a membrane from the gels, and probing with primary antibodies, including anti-TLR4 (Abcam, Cat. #ab13556), anti-MyD88 (Abcam, Cat. #ab2064), anti-TRAF6 (Abcam, Cat. #ab33915), anti-p65 (Abcam, Cat. #ab32536), anti-p50 (Abcam, Cat. #ab32360), anti-LSD1 (Abcam, Cat. #ab129195), anti-β-actin (Abcam, Cat. #ab8226) and anti-GAPDH (Abcam, Cat. #ab9483). The protein band signals were determined by using enhanced chemiluminescence (ECL) reagents (ThermoFisher Scientific, Cat. #32106).
Immunohistochemistry
The immunohistochemistry (IHC) assay was performed following a previous protocol [33]. Briefly, IDD patient tissue samples were fixed in 10% neutral-buffered formalin followed by rinsing the tissue with PBS three times. After dehydration with ethanol, exchanging the ethanol with xylene, and exchanging the xylene with paraffin, tissues were cut into five-micrometer-thick sections. The slides were stained using a PierceTM Peroxidase IHC Detection Kit (ThermoFisher Scientific, Cat. #36000). Images were captured using a Leica DM 500B fluorescence microscope.
Statistical analysis
Statistical analyses of data from each experiment were performed using a two-sided Student’s t test. Significance was set at the P < 0.05 (*), P < 0.01 (**) and P < 0.001 (***) levels. All experiments were performed at least three times.
Results
Concentrations of serum LPS and pro-inflammatory cytokines increases in IDD patients
Although many studies have found that the induction of pro-inflammatory cytokines is an important cause of IDD pathogenesis [7,8,11,12], it is still obscure how these pro-inflammatory cytokines are up-regulated. Thus, we aimed to investigate the underlying mechanisms regarding the upstream signaling pathways that regulate pro-inflammatory cytokines in IDD. Given that pro-inflammatory cytokines, such as TNF-α, IL-1β and IL-6, are downstream target genes of the transcription factor NF-κB, and the activation of the TLR4/NF-κB signaling pathway mediated by LPS plays a critical role in the pathogenesis of many inflammatory diseases [27-30], we primarily measured the concentrations of serum LPS and pro-inflammatory cytokines in IDD patients with differing Pfirrmann grades (1, 3 and 5; 24 patients each grade) to verify the activation of this pathway. As shown in Figure 1A, the serum levels of LPS in different Pfirrmann grade IDD patients were 0.15±0.02 EU/mL (grade 1), 0.27±0.03 EU/mL (grade 3), and 0.38±0.04 EU/mL (grade 5), respectively, which were significantly higher than the healthy control patients (0.07±0.01 EU/mL). Similarly, the serum LBP levels in IDD patients were also significantly increased with the severity of Pfirrmann grades (Figure 1B). In the healthy controls, the average LBP level was 11±1.2 μg/mL, while the LBP level significantly increased to 18±1.3 μg/mL, 26.7±2.1 μg/mL and 32.2±2.9 μg/mL in Pfirrmann grade 1, 3 and 5 patients, respectively. In addition, we also measured the serum levels of the cytokines IL-1β, IL-4, IL-6 and IL-13. Our results showed that only the pro-inflammatory cytokines IL-1β and IL-6 showed increased expression (Figure 1C and 1D) and not the anti-inflammatory cytokines IL-4 and IL-13 (Figure 1E and 1F). These results implied that elevated LPS levels activated the TLR4/NF-κB signaling pathway, which up-regulated pro-inflammatory cytokines in IDD patients.
Figure 1.
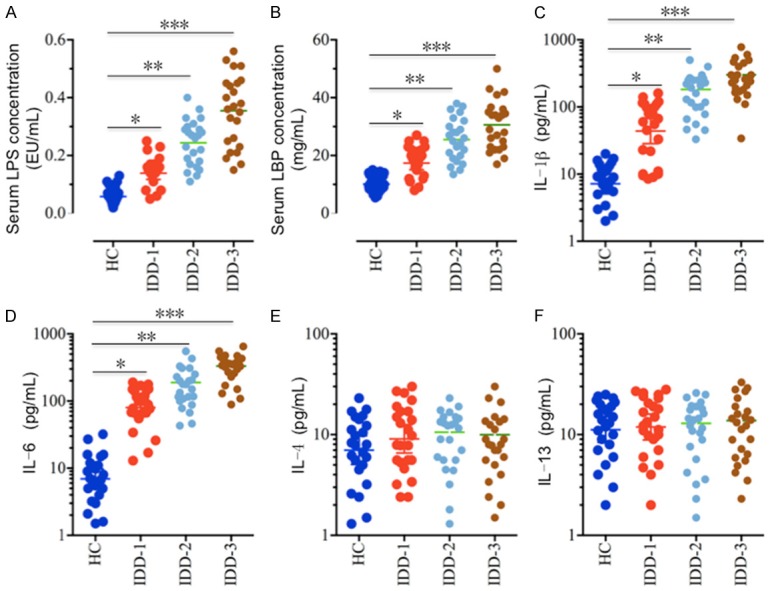
Serum levels of LPS and pro-inflammatory cytokines are elevated in IDD patients. Circulating levels of (A) LPS, (B) LBP, (C) IL-1β, (D) IL-6, (E) IL-4, and (F) IL-13 were analyzed in serum samples obtained from healthy controls (HC, n = 24) and IDD patients with different Pfirrmann grades (IDD-1, grade1; IDD-2, grade 3; IDD-3, grade 5; n = 24 each grade). *P < 0.05, **P < 0.01, ***P < 0.001.
TLR4/NF-κB signaling pathway is activated in IDD patients
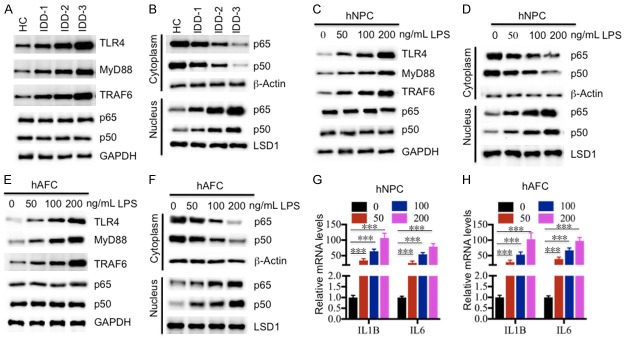
To further verify the activation of the TLR4/NF-κB signaling pathway in IDD patients, we primarily collected degenerative tissues from three grades (1, 3 and 5) of IDD patients, followed by an examination of protein levels of the TLR4/NF-κB signaling members, including TLR4, MyD88, TRAF6, p65 and p50. As shown in Figure 2A, we found that TLR4, MyD88 and TRAF6 were significantly up-regulated in total extracts from IDD tissues, and their levels were positively associated with the severity of Pfirrmann grades. However, we did not find a significant difference for p65 and p50 protein levels in the total extracts (Figure 2A). Since many studies have found that the NF-κB subunits translocate from the cytoplasm to the nucleus when they are activated [27-30], we next wanted to determine if this also occurs in these degenerative tissues. Accordingly, we isolated the cytoplasmic and nuclear proteins from one healthy control and three degenerative tissues followed by detection of p65 and p50 levels. Our results indicated that the cytoplasmic protein levels of p65 and p50 gradually decreased, while the nuclear protein levels of p65 and p50 were significantly enriched in IDD tissues (Figure 2B). Importantly, the decrease of cytoplasmic p65 and p50 and their increase in the nucleus were associated with the severity of disc degeneration (Figure 2B). To further verify if the activation of the TLR4/NF-κB pathway resulted from the elevated LPS level, we treated the hNPC and hAFC cells with different concentrations (0, 50, 100 or 200 μg/mL) of LPS in vitro followed by measuring the TLR4, MyD88, TRAF6, p65 and p50 protein levels in total cell lysates. As expected, our results showed that TLR4, MyD88 and TRAF6 were significantly induced with the treatment of LPS, and their levels were positively associated with the LPS concentration (Figure 2C and 2E). Similar to the results in the IDD tissues, we also did not observe the induction of p65 and p50 in both hNPC and hAFC cells with LPS treatment (Figure 2C and 2E). In addition, we also isolated the cytoplasmic and nuclear proteins from those treated cells, and then examined the distribution of p65 and p50 in the two portions. Consistent with the proteins isolated from IDD tissues, we also observed the translocation of p65 and p50 from the cytoplasm to the nucleus in both hNPC and hAFC cells with the treatment of LPS (Figure 2D and 2F). These results suggested that the TLR4/NF-κB pathway was activated in response to LPS treatment. Given that the pro-inflammatory cytokines TNF-α, IL-1β and IL-6 are known downstream target genes of NF-κB, we also measured the IL-1β and IL-6 mRNA levels in hNPC and hAFC cells following LPS treatment. As expected, our results showed that both IL-1β and IL-6 mRNA levels were significantly induced under LPS treatment (Figure 2G and 2H).
Figure 2.
Activation of the TLR4/NF-κB signaling pathway in vivo and in vitro. (A) The protein levels of members of the TLR4/NF-κB signaling pathway in IDD tissues. The protein levels of TLR4, MyD88, TRAF6, p65 and p50 were examined in a healthy control (HC), and three IDD tissues, including IDD-1, -2 and -3. GAPDH was used as the loading control. (B) Protein levels of p65 and p50 in the cytoplasm and nucleus. The cytoplasmic and nuclear portions of the IDD tissues were prepared, and immunoblots were performed to examine the p65 and p50 levels in these two portions. β-Actin and LSD1 were used as controls to determine the levels of cytoplasmic and nuclear proteins, respectively. (C and D) The protein levels of members of the TLR4/NF-κB signaling pathway in (C) hNPC and (D) hAFC cells treated with LPS. The hNPC and hAFC cells were treated with different concentrations of LPS (0, 50, 100 or 200 ng/mL) for 2 hr, followed by detecting the protein levels of TLR4, MyD88, TRAF6, p65 and p50. GAPDH was used as the loading control. (E and F) Protein levels of p65 and p50 in the cytoplasm and nucleus of (E) hNPC and (F) hAFC cells. The cytoplasmic and nuclear portions of cells used in (C) and (D) were prepared, and immunoblots were performed to examine the p65 and p50 levels in these two portions. β-Actin and LSD1 were used as controls to determine the levels of cytoplasmic and nuclear proteins, respectively. (G and H) The relative mRNA levels of IL1B and IL6 in (G) hNPC and (H) hAFC cells treated with LPS. Cells used in (C) and (D) were subjected to RNA isolation, followed by measuring the expression levels of IL1B and IL6 by qRT-PCR. ***P < 0.001.
MicroRNA-625-5p was up-regulated by LPS
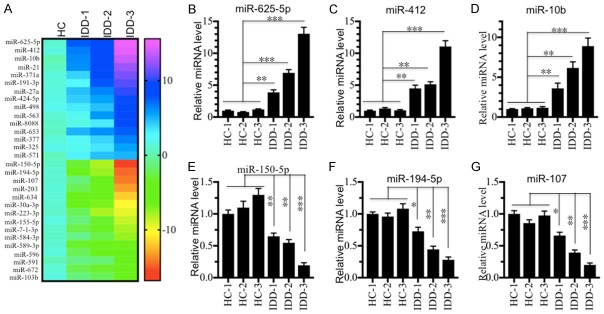
Given that miRNAs have been found to a play role in the pathogenesis of IDD [13-16], we next sought to identify the miRNAs involved in IDD pathogenesis and which are regulated by LPS. To find miRNAs that meet these two criteria, we performed two independent miRNA microarray experiments. First, we isolated RNA from one healthy control and three IDD tissues (Pfirrmann grades 1, 3 and 5) followed by subjection to a Genechip miRNA 4.0 array. We identified a total of 164 miRNAs (95 up-regulated and 69 down-regulated) that were consistently dysregulated in the different IDD samples compared to the healthy control (Table S2). As shown in Figure 3A, we listed the top 15 up-regulated and top 15 down-regulated miRNAs. To verify the accuracy of the microarray analysis, we examined the expression levels of three up-regulated miRNAs (miR-625-5p, miR-412 and miR-10b) and three down-regulated miRNAs (miR-150-5p, miR-194-5p and miR-107) in three healthy controls (HC-1, -2 and -3) and three IDD tissues (same samples used for microarray analysis). Consistently, our results showed that the expression levels of miR-625-5p, miR-412 and miR-10b were significantly up-regulated (Figure 3B-D), while the expressions of miR-150-5p, miR-194-5p and miR-107 were dramatically down-regulated in IDD tissues compared to healthy controls (Figure 3E-G). Second, we treated hNPC cells with 50 or 200 ng/mL LPS, and subjected the corresponding RNA samples to microarray analysis. Through this microarray experiment, we found a total of 151 differentially expressed miRNAs after LPS treatment. Of these miRNAs, 96 were up-regulated, and the other 55 miRNAs were down-regulated (Table S3). As shown in Figure 4A, we listed the top 15 up-regulated and top 15 down-regulated miRNAs. By comparing these two microarray analysis results, we found 15 miRNAs that overlapped (Figure 4B), including miR-10b, miR-107, miR-132, miR-194-5p, miR-197, miR-204, miR-455, miR-625-5p, miR-653, miR-671, miR-888, miR-933, miR-937, miR-1227 and miR-1298 (Tables S2 and S3). These overlapping miRNAs from the two independent microarrays might be the miRNAs that we were interested in. Moreover, we also examined the expression levels of three up-regulated miRNAs (miR-625-5p, miR-212 and miR-10b) and three down-regulated miRNAs (miR-100, miR-511 and miR-668) in the RNA samples in the same manner as in the secondary microarray analysis to verify their expression. Consistently, our results showed that the expression levels of miR-625-5p, miR-212 and miR-10b were significantly up-regulated (Figure 4C-E), while the expressions of miR-100, miR-511 and miR-668 were dramatically down-regulated following LPS treatment (Figure 4F-H).
Figure 3.
miR-625-5p is up-regulated in IDD patients. (A) The heat maps of differentially expressed miRNAs in IDD patients. The miRNAs from a healthy control (HC), and three IDD patients with different Pfirrmann grades (IDD-1, -2 and -3) were subjected to microarray analysis. The 15 up-regulated and 15 down-regulated miRNAs with the most obvious changes are shown. (B-G) Verification of miRNA levels in samples from IDD patients. qRT-PCR was performed to verify the expression of three up-regulated miRNAs, (B) miR-625-5p, (C) miR-412 and (D) miR-10b; and three down-regulated miRNAs, (E) miR-150-5p, (F) miR-194-5p, and (G) miR-107. *P < 0.05, **P < 0.01, and ***P < 0.001.
Figure 4.
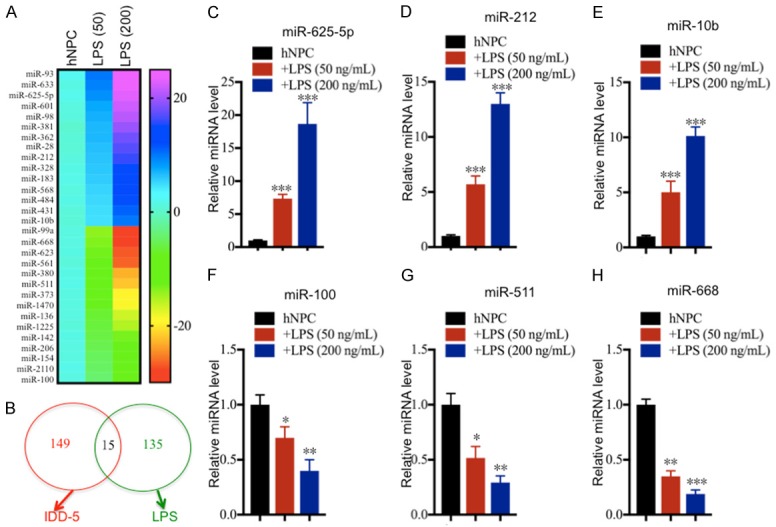
miR-625-5p is induced by LPS treatment. (A) The heat maps of differentially expressed miRNAs by LPS treatment. hNPC cells were treated with different concentrations of LPS (0, 50 or 200 ng/mL), followed by RNA isolation and microarray analysis. The 15 up-regulated and 15 down-regulated miRNAs with the most obvious changes are shown. (B) Comparing the two microarray analysis results. The two independent microarray results (IDD tissues and hNPC cells treated with LPS) were subjected to similarity comparison. (C-H) Verification of miRNA levels in samples from LPS-treated hNPC cells. qRT-PCR was performed to verify the expression of three up-regulated miRNAs, (C) miR-625-5p, (D) miR-212 and (E) miR-10b; and three down-regulated miRNAs, (F) miR-100, (G) miR-511, and (H) miR-107. *P < 0.05, **P < 0.01, and ***P < 0.001.
MicroRNA-625-5p directly targets the 3’-UTR of COL1A1
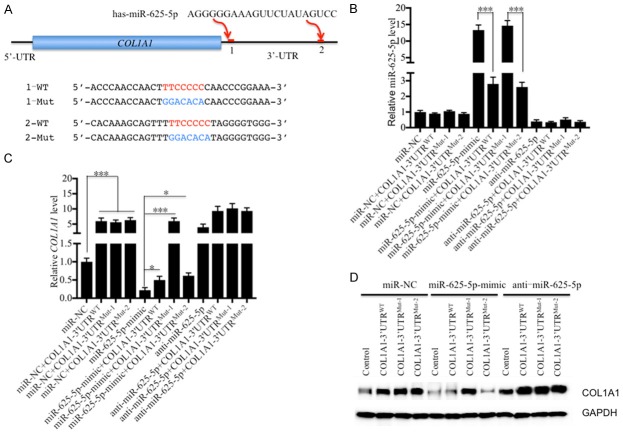
To investigate whether these overlapping 15 miRNAs in the two microarray analyses can target members of TLR4/NF-κB pathway and the critical genes involved in IDD pathogenesis, we searched their potential targets in a miRNA target prediction database (http://www.mirdb.org/miRDB). After carefully checking all of the potential targets of these miRNAs, we did not find any member of TLR4/NF-κB pathway. However, we found one gene, known as COL1A1, that can be targeted by miR-625-5p. Interestingly, we found two sites (43-49 and 1284-1290) in the 3’-UTR of COL1A1 that can be bound by miR-625-5p (Figure 5A). To verify that miR-625-5p can target COL1A1 and to investigate its binding site in the 3’-UTR of COL1A1, we constructed vectors containing COL1A1 coding sequences and either its wild type or mutated 3’-UTRs (Figure 5A), namely, pCDNA3-COL1A1-3’-UTRWT, pCDNA3-COL1A1-3’-UTRMut-1 and pCDNA3-COL1A1-3’-UTRMut-2. Following this step, we transfected these vectors combined with miR-NC, miR-625-5p-mimic or anti-miR-625-5p into hNPC cells. qRT-PCR was then performed to determine miR-625-5p and COL1A1 expression levels. As shown in Figure 5B, we did not observe a significant difference for miR-625-5p levels in cells transfected miR-NC alone and cells co-transfected miR-NC and pCDNA3-COL1A1-3’-UTRWT, pCDNA3-COL1A1-3’-UTRMut-1 or pCDNA3-COL1A1-3’-UTRMut-2. However, the miR-625-5p level increased nearly 15-fold after transfecting the miR-625-5p-mimic (Figure 5B), while it decreased 3-fold after co-transfecting with pCDNA3-COL1A1-3’-UTRWT or pCDNA3-COL1A1-3’-UTRMut-2 (Figure 5B). Interestingly, the co-transfection of miR-625-5p-mimic and pCDNA3-COL1A1-3’-UTRMut-1 cannot repress miR-625-5p expression (Figure 5B), which suggests that miR-625-5p binds to the 3’-UTR of COL1A1 through the 43-49 site, but not the 1284-1290 site. The different transfections of anti-miR-625-5p with pCDNA3-COL1A1-3’-UTRWT, pCDNA3-COL1A1-3’-UTRMut-1 or pCDNA3-COL1A1-3’-UTRMut-2 resulted in similar levels of miR-625-5p (Figure 5B), which were dramatically decreased in comparison to miR-NC and miR-625-5p-mimic transfections. In addition, we found that the expression of COL1A1 in cells co-transfected with miR-NC and pCDNA3-COL1A1-3’-UTRWT, pCDNA3-COL1A1-3’-UTRMut-1 or pCDNA3-COL1A1-3’-UTRMut-2 increased 5-fold in comparison to cells transfected miR-NC alone (Figure 5C). In contrast to the miR-625-5p level, the expression of COL1A1 significantly decreased in cells transfected with miR-625-5p-mimic alone, and it was slightly increased after expressing pCDNA3-COL1A1-3’-UTRWT or pCDNA3-COL1A1-3’-UTRMut-2 (Figure 5C). Importantly, the co-transfection of miR-625-5p-mimic and pCDNA3-COL1A1-3’-UTRMut-1 cannot repress the COL1A1 mRNA level, which further verified the conclusion that miR-625-5p binds to the 3’-UTR of COL1A1 through the 43-49 site. The transfection of anti-miR-625-5p resulted in a significant increase of COL1A1 compared to the transfection of miR-NC alone (Figure 5C). We did not observe an obvious change in the COL1A1 mRNA level in cells co-transfected with anti-miR-625-5p and pCDNA3-COL1A1-3’-UTRWT, pCDNA3-COL1A1-3’-UTRMut-1 or pCDNA3-COL1A1-3’-UTRMut-2 (Figure 5C). Moreover, we also determined the COL1A1 protein levels in these cells. Consistent with the mRNA level, we found that co-transfection of pCDNA3-COL1A1-3’-UTRMut-1 and miR-625-5p-mimic cannot repress COL1A1 protein levels (Figure 5D). Importantly, COL1A1 decreased with the transfection of miR-625-5p-mimic but increased with the transfection of anti-miR-625-5p (Figure 5D). These results suggest that COL1A1 is a direct target of miR-625-5p.
Figure 5.
COL1A1 is a direct target of miR-625-5p. (A) Schematic representation of the 3’-UTRs of COL1A1 containing two putative miR-625-5p binding sites. These two binding sites are indicated as 1 and 2 and are shown with red lines. The seed locations of miR-625-5p are indicated with red font, while the mutated locations are indicated with blue font. (B-D) COL1A1 can be targeted by miR-625-5p at site 1. The coding sequences of COL1A1 and its wild-type (WT) and mutated (Mut1 and 2) 3’-UTRs were cloned into the pCDNA3 vector. Then, the following combinations of plasmids were transfected into hNPC cells: miR-NC; miR-NC + COL1A1-3’-UTRWT; miR-NC + COL1A1-3’-UTRMut-1; miR-NC + COL1A1-3’-UTRMut-2; miR-625-5p-mimic; miR-625-5p-mimic + COL1A1-3’-UTRWT; miR-625-5p-mimic + COL1A1-3’-UTRMut-1; anti-miR-625-5p; anti-miR-625-5p + COL1A1-3’-UTRWT; anti-miR-625-5p + COL1A1-3’-UTRMut-1; and anti-miR-625-5p + COL1A1-3’-UTRMut-2. After transfection for 48 hr, cells were collected to detect (B) miR-625-5p, (C) COL1A1 mRNA and (D) COL1A1 protein levels. *P < 0.05 and ***P < 0.001.
COL1A1 is down-regulated in IDD tissues and is negatively regulated by LPS in vitro
Since our data showed that miR-625-5p was up-regulated in IDD tissues and COL1A1 was a target of miR-625-5p, we speculated that COL1A1 was down-regulated in IDD tissues. To verify this hypothesis, we performed IHC staining to detect the in vivo level of COL1A1 in IDD tissues. As shown in Figure 6A, the IHC staining results showed that the COL1A1 protein level gradually decreased with the severity of the degenerative discs, and it showed the highest level in the healthy control, followed by IDD-1 (Pfirrmann grade 1), IDD-2 (Pfirrmann grade 3) and IDD-3 (Pfirrmann grade 5). Consistently, we also observed a similar pattern of COL1A1 protein levels in these tissues by immunoblot analysis (Figure 6B). Given that LPS can regulate the miR-625-5p level, we next sought to determine if LPS treatment also affected the COL1A1 level. Accordingly, we treated the hNPC and hAFC cells with different concentrations of LPS (0, 50, 100 or 200 ng/mL) followed by examination of the COL1A1 mRNA and protein levels. As shown in Figure S1A-D, the expression level of miR-625-5p significantly increased with LPS treatment, while the COL1A1 mRNA level was markedly repressed under the same conditions. Consistent with its mRNA level, the COL1A1 protein level also dramatically decreased in both cell lines with LPS treatment (Figure 6C and 6D). These results indicate that the expression level of COL1A1 is negatively controlled by LPS.
Figure 6.
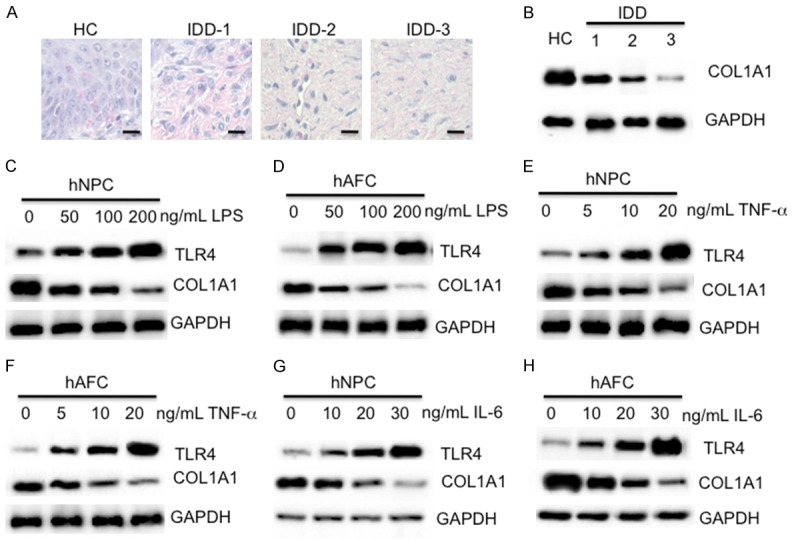
COL1A1 is down-regulated in vivo and in vitro. (A and B) IHC staining and immunoblot of COL1A1 in IDD tissues. One healthy tissue (HC) and three IDD tissues with different Pfirrmann grades (IDD-1, -2 and -3) were subjected to (A) IHC staining and (B) immunoblot analysis using an anti-COL1A1 antibody. Bars = 50 mm in (A). (C and D) LPS treatment repressed the COL1A1 level. hNPC and hAFC cells were treated with different concentrations of LPS (0, 50, 100 or 200 ng/mL), followed by examination of the protein levels of TLR4 and COL1A1. GAPDH was used as a loading control. (E and F) TNF-α treatment repressed the COL1A1 level. hNPC and hAFC cells were treated with different concentrations of recombinant TNF-α (0, 5, 10 or 20 ng/mL), followed by examination of the protein levels of TLR4 and COL1A1. GAPDH was used as a loading control. (G and H) IL-6 treatment repressed the COL1A1 level. hNPC and hAFC cells were treated with different concentrations of recombinant IL-6 (0, 5, 10 or 20 ng/mL), followed by examination of the protein levels of TLR4 and COL1A1. GAPDH was used as a loading control.
LPS treatment is able to induce an inflammatory response because of the up-regulation of a number of pro-inflammatory cytokines such as TNF-α, IL-1β and IL-6 [34,35]. Thus, we next sought to investigate if treatment with these pro-inflammatory cytokines would also result in similar effects on COL1A1 expression. Accordingly, we treated the hNPC and hAFC cells with different concentrations of recombinant human TNF-α (0, 5, 10 or 20 ng/mL) or IL-6 (0, 10, 20 or 30 ng/mL) followed by measuring the levels of miR-625-5p, and COL1A1 mRNA and protein levels. As shown in Figure S1E-L, both TNF-α and IL-6 treatments can induce the miR-625-5p level, but inhibit the COL1A1 mRNA level. The immunoblot analysis results also showed that the COL1A1 protein level dramatically decreased in both cell lines with the TNF-α and IL-6 treatment (Figure 6E-H).
Inhibition of intracellular LPS, TNF-α or IL-6 repressed the miR-625-5p level but increased the COL1A1 level
Our above results have demonstrated that the in vitro treatments of LPS, TNF-α and IL-6 can cause up-regulation of miR-625-5p but down-regulation of COL1A1. Based on this notion, we speculated that the inhibition of intracellular LPS, TNF-α or IL-6 should result in the repression of miR-625-5p levels but the increase of COL1A1 levels. To verify this hypothesis, we incubated hNPC cells with 100 ng/mL LPS, 10 ng/mL TNF-α or 20 ng/mL IL-6, followed by treatment with 1 μM CLI095 (LPS inhibitor), 1 μg/mL siltuximab (IL-6 inhibitor) or 1 μg/mL D2E7 (TNF-α inhibitor), respectively. We then examined the expression levels of miR-625-5p, and COL1A1 mRNA and protein levels in these treated cells. As shown in Figure 7A-C, the CLI095 treatment can significantly repress the LPS-induced miR-625-5p level, but up-regulates the COL1A1 level. Similarly, we observed the same effects in cells treated with IL-6 + Siltuximab and TNF-α + D2E7 (Figure 7D-I). These results further indicated that inflammation status positively regulated the miR-625-5p level but negatively mediated the COL1A1 level.
Figure 7.
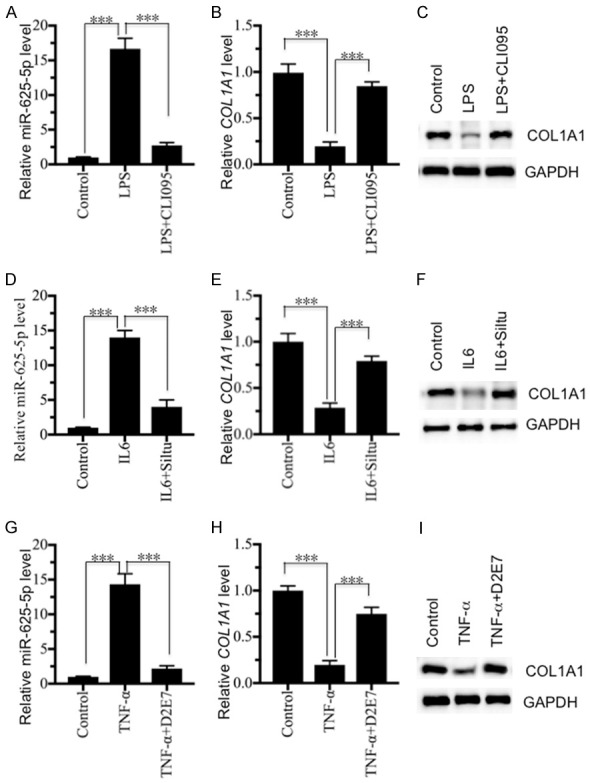
Inhibition of LPS and pro-inflammatory cytokines repressed miR-625-5p levels but increased COL1A1 levels. hNPC cells were treated with 100 ng/mL LPS, 10 ng/mL recombinant TNF-α or 20 ng/mL recombinant IL-6, followed by treatment with 1 mM CLI095 (LPS inhibitor), 1 mg/mL siltuximab (IL-6 inhibitor) or 1 mg/mL D2E7 (TNF-α inhibitor), respectively. The obtained cells were subjected to RNA and protein extraction to determine the miR-625-5p, COL1A1 mRNA and protein levels. (A-C) The relative levels of (A) miR-625-5p, (B) COL1A1 mRNA and (C) COL1A1 protein following LPS and CLI095 treatment. ***P < 0.001. (D-F) The relative levels of (D) miR-625-5p, (E) COL1A1 mRNA and (F) COL1A1 protein following recombinant IL-6 and siltuximab treatment. ***P < 0.001. (G-I) The relative levels of (G) miR-625-5p, (H) COL1A1 mRNA and (I) COL1A1 protein following recombinant TNF-α and D2E7 treatment. ***P < 0.001.
Discussion
LPS is the major component of the Gram-negative bacterial outer membrane [35]. After release from bacteria, LPS functions as the prototypical endotoxin to bind to the TLR4 receptor to initiate the immune response and promote the secretion of pro-inflammatory cytokines [36,37]. Although elevated levels of pro-inflammatory cytokines have been found in IDD patients [7,8,11,12], its upstream regulatory signaling pathway has not been thoroughly elucidated to date. In this study, we found that activation of the TLR4/NF-κB signaling pathway in degenerative disc tissues causes the translocation of the p65 and p50 NF-κB subunits from the cytoplasm to the nucleus. The activated NF-κB transcription factor induces the expression of the pro-inflammatory cytokines TNF-α, IL-1β and IL-6, the secretion of which to the cytoplasm further aggravates the inflammatory response. This intracellular inflammation status up-regulates the miR-625-5p level but down-regulates the COL1A1 level, which causes the impairment of collagens and eventually leads to the pathogenesis of IDD (Figure 8).
Figure 8.
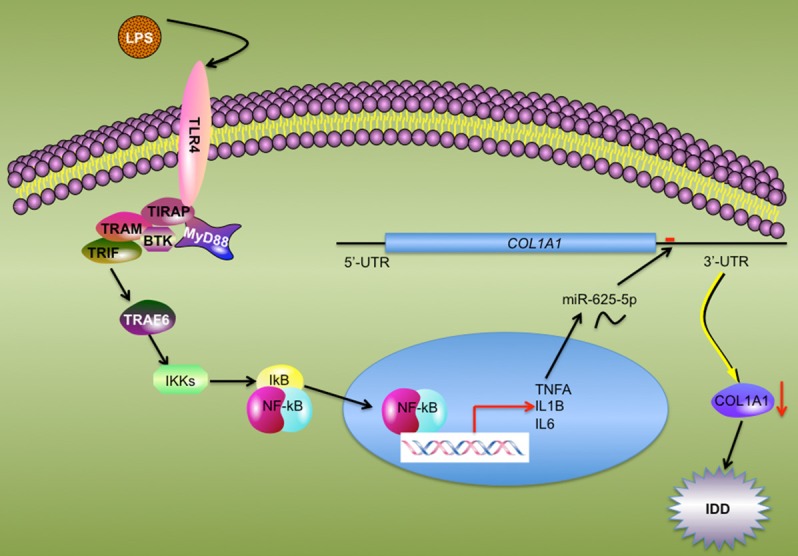
Schematic model of the TLR4/NF-κB pathway mediating miR-625-5p and COL1A1 in IDD pathogenesis. The elevated level of serum LPS binds to TLR4 and activates its downstream signaling pathways including TRAF6-IKKs-NF-κB axis signaling. The activated NF-κB subunits translocate from the cytoplasm to the nucleus, and induce the transcription of pro-inflammatory cytokines. The secretion of mature pro-inflammatory cytokines up-regulates miR-625-5p, causing the down-regulation of COL1A1 and leading to the impairment of collagen. This disruption of collagen in AF results in the pathogenesis of IDD.
Similar to many chronic inflammatory diseases (e.g., chronic liver disease and chronic obstructive pulmonary disease) and infectious diseases (e.g., tuberculosis, trypanosomiasis, malaria, and filariasis) [39,40], we first reported the activation of the TLR4/NF-κB signaling pathway in IDD patients in the present study. Except for the TLR4/NF-κB pathway, the binding of LPS to TLR4 can activate several other downstream signaling pathways, including the TLR4/IRF3 and TLR4/PI3K/Akt pathways [19-22]. In this study, we only investigated the TLR4/NF-κB pathway because pro-inflammatory cytokines are mainly regulated by NF-κB. In Figure 1, we demonstrated a significant increase in the pro-inflammatory cytokines IL-1β and IL-6 but not the anti-inflammatory cytokines IL-4 and IL-13. Thus, we speculate that the TLR4/NF-κB pathway should play a significant role in the pathogenesis of IDD. Even so, we cannot rule out that the other two signaling pathways do not work during IDD pathogenesis. Based on the notion that LPS is secreted by Gram-negative bacteria, a possible approach for IDD patients would be to take antibiotics that specifically function against Gram-negative bacteria before further treatment.
During the past few years, many studies have investigated the differentially expressed miRNA profiles in IDD tissues [13-16]. A number of miRNAs have been found to play roles in different signaling pathways. For instance, miR-10b and miR-21 can promote NP cell proliferation through the RhoC-Akt pathway and through the PTEN/AKT pathway, respectively [41,42]. Up-regulation of miR-27a targets PI3K to induce apoptosis in NP cells [43]. Deregulated miR-155 promotes apoptosis in NP cells through targeting two apoptotic genes, Fas-associated protein with death domain (FADD) and caspase-3 [44]. One focus of this study was to identify miRNAs that are regulated by LPS and that can regulate TLR4/NF-κB signaling pathway members during IDD pathogenesis. Although we identified 15 overlapping miRNAs by two independent microarray analyses, none of them could be predicted to target members of the TLR4/NF-κB signaling pathway. Fortunately, we found that miR-625-5p could target COL1A1 and cause its down-regulation in IDD tissues. We are currently investing the roles of the other 14 miRNAs and their targets during IDD pathogenesis. In our microarray analysis based on IDD tissue samples, we also found the up-regulation of miR-10b, miR-21 and miR-27a and the down-regulation of miR-155, which suggests that the quality of our microarray analysis is believable.
Conclusions
Our study reveals that LPS activates the TLR4/NF-κB signaling pathway, causing the translocation of NF-κB subunits from the cytoplasm to the nucleus. The activation of NF-κB induces pro-inflammatory cytokines, which aggravates the inflammatory microenvironment and induces the expression of miR-625-5p. The increase in miR-625-5p binds to the 3’-UTR of COL1A1 and causes its down-regulation, eventually leading to the decrease of collagen and the pathogenesis of IDD.
Acknowledgements
We thank Dr. Wantong Liang for his help to design the experiments and carefully revising the manuscript.
Disclosure of conflict of interest
None.
Supporting Information
References
- 1.Daly C, Ghosh P, Jenkin G, Oehme D, Goldschlager T. A review of animal models of intervertebral disc degeneration: pathophysiology, regeneration, and translation to the clinic. Biomed Res Int. 2016;2016:5952165. doi: 10.1155/2016/5952165. [DOI] [PMC free article] [PubMed] [Google Scholar]
- 2.Iatridis JC, Nicoll SB, Michalek AJ, Walter BA, Gupta MS. Role of biomechanics in intervertebral disc degeneration and regenerative therapies: what needs repairing in the disc and what are promising biomaterials for its repair? Spine J. 2013;13:243–262. doi: 10.1016/j.spinee.2012.12.002. [DOI] [PMC free article] [PubMed] [Google Scholar]
- 3.Urban JP, Roberts S. Degeneration of the intervertebral disc. Arthritis Res Ther. 2003;5:120–130. doi: 10.1186/ar629. [DOI] [PMC free article] [PubMed] [Google Scholar]
- 4.Martirosyan NL, Patel AA, Carotenuto A, Kalani MY, Belykh E, Walker CT, Preul MC, Theodore N. Genetic alterations in intervertebral disc disease. Front Surg. 2016;3:59. doi: 10.3389/fsurg.2016.00059. [DOI] [PMC free article] [PubMed] [Google Scholar]
- 5.Zhang F, Zhao X, Shen H, Zhang C. Molecular mechanisms of cell death in intervertebral disc degeneration (Review) Int J Mol Med. 2016;37:1439–1448. doi: 10.3892/ijmm.2016.2573. [DOI] [PMC free article] [PubMed] [Google Scholar]
- 6.Feng Y, Egan B, Wang J. Genetic factors in intervertebral disc degeneration. Genes Dis. 2016;3:178–185. doi: 10.1016/j.gendis.2016.04.005. [DOI] [PMC free article] [PubMed] [Google Scholar]
- 7.Navone SE, Marfia G, Giannoni A, Beretta M, Guarnaccia L, Gualtierotti R, Nicoli D, Rampini P, Campanella R. Inflammatory mediators and signalling pathways controlling intervertebral disc degeneration. Histol Histopathol. 2017;32:523–542. doi: 10.14670/HH-11-846. [DOI] [PubMed] [Google Scholar]
- 8.Wang C, Yu X, Yan Y, Yang W, Zhang S, Xiang Y, Zhang J, Wang W. Tumor necrosis factor-alpha: a key contributor to intervertebral disc degeneration. Acta Biochim Biophys Sin (Shanghai) 2017;49:1–13. doi: 10.1093/abbs/gmw112. [DOI] [PubMed] [Google Scholar]
- 9.Rodrigues-Pinto R, Richardson SM, Hoyland JA. An understanding of intervertebral disc development, maturation and cell phenotype provides clues to direct cell-based tissue regeneration therapies for disc degeneration. Eur Spine J. 2014;23:1803–1814. doi: 10.1007/s00586-014-3305-z. [DOI] [PubMed] [Google Scholar]
- 10.Galbusera F, van Rijsbergen M, Ito K, Huyghe JM, Brayda-Bruno M, Wilke HJ. Ageing and degenerative changes of the intervertebral disc and their impact on spinal flexibility. Eur Spine J. 2014;23:S324–332. doi: 10.1007/s00586-014-3203-4. [DOI] [PubMed] [Google Scholar]
- 11.Li W, Liu T, Wu L, Chen C, Jia Z, Bai X, Ruan D. Blocking the function of inflammatory cytokines and mediators by using IL-10 and TGF-beta: a potential biological immunotherapy for intervertebral disc degeneration in a beagle model. Int J Mol Sci. 2014;15:17270–17283. doi: 10.3390/ijms151017270. [DOI] [PMC free article] [PubMed] [Google Scholar]
- 12.Johnson ZI, Doolittle AC, Snuggs JW, Shapiro IM, Le Maitre CL, Risbud MV. TNF-alpha promotes nuclear enrichment of the transcription factor TonEBP/NFAT5 to selectively control inflammatory but not osmoregulatory responses in nucleus pulposus cells. J Biol Chem. 2017;292:17561–17575. doi: 10.1074/jbc.M117.790378. [DOI] [PMC free article] [PubMed] [Google Scholar]
- 13.Zhao B, Yu Q, Li H, Guo X, He X. Characterization of microRNA expression profiles in patients with intervertebral disc degeneration. Int J Mol Med. 2014;33:43–50. doi: 10.3892/ijmm.2013.1543. [DOI] [PMC free article] [PubMed] [Google Scholar]
- 14.Liu P, Chang F, Zhang T, Gao G, Yu C, Ding SQ, Zuo GL, Huang XH. Downregulation of microRNA-125a is involved in intervertebral disc degeneration by targeting pro-apoptotic Bcl-2 antagonist killer 1. Iran J Basic Med Sci. 2017;20:1260–1267. doi: 10.22038/IJBMS.2017.9542. [DOI] [PMC free article] [PubMed] [Google Scholar]
- 15.Zhou X, Chen L, Grad S, Alini M, Pan H, Yang D, Zhen W, Li Z, Huang S, Peng S. The roles and perspectives of microRNAs as biomarkers for intervertebral disc degeneration. J Tissue Eng Regen Med. 2017;11:3481–3487. doi: 10.1002/term.2261. [DOI] [PubMed] [Google Scholar]
- 16.Hu P, Feng B, Wang G, Ning B, Jia T. Microarray based analysis of gene regulation by microRNA in intervertebral disc degeneration. Mol Med Rep. 2015;12:4925–4930. doi: 10.3892/mmr.2015.4022. [DOI] [PMC free article] [PubMed] [Google Scholar]
- 17.Humphreys DT, Westman BJ, Martin DI, Preiss T. MicroRNAs control translation initiation by inhibiting eukaryotic initiation factor 4E/cap and poly(A) tail function. Proc Natl Acad Sci U S A. 2005;102:16961–16966. doi: 10.1073/pnas.0506482102. [DOI] [PMC free article] [PubMed] [Google Scholar]
- 18.Lu A, Wang Z, Wang S. Role of miR-589-3p in human lumbar disc degeneration and its potential mechanism. Exp Ther Med. 2018;15:1616–1621. doi: 10.3892/etm.2017.5593. [DOI] [PMC free article] [PubMed] [Google Scholar]
- 19.Janssens S, Beyaert R. Role of Toll-like receptors in pathogen recognition. Clin Microbiol Rev. 2003;16:637–646. doi: 10.1128/CMR.16.4.637-646.2003. [DOI] [PMC free article] [PubMed] [Google Scholar]
- 20.Mukherjee S, Karmakar S, Babu SP. TLR2 and TLR4 mediated host immune responses in major infectious diseases: a review. Braz J Infect Dis. 2016;20:193–204. doi: 10.1016/j.bjid.2015.10.011. [DOI] [PMC free article] [PubMed] [Google Scholar]
- 21.Takeda K, Akira S. Toll-like receptors in innate immunity. Int Immunol. 2005;17:1–14. doi: 10.1093/intimm/dxh186. [DOI] [PubMed] [Google Scholar]
- 22.Park BS, Lee JO. Recognition of lipopolysaccharide pattern by TLR4 complexes. Exp Mol Med. 2013;45:e66. doi: 10.1038/emm.2013.97. [DOI] [PMC free article] [PubMed] [Google Scholar]
- 23.Palsson-McDermott EM, O’Neill LA. Signal transduction by the lipopolysaccharide receptor, toll-like receptor-4. Immunology. 2004;113:153–162. doi: 10.1111/j.1365-2567.2004.01976.x. [DOI] [PMC free article] [PubMed] [Google Scholar]
- 24.Tsukamoto H, Takeuchi S, Kubota K, Kobayashi Y, Kozakai S, Ukai I, Shichiku A, Okubo M, Numasaki M, Kanemitsu Y, Matsumoto Y, Nochi T, Watanabe K, Sao H, Tomioka Y. Lipopolysaccharide (LPS)-binding protein stimulates CD14-dependent Toll-like receptor 4 internalization and LPS-induced TBK1-IKK-IRF3 axis activation. J Biol Chem. 2018;293:10186–10201. doi: 10.1074/jbc.M117.796631. [DOI] [PMC free article] [PubMed] [Google Scholar]
- 25.Zhang C, Chen B, Jiang K, Lao L, Shen H, Chen Z. Activation of TNF-alpha/NF-kappaB axis enhances CRL4B(DCAF)(11) E3 ligase activity and regulates cell cycle progression in human osteosarcoma cells. Mol Oncol. 2018;12:476–494. doi: 10.1002/1878-0261.12176. [DOI] [PMC free article] [PubMed] [Google Scholar]
- 26.Martone R, Euskirchen G, Bertone P, Hartman S, Royce TE, Luscombe NM, Rinn JL, Nelson FK, Miller P, Gerstein M, Weissman S, Snyder M. Distribution of NF-kappaB-binding sites across human chromosome 22. Proc Natl Acad Sci U S A. 2003;100:12247–12252. doi: 10.1073/pnas.2135255100. [DOI] [PMC free article] [PubMed] [Google Scholar]
- 27.Espinosa L, Bigas A, Mulero MC. Alternative nuclear functions for NF-kappaB family members. Am J Cancer Res. 2011;1:446–459. [PMC free article] [PubMed] [Google Scholar]
- 28.Liu T, Zhang L, Joo D, Sun SC. NF-kappaB signaling in inflammation. Signal Transduct Target Ther. 2017:2. doi: 10.1038/sigtrans.2017.23. [DOI] [PMC free article] [PubMed] [Google Scholar]
- 29.Tak PP, Firestein GS. NF-kappaB: a key role in inflammatory diseases. J Clin Invest. 2001;107:7–11. doi: 10.1172/JCI11830. [DOI] [PMC free article] [PubMed] [Google Scholar]
- 30.Lawrence T. The nuclear factor NF-kappaB pathway in inflammation. Cold Spring Harb Perspect Biol. 2009;1:a001651. doi: 10.1101/cshperspect.a001651. [DOI] [PMC free article] [PubMed] [Google Scholar]
- 31.Chen Z, Zhang W, Jiang K, Chen B, Wang K, Lao L, Hou C, Wang F, Zhang C, Shen H. MicroRNA-300 regulates the ubiquitination of PTEN through the CRL4B(DCAF13) E3 Ligase in Osteosarcoma Cells. Mol Ther Nucleic Acids. 2018;10:254–268. doi: 10.1016/j.omtn.2017.12.010. [DOI] [PMC free article] [PubMed] [Google Scholar]
- 32.Jiang K, Zhang C, Yu B, Chen B, Liu Z, Hou C, Wang F, Shen H, Chen Z. Autophagic degradation of FOXO3a represses the expression of PUMA to block cell apoptosis in cisplatin-resistant osteosarcoma cells. Am J Cancer Res. 2017;7:1407–1422. [PMC free article] [PubMed] [Google Scholar]
- 33.Hayashi M, Nomoto S, Hishida M, Inokawa Y, Kanda M, Okamura Y, Nishikawa Y, Tanaka C, Kobayashi D, Yamada S, Nakayama G, Fujii T, Sugimoto H, Koike M, Fujiwara M, Takeda S, Kodera Y. Identification of the collagen type 1 alpha 1 gene (COL1A1) as a candidate survival-related factor associated with hepatocellular carcinoma. BMC Cancer. 2014;14:108. doi: 10.1186/1471-2407-14-108. [DOI] [PMC free article] [PubMed] [Google Scholar]
- 34.Ma W, Dumont Y, Vercauteren F, Quirion R. Lipopolysaccharide induces calcitonin gene-related peptide in the RAW264.7 macrophage cell line. Immunology. 2010;130:399–409. doi: 10.1111/j.1365-2567.2009.03239.x. [DOI] [PMC free article] [PubMed] [Google Scholar]
- 35.Jang CH, Choi JH, Byun MS, Jue DM. Chloroquine inhibits production of TNF-alpha, IL-1beta and IL-6 from lipopolysaccharide-stimulated human monocytes/macrophages by different modes. Rheumatology (Oxford) 2006;45:703–710. doi: 10.1093/rheumatology/kei282. [DOI] [PubMed] [Google Scholar]
- 36.Maldonado RF, Sa-Correia I, Valvano MA. Lipopolysaccharide modification in Gram-negative bacteria during chronic infection. FEMS Microbiol Rev. 2016;40:480–493. doi: 10.1093/femsre/fuw007. [DOI] [PMC free article] [PubMed] [Google Scholar]
- 37.Steimle A, Autenrieth IB, Frick JS. Structure and function: lipid A modifications in commensals and pathogens. Int J Med Microbiol. 2016;306:290–301. doi: 10.1016/j.ijmm.2016.03.001. [DOI] [PubMed] [Google Scholar]
- 38.Palsson-McDermott EM, O’Neill LA. Signal transduction by the lipopolysaccharide receptor, toll-like receptor-4. Immunology. 2004;113:153–162. doi: 10.1111/j.1365-2567.2004.01976.x. [DOI] [PMC free article] [PubMed] [Google Scholar]
- 39.Molteni M, Gemma S, Rossetti C. The role of toll-like receptor 4 in infectious and noninfectious inflammation. Mediators Inflamm. 2016;2016:6978936. doi: 10.1155/2016/6978936. [DOI] [PMC free article] [PubMed] [Google Scholar]
- 40.Hunter P. The inflammation theory of disease. The growing realization that chronic inflammation is crucial in many diseases opens new avenues for treatment. EMBO Rep. 2012;13:968–970. doi: 10.1038/embor.2012.142. [DOI] [PMC free article] [PubMed] [Google Scholar]
- 41.Yu X, Li Z, Shen J, Wu WK, Liang J, Weng X, Qiu G. MicroRNA-10b promotes nucleus pulposus cell proliferation through RhoC-Akt pathway by targeting HOXD10 in intervetebral disc degeneration. PLoS One. 2013;8:e83080. doi: 10.1371/journal.pone.0083080. [DOI] [PMC free article] [PubMed] [Google Scholar] [Retracted]
- 42.Liu H, Huang X, Liu X, Xiao S, Zhang Y, Xiang T, Shen X, Wang G, Sheng B. miR-21 promotes human nucleus pulposus cell proliferation through PTEN/AKT signaling. Int J Mol Sci. 2014;15:4007–4018. doi: 10.3390/ijms15034007. [DOI] [PMC free article] [PubMed] [Google Scholar]
- 43.Liu G, Cao P, Chen H, Yuan W, Wang J, Tang X. MiR-27a regulates apoptosis in nucleus pulposus cells by targeting PI3K. PLoS One. 2013;8:e75251. doi: 10.1371/journal.pone.0075251. [DOI] [PMC free article] [PubMed] [Google Scholar]
- 44.Wang HQ, Yu XD, Liu ZH, Cheng X, Samartzis D, Jia LT, Wu SX, Huang J, Chen J, Luo ZJ. Deregulated miR-155 promotes Fas-mediated apoptosis in human intervertebral disc degeneration by targeting FADD and caspase-3. J Pathol. 2011;225:232–242. doi: 10.1002/path.2931. [DOI] [PubMed] [Google Scholar]
Associated Data
This section collects any data citations, data availability statements, or supplementary materials included in this article.


