Abstract
Diabetic kidney disease (DKD), the leading cause of kidney failure, is characterized by albuminuria and renal hypertrophy. Metabolic alterations and mitochondrial dysfunction play critical roles in DKD initiation and progression. Artemether, a methyl ether derivative of artemisinin used for the treatment of malaria, has been identified as a putative candidate for treating diabetes, but its effect on DKD has not been studied. The goal of this study was to examine the effect of artemether on type 2 diabetic db/db mice. Our results show that artemether reduced urinary albumin excretion, prevented diabetic kidney hypertrophy, attenuated glomerular basement membrane and tubular basement membrane thickening, and ameliorated foot process effacement in type 2 diabetic db/db mice. Artemether also protected against hyperglycemia and improved diabetic symptoms. In addition, it increased serum insulin level and restored the normal ratio of insulin, glucagon, and somatostatin levels in islets. Specifically, artemether increased the respiratory exchange ratio and regulated mitochondrial function and the redox state in the kidney. In conclusion, this experiment confirmed the renal protection ability of artemether in DKD. The mechanisms of this effect might be associated with the ability of artemether to increase mitochondrial pyruvate carrier content.
Keywords: Artemether, diabetic kidney disease, mitochondrial pyruvate carrier, db/db mice
Introduction
Type 2 diabetes (T2D) mellitus has increased significantly in incidence and has become a substantial burden on clinical and public health [1]. Diabetic kidney disease (DKD), which is characterized by albuminuria and renal hypertrophy, is the leading cause of kidney failure [2]. However, the pathophysiology leading to the progression of DKD remains poorly understood.
Recent studies demonstrated that metabolic alterations and mitochondrial dysfunction play critical roles in DKD initiation and progression [3]. For example, the respiratory exchange ratio (RER), which is an indicator of energy substrate utilization during constant breathing, declines abruptly between 5 and 8 weeks of age in T2D db/db mice [4]. This result indicates that the energy-producing metabolic substrate shifts from carbohydrates to lipids and proteins. A transcriptomic and metabolomic study showed that the T2D kidney displays increased glycolysis, fatty acid β-oxidation, and tricarboxylic acid cycle flux, along with whole-body metabolic status [5]. Increased utilization of fatty acids for energy production leads to enhanced mitochondrial H2O2 production relative to glycolytic metabolite pyruvate oxidation [6]. Overproduction of reactive oxygen species (ROS) in mitochondria then promotes mitochondrial dysfunction [7]. In general, the enlarged diabetic kidney is characterized by aerobic glycolysis, known as the Warburg effect. However, the initial factor promoting metabolic reprogramming in DKD remains unclear.
As the gatekeeper for pyruvate transport into mitochondria, the mitochondrial pyruvate carrier (MPC) is thought to be the key cellular component that bridges glycolysis and oxidative phosphorylation [8]. MPC1 is deleted or under expressed in multiple cancers, and these alterations correlate with poor prognosis. Restoration of MPC1 and MPC2 expression in cancer cell lines enhanced pyruvate oxidation and decreased glycolysis, which is consistent with a reversal of the Warburg effect [9]. In addition, MPC1-deficient mice exhibit a decreased RER during exercise, which strongly implicates MPC1 is one important component in metabolic substrate utilization [10]. However, the role of the MPC in DKD has not been investigated to date.
Artemether is a methyl ether derivative of artemisinin that is used for the treatment of malaria [11]. Recent studies demonstrated that artemether displays antiviral and fungicidal properties, anti-inflammatory and antiasthma effects, as well as potential anticancer functions [12]. In addition, it enhances insulin secretion in human islets and has been identified as a putative candidate for treating diabetes [13]. However, the effect of artemether on DKD has not yet been studied; therefore, we performed the experiments reported herein to determine the potential role and mechanisms of artemether in treating DKD.
Materials and methods
Animal experiments
All animal experiments were approved by the Guangzhou University of Chinese Medicine Institutional Animal Care and Use Committee and were conducted according to relevant guidelines and regulations. Male db/db mice (BKS.Cg-Dock7m+/+Leprdb/Nju) and lean wild type control mice were purchased from the Model Animal Research Center of Nanjing University and were housed in the Central Animal Facility at Shenzhen Graduate School of Peking University. The 8-week-old mice were allocated randomly to the following groups: lean wild type T2D control (T2D-ctrl) group, db/db group, and db/db+artemether (db/db+Art) group. The T2D-ctrl and db/db group mice were fed a regular diet, and the db/db+Art group mice were fed a regular diet supplemented with 0.67 g/kg artemether (ChengDu ConBon Biotech Co., LTD, China). The treatment lasted for 12 weeks.
Tissue preparation
At the end of the experiment, mice were sacrificed and blood, pancreas, and kidney samples were collected. The tail of the pancreas and renal cortex (sized 1 mm3) were fixed in 2.5% glutaraldehyde and post-fixed in 1% osmic acid for electron microscopy (EM) analysis. Some of the pancreas and kidney tissue samples were fixed in 10% formalin and used for histopathological examination and immunofluorescence staining. Some of the kidney tissue was used to isolate mitochondria. The remaining kidney tissue was immediately snap-frozen in liquid nitrogen and stored at -80°C for later analysis.
Physiological and metabolic parameters
Fasting blood glucose was measured using a blood glucose meter (Roche, Basel, Switzerland). Urine was collected using metabolic cages (Tecniplast, Buguggiate, Italy). HbA1c levels were measured using an Ultra2 HbA1c Analyzer (Primus, Kansas City, MO, USA). Urinary glucose was detected using an automatic biochemical analyzer (Roche, Basel, Switzerland). The energy expenditure and RER of the mice were determined using the Comprehensive Lab Animal Monitoring System (Columbus Instruments, Columbus, OH, USA).
Light microscopy
Paraffin-embedded pancreas sections (3 μm) were stained with hematoxylin and eosin (H&E) and scanned with a slide scanner (Motic Easyscan Digital Slide Scanner, Xiamen, China) to measure the mean islet area, islet area/pancreas area, and islet density. The number of islets was counted, and islet density was calculated by islet number/pancreas area. Kidney sections (4 μm) were stained with periodic acid-Schiff (PAS) and scanned to evaluate renal morphological changes. A total of 30-40 renal glomerular tuft areas (GTAs), 30-40 renal glomerular mesangial matrix areas, 50-80 proximal renal tubular areas (PAS staining possessing brush border) and tubular lumen areas (axial ratio less than 1.5) were measured. The renal glomerular tuft volume (GTV) was calculated using a previously described method [14]. The tubular wall area was calculated by subtracting the tubular lumen area from the renal tubular area.
Electron microscopy analysis
EM photographs (JEM-1400, JEOL, Tokyo, Japan) were analyzed using ImageJ software (National Institutes of Health, Bethesda, MD, USA). A total of 8-10 glomerular and tubular photographs in each sample were selected to measure the glomerular basement membrane (GBM), foot process width (FPW), and tubular basement membrane (TBM) thickness. The average GBM and TBM thicknesses were estimated as the ratio of the area inside the recognized GBM and TBM segments to the length of the central line [15]. The FPW was calculated using a previously described method [14].
Immunostaining analysis
Briefly, pancreatic sections were deparaffinized and rehydrated. Then, the sections were subjected to antigen retrieval by boiling in citric acid buffer (pH 6) for 20 min. After rinsing three times with phosphate-buffered saline (PBS), the sections were incubated with primary antibodies against insulin (Cell Signaling Technology, Danvers, MA, USA), glucagon (Abcam, Cambridge, UK), and somatostatin (GeneTex, Irvine, CA, USA) overnight at 4°C. The sections were then washed with rinse buffer and incubated for 1 h at room temperature with Alexa Fluor-conjugated secondary antibodies. The resulting images were visualized and captured on a confocal microscope (LSM710, Carl Zeiss, Oberkochen, Germany). A total of 6-8 photographs were randomly selected in each pancreas section to calculate the insulin-, glucagon-, and somatostatin-positive area.
Enzyme-linked immunosorbent assay (ELISA)
An albumin ELISA kit (Bethyl Laboratories, Montgomery, TX, USA) and insulin ELISA kit (Merck Millipore, Danvers, MA, USA) were used according to the manufacturer’s instructions to measure mice urine albumin and serum insulin, respectively.
Kidney mitochondria isolation and mitochondrial H2O2 production rate assay
Mitochondrial H2O2 production rate was measured using Amplex UltraRed reagent (Invitrogen, Carlsbad, CA, USA) according to the manufacturer’s instructions. Kidney mitochondria were isolated from normal male C57BL/6J mice (obtained from Guangdong Medical Laboratory Animal Center) as previously described [16] and incubated in mitochondrial assay medium (sodium citrate buffer, 50 mM, pH 6.0; mitochondrial concentration, 0.2 mg/ml). Different concentrations of artemether (1 μl) dissolved in dimethyl sulfoxide (DMSO) were pre-added to the assay medium to obtain final concentrations of 1, 0.1, 0.025, 0.0125, 0.005, and 0 μg/μl (only DMSO). Then Amplex UltraRed/HRP work solution was added to each microplate well to initiate the reaction. The fluorescence was measured at Ex/Em 490/585 nm using a Synergy H1 microplate reader (BioTek Instruments, Winooski, VT, USA).
Immunoblotting
Renal cortex was homogenized in lysis buffer. Renal cortex and mitochondrial proteins were prepared in sample loading buffer (Bio-Rad, Hercules, CA, USA). The proteins were separated on SDS-PAGE gels and transferred to PVDF membranes (Merck Millipore, Danvers, MA, USA). After blocking in Tris-buffered saline (TBS) buffer containing 5% nonfat dry milk for 1 h at room temperature, the membranes were incubated and gently shaken overnight at 4°C with primary antibodies. After washing with TBS, the membranes were incubated with secondary antibodies for 1 h at room temperature with shaking. After washing, the protein bands were detected and analyzed using a ChemiDoc™ MP Imaging System (Bio-Rad, Hercules, CA, USA). β-Actin and voltage-dependent anion channel (VDAC) were used as the loading control for renal cortex protein and mitochondrial protein respectively. Primary antibodies against catalase, SOD2 (superoxide dismutase 2), MPC2, MPC1, VDAC, PDP1 (pyruvate dehyrogenase phosphatase 1), and PDH (pyruvate dehydrogenase) were obtained from Cell Signaling Technology. The PGC-1α (peroxisome proliferator-activated receptor γ coactivator 1α) antibody was obtained from Novus Biologicals (Littleton, CO, USA), the PDK1 (pyruvate dehydrogenase kinase 1) antibody was obtained from Enzo Life Science (Farmingdale, NY, USA), and the β-actin antibody was obtained from Sigma Aldrich (St. Louis, MO, USA).
Statistical analysis
Data are expressed as mean ± SD. Data analysis was performed using SPSS statistics software (IBM, NY, USA). Comparisons between two groups were performed using unpaired Student’s t test. Differences among multiple groups were analyzed by using one-way ANOVA. Significance was defined as P<0.05.
Results
Artemether reduced urinary albumin excretion and prevented diabetic kidney hypertrophy
Urinary albumin excretion was significantly higher in db/db mice than in the control group mice at the time of initial treatment and increased gradually until the end of the study (Figure 1A). Albumin excretion was significantly reduced after 12 weeks of treatment with artemether (Figure 1A). At the end of the experiment, db/db mice kidneys were significantly heavier than the control group kidneys (Figure 1B, 1I). Artemether treatment significantly decreased kidney weight (Figure 1B, 1I). The db/db mice also displayed increased mesangial matrix and hypertrophic glomeruli and proximal tubules. These pathological changes were all ameliorated by artemether therapy (Figure 1C-H, 1J, 1K).
Figure 1.
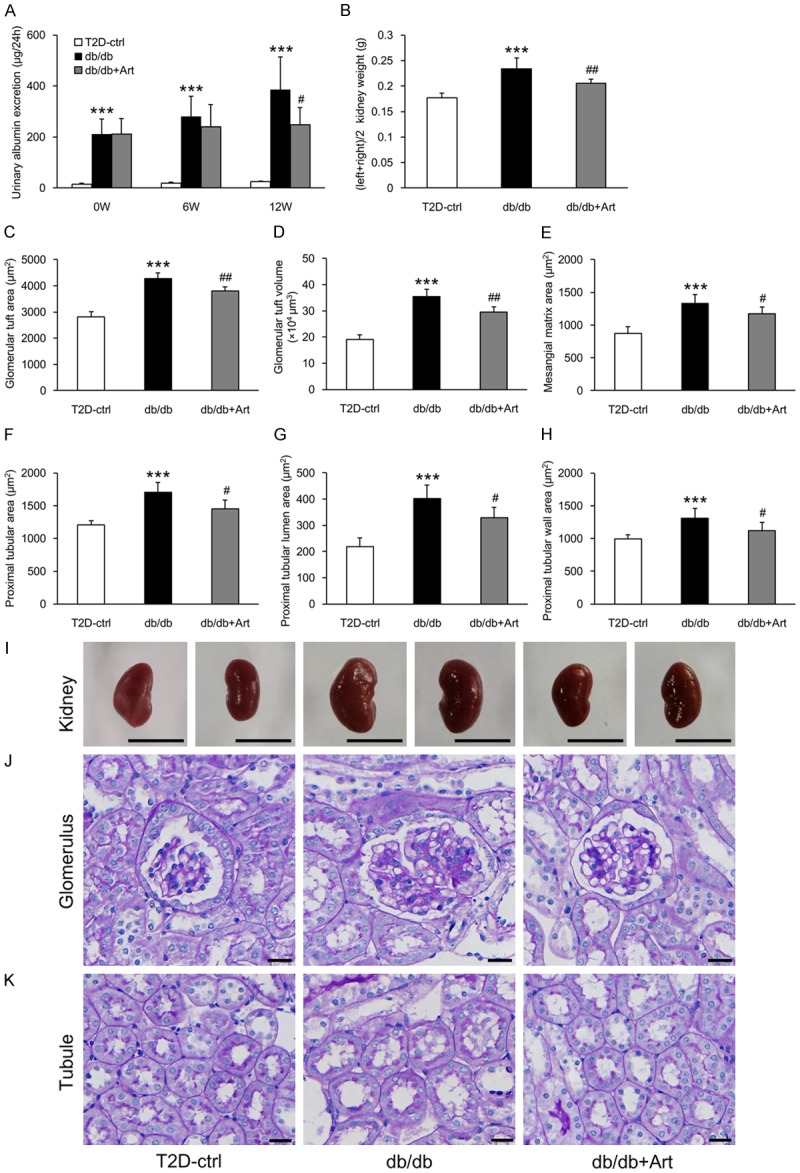
Artemether reduces urinary albumin excretion and prevents diabetic kidney hypertrophy. A. Urinary albumin excretion at 0, 6, and 12 weeks in the indicated groups. B. Kidney weight in each group at the end of the study. C-E. Bar graphs indicating the GTA, GTV, and mesangial matrix area of each group. F-H. Bar graphs indicating the proximal tubular area, tubular lumen, and wall area in various groups. I. Representative kidney images. Scale bars, 1 cm. J. PAS staining for the glomerulus. Scale bars, 20 μm. K. PAS staining for the renal tubule. Scale bars, 20 μm. n=6 per group. ***P<0.001 vs. the T2D-ctrl group. #P<0.05 and ##P<0.01 vs. the db/db group.
Artemether attenuated GBM and TBM thickening, ameliorated foot process effacement
Diffuse thickening of GBM and TBM are the earliest structural changes of DKD [17]. Our results showed thickening of both GBM and TBM in db/db mice. Artemether treatment for 12 weeks attenuated this thickening (Figure 2A, 2B, 2D, 2E). Foot process effacement plays a key role in the development of albuminuria [18]. We found that FPW was larger in db/db mice, but was significantly reduced by artemether treatment (Figure 2C, 2D).
Figure 2.
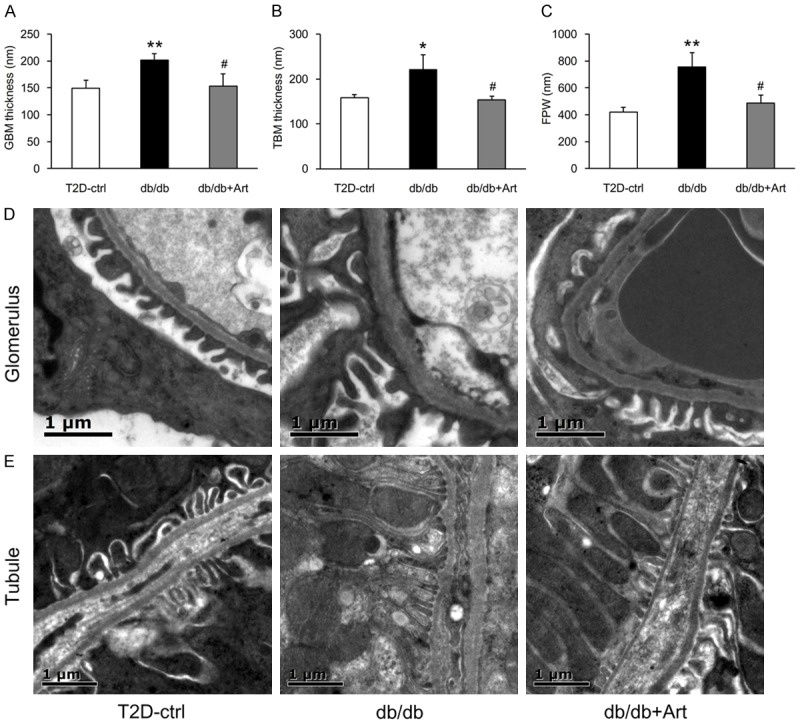
Artemether attenuates GBM and TBM thickening, reduces podocyte FPW. A-C. Bar graphs representing the quantification and statistical analysis of GBM thickness, TBM thickness, and FPW. n=3 per group. D. Typical glomerulus EM photographs of the GBM and FPW. Scale bars, 1 μm. E. Representative tubule EM images of the TBM. Scale bars, 1 μm. *P<0.05 and **P<0.01 vs. the T2D-ctrl group. #P<0.05 vs. the db/db group.
Artemether improved diabetic symptoms and protected against hyperglycemia
Compared with control mice, db/db mice presented polydypsia, polyuria, polyphagia, and increased feces production during the course of the experiment. Artemether significantly improved these typical metabolic symptoms (Figure 3A-D). Consistent with these diabetic symptoms, db/db mice exhibited apparent obesity and higher blood glucose level than control mice, during the entire course of the study (Figure 3E, 3F). Artemether significantly lowered fasting blood glucose levels after 4 weeks of treatment, and the hypoglycemic effect continued to the end of the study (Figure 3F). The body weight of mice in the db/db+Art group was increased after 8 weeks of treatment and remained stabilized at this level until the end of the experiment (Figure 3E). In addition, the HbA1c and urinary glucose levels were higher in db/db mice compared with control mice, but were significantly lowered by artemether treatment (Figure 3G, 3H).
Figure 3.
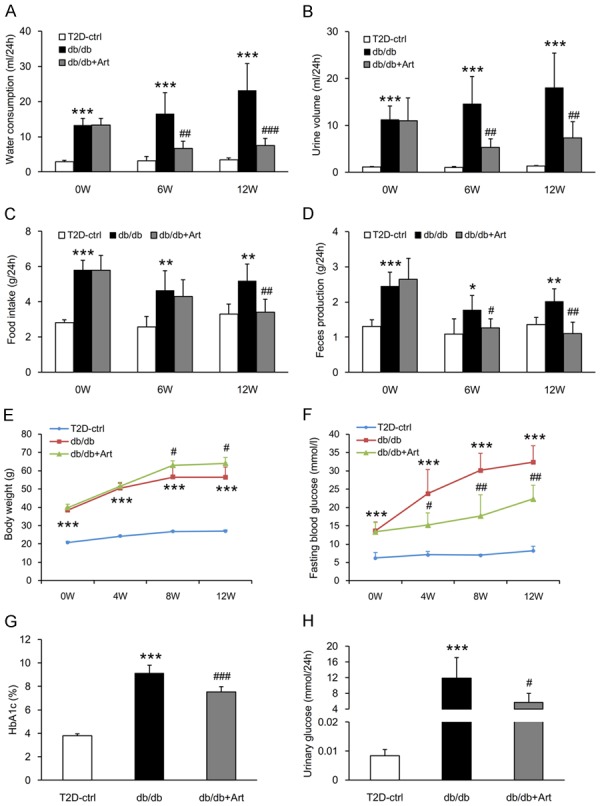
Artemether improves diabetic symptoms and protects against hyperglycemia. (A) Water consumption, (B) Urine volume, (C) Food intake, and (D) Feces production at 0, 6, and 12 weeks in various groups. (E, F) Line charts indicating the changes of body weight and fasting blood glucose during the course of the experiment. (G, H) Bar graphs representing the quantification of HbA1c and urinary glucose at the end of the study. n=6 per group. *P<0.05, **P<0.01 and ***P<0.001 vs. the T2D-ctrl group. #P<0.05, ##P<0.01 and ###P<0.001 vs. the db/db group.
Artemether increased serum insulin and restored the normal ratio of insulin, glucagon, and somatostatin levels in islets
To explore the hypoglycemic mechanism of artemether, we measured serum insulin and evaluated pancreatic islet morphological changes. At the end of the study, db/db mice presented hyperinsulinemia, and artemether treatment raised the serum insulin levels to a significantly higher level (Figure 4A). H&E staining revealed that the mean islet area, islet area/pancreas area, and islet density were all significantly higher in db/db mice compared with control mice (Figure 4B-G). Mean islet area values were similar in the db/db+Art and the db/db groups mice (Figure 4B). The islet area/pancreas area and islet density values were slightly increased in artemether-treated mice compared with db/db mice, but not to a significant degree (Figure 4C, 4D). To determine the cellular composition of the islet cells, we stained tissue sections with insulin, glucagon, and somatostatin primary antibodies. The immunostaining results (Figure 5A-D) showed that insulin-positive area was decreased, and the glucagon- and somatostatin-positive area were increased significantly in db/db mice compared with control mice. Artemether treatment recovered the unbalanced ratio of insulin, glucagon and somatostatin content in islets. EM photographs of the ultrastructural changes in islet cells (Figure 6) revealed that α- and δ-cells were more easily observed and insulin granules became loose in db/db mice. However, the islets of db/db+Art group mice were densely packed with insulin granules, which had a size and morphology similar to those observed in control mice.
Figure 4.
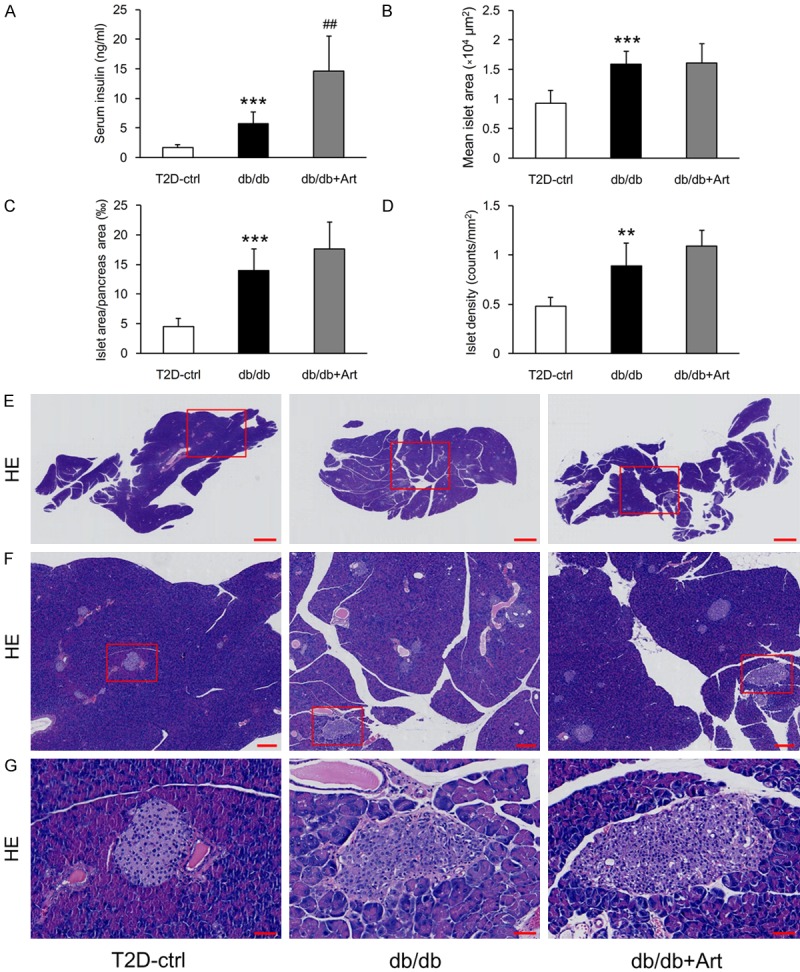
Effects of artemether on serum insulin and pancreatic islets morphological changes. (A) Bar graphs showing the serum level of insulin in each group at the end of the experiment. Pancreatic H&E staining was performed to evaluate the islet morphological alterations. (B-D) Bar graphs denoting the quantification of mean islet area, islet area/pancreas area, and islet density in different groups. (E-G) Representative pancreas and islet images in various groups. Scale bars: 1 mm for (E); 200 μm for (F); 50 μm for (G). n=6 per group. **P<0.01 and ***P<0.001 vs. the T2D-ctrl group. ##P<0.01 vs. the db/db group.
Figure 5.
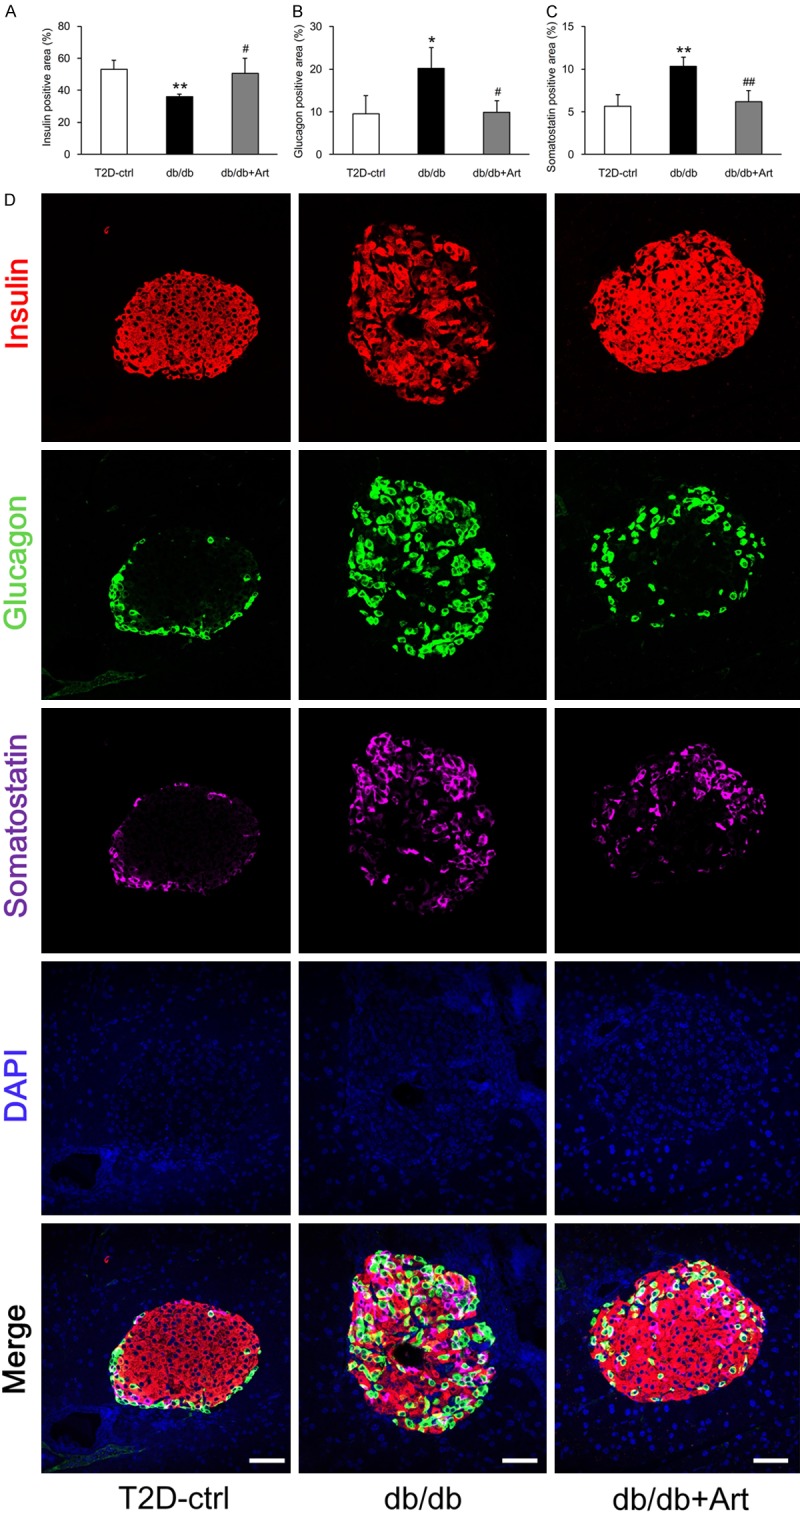
Artemether recovers the unbalanced ratio of insulin, glucagon and somatostatin content in islets. A-C. Bar graphs showing the quantification and statistical analysis of the insulin-, glucagon-, and somatostatin-positive areas in different groups. n=4 per group. D. Insulin, glucagon, and somatostatin co-immunostaining was performed on pancreatic sections to assess the percentage of insulin-, glucagon-, and somatostatin-positive areas per islet. Scale bars, 50 μm. *P<0.05 and **P<0.01 vs. the T2D-ctrl group. #P<0.05 and ##P<0.01 vs. the db/db group.
Figure 6.
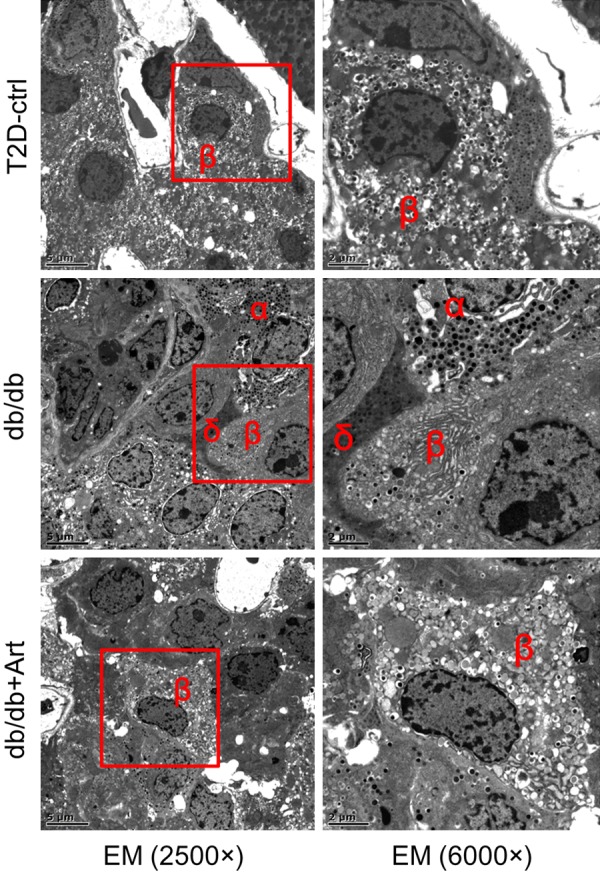
Representative islet EM images in different groups. The ultrastructural changes in the islet cells revealed that α- and δ-cells were more easily observed in db/db mice. The insulin granules in the β-cells also became loose in this group. After artemether treatment for 12 weeks, the db/db+Art group islets were densely packed with insulin granules, which had a size and morphology similar to those observed in control mice. Scale bars: left, 5 μm; right, 2 μm.
Artemether increased the respiratory exchange ratio, but did not affect energy expenditure
Diabetes is associated with carbohydrate and lipid metabolism disorders, so it is important to determine whether artemether influences energy metabolic substrate utilization. To address this question, the energy expenditure and RER were measured in mice of each group. As shown in Figure 7D-F, db/db mice displayed higher energy expenditure during the course of the experiment compared with the control group. However, no difference in energy expenditure was observed between the db/db mice and db/db+Art mice groups. Compared with control mice, db/db mice exhibited lower RER in the dark phase at the start of initial treatment and fell to an even lower value at 6 and 12 weeks. This result indicated that the type 2 diabetic mice were more dependent on lipids as a source of energy substrate. In addition, the circadian rhythm of RER was disrupted in db/db mice (Figure 7A-C). However, artemether treatment significantly increased the daily RER of db/db mice, but failed to alter their circadian rhythm (Figure 7A-C).
Figure 7.
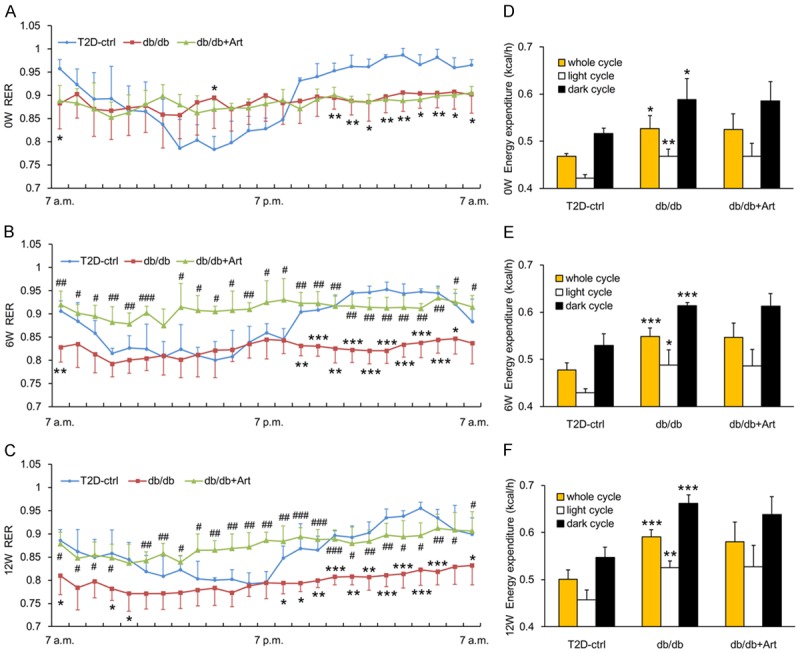
Effects of artemether on RER and energy expenditure. A-C. Line charts indicating changes of RER throughout the entire day at 0, 6, and 12 weeks in various groups. D-F. Bar graphs representing the quantification of energy expenditure at 0, 6, and 12 weeks in different groups. n=4 per group. *P<0.05, **P<0.01 and ***P<0.001 vs. the T2D-ctrl group. #P<0.05, ##P<0.01 and ###P<0.001 vs. the db/db group.
Artemether inhibited renal mitochondrial H2O2 production and reduced serum and urine H2O2 level
As shown in Figure 8A, artemether inhibited renal mitochondrial H2O2 production in a dose-dependent manner. Enhanced fatty acid oxidation in mitochondria is involved in DKD, and mitochondrial H2O2 production is greater when fatty acids relative to the glycolytic metabolite pyruvate are oxidized. Compared with control mice, serum H2O2 level and urinary H2O2 excretion increased significantly in db/db mice and both of them were reduced by artemether treatment (Figure 8B, 8C).
Figure 8.
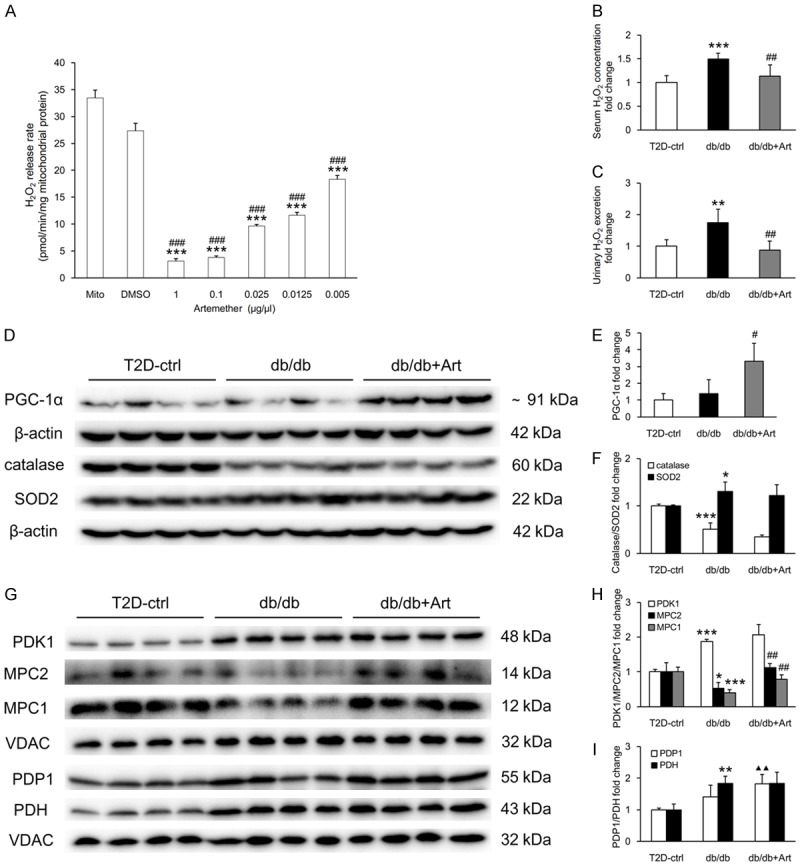
Artemether inhibits renal mitochondrial H2O2 production, reduces serum and urine H2O2 level, regulates related renal cortical and mitochondrial protein expression. (A) Inhibiting effect of artemether on isolated renal mitochondrial H2O2 release rate. n=4 per group. ***P<0.001 vs. the Mito (mitochondria) group, ###P<0.001 vs. the DMSO group. (B) Serum concentration and (C) urinary excretion in various groups at the end of the study. n=6 per group. (D) Western blot images of PGC-1α, catalase, SOD2, and β-actin in the renal cortex of mice in various groups. (E, F) Bar graphs showing the fold change in protein expression after normalization to the internal control β-actin. n=4 per group. (G) Western blot images of PDK1, MPC2, MPC1, PDP1, PDH and VDAC in renal mitochondria in different groups. (H, I) Bar graphs displaying the fold change in protein expression after normalization to VDAC. n=4 per group. *P<0.05, **P<0.01 and ***P<0.001 vs. the T2D-ctrl group. #P<0.05 and ##P<0.01 vs. the db/db group. ▲▲P<0.01 vs. the T2D-ctrl group.
Artemether increased renal cortical PGC-1α expression and mitochondrial MPC content
To further address the role of artemether on mitochondrial function, we measured related proteins in kidney and mitochondria. Compared with control mice, db/db mice exhibited significantly lower catalase and higher SOD2 levels in the renal cortex. No significant difference in the levels of PGC-1α was observed between control and db/db mice (Figure 8D-F). Artemether increased PGC-1α levels significantly, but did not affect catalase and SOD2 expression in the renal cortex (Figure 8D-F). As shown in Figure 8G-I, higher levels of the mitochondrial proteins, PDH and PDK1, were observed in db/db mice compared with control mice. The mitochondrial content of PDP1 was also slightly increased, but not to a significant degree, in db/db mice. Artemether treatment did not affect PDH and PDK1 expression, but it caused significant increase in PDP1 levels compared with control mice. Both carriers that facilitate pyruvate transport into mitochondria, MPC1 and MPC2, were significantly decreased in db/db mice and both of them were significantly increased after artemether treatment.
Discussion
Herein, we report for the first time that artemether improved DKD in T2D mice. The underlying mechanisms may be associated with the effects of artemether on renal MPC expression and regulation of mitochondrial function.
Renal enlargement is the hallmark pathological feature of DKD. It is mainly manifested as enlarged glomeruli and proximal tubules, increased mesangial matrix, and thickened GBM and TBM. Artemether prevented kidney hypertrophy and ameliorated these lesions. The podocyte foot process became wider in DKD, which can lead to proteinuria. Artemether treatment restored FPW width and significantly reduced urinary albumin excretion. Because artemether improved hyperglycemia and increased serum insulin levels, it is possible that the renal protection mechanism of artemether is associated with its effect on hypoglycemia.
As the earliest structural change of DKD, diffuse GBM thickening has been shown to occur in some nondiabetic patients, the majority of whom develop abnormal blood glucose over time and are subsequently diagnosed with diabetes [19]. Other researchers found that glomerular enlargement and thickening of basement membrane appears in the rhesus monkey prior to development of clinical diabetes, and these renal lesions correlate with hyperinsulinemia or the prediabetic state [20]. Therefore, we hypothesized that the initiation of renal lesions and hyperglycemia are both results of metabolic reprogramming of the body in response to the environment. The diabetic kidney was characterized by incomplete glucose oxidation and enhanced fatty acid utilization. This alteration was indirectly manifested as decreased RER and decreased MPC content in renal mitochondria. Artemether treatment increased RER, but did not affect total energy expenditure. This result indicated that artemether shifted the energy metabolic substrate from lipids and proteins to glucose. As the end product of glycolysis, pyruvate lies at the intersection of glycolysis and tricarboxylic acid cycle, and its transport into the mitochondrial matrix influences carbohydrate, fatty acid, and amino acid metabolism. MPC is a mitochondrial inner membrane carrier and mediates the transport of cytosolic pyruvate into mitochondria. Its absence leads to defective mitochondrial pyruvate uptake and utilization, which results in developmental defects and various diseases like lactic acidosis and cancers [21]. In this study, artemether increased renal MPC content, which may explain its effect on metabolic substrate selection. Compared with control group mice, the mitochondrial levels of PDH and PDK1 in the db/db mice group increased significantly, but levels of mitochondrial PDP increased only slightly, but not to a significant degree. Although artemether treatment did not affect PDH and PDK1 content, the increasing trend of PDP levels was more pronounced in artemether-treated mice. Taken together, these results revealed that artemether increased the oxidation of pyruvate in the mitochondrial matrix.
A recent study demonstrated that MPC1 is a novel target gene of PGC-1α. Overexpression of PGC-1α stimulates MPC1 transcription, whereas depletion of PGC-1α suppresses MPC expression [22]. We speculated that MPC upregulation by artemether might be associated with its remarkable increasing effect on PGC-1α, which is a broad and powerful regulator of ROS metabolism. PGC-1α is deeply implicated with mitochondrial function and redox imbalance. Furthermore, PGC-1α expression is increased by physiological stimuli (e.g., by cold in brown fat or by exercise in muscle), which leads to mitochondrial biogenesis and enhanced respiration. Simultaneously, PGC-1α initiates an anti-ROS program that prevents a rise in intracellular ROS levels [23]. In addition, PGC-1α can also be induced by ROS [24]; so it performs dual functions of stimulating mitochondrial electron transport while suppressing ROS generation. In the current study, serum H2O2 and urinary H2O2 excretion increased significantly in db/db mice. The H2O2 alterations could be explained by significant reduction of catalase in the renal cortex. Artemether significantly reduced the serum H2O2 level and urinary H2O2 excretion, but it did not exert obvious effects on catalase and SOD expression in the renal cortex. Because artemether decreased H2O2 production in mitochondria that were isolated from normal fresh kidney in a dose-dependent manner, we inferred that artemether might regulate redox balance by directly suppressing mitochondrial H2O2 production, not by scavenging, at least in the T2D kidney. However, further studies are needed to understand the detailed mechanism.
In conclusion, our results confirmed the renal protection provided by artemether in DKD. Artemether has great potential to be translated to the clinic for the treatment of diabetes and DKD.
Acknowledgements
This study was supported by grants from National Natural Science Foundation of China (81673794, 81202818), Natural Science Foundation of Guangdong Province (2018A0303100003), Shenzhen Science and Technology Project (JCYJ20160330171116798, JCYJ20160428182542525), Health and Family Planning Commission of Shenzhen Municipality (SZBC2017027), and Sanming Project of Medicine in Shenzhen (SZSM201512040).
Disclosure of conflict of interest
None.
References
- 1.Chatterjee S, Khunti K, Davies MJ. Type 2 diabetes. Lancet. 2017;389:2239–2251. doi: 10.1016/S0140-6736(17)30058-2. [DOI] [PubMed] [Google Scholar]
- 2.Doshi SM, Friedman AN. Diagnosis and management of type 2 diabetic kidney disease. Clin J Am Soc Nephrol. 2017;12:1366–1373. doi: 10.2215/CJN.11111016. [DOI] [PMC free article] [PubMed] [Google Scholar]
- 3.Forbes JM, Thorburn DR. Mitochondrial dysfunction in diabetic kidney disease. Nat Rev Nephrol. 2018;14:291–312. doi: 10.1038/nrneph.2018.9. [DOI] [PubMed] [Google Scholar]
- 4.Choi HM, Kim HR, Kim EK, Byun YS, Won YS, Yoon WK, Kim HC, Kang JG, Nam KH. An age-dependent alteration of the respiratory exchange ratio in the db/db mouse. Lab Anim Res. 2015;31:1–6. doi: 10.5625/lar.2015.31.1.1. [DOI] [PMC free article] [PubMed] [Google Scholar]
- 5.Sas KM, Kayampilly P, Byun J, Nair V, Hinder LM, Hur J, Zhang H, Lin C, Qi NR, Michailidis G, Groop PH, Nelson RG, Darshi M, Sharma K, Schelling JR, Sedor JR, Pop-Busui R, Weinberg JM, Soleimanpour SA, Abcouwer SF, Gardner TW, Burant CF, Feldman EL, Kretzler M, Brosius FC 3rd, Pennathur S. Tissue-specific metabolic reprogramming drives nutrient flux in diabetic complications. JCI Insight. 2016;1:e86976. doi: 10.1172/jci.insight.86976. [DOI] [PMC free article] [PubMed] [Google Scholar]
- 6.Rindler PM, Crewe CL, Fernandes J, Kinter M, Szweda LI. Redox regulation of insulin sensitivity due to enhanced fatty acid utilization in the mitochondria. Am J Physiol Heart Circ Physiol. 2013;305:H634–643. doi: 10.1152/ajpheart.00799.2012. [DOI] [PubMed] [Google Scholar]
- 7.Zhang G, Darshi M, Sharma K. The warburg effect in diabetic kidney disease. Semin Nephrol. 2018;38:111–120. doi: 10.1016/j.semnephrol.2018.01.002. [DOI] [PMC free article] [PubMed] [Google Scholar]
- 8.Taylor EB. Functional properties of the mitochondrial carrier system. Trends Cell Biol. 2017;27:633–644. doi: 10.1016/j.tcb.2017.04.004. [DOI] [PMC free article] [PubMed] [Google Scholar]
- 9.Schell JC, Olson KA, Jiang L, Hawkins AJ, Van Vranken JG, Xie J, Egnatchik RA, Earl EG, DeBerardinis RJ, Rutter J. A role for the mitochondrial pyruvate carrier as a repressor of the warburg effect and colon cancer cell growth. Mol Cell. 2014;56:400–413. doi: 10.1016/j.molcel.2014.09.026. [DOI] [PMC free article] [PubMed] [Google Scholar]
- 10.Zou S, Lang T, Zhang B, Huang K, Gong L, Luo H, Xu W, He X. Fatty acid oxidation alleviates the energy deficiency caused by the loss of MPC1 in MPC1(+/-) mice. Biochem Biophys Res Commun. 2018;495:1008–1013. doi: 10.1016/j.bbrc.2017.11.134. [DOI] [PubMed] [Google Scholar]
- 11.Tu Y. Artemisinin-a gift from traditional chinese medicine to the world (nobel lecture) Angew Chem Int Ed Engl. 2016;55:10210–10226. doi: 10.1002/anie.201601967. [DOI] [PubMed] [Google Scholar]
- 12.Guo Z. Artemisinin anti-malarial drugs in China. Acta Pharm Sin B. 2016;6:115–124. doi: 10.1016/j.apsb.2016.01.008. [DOI] [PMC free article] [PubMed] [Google Scholar]
- 13.Li J, Casteels T, Frogne T, Ingvorsen C, Honore C, Courtney M, Huber KVM, Schmitner N, Kimmel RA, Romanov RA, Sturtzel C, Lardeau CH, Klughammer J, Farlik M, Sdelci S, Vieira A, Avolio F, Briand F, Baburin I, Majek P, Pauler FM, Penz T, Stukalov A, Gridling M, Parapatics K, Barbieux C, Berishvili E, Spittler A, Colinge J, Bennett KL, Hering S, Sulpice T, Bock C, Distel M, Harkany T, Meyer D, Superti-Furga G, Collombat P, Hecksher-Sørensen J, Kubicek S. Artemisinins target GABAA receptor signaling and impair alpha cell identity. Cell. 2017;168:86–100. e115. doi: 10.1016/j.cell.2016.11.010. [DOI] [PMC free article] [PubMed] [Google Scholar]
- 14.Sun H, Wang W, Han P, Shao M, Song G, Du H, Yi T, Li S. Astragaloside IV ameliorates renal injury in db/db mice. Sci Rep. 2016;6:32545. doi: 10.1038/srep32545. [DOI] [PMC free article] [PubMed] [Google Scholar]
- 15.Wu HS, Dikman S, Gil J. A semi-automatic algorithm for measurement of basement membrane thickness in kidneys in electron microscopy images. Comput Methods Programs Biomed. 2010;97:223–231. doi: 10.1016/j.cmpb.2009.07.002. [DOI] [PubMed] [Google Scholar]
- 16.Han P, Zhan H, Shao M, Wang W, Song G, Yu X, Zhang C, Ge N, Yi T, Li S, Sun H. Niclosamide ethanolamine improves kidney injury in db/db mice. Diabetes Res Clin Pract. 2018;144:25–33. doi: 10.1016/j.diabres.2018.08.003. [DOI] [PubMed] [Google Scholar]
- 17.Najafian B, Fogo AB, Lusco MA, Alpers CE. AJKD atlas of renal pathology: diabetic nephropathy. Am J Kidney Dis. 2015;66:e37–38. doi: 10.1053/j.ajkd.2015.08.010. [DOI] [PubMed] [Google Scholar]
- 18.Rinschen MM, Godel M, Grahammer F, Zschiedrich S, Helmstadter M, Kretz O, Zarei M, Braun DA, Dittrich S, Pahmeyer C, Schroder P, Teetzen C, Gee H, Daouk G, Pohl M, Kuhn E, Schermer B, Kuttner V, Boerries M, Busch H, Schiffer M, Bergmann C, Kruger M, Hildebrandt F, Dengjel J, Benzing T, Huber TB. A multi-layered quantitative in vivo expression atlas of the podocyte unravels kidney disease candidate genes. Cell Rep. 2018;23:2495–2508. doi: 10.1016/j.celrep.2018.04.059. [DOI] [PMC free article] [PubMed] [Google Scholar]
- 19.Mac-Moune Lai F, Szeto CC, Choi PC, Ho KK, Tang NL, Chow KM, Li PK, To KF. Isolate diffuse thickening of glomerular capillary basement membrane: a renal lesion in prediabetes? Mod Pathol. 2004;17:1506–1512. doi: 10.1038/modpathol.3800219. [DOI] [PubMed] [Google Scholar]
- 20.Cusumano AM, Bodkin NL, Hansen BC, Iotti R, Owens J, Klotman PE, Kopp JB. Glomerular hypertrophy is associated with hyperinsulinemia and precedes overt diabetes in aging rhesus monkeys. Am J Kidney Dis. 2002;40:1075–1085. doi: 10.1053/ajkd.2002.36348. [DOI] [PubMed] [Google Scholar]
- 21.Bender T, Martinou JC. The mitochondrial pyruvate carrier in health and disease: to carry or not to carry? Biochim Biophys Acta. 2016;1863:2436–2442. doi: 10.1016/j.bbamcr.2016.01.017. [DOI] [PubMed] [Google Scholar]
- 22.Koh E, Kim YK, Shin D, Kim KS. MPC1 is essential for PGC-1alpha-induced mitochondrial respiration and biogenesis. Biochem J. 2018;475:1687–1699. doi: 10.1042/BCJ20170967. [DOI] [PubMed] [Google Scholar]
- 23.St-Pierre J, Drori S, Uldry M, Silvaggi JM, Rhee J, Jager S, Handschin C, Zheng K, Lin J, Yang W, Simon DK, Bachoo R, Spiegelman BM. Suppression of reactive oxygen species and neurodegeneration by the PGC-1 transcriptional coactivators. Cell. 2006;127:397–408. doi: 10.1016/j.cell.2006.09.024. [DOI] [PubMed] [Google Scholar]
- 24.Rabinovitch RC, Samborska B, Faubert B, Ma EH, Gravel SP, Andrzejewski S, Raissi TC, Pause A, St-Pierre J, Jones RG. AMPK maintains cellular metabolic homeostasis through regulation of mitochondrial reactive oxygen species. Cell Rep. 2017;21:1–9. doi: 10.1016/j.celrep.2017.09.026. [DOI] [PubMed] [Google Scholar]


