Abstract
Our ultrasound practice is becoming even more focused on managing practice resources and improving our efficiency while maintaining practice quality. We often encounter questions related to issues such as equipment utilization and management, study type statistics, and productivity. We are developing an analytics system to allow more evidence-based management of our ultrasound practice. Our system collects information from tens of thousands of DICOM images produced during exams, including structured reporting, public and private DICOM headers, and text within the images via optical character recognition (OCR). Inventory/location information augments the data aggregation, and statistical analysis and metrics are computed such as median exam length (time from the first image to last), transducer models used in an exam, and exams performed in a particular room, practice location, or by a given sonographer. Additional reports detail the length of a scan room’s operational day, the number and type of exams performed, the time between exams, and summary data such as exams per operational hour and time-based room utilization. Our findings have already helped guide practice decisions: two defective probes were not replaced (a savings of over $10,000) when utilization data showed that three or more of the shared probe model were always idle; neck exams are the most time-consuming individually, but abdomen exam volumes cause them to consume the most total scan time, making abdominal exams the better candidates for efficiency optimization efforts. A small subset of sonographers exhibit the greatest scanning and between-scan efficiency, making them good candidates for identifying best practices.
Keywords: Image-based analytics, Ultrasound practice management, OCR
Background
In the era of declining reimbursements, our ultrasound practice is becoming even more focused on managing our practice resources and improving our efficiency while maintaining practice quality. We often encounter questions related to equipment management, studies, and productivity such as the following:
Do we have enough shared probes of a specific model in each practice location?
If a probe is damaged, should a replacement be purchased?
How many exams per day are we performing (in each scan room or practice location)?
How would exam capacity be increased by extending sonographer shift length or by adding a scanner?
Which exam types take the longest average time to scan and which take the greatest total time per week?
What is the average exam scan time and time between exams for the sonographer staff as a whole and for individual sonographers?
Answering questions such as these often relied on guesswork and the impressions of practice personnel, but opinions often varied and guesses were based on impressions rather than solid evidence. We wanted a means to provide evidenced-based decision-support information in a way that was timely, detailed with respect to the ultrasound practice’s needs, and accessible.
Most institutions already have some systems in place with some of the information needed. Radiology Information Systems (RIS) have a patient-centered focus and include information such as dates, exam types, and results, but often include little or no information about specific equipment used, scanning parameters utilized, and personnel that performed the study. Because the practice questions we are considering require those elements, we needed to find a way to get more detailed data.
We decided to develop an analytics system which is based on the images produced by the ultrasound practice. The images acquired on a scanner are sent to the department’s PACS system for interpretation and archiving and are encoded in the DICOM medical image format. This format includes metadata about the image in a well-defined image header which can be utilized for our evidence-based data collection. The image routing network infrastructure sends a duplicate copy to our system of each DICOM image produced by our ultrasound scanners. Each image is analyzed and the data collected is stored for future analysis.
The data collection and analysis tools have been developed in the MATLAB programming environment (https://www.mathworks.com) and utilized built-in capabilities for decoding DICOM headers.
Methods
Data Collection
DICOM image metadata includes information such as unique identifiers for the image and study it is part of, the scanner on which it was acquired, the date and time of the image acquisition, the sonographer that performed the study, the study description, and many details about the format of the image such as dimensions, color vs. grayscale, type of image (B-mode, duplex Doppler, color Doppler, shear wave elastogram), and the number of frames.
Further information is available for some images in the vendor-specific “private” elements in the DICOM header. For our GE Logiq E9 scanners, which comprise the bulk of our ultrasound practice, our system took advantage of a DICOM tool provided to us by GE. This tool decodes the private elements in the DICOM header into a form that our tool could then parse to collect much more information than the public DICOM headers offered, such as the exact model of transducer used, scanning parameters such as preset names, transducer operating frequency, gain, power output, image depth, speed of sound, imaging modes (harmonics, color flow, crossbeam, elastography), and operating characteristics such as frame rates.
In cases where an image did not have the extra private element data included because it was not transmitted in “raw” format, our system used optical character recognition (OCR) to read the text from areas of the image. These textual scans afforded information such as the transducer model, the imaging preset selected, and most of the scanning parameters for the acquired image (Fig. 1). OCR proved effective but not without problems, as some recognition errors persist even after customized training of the OCR software on the fonts presented. However, as a fallback option when there were not private elements, the OCR offered rich information that would not otherwise be available.
Fig. 1.
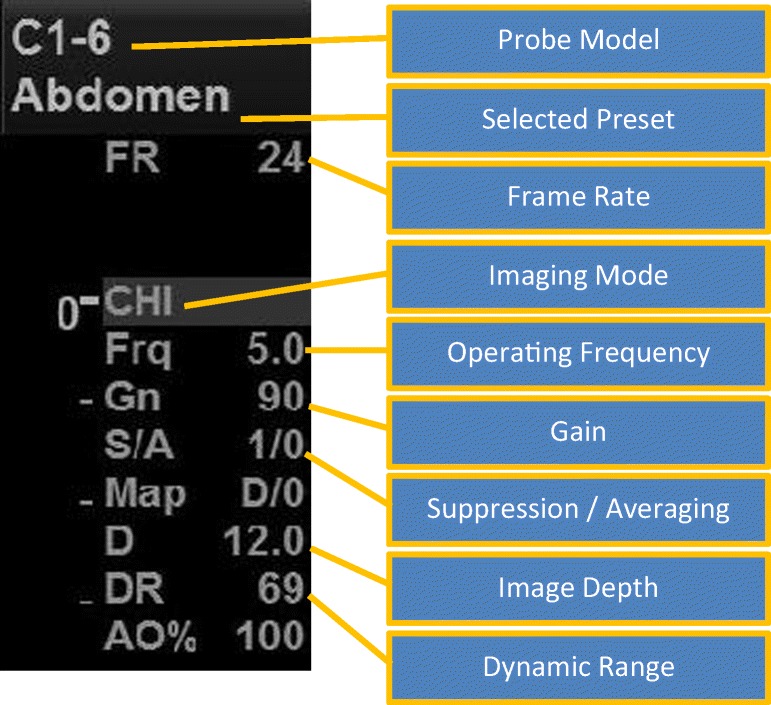
Image acquisition parameters present on B-mode images
In addition to the images produced during an ultrasound exam, there are often measurements made. These measurements include caliper-based distance measurements for anatomy as well as Doppler-based measurements for velocities. These measurements are encoded and transmitted by the scanner in the DICOM Structured Reporting (SR) format. We utilized the Offis DICOM Toolkit—DCMTK (https://dicom.offis.de/dcmtk), which has tools for decoding SR files into textual information. Our tool then parses this text and collects information such as the measurements made and their values.
All of the information collected from the public and private DICOM elements, OCR text recognition, and the SR are stored in a table which is then available for further processing and analysis. It is important to note that the data collected does not contain protected health information (PHI) (Table 1).
Table 1.
Examples of data elements included in the image-based records
| SOP class UID | |
| SOP instance UID | |
| Study instance UID | |
| Study date and time | |
| Study ID | |
| Study description | |
| Series instance UID | |
| Series date and time | |
| Series number | |
| Instance number | |
| Content date and time | |
| Accession number | |
| Modality | |
| Manufacturer | |
| Institution name | |
| Station name | |
| Operator name | |
| Manufacturer model name | |
| Device serial number | |
| Software version | |
| Has private elements | |
| Transducer type | |
| Probe name | |
| Preset name | |
| Application | |
| Speed of sound in blood | |
| Speed of sound in tissue | |
| Colormap | |
| Rejection level | |
| Harmonics | |
| Depth | |
| Frame rate | |
| Imaging mode | |
| Frequency | |
| Gain | |
| SRI | |
| Averaging | |
| Map | |
| Auto optimize | |
| Dynamic range | |
| Acoustic output | |
| Persistence | |
| Color flow frequency | |
| Color flow gain | |
| Number of frames | |
| Number of US regions | |
| Image width | |
| Image height | |
| Color type | |
| Image filename |
Data Processing
There are some logical data associations that can be made from the individual image data. The idea of a “study” can be built from all images that share the same study instance UID, DICOM element (0020,000D). Because each image has an acquisition time, an approximation of the study’s start time and end time can be derived from the earliest image timestamp and the last image timestamp associated with that study. This is only an approximation, however, because it does not take into account time spent on the study that is outside of the image acquisition period. For example, in a scenario where a sonographer acquires 20 images for a patient study, our system assumes the start time of the study was when the first image was acquired and the end time was when the last image was acquired. This approach fails to account for the time the sonographer spends reviewing prior studies, reviewing acquired images for quality assurance, and when presenting the study to the radiologist. However, in a scenario where the sonographer is asked to reacquire images or to acquire additional ones, those newer images are associated with the same study and the timestamps of the later acquisitions move the end time further out. This helps to capture the actual length of time of a study.
Aggregating and summarizing information at the study level is a convenient shortcut for some types of analyses. In our system, a study record is recorded with the study identifier, where it was performed, the start and end time, the study description, and which models of transducers were used for the study (Table 2).
Table 2.
Data columns in a study record
| Study instance UID | |
| Study date and time | |
| Accession number | |
| Study description | |
| Scanner manufacturer | |
| Scanner serial number | |
| Scanner AE title | |
| Scanner software version | |
| Start time | |
| End time | |
| Duration | |
| Sonographer | |
| Probes used |
Another useful, even essential component of the data processing is the supplementation of the image and study data with equipment inventory information. Each image identifies which scanner was used to acquire it, but there needs to be additional information that associates a location and organizational unit to a piece of equipment. Doing so allows information to be summarized as a practice area, such as our main outpatient practice. We maintain a table of scanner inventory information which includes scanner identifiers that match those in the images along with room information and organizational practice information. For our practice, this data needed to include a date range for the location record because scanners move between practices, new scanners are added, and old scanners are retired. It has also been useful to know how many scanners are in an area for a specific time period for calculation of percentages, capacity, etc. By indexing into this accessory inventory information with the image’s station name, DICOM element (0008,1010), and the date of the image, our system can associate the image with the scanner, the exam room, and the practice area used.
Results
The data collection, augmentation, and processing results in tables of data that represent both a summary description of the studies performed in the practice and the individual images that comprise those studies. How those tables are filtered and summarized depends on the type of clinical question being asked.
Questions relating to the types and durations of studies performed and quantifying sonographer performance tend to utilize the study-level aggregation of information. Scanning parameter clinical questions will utilize the image-oriented tables to get the fine granularity information needed. Equipment-focused questions that deal with transducers and scanners tend to span the two types of information for particulars on which equipment is being used but also for analyzing utilization.
We will now discuss how the data has been used to answer questions of the various types.
Equipment Utilization
Equipment-related reports can try to answer questions such as which probes are being used for a given study type, whether or not there are enough shared-pool probes of a particular model for the practice area, or for analyzing the level of utilization for each scanner in a practice.
One example of a real-world clinical question we needed to answer was whether or not to replace a transducer that had developed defects that prevented it from being used clinically. Our main outpatient practice area has 15 scanners and a shared pool of nine endovaginal probes which are not assigned to a particular scanner, as are most of our probes, but which are stored centrally and are retrieved by sonographers before the start of an exam. After the exam, the sonographer submits the probe to the standard cleaning and disinfection process before the probe is returned to central storage. One of these probes developed significant visual artifacts in images which rendered it unusable for clinical studies. Previously, the decision of whether or not to order a replacement probe was relatively automatic with a goal of maintaining the same number of probes. With our new evidence-based analytics system, however, we wanted to evaluate whether or not the practice truly needed a replacement.
Our approach was to identify how many probes of a given model were in use at any one time. A probe is considered in-use for the entire duration of the study that includes it. For example, if a probe model is only used for two images out of a 30 image study, we still say that the probe was in use for the entire time of the study because it is unavailable to others for use.
The timing of a study is based on the images within it. A study is considered to start at the time of the first image and lasts until the timestamp of the last image. This definition of a study’s start time and duration is not strictly accurate—there is time spent by a sonographer both before and after image acquisition. However, for purposes of equipment utilization, the concept of the time span works adequately for identifying when equipment is involved in a study and when it might be available for use in other studies. So for a given probe model, if a study has any images that were acquired with that probe model, our system identifies the in-use time of the probe as being from the timestamp of the first image in the entire study to the timestamp of the last image.
A strict usage of that time frame does not model reality as closely as it could, however. No probe is available for use immediately after the last image. Every probe and scanner needs to be cleaned and readied. Probes such as the endovaginal probes require disinfection processing after a study. This extends the amount of time that the probe is unavailable to others after a study. To better model the availability of probes, we add a fixed amount of time, 5 min, to the last timestamp of the last image, and for probes such as the endovaginal probes that require more intensive cleaning and disinfection, we add 15 min to account for the additional time.
To model how many shared probes are in use at any one time, our system will pull all records from the studies table for a given date range and then filter those records for those studies performed in a given practice (i.e., the scanners that are sharing the local probe pool) for a given model of transducer and iterate on the days in the sample period. Given this set of studies that used the probe of interest in 1 day, the system then starts to “stack up” the usage of that probe model on a vector representation of the minutes of the day such that it becomes possible to index to a given minute of the day to see the count of studies that were occurring at that minute. This count represents how many probes of that model were in use at that time. The maximum value in that day’s vector represents the most probes that were ever being used concurrently on that day.
By plotting the maximum, minimum, and median number of in-use counts for an aggregation by the day of the week, a view of usage can be seen.
For example, Fig. 2 shows that on Wednesdays, for the sample date range, there were up to eight of the probe model concurrently in use in the afternoon but only for a few minutes.
Fig. 2.
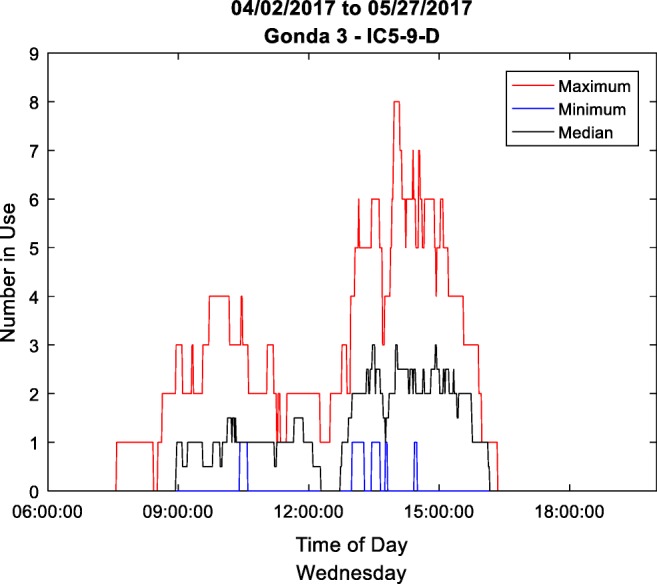
Concurrent usage of the IC5–9 probe on Wednesdays of the sample period (See color online)
For another view of the data, one can count the number of minutes that various numbers of probes were being used simultaneously. By graphing the count of minutes that one, two, three up to all transducers were in use concurrently, this view quickly summarizes the utilization of the probe in the sample date range.
The graph in Fig. 3 shows that for the 2-month sample period there were 6734 min that only one IC5–9 probe was in use and 4355 min that two were in use simultaneously. One can quickly see that there are significant amounts of time that up to five probes were in use simultaneously, but the number of minutes drops off quickly. In 2-month time, there were only 20 min when seven were in use, and only 8 min when eight were in use. Never were all nine probes seen in use simultaneously.
Fig. 3.
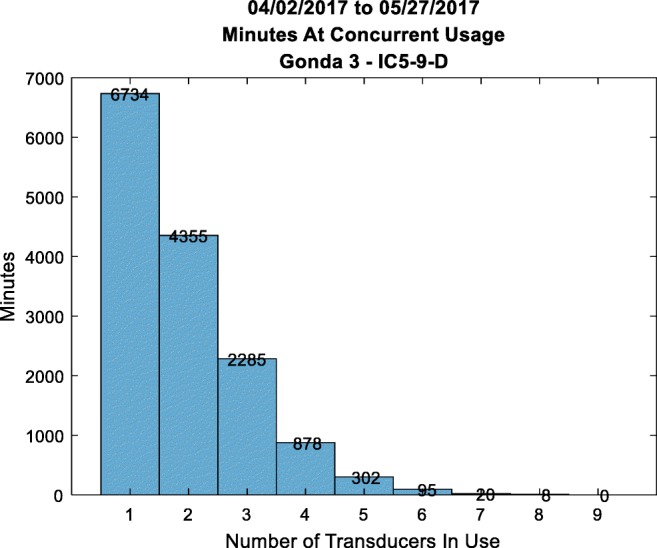
Number of minutes of concurrent usage of the IC5–9 probes
This data was used for making our decision on whether or not to replace a probe. The outpatient practice had nine IC5–9 probes, but never were all nine in use and seldom were even seven or eight in use. The decision was made to not replace the defective probe because the data suggested the practice could effectively operate with eight of that model.
Shortly after this decision was made, another probe developed a defect and was removed from use. Again, the practice wanted to know if it should order a replacement. The data suggested that this outpatient area occasionally saw instances where eight probes were in use simultaneously, suggesting that there could be times when a sonographer would be forced to wait for a probe’s availability before performing an exam (although considering that these 8 min were spread out over the 2-month reporting period, this level of unavailability might be acceptable). However, a transducer usage report for one of the nearby hospital practice locations showed that, of the three IC5-9 probes in that area, never was there more than one in use. The decision was made to relocate one of the hospital practice’s probes to the outpatient practice.
In a short period of time, the clinic lost two IC5-9 probes from its practice. Prior to our evidence-based analytics system, expenditure for two replacement probes would likely have been made. However, by demonstrating the actual utilization of the existing set of probes, we were able to save the clinic over $10,000 while continuing to meet the needs of our patient loads. This same utilization analysis could be used to evaluate the needs for added-cost scan features, such as panoramic imaging or probe-position-tracking equipment.
Scanner utilization can be evaluated in a similar manner to transducers, but the clinical question was not on concurrent usage but on overall utilization, such as the length of time a scanner was typically used in a day.
Again, records from the table of performed studies are pulled for a date range and filtered down for those pertaining to the practice area of interest. The concept of a scanner being in-use is defined as the time from the first image of a study on that scanner to the last image of that study with an arbitrary addition of 10 min intended to represent scanner and room cleaning.
To describe the utilization of a scanner in a day, we defined the “operational day” as the time from the start of the first study on that scanner until the end time of the last study of the day. We also counted the number of studies performed each day.
The box plot in Fig. 4 shows the number of hours scanners were in use for a practice area. The plot shows the median value as a red line, the 25th to 75th percentile range (interquartile range) as the blue box, and the whiskers of the plot represent the extent of the nonoutlier values. Outliers are plotted with red positive signs. The plot shows that the utilization of the rooms is greater at the start of the week, over 8 hours in length, but that as the week goes on utilization decreases to where the typical room in this practice is only in use for between 7 and 8 h on Fridays. These findings reflect a clinical outpatient load where the bulk of diagnostic exams are ordered to be performed at the beginning of the week and fewer are ordered for later in the week. The findings also demonstrate the extended hours of operation for Monday and Tuesday.
Fig. 4.
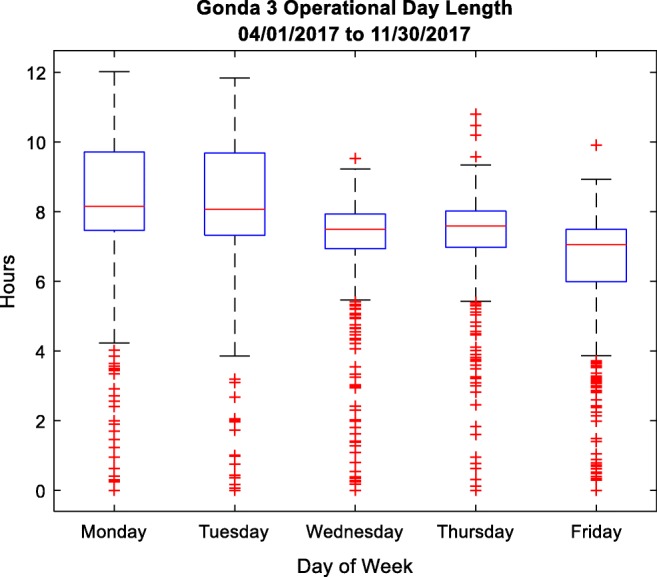
Box plot of operational day length for scanners in one of the outpatient practice areas (See color online)
Counting and summarizing the number of exams completed in the practice area afforded another box plot (Fig. 5), which again reflects the greater utilization toward the beginning of the week.
Fig. 5.
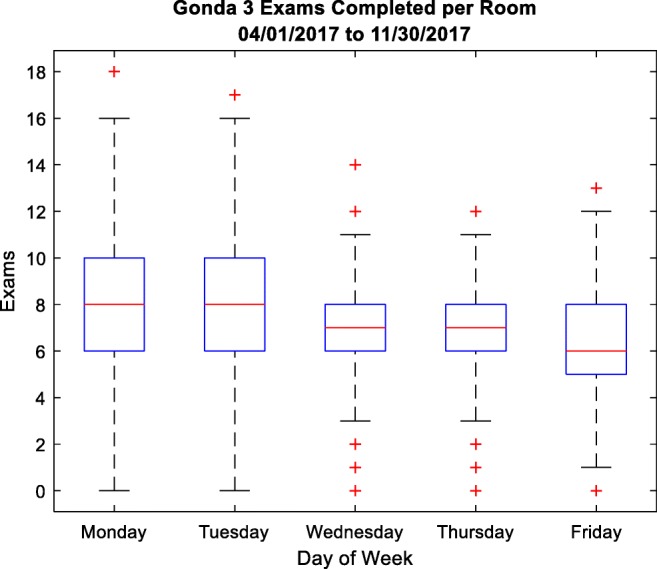
Number of exams completed per room in an outpatient practice
We have also explored the ratio of the time spent actively involved in a study acquisition to the total operational day length. It was understood that this ratio would be relatively low because of our definition of a study’s length being based on image acquisition only and not including time spent for the sonographer review of the exam’s order, quality assurance, presentation to the radiologist, and room cleaning.
By calculating the number of scanners actively engaged in a study at any point in the day and dividing that by the number of scanners available, we can see into the pattern of usage throughout the day, as shown in Fig. 6.
Fig. 6.
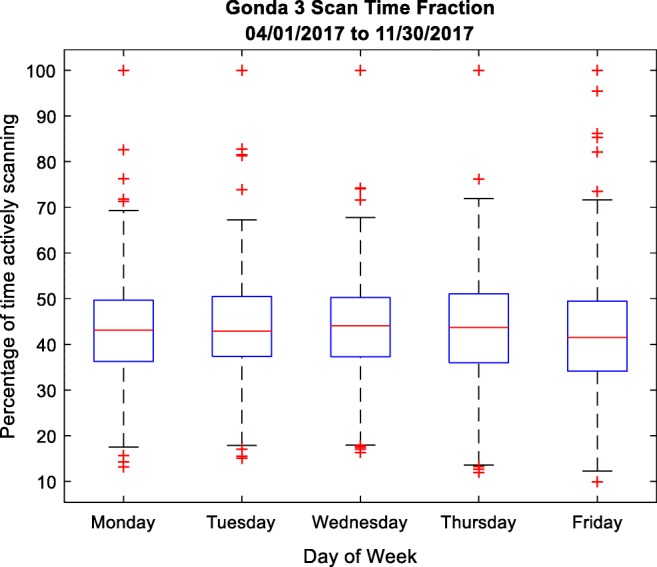
Ratio as a percentage of image acquisition time to the length of the operational day
In Fig. 7, it is readily apparent when the majority of the sonography staff takes a lunch break in the middle of the day. It can also be seen how a greater percentage of scanners are still in use in the evening hours on Monday and Tuesday (the plot’s shelf on the right side). Fridays (green line) show an overall lower utilization of equipment.
Fig. 7.
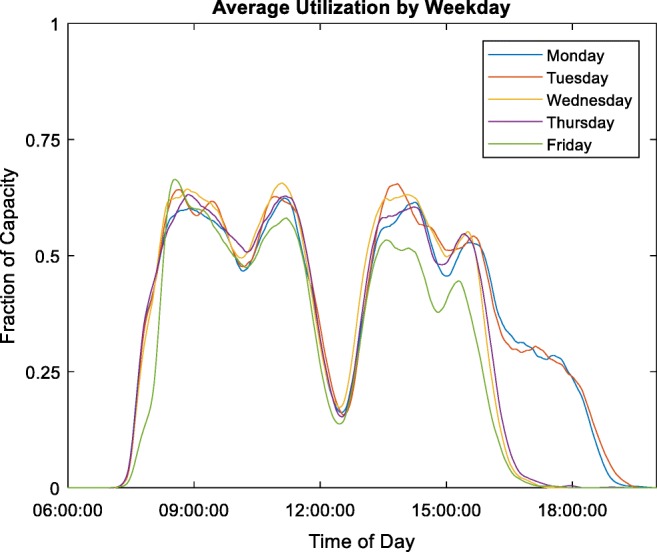
Number of active scanners compared to the number available by time and weekday (See color online)
Study Characterization
When looking to improve practice efficiency, a review of scanning protocols to identify unnecessary views or measurements can be useful. To focus efforts on the exams with the greatest potential return on investment, it makes sense to study exams on which the practice spends the most acquisition time.
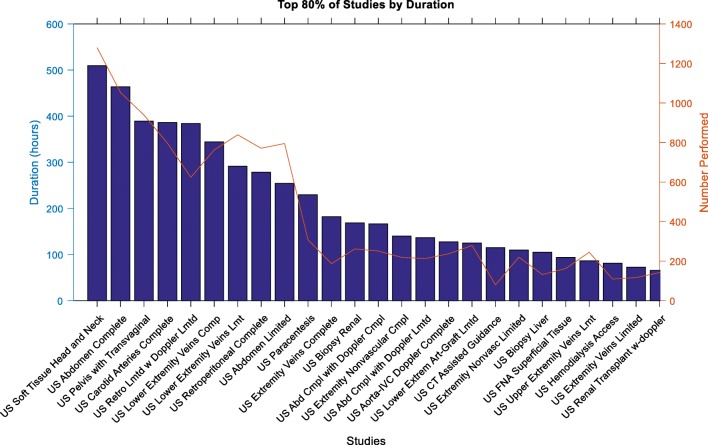
The practice leaders had the impression that neck exams (“soft tissue head and neck”) were the most numerous and most time-consuming and would be the logical focus of the efforts. However, our informatics analysis showed that while neck exams are the most time-consuming exams individually, abdomen exam volumes, when all the exam variations such as “complete” and “limited” are combined, cause them to consume the most total scan time, making them the better candidates for efficiency optimization efforts.
This analysis was performed by collecting the study records for the sample time period and performing grouping and aggregation statistical analysis on the study types. The data set could be restricted to one practice area or left unrestricted, as in Table 3.
Table 3.
Analysis of practice study types, including volume and duration.
| Metrics of ultrasound study types | |||||||
|---|---|---|---|---|---|---|---|
| Study name | Number performed | Time spent | Time/exam | Images per exam | Time per image | Percentages of all time spent | Cumulative percentage |
| US soft tissue head and neck | 1280 | 509:25:35 | 00:23:52 | 50 | 00:00:25 | 7.75 | 7.75 |
| US abdomen complete | 1053 | 463:53:24 | 00:26:25 | 56 | 00:00:25 | 7.06 | 14.81 |
| US pelvis with transvaginal | 939 | 389:23:30 | 00:24:52 | 57 | 00:00:23 | 5.93 | 20.74 |
| US carotid arteries complete | 797 | 386:24:17 | 00:29:05 | 53 | 00:00:29 | 5.88 | 26.62 |
| US retro limited with Doppler limited | 624 | 383:55:03 | 00:36:54 | 50 | 00:00:39 | 5.84 | 32.47 |
| US lower extremity veins complete | 763 | 344:16:34 | 00:27:04 | 44 | 00:00:32 | 5.24 | 37.71 |
| US lower extremity veins limited | 839 | 291:22:52 | 00:20:50 | 27 | 00:00:40 | 4.44 | 42.14 |
| US retroperitoneal complete | 771 | 278:18:11 | 00:21:39 | 42 | 00:00:26 | 4.24 | 46.38 |
| US abdomen limited | 795 | 254:28:36 | 00:19:12 | 23 | 00:00:39 | 3.87 | 50.25 |
| US paracentesis | 308 | 229:38:15 | 00:44:44 | 13 | 00:03:16 | 3.50 | 53.75 |
| US extremity veins complete | 187 | 181:48:28 | 00:58:20 | 56 | 00:00:57 | 2.77 | 56.51 |
| US biopsy renal | 262 | 168:30:07 | 00:38:35 | 11 | 00:03:05 | 2.56 | 59.08 |
| US abdomen complete with Doppler complete | 251 | 166:17:32 | 00:39:45 | 70 | 00:00:31 | 2.53 | 61.61 |
| US extremity nonvascular complete | 219 | 139:51:31 | 00:38:19 | 33 | 00:01:04 | 2.13 | 63.74 |
| US abdomen complete with Doppler limited | 213 | 136:33:59 | 00:38:28 | 69 | 00:00:30 | 2.08 | 65.82 |
| US aorta-IVC Doppler complete | 237 | 127:24:19 | 00:32:15 | 36 | 00:00:48 | 1.94 | 67.76 |
| US lower extremity arteries—graft limited | 279 | 125:06:29 | 00:26:54 | 31 | 00:00:43 | 1.90 | 69.66 |
| US CT-assisted guidance | 80 | 115:04:35 | 01:26:18 | 10 | 00:06:36 | 1.75 | 71.41 |
| US extremity nonvascular limited | 220 | 109:44:11 | 00:29:55 | 20 | 00:01:10 | 1.67 | 73.08 |
| US biopsy liver | 132 | 105:10:18 | 00:47:48 | 15 | 00:03:02 | 1.60 | 74.68 |
| US FNA superficial tissue | 163 | 93:36:34 | 00:34:27 | 12 | 00:02:39 | 1.42 | 76.11 |
| US upper extremity veins limited | 245 | 86:30:52 | 00:21:11 | 27 | 00:00:41 | 1.32 | 77.42 |
| US hemodialysis access | 109 | 81:16:42 | 00:44:44 | 45 | 00:00:53 | 1.24 | 78.66 |
| US extremity veins | 117 | 72:38:10 | 00:37:14 | 34 | 00:00:54 | 1.11 | 79.77 |
This type of analysis can highlight findings such as how the “US retro limited with Doppler limited” and “US extremity veins complete” studies are relatively time-consuming, accounting for a significant number of hours of acquisition time but being lower in volume numbers. This is reflected in the relatively high time/exam value in Table 3 and the taller bar but lower line in Fig. 8.
Fig. 8.
Bar and line graph showing the top 80% of study types by duration. The bars and left axis denote the time spent in hours. The red line and right axis indicate the number of studies performed (See color online)
Sonographer Efficiency
It can be helpful to practice management to measure aspects of sonographer performance in order to identify best practices and sonographers that may require assistance. Many such measurement systems require rigorous manual recording of time events which can be problematic. By utilizing the image-based data which has the sonographers’ identifiers included, we can perform some quantitative analysis of the time-based aspects of an ultrasound study.
Our system takes a date range for the images to sample and from those images determines which types of studies were performed. Then, for each study, we use our standard measurement of study duration to characterize how long a sonographer takes to do the exam. Because patients and sonographers vary from day to day, it is necessary to use weeks to months of data to get a reasonable summary of a sonographer’s typical performance on that type of study.
Using a box plot to illustrate the time it took sonographers to perform a breast ultrasound allows a comparison of the durations between sonographers. In the example in Fig. 9, sonographers S05, S11, and S12 have some of the lowest median study durations. If the diagnostic acceptability of their studies can be confirmed, these sonographers may have some good insights into how the practice can most efficiently acquire this type of exam. The analyses that measure the performance characteristics of personnel are treated as sensitive and confidential. All statistical information that is specific to individual sonographers is handled with great care and shared only with practice leadership and supervisors.
Fig. 9.
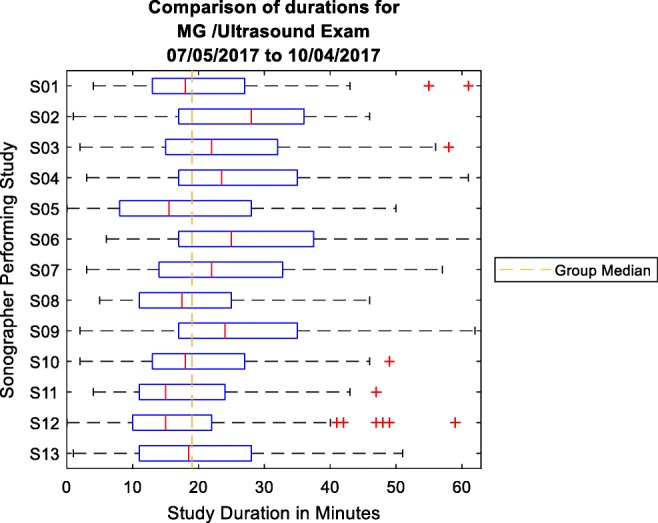
Comparison of sonographer study acquisition times for a breast ultrasound. The box represents the 25th to 75th percentile range (interquartile range), and the red line is the median time (See color online)
Discussion
Every ultrasound image acquired in the practice gets processed and recorded in our system. But because every image is not necessarily intended for clinical interpretation (e.g., test images or research images), there is missing information and noise in the data set. This noise can also be caused by OCR failure when attempting to read textual data from the images.
Depending on the data requirements for each analysis, it will be necessary to filter the data for these failures. For example, in the analysis for sonographer efficiency, the system filtered out missing study descriptions. For analysis of transducer utilization, there were instances where the time period between the first image of a study and the last image of a study was sometimes hours or even days. An investigation into these anomalies found that there were times when a sonographer reopened a study the next day to perform some error corrections or to add a secondary capture image or other post-study image. This action caused the timestamp of the last image associated with the study to be much later, causing the calculation of the study duration to be erroneous. It became necessary to filter out study durations that lasted significantly longer than expected durations.
We have also begun utilizing our image-based analytics data for image quality improvement. Scanning presets are developed to give effective starting points for scanning parameters. They are an attempt to apply best practices and reduce the needed adjustments to acquire clinically acceptable images. When a new preset is developed and deployed to the clinical scanners, the sonographers are educated about its presence and applicability. How many sonographers actually use the preset, however, was an unanswered question. Using the data derived from DICOM headers and OCR text taken from the acquired images, the scanning preset that is active during an image acquisition is known for each image. By collecting those images for a given exam type after the availability of the new preset, the practice can determine how many of the sonographers are utilizing the newly developed preset. If the number is low, a broadcast-style education plan may be needed. If only a few sonographers are not using the new preset, a more focused education plan may be developed that encourages those sonographers identified. These sonographers may also be able to describe why they are not using the new preset, and that information might be used to improve the new preset for all users.
Conclusion
Given access to the images of our ultrasound practice, we have been able to answer many questions about the operation of the practice for leadership. Having detailed information available about each image acquired allows us to develop insights into the equipment usage, personnel performance, and aspects of the overall practice. This has been accomplished with minimal interfacing with the IT infrastructure (essentially, just a feed of images) and does not require an interface to the RIS.
The answers we were able to find from our practice analysis have already saved the practice money and focused effort expenditures in those areas with the highest likelihood of payback. We expect that there will be many other applications for these data for managing our practice as well as improving image quality.
Footnotes
Publisher’s note
Springer Nature remains neutral with regard to jurisdictional claims in published maps and institutional affiliations.


