

Abstract
Motor neuron disease can be viewed as an umbrella term describing a heterogeneous group of conditions, all of which are relentlessly progressive and ultimately fatal. The average life expectancy is 2 years, but with a broad range of months to decades. Biomarker research deepens disease understanding through exploration of pathophysiological mechanisms which, in turn, highlights targets for novel therapies. It also allows differentiation of the disease population into sub-groups, which serves two general purposes: (a) provides clinicians with information to better guide their patients in terms of disease progression, and (b) guides clinical trial design so that an intervention may be shown to be effective if population variation is controlled for. Biomarkers also have the potential to provide monitoring during clinical trials to ensure target engagement. This review highlights biomarkers that have emerged from the fields of systemic measurements including biochemistry (blood, cerebrospinal fluid, and urine analysis); imaging and electrophysiology, and gives examples of how a combinatorial approach may yield the best results. We emphasize the importance of systematic sample collection and analysis, and the need to correlate biomarker findings with detailed phenotype and genotype data.
Keywords: biomarker, motor neuron disease (MND), ALS (Amyotrophic lateral sclerosis), neuroimaging, cerebrospinal fluid (CSF), electrophysiology, biofluid
Introduction
Motor neuron disease (MND), or amyotrophic lateral sclerosis (ALS), is a neurodegenerative and ultimately fatal disease that causes progressive muscle weakness through loss of upper and lower motor neurons (UMN and LMN). Non-motor pathways are also affected and up to 50% of patients have detectable cognitive and behavioral changes (1). ALS can be classified as sporadic (sALS) or familial (fALS). Biomarkers in ALS have been the subject of intense research and discussion over the past 20 years. Sensitive and specific biomarkers have the potential to help clinicians and researchers better understand the disease, improve the design of clinical trials, develop novel therapeutics, and improve patient outcomes. A large body of research exists, although this has led to the provision of only a few validated biomarkers. In part, this reflects a wide variation in methodology, non-standardized analytical techniques, small sample sizes and paucity of longitudinal studies. To validate a biomarker there needs to be recognition of the limitations of the analytical technique by which it is being measured, the analysis must use a standardized operating procedure (SOP), and there must be test-retest reliability, ideally across different centers, to ensure replicability. This review aims to summarize progress in biomarker development in the domains of systemic measures including respiratory function, biochemical analysis of biofluids, electrophysiology and imaging. Table 1 summarizes the biomarkers discussed in the article.
Table 1.
Summary of biomarkers across modalities.
| Biomarker | Modality | Key findings | Salient characteristics and potential applications |
|---|---|---|---|
| BIOMETRICS | |||
| Body weight | 5–10% weight loss from baseline | Indicator of poor prognosis | |
| Respiratory function | Sniff nasal inspiratory pressure (SNIP) | Reduction with disease progression or at presentation in respiratory onset disease | Non-invasive, effort-dependent Used clinically as a marker of respiratory function |
| Forced/slow vital capacity (FVC/SVC) | Non-invasive, effort-dependent, limited in bulbar weakness Used clinically as a marker of respiratory function and as criteria for trial entry | ||
| Phrenic nerve conduction study | More invasive and requires operator expertise but passive and objective | ||
| BIOFLUID BIOMARKERS | |||
| Genetic mutation-linked proteins | CSF | C9orf72 poly(GP) present pre-clinically; stable over time SOD1 protein levels stable over time | Pharmacodynamic potential for clinical trials |
| Blood | Level of SOD1 proteins in familial and sporadic disease poly(GP) repeats present in C9ORF72 disease TDP-43 mislocalized but longitudinal readouts variable | SOD1 used in current clinical trial Planned clinical trial specific to C9ORF72 mutations Potential as markers for gene-specific disease | |
| DNA methylation | Blood | Conflicting evidence in different cell types Global methylation shows promise | Potential, needs further investigation |
| Neurodegeneration | CSF | Neurofilament, increased levels of both NfL and pNfH, stable over time | Validated as diagnostic markers. Potential for prognostic and pharmacodynamic monitoring |
| Blood | Steady increased NfL over time pNfH levels variable | Potential use of NfL as a diagnostic and prognostic marker | |
| Urine | p75ECD increased and increases over time | Potential, needs further investigation | |
| Inflammation | CSF | Range of cytokines, chemokines, and immunological proteins up- and downregulated | Potential for diagnostic, prognostic, and disease progression; conflicting evidence currently |
| Blood | T regulatory (Treg) cells altered Conflicting results across studies for cytokines, CRP, chitotriosidase | Tregs potential use as prognostic marker, targeted in current phase II trial Other targets need further investigation | |
| Muscle denervation | Blood | Serum creatinine reduction Longitudinal changes in creatine kinase | Serum creatinine potential as prognostic marker Creatine kinase predicts slow vs. fast disease progression in panel in PRO-ACT database |
| miRNA | CSF | Differences in panels of miRNAs in patients Paucity of overlap across studies | Early potential for diagnostic, prognostic and pharmacodynamic; needs further investigation |
| Blood | As per CSF | ||
| Metabolism | CSF | Distinctive lipid profile identified through 1H-NMR and mass spectrometry Inconsistencies across studies | Potential for diagnostic and prognostic use Longitudinal studies needed |
| Blood | Carbohydrate and lipid metabolism markers contradictory, but larger study promising Glutamate results contradictory in response to treatment Serum albumin reduction | Carbohydrate and lipid metabolism markers associated with disease risk in large 20-year study Glutamine and glutamate need further investigation Serum albumin predicts slow vs. fast disease progression in panel in PRO-ACT database | |
| Urine | Limited studies on F2-isoprostane (8-iso-PGF2α), Collagen type 4, and lucosylgalactosyl hydroxylysine (glu-gal Hyl) | Potential, needs further investigation | |
| Oxidative stress | CSF | Raised levels of 4HNE, 3-nitrotyrosine NRF-2 pathway markers e.g., glutathione | Needs further investigation |
| Blood | 1Uric acid results contradictory, but larger study promising Ferritin, glutathione, 3-nitrotyrosine, 4HNE increase | Uric acid shows promise as prognostic in PRO-ACT database Other candidates need further investigation | |
| Urine | 8-hydroxy-2′-deoxyguanosine (8-OhdG) increased and increases over time | Potential, needs further investigation | |
| BIOMETRICS | |||
| Proteomic approach | CSF | Differential expression profiles identified e.g., cystatin C, chitinases, MCP-1, Subsequent failure of validation of individual markers | Potential as an unbiased investigation of novel markers but inconsistency across studies and validation of findings needed |
| IMAGING BIOMARKERS | |||
| Central nervous system Magnetic Resonance Imaging (MRI) and Magnetic Resonance Spectroscopy | Structural MRI | Focal atrophy Subcortical hyperintensities on T2 weighted, Proton Density weighted, and Fluid-Attenuated Inversion Recovery images Cortical hypointensities on T2-weighted, T2*-weighted, and Susceptibility Weighted Images | Employed in clinical practice to exclude mimics Cervical cord atrophy might have potential as a predictive and progression biomarker The potential use of cortical hypointensities as a biomarker is currently being explored |
| Diffusion tensor imaging | Fractional Anisotropy reduction Mean Diffusivity elevation | Potential use as a biomarker of is under investigation | |
| Magnetization transfer imaging | Possible reduction in Magnetization Transfer Imaging ratios | Conflicting evidence | |
| Functional magnetic resonance imaging | Cortical reorganization | Useful primarily to explore pathogenesis; might provide evidence of target engagement in clinical trials | |
| Proton magnetic resonance spectroscopy | N-acetylaspartate reduction | N-acetylaspartate has been suggested as a diagnostic and disease progression biomarker and has been employed in a clinical trial | |
| Peripheral nerve MRI | Diffusion tensor imaging | Fractional Anisotropy reduction | Potential use as a biomarker of disease progression |
| Muscle MRI and MRS | Anatomical imaging | Muscle volume reduction T2 hyperintensities | Potential use as a biomarker of disease progression |
| Phosphorus magnetic resonance spectroscopy | Conflicting evidence | Technique's potential as a marker of energy dysmetabolism has not yet been fully explored | |
| Positron emission tomography | Alterations in Fluoro-2-deoxy-2-D-glucose uptake Enhanced microglial activation Inhibitory inter-neuronopathy Alterations of serotoninegic neurotransmission Increased oxidative stress | Potential diagnostic biomarker and use in clinical trials to provide evidence of target engagement | |
| ELECTROPHYSIOLOGY BIOMARKERS | |||
| Motor unit number estimation | MUNE | Sensitive to disease progression Identifies pre-clinical LMN loss (MPS method) | Principally limited by operator-dependent variation in recording Newer methods (e.g., MScanFIT) expedite recording and overcome some technical limitations, but require dedicated software and evaluator training Potential for use diagnosis and follow-up Yet to be widely employed clinically |
| MUNIX | Multicenter and multi-operator reliability and sensitivity demonstrated Positive influence of evaluator training Superior sensitivity to early disease change vs. conventional methods Identifies pre-clinical LMN loss | Relatively time-efficient and tolerable for patients Dependent upon patient cooperation as derived from muscle contraction Worldwide evaluation in clinical trials Commercially available | |
| Neurophysiological index | Increased distal motor latency and F-wave frequency Decreased CMAP amplitude Sensitive to disease change in 4 weeks, greater rate of decline vs. ALSFRS-R, CMAP amplitude, and FVC | Utilizes standard neurophysiological measures Previously employed in clinical trials Potential to reduce required trial duration Further investigation required | |
| Axonal excitability | Upregulation of persistent Na+ conductances Reduction of slow and fast K+ channel conductances Change with disease progression | Predictor for poor prognosis Specialist equipment Further investigation required | |
| Electrical impedance myography | Multicentre demonstration of sensitivity to disease progression Applicable to bulbar musculature | Simple technique requiring limited patient cooperation or operator training Potential to reduce required sample size Further investigation into diagnostic utility and technique optimization required | |
| Transcranial magnetic stimulation | Reduced short-interval intracortical inhibition, cortical silent-period duration, and resting motor threshold Increased intracortical facilitation and motor evoked potential Discriminates ALS from mimics | Specialist equipment/software Further multicenter investigation confirming diagnostic utility and evaluating longitudinal potential required | |
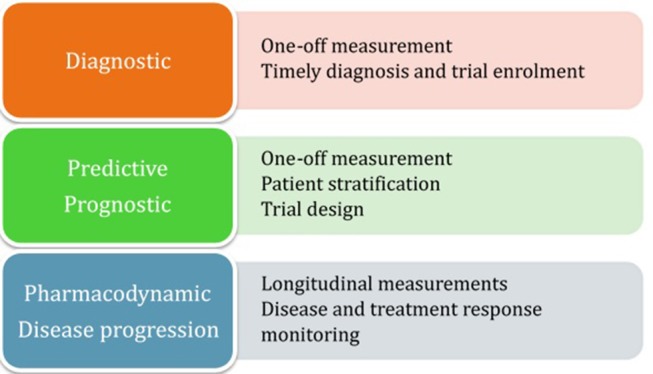
Diagnostic Biomarkers
ALS patients may initially present with subtle signs and symptoms and it has been shown that, on average, there is a 12-month period between symptom onset and neurological diagnosis (2). Current thinking is that there is pathological propagation of the disease through mechanisms such as axonal transmission of misfolded protein e.g., pTDP-43 [associated with diffusion tensor imaging (DTI)], abnormal RNA processing, “prion-like” spread, and cell-cell spread of dipeptide repeat proteins (3–8). It is hoped that by hastening the diagnosis future treatments will limit or halt progression, before patients are established on this progressive pathological course and before they suffer notable weakness and attrition of motor neuron numbers. A valid diagnostic biomarker will help guide the clinical diagnostic process at an early stage when signs are localized and subtle. This would allow for timely treatment and trial enrolment (Figure 1). Diagnosis for enrolment in trials is often based on the El-Escorial criteria which allows for a label of ALS-probable, lab-supported. Currently, this is based on evidence of active and chronic denervation on the electromyogram (EMG), together with the absence of other investigation findings that may suggest another pathological process. Further biomarkers may add to this laboratory support for more accurate enrolment and stratification. Ultimately this stratification may form the basis for a new classification system.
Figure 1.
Summary of biomarker categorization.
Prognostic and Predictive Biomarkers
ALS is a heterogeneous condition with variability in site of onset, extra-motor involvement and rate of progression. Typical survival is 2–5 years, but life expectancy can range from several months to over 10 years. This heterogeneity is also seen when patients are investigated at a genetic level, and at post-mortem. It makes sense therefore to design clinical trials with this in mind: a subgroup of patients may be shown to benefit from a novel treatment when statistical analysis is not confounded by population heterogeneity. Additionally, if variability is decreased then sample-size can also be reduced, lowering the time and cost of clinical trials. A good prognostic biomarker will be useful in stratifying patients for better trial design by broadly distinguishing between disease sub-groups. Predictive biomarkers are similar one-off measurements. However, they represent the chance of predicting a response to a particular treatment rather than the prognostic natural course of the disease.
Pharmacodynamic and Disease Progression Biomarkers
Clinical trial endpoints typically involve measures such as survival and the revised ALS functional rating scale (ALSFRS-R), given that improvement in motor function and survival in a progressive disease are the ultimate outcomes being sought. Such outcomes may need to be monitored for several years before a conclusion can be drawn, which is an expensive process. Pharmacodynamic biomarkers reliably change in response to treatment, and such markers would ensure that an experimental drug is having the desired effect on the pre-clinically identified therapeutic pathway. This could curtail ineffective therapeutic interventions at an early stage. Similarly, disease progression markers represent serial measures that change as the disease worsens, in the absence of treatment. This can provide another objective measure and time-saving approach to randomized control trial design.
Systemic Prognostic Biomarkers
Body Weight
An important facet of ALS management entails keeping weight records, prompt insertion of gastrostomy and prescription of nutritional supplements. Malnutrition (defined by a reduction in BMI or a >5% loss in premorbid weight) has a multifactorial adverse effect on life expectancy in ALS, in part due to neurotoxicity (9), and has been shown to give a 7.7-fold increased risk of death across a group of ALS patients at various time-points in the disease course (10). At time of diagnosis, 5% weight loss or more has been shown to be an independent adverse prognostic biomarker for survival (11). Therefore, patient stratification for trial entry, at any point in the disease course, should take into consideration the percentage of weight loss at baseline.
Respiratory Function
Clinicians rely on patient-reported symptoms of respiratory insufficiency, such as orthopnea, early morning headache, interrupted sleep, daytime somnolence, reduced appetite, and results of respiratory function tests to assess the need for non-invasive ventilation (NIV), which has been shown to improve survival and quality of life in ALS patients (12). Several tests exist and they can be classified according to the time they take, how invasive they are, and whether they require patient volition. Tests such as vital capacity (VC), sniff nasal inspiratory pressure (SNIP), peak cough flow (PCF), maximal static inspiratory and expiratory mouth pressures (MIP and MEP) take a snapshot of respiratory function, but can be confounded by poor technique secondary to non-respiratory muscle weakness and cognitive dysfunction. Overnight sleep studies and transcutaneous carbon dioxide monitoring are passive tests. Tests involving phrenic nerve stimulation—phrenic nerve conduction studies (PNCS) and twitch trans-diaphragmatic pressure (Tw Pdi) are more invasive and complex as they require electrophysiology practitioners, but are objective and non-volitional.
Measures of VC, forced and slow, are widely used due to clinical availability and published validation (13, 14). In a recent study comparing tests as predictive for mortality or NIV usage, Polkey et al. concluded that, despite good sensitivity, decline in vital capacity only occurs 12 months before these endpoints. Furthermore, for prognostic time intervals beyond 3 months, the cut-off value for poor prognosis was >80% predicted, which is the clinically defined normal range, therefore making it an invalid biomarker for trial stratification. A better measure, they argue, would be Tw Pdi or SNIP (15). As Tw Pdi is considered more invasive and complex, SNIP therefore has better potential as a biomarker in clinical practice. This is supported by another study that investigated the ability of respiratory tests to predict the need for NIV over the following 3 month period and found significant reduction in SNIP values in patients going on to require NIV (16). Although 3 months is not long enough for a stratification tool, it strengthens SNIP as a predictive tool. Lending further support to SNIP as a prognostic biomarker, an Italian research team concluded that SNIP measurements at baseline represent an excellent predictor for mortality or tracheostomy within 1 year of follow-up (17).
Sniff nasal testing confers an additional benefit in that it does not rely on the patient being able to form a tight mouth seal around a device, therefore making it better in patients with bulbar weakness (18). It does not completely alleviate the problem however, as upper airway collapse and inability to completely close the mouth also affects SNIP readings to a degree (19). Jenkins et al. also raise concern about using volitional measures for this reason. They concluded from a large prospective study that PNCS to measure diaphragmatic compound muscle action potential (CMAP) has merit as a biomarker as it correlates well with ALSFRS-R, SNIP and FVC, and, after a period of practitioner familiarity, it is as reliable as normal nerve conduction studies and no more difficult to execute (20).
In addition to LMN weakness affecting the respiratory muscles, hypotonic, and weak upper airway muscles contribute to an obstructive picture, and there are central factors contributing to respiratory insufficiency with bulbar, motor, and extra-motor pathways involved. Dysfunctional breathing due to abnormalities in these pathways leads to overnight hypoxia and hypercapnia (21). Clinically, sleep studies are typically reserved for patients who are symptomatic or have fallen below a threshold on screening tests such as VC. They are more cumbersome for patients, and time and resource intensive, which reduces their utility as a biomarker. However, one longitudinal study demonstrated the prognostic value of assessing for obstructive sleep apnea, with mean survival being shorter in patients with a higher apnea/hypopnea index. Interestingly SNIP correlated with this measure (22).
Screening tests for respiratory insufficiency are sensitive tools and each modality has its advantages and disadvantages. As a balance in relation to ease of technique, serial measurements, time, and expertise needed, and predictive power, SNIP stands out as a biomarker that could help in defining prognosis as well as the potential for sensitivity to change from therapeutic interventions. The exception is patients with severe bulbar or cognitive dysfunction and in those patients an electrophysiological modality could be of benefit.
Cerebrospinal Fluid (CSF) Biomarkers
CSF is a useful biofluid for analysis due to the direct proximity with the brain and spinal cord. It is an ultrafiltrate of plasma [although there are CSF homeostatic mechanisms which, for example, maintain ion concentrations that are different to plasma concentrations (23)]. Thus, protein levels in the CSF are considerably less compared to plasma, making analysis likely to be representative of central nervous system (CNS) activity.
Neurofilament Proteins
The most promising CSF biomarkers identified to date are neurofilament proteins, a cytoskeletal component of neurons that have been shown to accumulate following axonal damage and degeneration and can be measured in CSF (24, 25). Consisting of three subunits, the two of interest are phosphorylated neurofilament heavy chain (pNfH) and neurofilament light chain (NfL). A substantial body of evidence supports neurofilament levels as a diagnostic element (26–30). Both subunits have been validated in one multi-center study as diagnostic biomarkers (29) and pNfH alone in another (31). These studies address the standardization needed by using carefully designed standard operating procedures (SOPs) for sample collection and processing, and checking consistency of neurofilament levels within patient samples and between centers.
Additional marker utility is still to be validated, although many studies provide supporting evidence. A longitudinal study comparing ALS patients with disease and healthy controls found higher NfL levels in ALS patients and higher levels were associated with worse prognosis (32). Similar results were found in a large cohort study but, when analyzing their longitudinal data, they found that only 67% of ALS patients had higher levels at subsequent time points, with some patients having decreasing values over time. This latter group had a higher baseline value suggesting that a plateau of CSF neurofilament levels is reached once the rate of neuronal death has peaked (33). Another study found that NfL (particularly blood-derived) was fairly stable over time, providing a potential pharmacodynamic monitoring tool, and provided further support for CSF NfL as a prognostic marker for patient stratification (34). The authors also found high correlation between serum and CSF NfL, useful as serial blood tests are easier to obtain than serial CSF samples. Furthermore, there is evidence that CSF NfL correlates to disease subtypes, with those with increased UMN burden (32) or more rapid rates of disease progression, independent of age, showing higher baseline levels (35).
Finally, a meta-analysis correlating pNfH with the ALSFRS-R and disease duration demonstrated a significant negative association (36). Validation efforts would therefore be useful for prognostic, disease progression and pharmacodynamic purposes.
Tau
The tau protein stabilizes neuronal microtubules. Phosphorylated tangles, with tau as the major constituent, are seen in Alzheimer's disease, and ALS when associated with TDP-FTD. Raised total-tau has been reported in the CSF of ALS patients (37, 38), but no difference was found in another study (39) and there was failure to replicate this quantification in a multi-center, standardized collection analysis (31). Additionally, with no studies of tau showing correlation with disease severity or progression, neurofilament is currently the better marker of neuroaxonal degeneration.
TAR DNA-Binding protein (TDP-43)
Neuronal and glial inclusions of TDP-43 have been implicated in the pathogenesis of sALS and the linked fronto-temporal dementia (FTD) (40) but not SOD1-ALS (superoxide dismutase-1 mutation) (41). Subsequent studies have found elevated TDP-43 levels in the CSF of ALS patients as compared to healthy and neurological controls with neurodegenerative or neuroinflammatory disease (42–44), and higher in levels in ALS than in FTD (45). However, diagnostic accuracy was not demonstrated and a study by Feneberg et al. suggested that as serum concentrations are 200 times higher than CSF levels, as a biomarker, serum TDP-43 may be more appropriate and with pharmacodynamic utility (46). There is little available evidence for use as a marker of disease progression or prognosis and longitudinal studies are needed.
Proteomics
Another approach to identifying biomarkers is using liquid or gas chromatography (LC/GC) and mass spectrometry (MS) for proteomic analysis. An advantage is that it is an unbiased approach, yielding peaks for biochemical elements that may not have been previously recognized, and which may indicate a targetable, pathogenic pathway. Any protein identified must then be validated and the pathological pathway identified (47). A recent review outlined the problem with such approaches if they are not standardized: individual studies may find hundreds of proteins that differ between patients and controls, but there is only partial overlap between studies and attempts at replication have tended to fail (48). However, many proteins have been identified using these techniques and are currently undergoing further study.
Using LC-MS, Collins et al. demonstrated that the CSF proteome can be used to identify biomarkers and is relatively stable over time (49). In ALS, raised neurofilament, complement C3 and secretogranin I, and reduced cystatin C were amongst the top differentially expressed proteins identified. Additionally, using a machine learning approach they identified and used four classifier proteins—WD repeat-containing protein 63, amyloid-like protein 1, SPARC-like protein 1, and cell adhesion molecule 3—to differentiate between ALS, healthy controls and other neurological disease (83% sensitivity and 100% specificity).
Low levels of cystatin C in the CSF of ALS patients is well-recognized (50–52), although one study failed to find this difference (53). In a multi-center validation study, no difference between ALS patients and controls was seen (31) and there are conflicting data regarding the correlation with rate of disease progression (50, 51). The level of cystatin C has however been shown to correlate with survival time in limb-onset ALS (51) which lends further weight to the argument for careful clinical phenotyping and the need for longitudinal studies.
Other biomarkers analyzed in this six-center analysis (31) were monocyte chemoattractant protein-1, progranulin, amyloid precursor protein and S100B. Of these, none demonstrated consistent change and some yielded conflicting results across the centers.
Chitotriosidase (CHIT1) was identified using a proteomic approach and levels were found to be significantly higher in ALS patients compared to controls (54, 55). A subsequent study using ELISA confirmed this and also found high expression in comparison to other neurodegenerative conditions, and that levels were correlated with progression rate and inversely correlated with disease duration (56). Immunohistochemistry (IHC) was then performed on post-mortem CNS tissue from ALS patients demonstrating CHIT-positive activated microglia and macrophages in the corticospinal tracts. The authors therefore tentatively concluded that CHIT may have a role as a diagnostic and prognostic marker. This is supported by a recent LC-MS longitudinal study which demonstrated CHIT1 and other chitinases, CHI3L1 and CHI3L2, correlate with disease progression and indeed pNfH levels (57).
Levels of glutamate receptor 4 (GRIA4) expression in the CSF were found to be increased in ALS patients and to negatively correlate with disease severity, suggesting an early over-expression. This fits with glutamate excitotoxicity as a factor in neuronal damage and suggests that anti-glutamate therapy, like riluzole, may be more effective earlier in the disease course (55).
Metabolomics
Like proteomics, an unbiased search can be done by performing LC/MS or proton-nuclear magnetic resonance (1H-NMR) on biofluids to identify metabolites that differ in quantity in ALS. One such 1H-NMR study demonstrated lower CSF levels of acetate and increased levels of pyruvate and ascorbate (an antioxidant and linked with glutamate-mediated excitotoxicity) when comparing the ALS group with non-neurodegenerative disease controls. Subsequent modeling using the 17 identified metabolites achieved a discrimination rate between ALS and controls of 81.6% (58). A subsequent study from the same group increased the validity of CSF metabolomic 1H-NMR spectroscopy as a means to discriminate, by testing their metabolite model on a validation cohort, achieving a sensitivity of 78.9% and specificity of 76.5% (59).
Another mass spectrometry approach investigated the CSF lipid profile of ALS patients (60). As discussed in the blood biomarker section, high lipid levels seem to confer survival benefit and, as the authors of this study explain, the brain composition is rich in lipids with many neuronal and systemic biological processes dependent on lipid homeostasis. They found that there was a distinct ALS lipidomic profile and, based on the baseline CSF analysis, they could provide a predictive model with 71% accuracy for disease progression thus providing a potential diagnostic and prognostic biomarker.
The review by Blasco et al. describes in more detail the large number of metabolites discovered and also the inconsistencies across the body of reported research (61). Longitudinal metabolomic studies with analysis of clinical data are scarcer, although one plasma analysis found that some metabolites did correlate with disease progression (62), and another demonstrated a distinctive plasma profile for patients with LMN disease, albeit only with a small sample size (63). There is promise and further work with pre-analytical and analytical SOPs is indicated.
Oxidative Stress Biomarkers
Oxidative stress is associated with ALS pathogenesis (64–66), and has potential for novel therapies, as supported by the Japanese and American FDA approval of the free radical scavenger edaravone in recent years. In health, superoxide dismutase 1 has an antioxidant role in converting superoxide free radicals into oxygen and hydrogen peroxide. SOD1-mutations are implicated in a proportion of sporadic and fALS cases through toxic gain of function (67). Misfolded SOD1 can be measured in the CSF; it has been demonstrated that there is no significant difference between SOD1 ALS patients and non-SOD1 patients and between all ALS patients and neurological controls (68, 69). The utility of measuring SOD1 protein levels in CSF is as a pharmacodynamic biomarker, as levels are stable in individual patients over time (69, 70) and antisense oligonucleotide (ASO) SOD1-lowering therapy is effective in rats (69). A phase I/II clinical trial is underway to determine whether ASO-therapy gives the same results in humans (NCT02623699). Furthermore, SOD1 ALS can be sub-classified based upon the specific mutation. This provides useful prognostic information for trial design: for example SOD1 A4V missense, the most common SOD1 disease-causing mutation in the United States, has a significantly worse prognosis compared to other mutations (71).
Other oxidative biomarkers that have been identified as raised in ALS patients are 8-oxodeoxyguanosine and 15-F(2t)-isoprostane in urine (72), 8-hydroxy-2′-deoxyguanosine (8OH2′dG) and 3-nitrotyrosine in CSF (73, 74), and 4-hydroxy-2,3-nonenal in serum and CSF (75). However, none are as yet validated for use in clinical trials.
The nuclear erythroid 2-related factor 2-antioxidant response element (Nrf2-ARE) is an important signaling pathway, shown to reduce oxidative stress and inflammation (76). By measuring markers of oxidative stress, it can be shown that novel therapeutics are having the desired preclinical and clinical effect on this pathway. For example, compound screening identified S[+]-apomorphine as an in-vivo inducer of Nrf2 in an ALS mouse model by measuring Nrf2 target genes, and as an attenuator of oxidative stress in patient fibroblasts (77). This therefore supports further exploration of Nrf2 activators, like S[+]-apomorphine, with measurable pharmacodynamic biomarkers.
Upregulated by Nrf2 activation, glutathione is another useful marker of oxidative stress, as it acts as a buffer for reactive oxygen species. Reduced serum levels have been shown when comparing ALS patients and controls (78). Measurable by in-vivo 1H-MRS, this and other metabolites are discussed further in the imaging section.
As a more general measure of the oxidative system, one study showed that ALS patients had reduced antioxidant capacity with increased advanced oxidation protein products, although interestingly bulbar-onset patients had a protein composition similar to controls (79). Another study demonstrated a higher CSF oxidation-reduction potential (ORP) in ALS patients, and a negative correlation with ALSFRS-R in spinal-onset patients, leading the authors to conclude that it may be a marker of disease progression (80). However, their case-control groups were ALS and non-neurodegenerative neurological controls and a more varied control group encompassing all neurological disease may lend further weight to their preliminary findings.
Biomarkers of Neuroinflammation
As well as measurable changes in antioxidants, immune and inflammatory mediators have a complex role in the pathophysiology of ALS. Whilst initial activation of microglia and astrocytes may be neuroprotective, a state of chronic activation tips the balance toward neurotoxicity, with up- and down-regulation of a wide variety of humoral and cellular factors (81). Mitchell et al. performed a multiplex ELISA to identify potential biomarker candidates in the CSF of ALS patients. They reported that the 5 cytokines with the greatest difference between ALS and controls were IL-10, IL-6, GM-CSF, IL-2, and IL-15 and when combined, gave a differentiation accuracy of 89% (82). Other differentiating factors that have been identified are CHIT-1 and C3, as discussed earlier, IL-17, bFGF, VEGF, MIP-1b, MIP-1α, MCP-1β, and IFN-γ (83), and follistatin, IL-1α, and kallikrein-5 (84).
Prediction of disease duration has also been proposed through multiplex analysis and immunoassays, with IL-9, IL-5, and IL-12 proving negative predictors and MIP-1β and G-CSF positive predictors (85). IFN-y has been shown to correlate with disease progression (83, 86), and bFGF, VEGF, and MIP-1α have been shown to correlate with longer disease duration (83) further demonstrating the homeostatic attempt of the immune system. This immune profiling provides promise for sub-typing ALS patients and combining identification of pathophysiological factors with discovery of potential therapeutic targets.
C9ORF72
The hexanucleotide repeat expansion associated with C9ORF72 disease causes accumulation of RNA foci and undergoes non-ATG (RAN) translation, forming C9RAN dipeptides (DPR). Toxicity is thought to be in part due to sequestration of RNA binding proteins (87). Like misfolded SOD1 protein, these DPRs are measurable in CSF (88). A cross-sectional study showed one of these, poly(GP), is detectable in the CSF of C9ORF72 ALS and FTD patients but not controls, and that levels are increased in patients pre-clinically (89). This concept was further explored longitudinally to show that DPR levels are stable over time, supporting their use as a pharmacodynamic biomarker (90). This latter study also demonstrated that poly(GP) levels are reduced with the use of ASOs in C9orf72 cell and mouse models. This provides promising proof-of-concept that a targeted approach to these RNA repeats can mitigate an important pathological process in this disease subtype; especially important for asymptomatic carriers. Indeed, a clinical trial is planned using anti-sense oligonucleotides to lower DPRs in human ALS patients with C9ORF72 mutations.
MicroRNAs (miRNAs)
Short, non-coding RNAs regulate gene expression by binding to mRNA, thereby reducing translation and promoting mRNA degradation. Specific miRNAs have been associated with neuronal cell identity, synaptic function and glial regulation, and neuroinflammation in ALS (91). Interestingly, miRNA biogenesis is linked to TDP-43 which, as described above, is a pathological hallmark of ALS. TDP-43 binding miRNAs are dysregulated in the CSF and serum of sALS patients (92). Several studies have demonstrated other specific miRNA changes in ALS CSF. For example, upregulation of miR-338-3p (93), and miR181a-5p and downregulation of miR21-5p and miR15b-5p (94). This latter study demonstrated a sensitivity of 90% and specificity of 87% when miRNA ratios were used to differentiate between ALS and healthy controls. Early potential for prognostic or pharmacodynamic biomarker properties can be seen in a murine model which identified CSF miR-218 as correlating with motor-neuron loss and also responsiveness to therapy.
Due to discrepancy between methods and the specific miRNAs identified, further validation efforts are required; a recent study attempted to do this through optimizing RNA extraction and small RNA sequencing (91). Similarly, studying larger, longitudinal cohorts, will hopefully allow correlation of potential miRNA biomarkers with clinical phenotype.
As mentioned above, identification of SOD1 and C9ORF72 mutations is used for ASO trial enrolment, and the respective protein levels as pharmacodynamic biomarkers. In terms of prognosis, certain mutations have been found to infer a different disease course. As examples, C9ORF72 carriers have a higher incidence of fronto-temporal dementia, the specific A4V SOD1 mutation carries a poor prognosis (95), and certain UNC13A single nucleotide variants have been associated with shorter survival and others with longer survival (96). However, data are conflicting and the clinical significance of most mutations is unclear, lending support to larger phenotype-genotype studies. These should be systematic, including patients with seemingly sporadic disease, to accurately reflect the burden of genetic mutation in the population. Interested readers are directed to the Project Mine Project (www.projectmine.com) and the recent review of Al Chalabi et al. on the topic (97).
Blood Biomarkers
Blood based biomarkers are a useful medium between central and peripheral damage in ALS. While some markers show a correlation with CSF markers, as transfer occurs between CSF and blood, other candidate markers arise from peripheral effects of ALS such as muscle denervation.
C9ORF72, SOD1, and TDP-43
As introduced above, downstream protein readouts linked to genetic mutations have been explored recently in response to current and planned clinical trials specific to SOD1 and C9ORF72 mutations. Although most studies have primary outcomes in CSF (89, 90, 98), SOD1 was reduced in leukocytes (99) but not erythrocytes (98, 99) in response to pyrimethamine treatment in SOD1 positive disease, and poly(GP) repeats were detected in peripheral blood mononuclear cell lysates in C9ORF72 positive disease, although levels were not compared to those in CSF (90).
In addition to mutation-specific disease, proteins linked to genetic mutations have been studied more broadly in sALS. For example, overall SOD1 levels are reported to be increased in leukocytes (100). The story for TDP-43 remains unclear; it is mislocalized to cytoplasmic fractions of circulating PBMCs in ALS cases (101), and although total TDP-43 level did not discriminate from controls in these cells (101, 102), increasing levels correlated with disease burden longitudinally (102). In plasma, total TDP-43 is increased in ALS, but longitudinal changes were variable between subjects (103) and in serum, TDP-43 levels were unchanged between disease states, with authors suggesting CSF TDP-43 is blood derived and not useful for ALS diagnosis (46).
DNA Methylation
DNA methylation, as a readout of epigenetic influence, has gained interest in the last decade. Issues surround DNA methylation levels being influenced by variability between cell types and by immune factors, thus confounding methylation as a specific marker for disease phenotype (104). However, increased methylation of different components has been reported widely in ALS. Increased global DNA methylation been detected in ALS blood in some studies (105, 106), but not in a smaller study of two SOD1 and two TARDBP carriers (107). In C9ORF72 linked disease, C9ORF72 itself (108, 109) or its promoter (110, 111) are hypermethylated, with C9ORF72 hypermethylation showing correlation with G4C2 repeat size (109, 111) and promoter hypermethylation linked to reduced RNA foci and dipeptide repeat protein aggregates in the brain (112). Additionally, an increase in DNA methylation age was associated with disease duration in C9ORF72 linked disease, with every 5-year increase in DNA methylation age correlating to age of onset 3.2 years earlier, and shorter disease length of 1.5 years. This finding fits with sporadic disease, where increased DNA methylation age was detected in four of five ALS-diagnosed monozygotic twins. In this study, although methylation patterns were most similar between twins, the changes in common across all with ALS implicated glutamate metabolism and the Golgi apparatus (113). Similarly in SOD1-linked disease, those with not-fully penetrant SOD1 mutations showed increased DNA methylation in comparison to asymptomatic/pauci-symptomatic individuals, and levels showed a positive correlation with disease duration (106).
Neurofilament Proteins
NfL levels in serum and CSF have been shown to be highly correlated (34). Blood NfL levels were shown to be significantly higher in ALS patients than healthy controls, and a high initial NfL level was a strong independent predictor of survival. However, levels remain steady over time (34) with high levels in early and later stage disease showing no correlation to El Escorial diagnostic categories (114). Hence, NfL appears to have utility as a diagnostic and prognostic marker, rather than a marker of disease progression.
pNfH has also been studied in blood, and correlates with CSF levels (115, 116). In a meta-analysis of two papers, the blood concentration of pNfH was non-significantly higher in ALS (36). One study showed an association between higher plasma pNfH concentrations and a faster disease progression, but this was only significant at 4 months of follow-up (117). Similarly, higher plasma and serum pNfH was associated with increased mortality over the 12 month follow-up period. The reliability of these results is limited by the small sample size and short follow-up period. A longitudinal study did not show a predictable trajectory of plasma NFH over time: levels increased, decreased, or remained steady as disease progressed (34). While a subgroup with fast progressing disease tended to start with higher pNfH levels which decreased over time, the rate of change could not be used to predict disease progression. Another study showed a tendency for pNfH levels to rise and then fall, but there was substantial variability between subjects (118).
Inflammatory Markers
Various blood markers of immune activity have been studied. One study measured levels of multiple different immune cells and surface markers in order to generate immune phenotypes for familial and sporadic ALS patients (119). They found that ALS patients had increased immune activity, and could be grouped into two distinct immune profiles. Profile 1 patients were reasonably similar to healthy volunteers, but Profile 2 patients had elevated levels of total leukocytes and mononuclear cells, as well as CD3+, CD4+, CD8+, CD4+CD28+, CD3+CD56+ T-cells, and CD8+CD45RA+ naïve T cells. Profile 2 was associated with younger age, familial ALS and significantly increased survival (a median of 344 weeks, vs. 184 weeks for Profile 1). Within profiles, different leukocyte phenotypes were found to influence survival; for example, Profile 1 patients with higher levels of PD-1+ CD4 T cells survived longer, whereas Profile 2 patients with more CD3+CD56+ T cells survived longer, but neither association held true in the other group. It is unclear whether the altered immune profile in ALS is related to the pathophysiology of the disease or a response to disease activity. There was no longitudinal sampling in this study, so it is unclear how the profiles may change over time, but this study shows they are likely useful for prognosis. Another study found that levels of leukocytes, monocytes and NK cells were increased in ALS patients, and that they increased over time. An increase in total leukocytes and neutrophils, and a decrease in CD4 T cells, were correlated with a decrease in ALSFRS-R (120).
T-regulatory cells (Treg) represent a promising biomarker candidate and a possible therapeutic target. These cells suppress various components of the immune response, including cytokine production and T lymphocyte proliferation. One study found that levels of CD4+CD25High Tregs were reduced in patients with ALS, and that the number of Tregs was inversely correlated with rate of disease progression (121). Another study found that the Tregs from ALS patients had reduced ability to suppress activity of T responder lymphocytes, and that Treg dysfunction was correlated with the rate of disease progression (122). These results support the use of Tregs as a prognostic biomarker. In the latter study, disease burden as measured by the Appel ALS score (AALS) at the time of venepuncture was correlated with Treg dysfunction, which implies a decrease in function over time. However, a longitudinal study is needed to confirm this.
Blood levels of cytokines have been studied widely, including tumor necrosis factor-α (TNF-α) (123–125) interleukin-1β (IL-1β), IL-2, IL-4, IL-5, IL-6, IL-8, IL-10, IL-12p70, and IL-13 which were reported to be increased, while interferon–γ (IFN-γ) was decreased in ALS patients in cross-sectional studies. However, cytokine levels did not change over the course of disease (123). In serum, IL-1β (78), IL-6 (78, 83, 126) IL-8 (60, 78), and IFN-γ (83, 86, 127) are also reported to be increased, whereas serum IL-5 levels are decreased. Serum IL-2 and IL-10 results have been less conclusive (78, 83). A recent meta-analysis (128) combining serum and plasma measurements from 25 studies found TNF-α, TNF-receptor 1, IL-6, IL-1β, IL-8, and VEGF were significantly elevated in ALS, but of note is that results for IL-1β, IL-6, and VEGF may have been skewed by one study. Products of complement activation are also increased in ALS patient blood samples; specifically C3b-alpha-chain in serum (129), and C5a (130, 131) and C5b-9 (131) in plasma, along with a wide range of complement factors in another plasma study (130).
Other inflammatory markers have shown varying results, such as C reactive protein (CRP), which showed no differences in plasma (132) or whole blood (60) at baseline. In serum, CRP was increased in ALS and did not associate with ALS risk or survival in one study (133), but correlated with ALSFRS-R and survival in another (134). Similarly, chitotriosidase, expressed by active tissue macrophages, was increased in dried blood spots of ALS patients compared to healthy individuals, and was higher in those with rapidly progressing disease (135). However, Steinacker et al. (56) found no change in chitotriosidase serum levels in ALS compared to controls in the same study in which CSF levels correlated with disease progression and severity.
Muscle Denervation Biomarkers
Lower serum creatinine in ALS has been reported, and although some studies have found levels differing by onset site (136) or gender (137) the majority link levels to prognosis (136–140). A recent analysis of trial data from over 1,200 people with ALS found strong longitudinal correlations between serum creatinine and ALSFRS-R score, muscle strength, and overall mortality, indicating that using serum creatinine in trials over 18 months in length would allow a reduction in sample size by 21.5% (141). Lending further support to this pathway as a useful biomarker of muscle denervation, serum creatine kinase (CK) is increased in plasma (132), and serum (140, 142) and correlates with survival in some studies (140, 142). This discrepancy may be attributed to differing rates of disease progression. Modeling of the PRO-ACT database showed those with slow disease progression had stable or slowly declining creatine kinase, whereas people with rapidly declining disease had quickly declining levels. Indeed, along with decreases in weight, alkaline phosphatase, and albumin, creatine kinase decline was able to predict slow vs. fast disease progression (143).
microRNA (miRNA)
Whole blood (93, 144), serum (145–149), and plasma (150, 151) sourced microRNAs have been studied as possible biomarkers, due to their role in regulating gene expression. In whole blood, six downregulated miRNAs and one upregulated miRNA were identified (144) and a later study confirmed upregulation of miR-338-3p in leukocytes and serum (as well as in CSF and spinal cord) (93). A plasma based study (151) found increased levels of hsa-miR-4649-5p and decreased levels of hsa-miR-4299 in ALS patients vs. controls, but found no significant trend over time. Similarly, a second plasma study identified steady upregulation of two different miRNAs longitudinally (150), one of which, miR-206, is also increased in serum (147).
Serum miR-206 was also increased in a study which reported an increase in miR-143-3p and decrease in miR-374b-5p compared to controls (148). Additionally, this longitudinal study reported that miR-206 levels remained steady, while miR-143-3p levels increased and miR-374b-5p levels decreased over time, and that riluzole had no effect on miRNA levels. Further studies identified different panels of miRNAs differentially expressed in ALS serum compared to controls (146, 149) and also to neurological disease controls (149), noting longitudinal changes in separate sets of miRNAs (149) and higher variability across sporadic disease (146) compared to familial cases. Interestingly, one study identified 30 downregulated miRNAs in ALS, 22 of which were also downregulated in presymptomatic ALS mutation carriers, with some showing a greater degree of downregulation after disease onset (145). MicroRNAs seem to have promise as biomarkers, but there is a lack of overlap in microRNAs identified across different study groups, and to date, little longitudinal evidence reported.
Metabolic Biomarkers
Markers of carbohydrate and lipid metabolism have been studied extensively, with contradictory results [reviewed in (152)] although dysregulation of these processes is clear. A large 20-year study in Sweden showed lower levels of serum glucose and higher levels of low-density lipoprotein cholesterol (LDL-C), apolipoprotein B (apoB), and apoB/apoA-I ratio during the 20 years before diagnosis, and increasing levels of LDL-C, high-density lipoprotein cholesterol (HDL-C), apoB and apoA-I in the 10 years before diagnosis, in 623 ALS patients. As such an increased risk of ALS was observed with increasing serum LDL-C, apoB, and apoB/apoA-I ratio, and high LDL-C/HDL-C and high apoB/apoA-I ratios, whereas high serum glucose was associated with lower ALS incidence (152).
A decrease in glutamine (153), and an increase in its metabolite glutamate (154), the principal excitatory neurotransmitter in the CNS have been identified in ALS plasma, with increased glutamate levels seen in males, those with spinal onset, and correlated with longer disease duration (155). Interestingly, Riluzole treatment had no effect on plasma glutamate (156) but decreased serum glutamate in another study (157) suggesting usefulness of this measure in response to therapies in serum.
A large 2014 study of 638 ALS patients showed the utility of serum albumin at diagnosis as a biomarker of survival, with levels decreased in ALS, better survival seen with increasing levels, and that albumin levels correlated with markers of inflammatory state (137). A more recent study of 42 ALS patients and 18 healthy controls also showed a decrease in plasma derived serum albumin in ALS regardless of cognitive impairment, but could not detect disease severity or survival time using albumin at one time-point alone (130). Most convincingly, longitudinal modeling of ALS from the PRO-ACT database (143) showed that albumin decline, was one of four factors able to predict disease progression rate.
Proteomics
While many groups have performed mass spectrometry analyses in blood (102, 154, 158–161), there is not often an overlap in the specific proteins identified and those identified require validation. However, pathways known to be dysregulated in ALS are implicated. For example, the largest study of 172 ALS patients and 50 healthy controls (154) identified a panel of 32 differentially expressed proteins, showing dysregulation of carbohydrate and lipid metabolism, mitochondrial function, and creatinine. A recent study in 42 ALS patients and 18 healthy controls showed downregulation of lipid/cholesterol, and coagulation pathways, inhibition of NO and ROS production in macrophages, and increases in acute phase response and the complement system (130).
Oxidative Stress Biomarkers
An increase in ferritin, suggesting iron misregulation which promotes oxidative stress, is present in plasma (132) and serum of ALS patients (85, 136, 162), with higher levels associated with poorer survival in some studies (123, 136, 162), but not all (85).
While excess uric acid is harmful, it is also a powerful antioxidant and so could be useful to combat the oxidative stress seen in ALS. In cross sectional studies, serum levels are decreased in comparison to healthy controls (163–166). Higher serum uric acid levels correlated with a moderately decreased risk of the future development of ALS (167), but its link to increased survival is less clear, showing positive results in one study (164), only for men (168), or not at all (165). However, a recent study of the PRO-ACT database including 1,736 ALS cases showed an 11% reduction in risk of death for every 1 mg/dl increase in serum uric acid (169). Uric acid levels have also shown promise in plasma, identifying ALS from neurological disease mimics with high sensitivity as part of a 32 metabolic panel biomarker set although levels were no different between groups alone (154).
Urine Biomarkers
The search for urinary biomarkers in ALS include small cross-sectional studies, often with contradictory results, such as the usefulness of urinary trace elements (170–172). Those showing promise include the oxidative stress marker 8-hydroxy deoxyguanosine (8-OHdG) a product of nuclear and mitochondrial DNA oxidation which was increased in ALS in cross-sectional studies (72, 74) and increased longitudinally over 9 months in ALS patients (2.9 ng/mg creatinine/year) but not in disease controls (74). F2-isoprostane (8-iso-PGF2α) is also increased in ALS patient urine (72), but the existence of an inflammation-induced pathway for F2-isoprostane generation in addition to lipid peroxidation (173) needs to be considered when interpreting results.
Collagen type 4 (174) and collagen metabolite glucosylgalactosyl hydroxylysine (glu-gal Hyl) (175) levels were decreased in people with ALS as compared to neurological disease controls and healthy individuals, levels were lower in people with longer duration of ALS symptoms in cross-sectional analysis, and correlated with decreased levels in skin (collagen type 4), but did not correlate with muscle power rating (174, 175).
More recently, an increase in the extracellular domain of neurotrophin receptor p75 (p75ECD) was reported in ALS patient urine (176–178), which increases longitudinally as disease progresses (2.3 ng/mg creatinine/year), and provides prognostic potential advantages over clinical parameters of disease onset and change in ALSFRS-R alone (178). These findings suggest that urinary p75ECD has potential for use as a prognostic and pharmacodynamic biomarker.
Imaging Biomarkers
Magnetic Resonance Imaging (MRI)
Magnetic resonance imaging (MRI) is an attractive candidate as a biomarker tool as it is non-invasive, relatively inexpensive, and does not involve ionizing radiation. The multi-modal nature of MR lends itself to the study of various anatomical and pathological changes and processes in vivo (179). There is a large body of published work in the context of ALS, predominantly focused on the brain, with fewer studies relating to the spinal cord, muscle, and peripheral nerve.
Central Nervous System
Conventional Anatomical Magnetic Resonance Imaging (MRI)
Focal cortical atrophy has been demonstrated in the precentral gyrus (180–182) (Figure 2), as well as in other motor and non-motor areas, including frontal (181), parietal (184), temporal (185), limbic (186, 187), thalamic (188), bulbar (189), and spinal regions (190). Precentral atrophy predominates in regions of the motor homunculus that correspond to areas most affected by disease (191), whilst frontal cortical atrophy is especially pronounced in patients with associated cognitive dysfunction (192) or fronto-temporal dementia (193). White matter atrophy has been demonstrated in the corticospinal tract (194), front-temporal (192), cerebellar, callosal, and occipital regions (195), but, overall, global atrophy tends to be mild (185).
Figure 2.

Motor cortical atrophy in a patient with ALS, more pronounced on left side (which correlated with the pattern of weakness clinically). Sequence: 3T, T1w IR, TR 8.4 ms, TE 3.9 ms, TI 1000, FOV 240 mm, Acq voxel 1 × 1 × 1 mm Recon matrix 0.94 × 0.94 × 1 mm. Segmentation algorithm according to Chuang et al. (183).
Atrophy is thought to be a surrogate of neuroaxonal loss (196, 197) and MRI studies have supported the concept that neurodegeneration in ALS is not confined to motor regions. However, volumetric analysis in isolation is not sufficiently sensitive at individual level and, at present, the role of conventional structural MRI in clinical practice is mainly for the exclusion of ALS mimics as part of routine diagnostic workup (198).
Longitudinal studies assessing primary motor cortex (191, 199), subcortical regions (186), and cervical spinal cord (189, 190) have demonstrated worsening atrophy over time, and that the rate of volume loss is greater in rapidly progressive patients, compared to slow progressors (199). Reduction of cervical spinal cord surface area has been shown to correlate with clinical measures of disability, for example ALSFRS-R scores (189), and cervical spinal cord volume decrease over 3 months was predictive of respiratory dysfunction in the subsequent year in one study (190). Cervical atrophy therefore may have potential as a predictive and progression biomarker.
Signal Changes
High signal may be seen in motor areas on T2-weighted, proton density, or fluid-attenuated inversion recovery (FLAIR) images (199–201), especially in the subcortical precentral white matter and in the posterior limb of the internal capsule. T2 signal change can reflect a number of different underlying mechanisms, for example, oedema, inflammation, demyelination, or, in ALS, most likely neuroaxonal loss or gliosis, either alone or in combination (202, 203), and is neither sensitive nor specific in ALS. T2 signal change in the corticospinal tracts does not appear to correlate well with clinical measures (200, 203).
Cortical hypointensities assessed both qualitatively and quantitatively, on T2-weighted (204), T2*-weighted (205), and susceptibility-weighted images (206) are thought to reflect reactive ferritin-laden microglia accumulating in the deep layers of the precentral gyrus (206, 207). Ferritin contains iron which is paramagnetic and alters T2* relaxation, leading to hypointensities on T2-weighted, T2*-weighted, and susceptibility-weighted images, a feature that increases with static magnetic field strength. Although these findings were not replicated by another study (208), and such changes appear rather non-specific since they have also been shown in healthy individuals, T2-weighted hypointensities do correlate with UMN signs in ALS patients (207, 209, 210) and can appear early in the disease process (190).
Diffusion Tensor Imaging (DTI)
Diffusion tensor imaging (DTI) exploits differences in local directionality of water diffusion to assess tissue architecture and is especially suited to the study of white matter tracts. Fractional anisotropy (FA) is a derived measure which can represent tract integrity. In ALS, FA reduction in the corticospinal tracts and corpus callosum is a consistent finding (211–214) which correlates with clinical measures of disease progression (190, 211, 215–217). Associated elevations in mean diffusivity (MD), a scalar measure representing total diffusion within a voxel, have been reported in a number of these studies (211, 218). Low FA has also been demonstrated in the cervical spinal cord (219, 220) and in extra-motor regions (217, 221, 222). Longitudinal reductions in FA over time have been shown in both motor and extra-motor areas (223, 224).
DTI has demonstrated widespread white matter tract damage supporting the concept of ALS as a multi-system disorder. Diagnostic sensitivity and specificity of 68 and 73%, respectively, has been reported (225). Recent work has applied DTI to create in vivo disease staging models, to probe hypotheses of pathophysiological spread in ALS (5, 226).
Combination of Structural MRI and DTI
Machine learning algorithms combining both volumetric gray matter and DTI measures have been reported to discriminate ALS patients from healthy controls with 86% sensitivity, 67% specificity, and 78% accuracy (227), and ALS patients from ALS-mimics with 92% sensitivity, 75% specificity, and 87% accuracy (228).
Magnetization Transfer Imaging (MTI)
Magnetization can undergo transfer between bound water, macromolecular groups and free MR-observable water. This interaction can be used to provide the tissue contrast exploited in Magnetization Transfer Imaging (MTI), often interpreted as a measure of myelin integrity or neuroaxonal damage. Reduced MTI ratios have been reported in the corticospinal tracts and extra-motor gray matter of patients with ALS compared to controls (229–231) although these findings were not replicated in one report (199).
Functional Magnetic Resonance Imaging (fMRI)
Blood oxygen level-dependent (BOLD) functional MRI (fMRI) can detect regions of neuronal and synaptic activation in response to experimental stimuli. A localized vascular response to energy use and demand causes “active” regions to receive an increased oxygenated blood supply, and the MR signal is differentially attenuated according to blood oxygenation level. Aspects of brain physiology can therefore be assessed, based on an assumption of neurovascular coupling. Cortical reorganization has been demonstrated in patients with ALS, with increased activation of contralateral and ipsilateral motor areas including sensorimotor cortex, supplementary motor areas, basal ganglia and cerebellum during motor tasks (232–235). Contralateral over-activation correlates with disease progression (236). Reduced activation has been observed in dorsolateral prefrontal cortex (235) and in other studies which investigated tongue movements in patients with bulbar dysfunction (237, 238). Longitudinal studies have demonstrated that increased sensorimotor cortical activation (perhaps attributable to loss of intracortical inhibition) is followed by decreased activation later (probably as motor neurons degenerate) (238). Contrasting results were obtained following motor imagery experiments. Increased activity was seen in patients compared with controls in one study (239), but reduced activity in another (240). In addition to an external stimuli-driven BOLD response, resting state abnormalities have been demonstrated (241). Patients have been shown to demonstrate abnormalities in cerebral regions associated with executive functions (242), and emotional (243, 244), sensory (245), and language (246) processing.
Magnetic Resonance Spectroscopy
Magnetic resonance spectroscopy (MRS) is a promising advanced MR technique which provides insights into tissue neurobiology through direct measurement of metabolites (Figure 3). Proton spectroscopy of the brain (1H-MRS) enables detection of the neuronal molecule N-acetylaspartate (NAA), the glial marker myoinositol (mI), choline-containing compounds (Cho), amino acids and neurotransmitters such as glutamate, glutamine, and gamma-aminobutyric acid (Glu, Gln, and GABA), and creatine, phosphocreatine, and glutathione (Cr, PCr, and GSH) which are compounds related to cellular bioenergetic and oxidative status. Brain 1H-MRS studies have demonstrated a widespread reduction in NAA correlating with UMN burden (247–249) in regions spanned by the pyramidal tract (247, 248, 250–265) and in other cortical and subcortical areas (266). NAA has been proposed as an objective indicator of UMN dysfunction and as a potential diagnostic biomarker: sensitivity and specificity of the NAA/Cho ratio have been reported to be 100% and 85% (267), and to be superior to anatomical MRI (268, 269), DTI (267), and transcranial magnetic stimulation (270). The combination of 1H-MRS and DTI to diagnose ALS yields a high positive likelihood ratio (6.20) and low negative likelihood ratio (0.08), with potentially useful sensitivity and specificity of 90 and 85%, respectively (271). Although publications assessing longitudinal NAA changes have reached inconsistent conclusions (272–274), NAA concentration has also been used as a marker of treatment response in a number of clinical trials (275–281).
Figure 3.

GSH spectrum (B) from medial parietal cortex (A) (MEGA-PRESS sequence, HERMES spectral editing). (B) Green line showing spectral edited GSH peak.
Total creatine (Cr and PCr) appears unchanged (248, 259, 282), but studies measuring Glu, mI, Cho, GABA, and GSH have produced conflicting results and, at present, it is unclear whether the concentration of these molecules is altered in ALS (255, 258, 259, 263, 264, 282).
As highlighted above, published findings from studies that utilize 1H-MRS have reported conflicting results at times. In addition to differences between study groups, MR system manufacturer, and spectroscopic analysis methodology, the basic acquisition technique can vary (e.g., echo-generation type, localization method, TR, TE), which may partially explain the lack of consensus. As with standard MRI, the relative contributions from different spectral resonances can be weighted by intrinsic factors such as proton density, T1-, and T2-relaxation rates for each of the metabolites. For 1H-MRS, to further our understanding and provide indications of pathophysiology, disease stage and potential therapeutic response, well-characterized and appropriately standardized 1H-MRS acquisition methodology is warranted.
Peripheral Nerve Imaging
In ALS, secondary effects on peripheral nerve are the least studied anatomical location with MRI, but the technique shows potential and has been investigated (283, 284). In a recent longitudinal study, the FA of tibial and peroneal nerve was shown to decrease with disease progression and to correlate with ALSFRS-R, showing potential as a biomarker of disease progression (285).
Muscle Imaging And Spectroscopy
Anterior horn cell denervation in ALS leads to secondary signal change and atrophy in muscles and nerves which can be assessed with MRI and potentially employed as a marker of disease progression. An early study showed reductions in the volume of the tongue in up to two-thirds of ALS patients (284). Tibialis anterior volume reduction and increased T2-relaxation times were observed in a longitudinal study of 11 patients (286) and correlated with clinical (maximal voluntary isometric contraction, MVIC) and electrophysiological (CMAP) measures. Limb muscle signal changes have been demonstrated in cross-sectional studies using qualitative observer assessment scales (283, 287). A more recent longitudinal whole-body muscle MRI assessment demonstrated semi-quantitative T2 changes in multiple body regions in ALS patients compared with controls, as well as associations with clinical power and MUNIX, and longitudinal increases signal changes in the tibialis anterior muscle over 4 months (288) (Figure 4).
Figure 4.
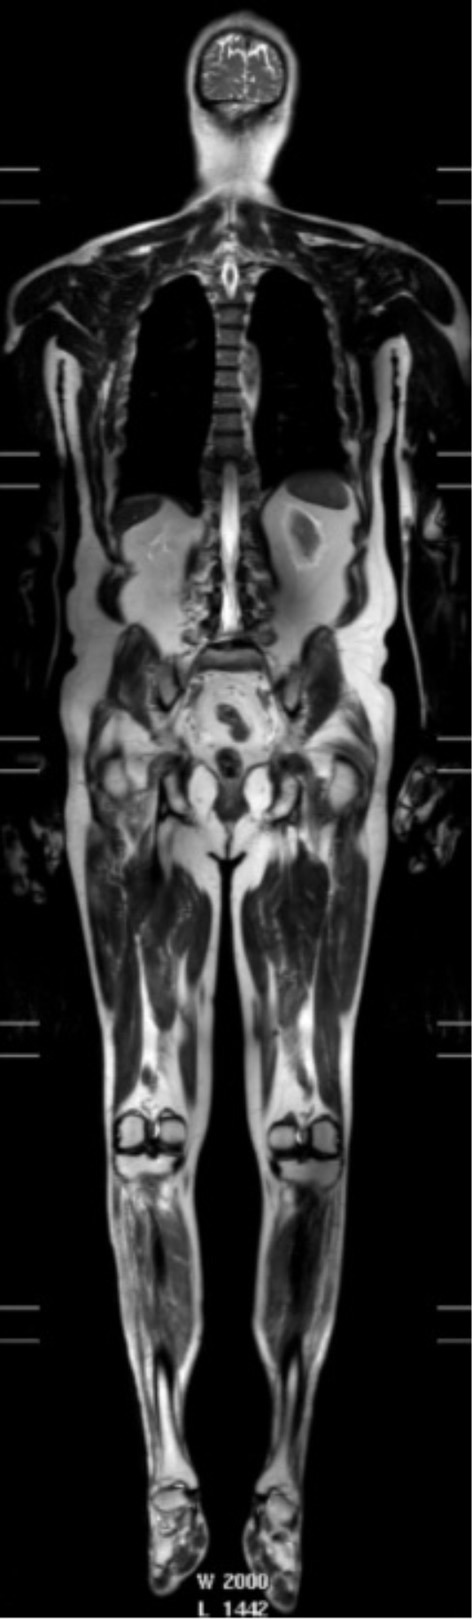
T2-weighted whole body image acquired in a patient: 3T, single shot TSE, TR 1107 ms, TE 80 ms, FOV 37 × 55 cm, voxel size 1.25 × 1.5 × 5 mm recon 0.78 × 0.78 × 5—used with permission from Jenkins et al. (288).
Metabolites related to cellular bioenergetics, such as adenosine triphosphate (ATP), PCr, and inorganic phosphate (Pi), as well as intracellular pH, have been measured in muscle using phosphorus-31 spectroscopy (31P-MRS); some studies have also employed dynamic protocols to assess PCr and pH variations during muscle contraction. PCr recovery (a parameter that correlates with mitochondrial oxidative capacity) was found to be prolonged in patients in one study (289) but was reported unchanged in another (290). Additionally, there appears to be a decreased drop in PCr upon muscular contraction in ALS patients, likely due to lack of available motor units to recruit (291), although other hypotheses, such as impaired central activation or even existence of ALS related primary muscular changes, have also been proposed (292, 293). The potential of 31P-MRS being a putative marker of energy dysmetabolism and disease progression has not yet been fully explored.
Positron Emission Tomography
Positron emission tomography (PET) is another imaging modality that has been employed primarily to investigate ALS pathophysiology, but has shown some potential as a diagnostic biomarker. Relatively fewer PET studies have been conducted in ALS, possibly because this modality, albeit non-invasive, involves exposure to ionizing radiation, and because radiotracer development is a complex process that requires a cyclotron and a specialized multidisciplinary team.
[18F]Fluoro-2-deoxy-2-D-glucose (FDG) PET measures cellular glucose uptake and can assess metabolic activity of brain regions. In ALS, decreased FDG uptake, a probable corollary of neurodegeneration, has been reported in the motor, premotor, and prefrontal cortices as well as in the basal ganglia (294, 295). Notably, the severity of hypometabolism in the front-temporal cortex was associated with cognitive decline and was predictive of shorter survival (296, 297). Interestingly, increased FDG uptake has also been reported in midbrain, pons, hippocampus, superior temporal gyrus, and cerebellum (295, 298). This could perhaps reflect neuronal hyperexcitability, adaptive cellular changes within metabolically active pathways, and/or astrocytic proliferation (295). These findings further corroborate the hypothesis that ALS-related dysmetabolism does not pertain exclusively to motor areas. In addition, midbrain hypermetabolism appears to be relatively specific to ALS and could potentially be valuable in the diagnostic workup of ALS patients (295, 297). Data on altered glucose uptake in the amygdala, parietal, and occipital cortices is more equivocal: lack of consensus could be due to differences either in study protocols or control groups (299).
Neuroinflammation is considered a potentially important contributor to the pathophysiological cascade in ALS and there have been ongoing efforts to develop immune-modifying therapeutics. In this context, assessment of in vivo microglial activation by PET could potentially be employed in clinical trials to provide evidence of target engagement and, possibly, to be used as a biomarker of disease response. Microglial activation can be investigated using radiotracers targeting the 18 kDa translocator protein (TSPO), also known as the peripheral-type benzodiazepine receptor, such as [11C]-(R)-PK11195 (a first generation tracer which is relatively non-specific and has a low signal to background ratio), [18F]-DPA-714, and [11C]-PBR28 (second generation, more specific tracers). TSPO is thought to be expressed specifically by activated microglia and astrocytes. These studies have shown enhanced microglial activation in primary and premotor cortices, prefrontal and temporal cortices, thalamus, and brainstem (300–303). Findings correlated with UMN burden and ALSFRS-R score and were associated with concomitant alterations of the glial marker mI and with DTI and spectroscopic measures of tissue damage (300, 302, 303).
Other work has provided further insights into ALS pathogenesis by showing evidence of inhibitory inter-neuronopathy (employing the GABA-A ligand, [11C]flumazenil) (304, 305), alteration of serotoninergic neurotransmission [using the radiotracer [11C]-WAY100635] (306), and increased oxidative stress [by [62Cu]-ATSM] (307).
In summary, whilst MR and PET studies have made important contributions toward elucidating disease mechanisms in vivo in patients with ALS, a fully validated biomarker sensitive and specific to disease change at individual level remains elusive. This represents an important area of need in the field (308).
Electrophysiology Biomarkers
Motor Unit Number Estimation (MUNE)
First developed in the 1970s, motor unit number estimation (MUNE) aims to provide a reproducible, quantitative measure of the number of functional motor units (309). Numerous MUNE methods have emerged predominantly based on the same underlying principle. First, a summated value for the total motor unit population within a nerve, the maximum compound muscle action potential (CMAP) amplitude, is obtained. This is then divided by a value representing the average single motor unit in that nerve, thus providing an estimate of motor unit number (309, 310).
MUNE calculations differ in the approach taken to measuring a typical single motor unit (311). For example, the original incremental method utilized the concept of different axons having differing excitation thresholds, with step-wise increases in stimulus intensity used to recruit additional discrete motor units (309). However, subsequent work determined that repeated presentation of the same stimulus may activate different motor axons with similar stimulation thresholds, thus resulting in CMAP changes not representative of single motor unit size, a phenomenon termed alternation (310). The multiple point stimulation (MPS) method (and later adaptations) attempted to circumvent this through stimulation at distinct points along the nerve in an attempt to sample different motor axons (312). Further developments included a multipoint incremental MUNE, combining incremental and MPS methods. This technique had a number of practical advantages over other methods in that it is simple, relatively rapid to perform (~5 min per muscle), well-tolerated (as multiple supramaximal stimuli are not performed), and does not require specialized equipment (313). Statistical approaches to the post-hoc analysis of data have also been proposed (314, 315).
Incremental, MPS and multipoint incremental MUNE methods have been reported as reliable and sensitive tools, correlating with and outperforming other functional clinical measures in demonstrating disease progression (249, 316). MPS has additionally been observed to identify preclinical LMN loss (249). Despite promising findings in familial (317) and sporadic cohorts (318), Poisson statistical methods were unable to account for the increased motor unit variability found in patients with ALS (318). Similarly, despite promising initial results (315), dissemination and validation of Bayesian statistical methods, which allow for sources of variability and uncertainty, has been limited by the technically intensive nature of the process (310, 319).
High-density MUNE utilizes a large number of electrode channels to resolve alternation, whilst also enabling the measurement of proximal and distal muscles, a feature not offered by most MUNE techniques (320). The requirement for specific equipment and software has precluded its widespread use thus far (319).
Recently, a novel MUNE method, MScanFIT MUNE (MScan), has been proposed, using detailed stimulus-response curves, or “CMAP scans,” which provide information on all motor units contributing to the CMAP, unlike other MUNE methods (321). Preliminary findings appear promising, demonstrating superior reproducibility, detection of motor unit loss, and disease progression compared to other MUNE methods (322).
Motor unit number index (MUNIX) applies a mathematical model based on the CMAP and surface EMG interference pattern at different voluntary activation levels (Figures 5B,C) (323). It overcomes a number of MUNE limitations by enabling fast (< 5 min/muscle), easy to perform measurements of any proximal or distal muscle from which a supramaximal CMAP can be elicited (324).
Figure 5.
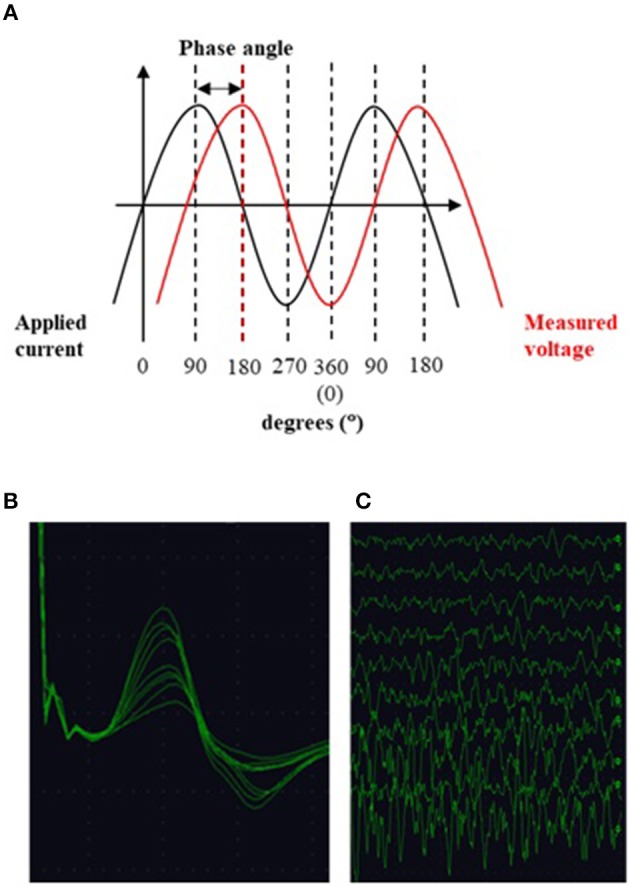
(A) EIM: alternating current is applied to the muscle and the ensuing voltage measured. The phase angle is a metric of tissue impedance and describes, in degrees, the angle of asynchrony between the two sinusoidal waveforms. (B) Multiple compound muscle action potentials recorded during the incremental motor unit number estimation technique. Each change in amplitude is thought to represent the addition of a new motor unit. (C) Surface interference patterns obtained during the motor unit number index technique. After recording a maximal compound muscle action potential the subject performs isometric contraction of the muscle of interest with increasing force. Parameters from these recordings are then used together with data from the CMAP to compute the index.
The sensitivity and reliability of MUNIX as a marker of disease progression in ALS was highlighted in a 15-month longitudinal multicenter study (325), with further work demonstrating a significant correlation between MUNIX and various MUNE techniques (27, 311, 326, 327). The importance of optimizing maximum CMAP amplitude during MUNIX recording has been emphasized (324). MUNIX measurement reliability has been shown to improve when employing a qualification process including face-to-face teaching and training, with ongoing support for evaluators (328).
Despite these promising results, some authors have suggested that values depend too heavily on CMAP amplitude to provide useful estimates of motor unit numbers (326). However, MUNIX has been shown to exhibit superior sensitivity to early change when compared to ALSFRS-R, manual muscle testing, and CMAP amplitude (329). Furthermore, a capacity to detect pre-symptomatic LMN loss has also been reported (330).
Multi-muscle global MUNIX scores have been investigated as a measure of multi-segment involvement (331), allowing more broad evaluation of motor unit loss and insight into the pattern of disease spread (330, 331). Such instruments have shown increased sensitivity to progression when compared to single-muscle MUNIX (331) and ALSFRS-R (325), reducing the time required to detect therapeutic change (325). This approach may, however, over-represent individual segments (331) and negative results have also been reported (332). Nonetheless, MUNIX offers interesting insights into disease progression and is undergoing worldwide evaluation in clinical trials.
Neurophysiological Index
The neurophysiological index (NI) has been proposed as a quantitative measure of peripheral disease burden in ALS patients. It collectively expresses changes observed during disease progression using standard neurophysiological measures: increases in distal motor latency and F-wave frequency, and a decrease in CMAP amplitude (333, 334). Previous studies report NI to be a reliable measure (335), differentiating fALS and sALS cohorts from healthy controls (336, 337). As a surrogate measure of disease progression, NI has displayed decline at a greater rate (41.9% at 6 months) than ALSFRS-R (18.4%), FVC (15.4%), and CMAP amplitude (25.5%) (316), with sensitivity to change in as little as 4 weeks (329). While further work is needed, the NI has been implemented in clinical trials and has been proposed as a method to expedite completion of future phase II trials (334).
Axonal Excitability
Axonal excitability measurement techniques allow non-invasive, in vivo assessment of the biophysical properties of peripheral axons (338). Employing threshold tracking methods allows sensitivity to changes in the membrane potential caused by activation of ion channels and electrogenic ion pumps (339). Indices used in threshold-tracking axonal excitability testing have provided information of pathological significance in ALS (338). Upregulation of persistent Na+ conductances and reduction of slow and fast K+ channel conductances have been demonstrated, with the net result being motor axonal hyperexcitability (340).
Axonal ion channel dysfunction has been observed in sALS and fALS cohorts, and supported by mouse models (341–343). Such membrane hyperexcitability is postulated to promote the generation of fasciculations and muscle cramps (341), with intra-axonal Ca2+ accumulation due to persistent Na+ influx implicated in the neurodegenerative process (338, 344). In keeping with this, changes in axonal excitability have been reported to correlate with more standard measures of motor axon degeneration, such as CMAP amplitude (345). A persistent Na+ conductance has been observed to be a predictor for shorter survival time and rapid inter-regional spread (346, 347). Changes in the pattern of abnormal membrane properties with disease progression have also been reported (341). Availability of the specialist hardware/software may limit uptake; however further study of longitudinal utility and test-retest reproducibility is warranted.
Electrical Impedance Myography (EIM)
Electrical impedance myography (EIM) provides a non-invasive, painless and quantitative method for the evaluation of muscle (Figure 5A). Low-intensity, high-frequency alternating electrical current is applied via surface electrodes to a muscle (or muscle group) of interest and the resulting surface voltages measured. The fundamental basis of EIM is that these recorded surface voltages reflect the conductive and capacitive properties of the underlying tissue, with disease-related changes in muscle morphology, such as muscle fiber atrophy, resulting in altered impedance values (348).
EIM is easy to perform, allows study of proximal and distal muscles, and requires limited subject cooperation and evaluator training (349, 350). It has been shown to be a highly reproducible tool, correlating with established electrophysiologic and functional measures of disease severity (351, 352). Multicenter data have reported sensitivity of EIM to disease progression, demonstrating its potential to expedite phase II clinical trials by reducing the sample size required to detect a treatment effect by more than 50% compared to the ALSFRS-R (353). Evidence for the utility of EIM in the diagnosis of ALS is preliminary, with further study required into its ability to distinguish ALS from other neuromuscular diseases (354).
More recently, EIM has been applied to the evaluation of bulbar dysfunction in ALS, an area of particular importance given the prognostic implications and lack of objective, quantifiable bedside measures of bulbar status (355, 356). Initial investigation has indicated tongue EIM to be a reliable technique, significantly correlating with tongue endurance and the ALSFRS-R bulbar subscore, and distinguishing healthy and diseased muscle (357, 358). Despite the encouraging results emerging principally from a single laboratory, EIM remains in need of development and optimization (355). Further interdisciplinary investigation would allow greater appreciation of the utility of EIM as an objective clinical measure.
Transcranial Magnetic Stimulation (TMS)
The diagnosis of ALS relies on identification of a combination of UMN and LMN features (359). Conventional electrophysiological techniques objectively assess LMN function. Evaluation of UMN involvement, however, remains solely based on clinical examination (360). Pioneered by Barker and colleagues (361), transcranial magnetic stimulation (TMS) is a non-invasive neurophysiological technique that assesses UMN functional integrity (360, 362). Differences in a number of TMS parameters, signifying a change in cortical excitability, have been identified as an early and specific feature in patients with both sporadic (337) and familial ALS (336). Such abnormalities, including reductions in short-interval intracortical inhibition and cortical silent period duration, and increases in intracortical facilitation and motor evoked potential amplitude (362), precede evidence of LMN dysfunction (363, 364), correlate with measures of peripheral disease burden (337), and relate to the pattern of disease spread (365). These findings provide pathological insight and lend support to the dying-forward hypothesis of ALS as a primary disease of the cortical motor neuron (360).
Recently developed, threshold tracking TMS (TTTMS) (337) has produced important results, including facilitating reliable differentiation of ALS from mimic disorders (366), an improvement in diagnostic sensitivity when compared to the Awaji-Shima criteria, and a reduced time to diagnosis (364). To date, this technique has been largely pioneered by a single group; if reproduced in other centers, the case for incorporation of TTTMS as an objective tool for assessing in future ALS diagnostic criteria would be strong. Evidence supporting the use of TMS as a biomarker assessing longitudinal change is, however, more preliminary and has employed traditional TMS techniques, with conflicting conclusions reached in the ability to monitor disease progression (367, 368), in addition to limited application in ALS therapeutic trials (369). This area remains an exciting field for the ALS community to develop over the coming years.
Conclusions
The breadth of the research outlined above is an indication of the efforts being undertaken to better understand the pathophysiology of ALS and to discover and validate biomarkers. Common themes occur in each described modality.
Biomarker exploration is dependent on replication. Using biofluid samples as an example, by using agreed SOPs for sample collection and for analysis, more robust conclusions can be drawn. In this way results from multiple centers can be pooled, providing sufficient statistical power to label a biomarker as useful or not. Once a potential biomarker is identified, it can be validated using round-robin or “reverse” round-robin methodology (31). If not successful then a consensus approach should be established to shift focus onto other promising markers. A similar approach in imaging has been established: The Neuroimaging Society in ALS (NiSALS) is a collaboration of neuroimaging scientists to discuss imaging methodologies in the disease as well as providing a solution to the challenge of analyzing MRI data from different sites and protocols (308). Successful validation from meticulous research methodology unfortunately then has the additional hurdle of becoming valid in clinical practice, wherein there is new heterogeneity, with reliance on healthcare professionals and hospital laboratories to collect and process samples in a comparable way.
Despite excellent attempts in each field, single useful biomarkers of ALS are as of yet out of reach. Combining biomarkers within a modality is a useful way to improve their utility, although this increases the risk of false positives, and the more biomarkers that are used the higher the sample number needed to confirm significance (370). Additionally, combining markers across modalities is a logical approach to maximize the strengths and sensitivities of each method. With the vast amount of data that this yields, particularly with the use of “-omic” approaches, machine learning techniques may yield the best combinations to maximize sensitivity and specificity. To this end, collaboration with bioinformaticians is essential.
Collaborative efforts like the Pooled Resource, Open access ALS clinical trials (PRO-ACT) database, provide researchers with a large body of well-categorized, longitudinal, patient data sets. This is especially useful in a relatively rare disease like ALS. It can be used to increase the statistical power during analysis of single biomarkers and for machine learning models. Prize4Life, a non-profit organization, asked for models that best predicted survival based on the PRO-ACT data. Algorithms and machine learning approaches were submitted and shown to improve prediction as compared to clinician assessments, and that these methods could reduce the cost of trials through a reduction in sample size. Additionally, this approach identified features previously unrecognized in their contribution to prediction such as creatine kinase, pulse and blood pressure (371). Other research groups continue to use the PRO-ACT data and have developed models of disease progression (372) and survival (373), and have clarified, for example, the predictive utility of urate as a biomarker (169). Whilst this exercise is undoubtedly useful, the importance of standardized collection and analysis methods remains.
The majority of studies explore diagnostic biomarkers, and many exist contrasting patients with healthy controls. However, if a patient with typical ALS is seen by a neurologist, particularly a neuromuscular specialist, then there is rarely a diagnostic dilemma. Ideally, comparisons should be made between ALS and those patients with disease mimics e.g., multifocal motor neuropathy with conduction block or monomelic amyotrophy. Moreover, as explained above, the survival and disability heterogeneity in ALS is large and to this end longitudinal studies assessing how the disease changes over time, measured through surrogate biomarkers, will provide improved information to better sub-classify patients and their prognosis and ensure trial success.
Future biomarker studies should aim to encapsulate all phenotype data as well as genetic and biological information to help stratification. The above point is well-explained by Benatar et al. (374) and furthermore they outline general points for researchers to be aware of in ALS longitudinal studies. During longitudinal follow-up, studies may enrich with slow-progressors, implying that conclusions that are drawn are not necessarily applicable for the whole population. Secondly, attempting to define disease onset is difficult, given that disease is likely to be active before presentation to healthcare; “baseline” comparisons are therefore not valid. However, most ALS progresses linearly and as such there is value in measuring fixed interval time points from the “recruitment baseline.”
Author Contributions
PS and NV conceived the concept and structure of the review. NV wrote the sections on introduction, cerebrospinal fluid and conclusion. SS and SM wrote the section on blood and SS wrote the section on urine. HM wrote the section on electrophysiology with oversight from JA. MS wrote the section on imaging with oversight from TJ and IW. All authors reviewed the final manuscript and offered critical feedback.
Conflict of Interest Statement
The authors declare that the research was conducted in the absence of any commercial or financial relationships that could be construed as a potential conflict of interest.
Acknowledgments
NV, SS, and PS are supported by the Motor Neurone Disease Association (AMBROSIA Programme, Grant no. MND005348). HM was supported by a bursary from the British Society for Clinical Neurophysiology. The work of all authors is supported by the NIHR Sheffield Biomedical Research Centre: Translational Neuroscience for Chronic Neurological Disorders and the NIHR Sheffield Clinical Research Facility. PS is supported as an NIHR Senior Investigator (Grant no. NF-S1-0617-10077).
Footnotes
Funding. NIHR Sheffield Biomedical Research Centre.
References
- 1.Woolley SC, Jonathan SK. Cognitive and behavioral impairment in amyotrophic lateral sclerosis. Phys Med Rehabil Clin N Am. (2008) 19:607–17. 10.1016/j.pmr.2008.04.002 [DOI] [PubMed] [Google Scholar]
- 2.Mitchell JD, Callagher P, Gardham J, Mitchell C, Dixon M, Addison-Jones R, et al. Timelines in the diagnostic evaluation of people with suspected amyotrophic lateral sclerosis (ALS)/motor neuron disease (MND)–a 20-year review: can we do better? Amyotroph Lateral Scler. (2010) 11:537–41. 10.3109/17482968.2010.495158 [DOI] [PubMed] [Google Scholar]
- 3.Fatima M, Tan R, Halliday GM, Kril JJ. Spread of pathology in amyotrophic lateral sclerosis: assessment of phosphorylated TDP-43 along axonal pathways. Acta Neuropathol Commun. (2015) 3:47. 10.1186/s40478-015-0226-y [DOI] [PMC free article] [PubMed] [Google Scholar]
- 4.Brettschneider J, Del Tredici K, Toledo JB, Robinson JL, Irwin DJ, Grossman M, et al. Stages of pTDP-43 pathology in amyotrophic lateral sclerosis. Ann Neurol. (2013) 74:20–38. 10.1002/ana.23937 [DOI] [PMC free article] [PubMed] [Google Scholar]
- 5.Kassubek J, Muller HP, Del Tredici K, Brettschneider J, Pinkhardt EH, Lule D, et al. Diffusion tensor imaging analysis of sequential spreading of disease in amyotrophic lateral sclerosis confirms patterns of TDP-43 pathology. Brain. (2014) 137(Pt. 6):1733–40. 10.1093/brain/awu090 [DOI] [PubMed] [Google Scholar]
- 6.Kanouchi T, Ohkubo T, Yokota T. Can regional spreading of amyotrophic lateral sclerosis motor symptoms be explained by prion-like propagation? J Neurol Neurosurg Psychiatry. (2012) 83:739–45. 10.1136/jnnp-2011-301826 [DOI] [PMC free article] [PubMed] [Google Scholar]
- 7.Ravits J, Appel S, Baloh RH, Barohn R, Rix Brooks B, Elman L, et al. Deciphering amyotrophic lateral sclerosis: what phenotype, neuropathology and genetics are telling us about pathogenesis. Amyotroph Lateral Scler Frontotemporal Degener. (2013) 14(Suppl. 1):5–18. 10.3109/21678421.2013.778548 [DOI] [PMC free article] [PubMed] [Google Scholar]
- 8.Westergard T, Jensen BK, Wen X, Cai J, Kropf E, Iacovitti L, et al. Cell-to-cell transmission of dipeptide repeat proteins linked to C9orf72-ALS/FTD. Cell Rep. (2016) 17:645–52. 10.1016/j.celrep.2016.09.032 [DOI] [PMC free article] [PubMed] [Google Scholar]
- 9.Spencer PS, Palmer VS. Interrelationships of undernutrition and neurotoxicity: food for thought and research attention. Neurotoxicology. (2012) 33:605–16. 10.1016/j.neuro.2012.02.015 [DOI] [PMC free article] [PubMed] [Google Scholar]
- 10.Desport JC, Preux PM, Truong TC, Vallat JM, Sautereau D, Couratier P. Nutritional status is a prognostic factor for survival in ALS patients. Neurology. (1999) 53:1059. 10.1212/WNL.53.5.1059 [DOI] [PubMed] [Google Scholar]
- 11.Marin B, Desport JC, Kajeu P, Jesus P, Nicolaud B, Nicol M, et al. Alteration of nutritional status at diagnosis is a prognostic factor for survival of amyotrophic lateral sclerosis patients. J Neurol Neurosurg Psychiatry. (2011) 82:628. 10.1136/jnnp.2010.211474 [DOI] [PubMed] [Google Scholar]
- 12.Bourke SC, Tomlinson M, Williams TL, Bullock RE, Shaw PJ, Gibson GJ. Effects of non-invasive ventilation on survival and quality of life in patients with amyotrophic lateral sclerosis: a randomised controlled trial. Lancet Neurol. (2006) 5:140–7. 10.1016/S1474-4422(05)70326-4 [DOI] [PubMed] [Google Scholar]
- 13.Andersen T, Sandnes A, Vollsæter M, Halvorsen T, Fondenes O, Røksund O. Measurement of vital capacity in amyotrophic lateral sclerosis – forced and slowly performed. Eur Resp J. (2015) 46(Suppl. 59):PA3730 10.1183/13993003.congress-2015.PA3730 [DOI] [Google Scholar]
- 14.Czaplinski A, Yen AA, Appel SH. Forced vital capacity (FVC) as an indicator of survival and disease progression in an ALS clinic population. J Neurol Neurosurg Psychiatry. (2006) 77:390–2. 10.1136/jnnp.2005.072660 [DOI] [PMC free article] [PubMed] [Google Scholar]
- 15.Polkey MI, Lyall RA, Yang K, Johnson E, Leigh PN, Moxham J. Respiratory muscle strength as a predictive biomarker for survival in amyotrophic lateral sclerosis. Am J Resp Crit Care Med. (2017) 195:86–95. 10.1164/rccm.201604-0848OC [DOI] [PMC free article] [PubMed] [Google Scholar]
- 16.Tilanus TBM, Groothuis JT, TenBroek-Pastoor JMC, Feuth TB, Heijdra YF, Slenders JPL, et al. The predictive value of respiratory function tests for non-invasive ventilation in amyotrophic lateral sclerosis. Respir Res. (2017) 18:144. 10.1186/s12931-017-0624-8 [DOI] [PMC free article] [PubMed] [Google Scholar]
- 17.Capozzo R, Quaranta VN, Pellegrini F, Fontana A, Copetti M, Carratu P, et al. Sniff nasal inspiratory pressure as a prognostic factor of tracheostomy or death in amyotrophic lateral sclerosis. J Neurol. (2015) 262:593–603. 10.1007/s00415-014-7613-3 [DOI] [PubMed] [Google Scholar]
- 18.Stefanutti D, Benoist M-R, Scheinmann P, Chaussain M, Fitting J-W. Usefulness of sniff nasal pressure in patients with neuromuscular or skeletal disorders. Am J Respir Crit Care Med. (2000) 162:1507–11. 10.1164/ajrccm.162.4.9910034 [DOI] [PubMed] [Google Scholar]
- 19.Chaudri MB, Liu C, Watson L, Jefferson D, Kinnear WJ. Sniff nasal inspiratory pressure as a marker of respiratory function in motor neuron disease. Eur Respir J. (2000) 15:539. 10.1034/j.1399-3003.2000.15.18.x [DOI] [PubMed] [Google Scholar]
- 20.Jenkins JAL, Sakamuri S, Katz JS, Forshew DA, Guion L, Moore D, et al. Phrenic nerve conduction studies as a biomarker of respiratory insufficiency in amyotrophic lateral sclerosis. Amyotroph Lateral Scler Frontotemporal Degener. (2016) 17:213–20. 10.3109/21678421.2015.1112406 [DOI] [PubMed] [Google Scholar]
- 21.Ahmed RM, Newcombe REA, Piper AJ, Lewis SJ, Yee BJ, Kiernan MC, et al. (2016). Sleep disorders and respiratory function in amyotrophic lateral sclerosis. Sleep Med Rev. 26:33–42. 10.1016/j.smrv.2015.05.007 [DOI] [PubMed] [Google Scholar]
- 22.Quaranta VN, Carratu P, Damiani MF, Dragonieri S, Capozzolo A, Cassano A, et al. The prognostic role of obstructive sleep apnea at the onset of amyotrophic lateral sclerosis. Neurodegen Dis. (2017) 17:14–21. 10.1159/000447560 [DOI] [PubMed] [Google Scholar]
- 23.Sakka L, Coll G, Chazal J. Anatomy and physiology of cerebrospinal fluid. Eur Ann Otorhinolaryngol Head Neck Dis. (2011) 128:309–16. 10.1016/j.anorl.2011.03.002 [DOI] [PubMed] [Google Scholar]
- 24.Rosengren LE, Karlsson JE, Karlsson JO, Persson LI, Wikkelso C. Patients with amyotrophic lateral sclerosis and other neurodegenerative diseases have increased levels of neurofilament protein in CSF. J Neurochem. (1996) 67:2013–8. 10.1046/j.1471-4159.1996.67052013.x [DOI] [PubMed] [Google Scholar]
- 25.Brettschneider J, Petzold A, Sussmuth SD, Ludolph AC, Tumani H. Axonal damage markers in cerebrospinal fluid are increased in ALS. Neurology. (2006) 66:852–6. 10.1212/01.wnl.0000203120.85850.54 [DOI] [PubMed] [Google Scholar]
- 26.Li D, Shen D, Tai H, Cui L. Neurofilaments in CSF as diagnostic biomarkers in motor neuron disease: a meta-analysis. Front Aging Neurosci. 8:290. 10.3389/fnagi.2016.00290 [DOI] [PMC free article] [PubMed] [Google Scholar]
- 27.Steinacker P, Feneberg E, Weishaupt J, Brettschneider J, Tumani H, Andersen PM, et al. Neurofilaments in the diagnosis of Moto neuron diseases: a prospective study on 455 patients. J Neurol Neurosurg Psychiatry. (2016) 87:12–20. 10.1136/jnnp-2015-311387 [DOI] [PubMed] [Google Scholar]
- 28.Posen K, De Schaepdryver M, Stubendorff B, Gille B, Muckova P, Wendler S, et al. Neurofilament markers for ALS correlate with extent of upper and lower motor neuron disease. Neurology. (2017) 88:2302–9. 10.1212/WNL.0000000000004029 [DOI] [PubMed] [Google Scholar]
- 29.Oeckl P, Jardel C, Salachas F, Lamari F, Andersen PM, Bowser R, et al. Multicenter validation of CSF neurofilaments as diagnostic biomarkers for ALS. Amyotroph Lateral Scler Frontotemporal Degener. (2016) 17:404–13. 10.3109/21678421.2016.1167913 [DOI] [PubMed] [Google Scholar]
- 30.Ganesalingam J, An J, Bowser R, Andersen PM, Shaw CE. pNfH is a promising biomarker for ALS. Amyotroph Lateral Scler Frontotemporal Degener. (2013) 14:146–9. 10.3109/21678421.2012.729596 [DOI] [PubMed] [Google Scholar]
- 31.Lehnert S, Costa J, de Carvalho M, Kirby J, Kuzma-Kozakiewicz M, Morelli C, et al. Multicentre quality control evaluation of different biomarker candidates for amyotrophic lateral sclerosis. Amyotrop Lateral Scler Frontotemporal Degener. (2014) 15:344–50. 10.3109/21678421.2014.884592 [DOI] [PubMed] [Google Scholar]
- 32.Gaiani A, Martinelli I, Bello L, Querin G, Puthenparampil M, Ruggero S, et al. Diagnostic and prognostic biomarkers in amyotrophic lateral sclerosis: neurofilament light chain levels in definite subtypes of disease. JAMA Neurol. (2017) 74:525–32. 10.1001/jamaneurol.2016.5398 [DOI] [PMC free article] [PubMed] [Google Scholar]
- 33.Skillbäck T, Mattsson N, Blennow K, Zetterberg H. Cerebrospinal fluid neurofilament light concentration in motor neuron disease and frontotemporal dementia predicts survival. Amyotroph Lateral Scler Frontotemporal Degener. (2017) 18:397–403. 10.1080/21678421.2017.1281962 [DOI] [PubMed] [Google Scholar]
- 34.Lu C-H, Macdonald-Wallis C, Gray E, Pearce N, Petzold A, Norgren N, et al. Neurofilament light chain: a prognostic biomarker in amyotrophic lateral sclerosis. Neurology. (2015) 84:2247–57. 10.1212/WNL.0000000000001642 [DOI] [PMC free article] [PubMed] [Google Scholar]
- 35.Tortelli R, Ruggieri M, Cortese R, D'Errico E, Capozzo R, Leo A, et al. Elevated cerebrospinal fluid neurofilament light levels in patients with amyotrophic lateral sclerosis: a possible marker of disease severity and progression. Eur J Neurol. (2012) 19:1561–7. 10.1111/j.1468-1331.2012.03777.x [DOI] [PubMed] [Google Scholar]
- 36.Xu Z, Henderson RD, David M, McCombe PA. Neurofilaments as biomarkers for amyotrophic lateral sclerosis: a systematic review and meta-analysis. PLoS ONE. (2016) 11:e0164625. 10.1371/journal.pone.0164625 [DOI] [PMC free article] [PubMed] [Google Scholar]
- 37.Bourbouli M, Rentzos M, Bougea A, Zouvelou V, Constantinides VC, Zaganas I, et al. Cerebrospinal fluid TAR DNA-binding protein 43 combined with tau proteins as a candidate biomarker for amyotrophic lateral sclerosis and frontotemporal dementia spectrum disorders. Dementia Geriatr Cogn Disord. (2017) 44:144–52. 10.1159/000478979 [DOI] [PubMed] [Google Scholar]
- 38.Wilke C, Deuschle C, Rattay TW, Maetzler W, Synofzik M. Total tau is increased, but phosphorylated tau not decreased, in cerebrospinal fluid in amyotrophic lateral sclerosis. Neurobiol Aging. (2015) 36:1072–4. 10.1016/j.neurobiolaging.2014.10.019 [DOI] [PubMed] [Google Scholar]
- 39.Paladino P, Valentino F, Piccoli T, Piccoli F, La Bella V. Cerebrospinal fluid tau protein is not a biological marker in amyotrophic lateral sclerosis. Eur J Neurol. (2009) 16:257–61. 10.1111/j.1468-1331.2008.02405.x [DOI] [PubMed] [Google Scholar]
- 40.Neumann M, Sampathu DM, Kwong LK, Truax AC, Micsenyi MC, Chou TT, et al. Ubiquitinated TDP-43 in frontotemporal lobar degeneration and amyotrophic lateral sclerosis. Science. (2006) 314:130–3. 10.1126/science.1134108 [DOI] [PubMed] [Google Scholar]
- 41.Mackenzie IR, Bigio EH, Ince PG, Geser F, Neumann M, Cairns NJ, et al. Pathological TDP-43 distinguishes sporadic amyotrophic lateral sclerosis from amyotrophic lateral sclerosis with SOD1 mutations. Ann Neurol. (2007) 61:427–34. 10.1002/ana.21147 [DOI] [PubMed] [Google Scholar]
- 42.Steinacker P, Hendrich C, Sperfeld AD, Jesse S, von Arnim CAF, Lehnert S, et al. TDP-43 in cerebrospinal fluid of patients with frontotemporal lobar degeneration and amyotrophic lateral sclerosis. Arch Neurol. (2008) 65:1481–7. 10.1001/archneur.65.11.1481 [DOI] [PMC free article] [PubMed] [Google Scholar]
- 43.Kasai T, Tokuda T, Ishigami N, Sasayama H, Foulds P, Mitchell DJ, et al. Increased TDP-43 protein in cerebrospinal fluid of patients with amyotrophic lateral sclerosis. Acta Neuropathol. (2009) 117:55–62. 10.1007/s00401-008-0456-1 [DOI] [PubMed] [Google Scholar]
- 44.Noto Y, Shibuya K, Sato Y, Kanai K, Misawa S, Sawai S, et al. Elevated CSF TDP-43 levels in amyotrophic lateral sclerosis: specificity, sensitivity, and a possible prognostic value. Amyotroph Lateral Scler. (2011) 12:140–3. 10.3109/17482968.2010.541263 [DOI] [PubMed] [Google Scholar]
- 45.Junttila A, Kuvaja M, Hartikainen P, Siloaho M, Helisalmi S, Moilanen V, et al. Cerebrospinal fluid TDP-43 in frontotemporal lobar degeneration and amyotrophic lateral sclerosis patients with and without the C9ORF72 hexanucleotide expansion. Dement Geriatr Cogn Disord Extra. (2016) 6:142–9. 10.1159/000444788 [DOI] [PMC free article] [PubMed] [Google Scholar]
- 46.Feneberg E, Steinacker P, Lehnert S, Schneider A, Walther P, Thal DR, et al. Limited role of free TDP-43 as a diagnostic tool in neurodegenerative diseases. Amyotroph Lateral Scler Frontotemporal Degener. (2014) 15:351–6. 10.3109/21678421.2014.905606 [DOI] [PubMed] [Google Scholar]
- 47.Krüger T, Lautenschläger J, Grosskreutz J, Rhode H. Proteome analysis of body fluids for amyotrophic lateral sclerosis biomarker discovery. Proteomics Clin Appl. (2013) 7:123–35. 10.1002/prca.201200067 [DOI] [PubMed] [Google Scholar]
- 48.Barschke P, Oeckl P, Steinacker P, Ludolph A, Otto M. Proteomic studies in the discovery of cerebrospinal fluid biomarkers for amyotrophic lateral sclerosis. Exp Rev Proteomics. (2017) 14:769–77. 10.1080/14789450.2017.1365602 [DOI] [PubMed] [Google Scholar]
- 49.Collins MA, An J, Hood BL, Conrads TP, Bowser RP. Label-Free LC-MS/MS proteomic analysis of cerebrospinal fluid identifies protein/pathway alterations and candidate biomarkers for amyotrophic lateral sclerosis. J Proteome Res. (2015) 14:4486–501. 10.1021/acs.jproteome.5b00804 [DOI] [PMC free article] [PubMed] [Google Scholar]
- 50.Chen X, Chen Y, Wei Q, Ou R, Cao B, Zhao B, et al. Assessment of a multiple biomarker panel for diagnosis of amyotrophic lateral sclerosis. BMC Neurol. (2016) 16:173. 10.1186/s12883-016-0689-x [DOI] [PMC free article] [PubMed] [Google Scholar]
- 51.Wilson ME, Boumaza I, Lacomis D, Bowser R. Cystatin C: a candidate biomarker for amyotrophic lateral sclerosis. PLoS ONE. (2010) 5:e15133. 10.1371/journal.pone.0015133 [DOI] [PMC free article] [PubMed] [Google Scholar]
- 52.Ryberg H, An J, Darko S, Lustgarten JL, Jaffa M, Gopalakrishnan V, et al. Discovery and verification of amyotrophic lateral sclerosis biomarkers by proteomics. Muscle Nerve. (2010) 42:104–11. 10.1002/mus.21683 [DOI] [PMC free article] [PubMed] [Google Scholar]
- 53.Ren Y, Zhu W, Cui F, Yang F, Chen Z, Ling L, et al. Measurement of cystatin C levels in the cerebrospinal fluid of patients with amyotrophic lateral sclerosis. Int J Clin Exp Pathol. (2015) 8:5419–26. Available online at: http://www.ijcep.com/ [PMC free article] [PubMed] [Google Scholar]
- 54.Varghese AM, Sharma A, Mishra P, Vijayalakshmi K, Harsha HC, Sathyaprabha TN, et al. Chitotriosidase - a putative biomarker for sporadic amyotrophic lateral sclerosis. Clin Proteomics. (2013) 10:19. 10.1186/1559-0275-10-19 [DOI] [PMC free article] [PubMed] [Google Scholar]
- 55.Chen Y, Liu X-H, Wu J-J, Ren H-M, Wang J, Ding Z-T, et al. Proteomic analysis of cerebrospinal fluid in amyotrophic lateral sclerosis. Exp Ther Med. (2016) 11:2095–106. 10.3892/etm.2016.3210 [DOI] [PMC free article] [PubMed] [Google Scholar]
- 56.Steinacker P, Verde F, Fang L, Feneberg E, Oeckl P, Roeber S, et al. Chitotriosidase (CHIT1) is increased in microglia and macrophages in spinal cord of amyotrophic lateral sclerosis and cerebrospinal fluid levels correlate with disease severity and progression. J Neurol Neurosurg Psychiatry. (2018) 89:239–47. 10.1136/jnnp-2017-317138 [DOI] [PubMed] [Google Scholar]
- 57.Thompson AG, Gray E, Thezenas ML, Charles PD, Evetts S, Hu MT, et al. Cerebrospinal fluid macrophage biomarkers in amyotrophic lateral sclerosis. Ann Neurol. (2018) 83:258–68. 10.1002/ana.25143 [DOI] [PubMed] [Google Scholar]
- 58.Blasco H, Corcia P, Moreau C, Veau S, Fournier C, Vourc'h P, et al. H-NMR-based metabolomic profiling of CSF in early amyotrophic lateral sclerosis. PLoS ONE. (2010) 5:e13223 10.1371/annotation/2c2f8fce-a5be-40a3-af8f-48f119b2c593 [DOI] [PMC free article] [PubMed] [Google Scholar]
- 59.Blasco H, Nadal-Desbarats L, Pradat P-F, Gordon PH, Antar C, Veyrat-Durebex C, et al. Untargeted 1H-NMR metabolomics in CSF. Neurology. (2014) 82:1167–74. 10.1212/WNL.0000000000000274 [DOI] [PubMed] [Google Scholar]
- 60.Blasco H, Veyrat-Durebex C, Bocca C, Patin F, Vourc'h P, Kouassi Nzoughet J, et al. Lipidomics reveals cerebrospinal-fluid signatures of ALS. Sci Rep. (2017) 7:17652. 10.1038/s41598-017-17389-9 [DOI] [PMC free article] [PubMed] [Google Scholar]
- 61.Blasco H, Patin F, Madji Hounoum B, Gordon PH, Vourc'h P, Andres CR, et al. Metabolomics in amyotrophic lateral sclerosis: how far can it take us? Eur J Neurol. (2016) 23:447–54. 10.1111/ene.12956 [DOI] [PubMed] [Google Scholar]
- 62.Kumar A, Bala L, Kalita J, Misra UK, Singh RL, Khetrapal CL, et al. Metabolomic analysis of serum by, H NMR spectroscopy in amyotrophic lateral sclerosis. Clin Chim Acta. (2010) 411:563–7. 10.1016/j.cca.2010.01.016 [DOI] [PubMed] [Google Scholar]
- 63.Rozen S, Cudkowicz ME, Bogdanov M, Matson WR, Kristal BS, Beecher C, et al. Metabolomic analysis and signatures in motor neuron disease. Metabolomics. (2005) 1:101–8. 10.1007/s11306-005-4810-1 [DOI] [PMC free article] [PubMed] [Google Scholar]
- 64.D'Amico E, Factor-Litvak P, Santella RM, Mitsumoto H. Clinical perspective of oxidative stress in sporadic amyotrophic lateral sclerosis. Free Radic Biol Med. (2013) 65:509–27. 10.1016/j.freeradbiomed.2013.06.029 [DOI] [PMC free article] [PubMed] [Google Scholar]
- 65.Simpson EP, Yen AA, Appel SH. Oxidative stress: a common denominator in the pathogenesis of amyotrophic lateral sclerosis. Curr Opin Rheumatol. (2003) 15:730–6. 10.1097/00002281-200311000-00008 [DOI] [PubMed] [Google Scholar]
- 66.Barber SC, Shaw PJ. Oxidative stress in ALS: key role in motor neuron injury and therapeutic target. Free Radic Biol Med. (2010) 48:629–41. 10.1016/j.freeradbiomed.2009.11.018 [DOI] [PubMed] [Google Scholar]
- 67.Rothstein JD. Current hypotheses for the underlying biology of amyotrophic lateral sclerosis. Ann Neurol. (2009) 65:S3–9. 10.1002/ana.21543 [DOI] [PubMed] [Google Scholar]
- 68.Zetterstrom P, Andersen PM, Brannstrom T, Marklund SL. Misfolded superoxide dismutase-1 in CSF from amyotrophic lateral sclerosis patients. J Neurochem. (2011) 117:91–9. 10.1111/j.1471-4159.2011.07177.x [DOI] [PubMed] [Google Scholar]
- 69.Winer L, Srinivasan D, Chun S, Lacomis D, Jaffa M, Fagan A, et al. SOD1 in cerebral spinal fluid as a pharmacodynamic marker for antisense oligonucleotide therapy. JAMA Neurol. (2013) 70:201–7. 10.1001/jamaneurol.2013.593 [DOI] [PMC free article] [PubMed] [Google Scholar]
- 70.Miller T, Pestronk A, David W, Rothstein J, Simpson E, Appel SH, Cudkowicz ME. A Phase I, randomised, first-in-human study of an antisense oligonucleotide directed against SOD1 delivered intrathecally in SOD1-familial ALS patients. Lancet Neurol. (2013) 12:435–42. 10.1016/S1474-4422(13)70061-9 [DOI] [PMC free article] [PubMed] [Google Scholar]
- 71.Bali T, Self W, Liu J, Siddique T, Wang LH, Bird TD, et al. Defining SOD1 ALS natural history to guide therapeutic clinical trial design. J Neurol Neurosurg Psychiatry. (2017) 88:99–105. 10.1136/jnnp-2016-313521 [DOI] [PMC free article] [PubMed] [Google Scholar]
- 72.Mitsumoto H, Santella RM, Liu X, Bogdanov M, Zipprich J, Wu HC, et al. Oxidative stress biomarkers in sporadic ALS. Amyotroph Lateral Scler. (2008) 9:177–83. 10.1080/17482960801933942 [DOI] [PMC free article] [PubMed] [Google Scholar]
- 73.Beal MF, Ferrante RJ, Browne SE, Matthews RT, Kowall NW, Brown R.H, Jr. Increased 3-nitrotyrosine in both sporadic and familial amyotrophic lateral sclerosis. Ann Neurol. (1997) 42:644–54. 10.1002/ana.410420416 [DOI] [PubMed] [Google Scholar]
- 74.Bogdanov M, Brown RH, Matson W, Smart R, Hayden D, O'Donnell H, et al. Increased oxidative damage to DNA in ALS patients. Free Radic Biol Med. (2000) 29:652–8. [DOI] [PubMed] [Google Scholar]
- 75.Simpson EP, Henry YK, Henkel JS, Smith RG, Appel SH. Increased lipid peroxidation in sera of ALS patients. Neurology. (2004) 62:1758–65. 10.1212/WNL.62.10.1758 [DOI] [PubMed] [Google Scholar]
- 76.Johnson DA, Johnson JA. Nrf2 -a therapeutic target for the treatment of neurodegenerative diseases. Free Radic Biol Med. (2015) 88(Pt. B):253–67. 10.1016/j.freeradbiomed.2015.07.147 [DOI] [PMC free article] [PubMed] [Google Scholar]
- 77.Mead RJ, Higginbottom A, Allen SP, Kirby J, Bennett E, Barber SC, et al. S[+] Apomorphine is a CNS penetrating activator of the Nrf2-ARE pathway with activity in mouse and patient fibroblast models of amyotrophic lateral sclerosis. Free Radic Biol Med. (2013) 61:438–52. 10.1016/j.freeradbiomed.2013.04.018 [DOI] [PMC free article] [PubMed] [Google Scholar]
- 78.Ehrhart J, Smith AJ, Kuzmin-Nichols N, Zesiewicz TA, Jahan I, Shytle RD, et al. Humoral factors in ALS patients during disease progression. J Neuroinflamm. (2015) 12:127. 10.1186/s12974-015-0350-4 [DOI] [PMC free article] [PubMed] [Google Scholar]
- 79.Siciliano G, Piazza S, Carlesi C, Del Corona A, Franzini M, Pompella A, et al. Antioxidant capacity and protein oxidation in cerebrospinal fluid of amyotrophic lateral sclerosis. J Neurol. (2007) 254:575–80. 10.1007/s00415-006-0301-1 [DOI] [PubMed] [Google Scholar]
- 80.Opacic M, Stevic Z, Bascarevic V, Zivic M, Spasic M, Spasojevic I. Can oxidation-reduction potential of cerebrospinal fluid be a monitoring biomarker in amyotrophic lateral sclerosis? Antioxid Redox Signal. (2017) 28:1570–5. 10.1089/ars.2017.7433 [DOI] [PubMed] [Google Scholar]
- 81.Malaspina A, Puentes F, Amor S. Disease origin and progression in amyotrophic lateral sclerosis: an immunology perspective. Int Immunol. (2015) 27:117–29. 10.1093/intimm/dxu099 [DOI] [PubMed] [Google Scholar]
- 82.Mitchell RM, Freeman WM, Randazzo WT, Stephens HE, Beard JL, Simmons Z, et al. A CSF biomarker panel for identification of patients with amyotrophic lateral sclerosis. Neurology. (2009) 72:14–9. 10.1212/01.wnl.0000333251.36681.a5 [DOI] [PubMed] [Google Scholar]
- 83.Guo J, Yang X, Gao L, Zang D. Evaluating the levels of CSF and serum factors in ALS. Brain Behav. (2017) 7:e00637. 10.1002/brb3.637 [DOI] [PMC free article] [PubMed] [Google Scholar]
- 84.Lind A-L, Wu D, Freyhult E, Bodolea C, Ekegren T, Larsson A, et al. A multiplex protein panel applied to cerebrospinal fluid reveals three new biomarker candidates in ALS but none in neuropathic pain patients. PLoS ONE. (2016) 11:e0149821. 10.1371/journal.pone.0149821 [DOI] [PMC free article] [PubMed] [Google Scholar]
- 85.Su XW, Clardy SL, Stephens HE, Simmons Z, Connor JR. Serum ferritin is elevated in amyotrophic lateral sclerosis patients. Amyotroph Lateral Scler Frontotemporal Degener. (2015) 16:102–7. 10.3109/21678421.2014.984723 [DOI] [PubMed] [Google Scholar]
- 86.Liu J, Gao L, Zang D. Elevated levels of IFN-γ in CSF and serum of patients with amyotrophic lateral sclerosis. PLoS ONE. (2015) 10:e0136937. 10.1145/2818302 [DOI] [PMC free article] [PubMed] [Google Scholar]
- 87.Cooper-Knock J, Walsh MJ, Higginbottom A, Robin Highley J, Dickman MJ, Edbauer D, et al. Sequestration of multiple RNA recognition motif-containing proteins by C9orf72 repeat expansions. Brain. (2014) 137(Pt. 7):2040–51. 10.1093/brain/awu120 [DOI] [PMC free article] [PubMed] [Google Scholar]
- 88.Su Z, Zhang Y, Gendron TF, Bauer PO, Chew J, Yang W-Y, et al. Discovery of a biomarker and lead small molecules to target r(GGGGCC)-associated defects in c9FTD/ALS. Neuron. (2014) 83:1043–50. 10.1016/j.neuron.2014.07.041 [DOI] [PMC free article] [PubMed] [Google Scholar]
- 89.Lehmer C, Oeckl P, Weishaupt JH, Volk AE, Diehl-Schmid J, Schroeter ML, et al. Poly-GP in cerebrospinal fluid links C9orf72-associated dipeptide repeat expression to the asymptomatic phase of ALS/FTD. EMBO Mol Med. (2017) 9:859–68. 10.15252/emmm.201607486 [DOI] [PMC free article] [PubMed] [Google Scholar]
- 90.Gendron TF, Chew J, Stankowski JN, Hayes LR, Zhang Y-J, Prudencio M, et al. Poly(GP) proteins are a useful pharmacodynamic marker for C9ORF72-associated amyotrophic lateral sclerosis. Sci Transl Med. 9:eaai7866. 10.1126/scitranslmed.aai7866 [DOI] [PMC free article] [PubMed] [Google Scholar]
- 91.Waller R, Wyles M, Heath PR, Kazoka M, Wollff H, Shaw PJ, et al. Small RNA sequencing of sporadic amyotrophic lateral sclerosis cerebrospinal fluid reveals differentially expressed miRNAs related to neural and glial activity. Front Neurosci. 11:731. 10.3389/fnins.2017.00731 [DOI] [PMC free article] [PubMed] [Google Scholar]
- 92.Freischmidt A, Müller K, Ludolph AC, Weishaupt JH. Systemic dysregulation of TDP-43 binding microRNAs in amyotrophic lateral sclerosis. Acta Neuropathol Commun. (2013) 1:42. 10.1186/2051-5960-1-42 [DOI] [PMC free article] [PubMed] [Google Scholar]
- 93.De Felice B, Annunziata A, Fiorentino G, Borra M, Biffali E, Coppola C, et al. miR-338-3p is over-expressed in blood, CFS, serum and spinal cord from sporadic amyotrophic lateral sclerosis patients. Neurogenetics. (2014) 15:243–53. 10.1007/s10048-014-0420-2 [DOI] [PubMed] [Google Scholar]
- 94.Benigni M, Ricci C, Jones AR, Giannini F, Al-Chalabi A, Battistini S. Identification of miRNAs as Potential biomarkers in cerebrospinal fluid from amyotrophic lateral sclerosis patients. Neuromol Med. (2016) 18:551–60. 10.1007/s12017-016-8396-8 [DOI] [PubMed] [Google Scholar]
- 95.Juneja T, Pericak-Vance MA, Laing NG, Dave S, Siddique T. Prognosis in familial amyotrophic lateral sclerosis: progression and survival in patients with glu100gly and ala4val mutations in Cu,Zn superoxide dismutase. Neurology. (1997) 48:55–7. 10.1212/WNL.48.1.55 [DOI] [PubMed] [Google Scholar]
- 96.Gaastra B, Shatunov A, Pulit S, Jones AR, Sproviero W, Gillett A, et al. Rare genetic variation in UNC13A may modify survival in amyotrophic lateral sclerosis. Amyotroph Lateral Scler Frontotemporal Degener. (2016) 17:593–9. 10.1080/21678421.2016.1213852 [DOI] [PMC free article] [PubMed] [Google Scholar]
- 97.Al-Chalabi A, van den Berg LH, Veldink J. Gene discovery in amyotrophic lateral sclerosis: implications for clinical management. Nat Rev Neurol. (2017) 13:96–104. 10.1038/nrneurol.2016.182 [DOI] [PubMed] [Google Scholar]
- 98.Lange DJ, Shahbazi M, Silani V, Ludolph AC, Weishaupt JH, Ajroud-Driss S, et al. Pyrimethamine significantly lowers cerebrospinal fluid Cu/Zn superoxide dismutase in amyotrophic lateral sclerosis patients with SOD1 mutations. Ann Neurol. (2017) 81:837–48. 10.1002/ana.24950 [DOI] [PMC free article] [PubMed] [Google Scholar]
- 99.Lange DJ, Andersen PM, Remanan R, Marklund S, Benjamin D. Pyrimethamine decreases levels of SOD1 in leukocytes and cerebrospinal fluid of ALS patients: a phase I pilot study. Amyotroph Lateral Scler Frontotemporal Degener. (2013) 14:199–204. 10.3109/17482968.2012.724074 [DOI] [PubMed] [Google Scholar]
- 100.Cereda C, Leoni E, Milani P, Pansarasa O, Mazzini G, Guareschi S, et al. Altered intracellular localization of SOD1 in leukocytes from patients with sporadic amyotrophic lateral sclerosis. PLoS ONE. (2013) 8:e75916. 10.1371/journal.pone.0075916 [DOI] [PMC free article] [PubMed] [Google Scholar]
- 101.De Marco G, Lupino E, Calvo A, Moglia C, Buccinna B, Grifoni S, et al. Cytoplasmic accumulation of TDP-43 in circulating lymphomonocytes of ALS patients with and without TARDBP mutations. Acta Neuropathol. (2011) 121:611–22. 10.1007/s00401-010-0786-7 [DOI] [PubMed] [Google Scholar]
- 102.Nardo G, Pozzi S, Pignataro M, Lauranzano E, Spano G, Garbelli S, et al. Amyotrophic lateral sclerosis multiprotein biomarkers in peripheral blood mononuclear cells. PLoS ONE. (2011) 6:e25545. 10.1371/journal.pone.0025545 [DOI] [PMC free article] [PubMed] [Google Scholar]
- 103.Verstraete E, Kuiperij HB, van Blitterswijk MM, Veldink JH, Schelhaas HJ, van den Berg LH, et al. TDP-43 plasma levels are higher in amyotrophic lateral sclerosis. Amyotroph Lateral Scler. (2012) 13:446–51. 10.3109/17482968.2012.703208 [DOI] [PubMed] [Google Scholar]
- 104.Houseman EA, Kim S, Kelsey KT, Wiencke JK. DNA methylation in whole blood: uses and challenges. Curr Environ Health Rep. (2015) 2:145–54. 10.1007/s40572-015-0050-3 [DOI] [PubMed] [Google Scholar]
- 105.Tremolizzo L, Messina P, Conti E, Sala G, Cecchi M, Airoldi L, et al. Whole-blood global DNA methylation is increased in amyotrophic lateral sclerosis independently of age of onset. Amyotroph Lateral Scler Frontotemporal Degener. (2014) 15:98–105. 10.3109/21678421.2013.851247 [DOI] [PubMed] [Google Scholar]
- 106.Coppedè F, Stoccoro A, Mosca L, Gallo R, Tarlarini C, Lunetta C, et al. Increase in DNA methylation in patients with amyotrophic lateral sclerosis carriers of not fully penetrant SOD1 mutations. Amyotroph Lateral Scler Frontotemporal Degener. (2018) 19:93–100. 10.1080/21678421.2017.1367401 [DOI] [PubMed] [Google Scholar]
- 107.Garton FC, Benyamin B, Zhao Q, Liu Z, Gratten J, Henders AK, et al. Whole exome sequencing and DNA methylation analysis in a clinical amyotrophic lateral sclerosis cohort. Mol Genet Genomic Med. (2017) 5:418–28. 10.1002/mgg3.302 [DOI] [PMC free article] [PubMed] [Google Scholar]
- 108.Fogh I, Lin K, Tiloca C, Rooney J, Gellera C, Diekstra FP, et al. Association of a locus in the CAMTA1 gene with survival in patients with sporadic amyotrophic lateral sclerosis. JAMA Neurol. (2016) 73:812–20. 10.1001/jamaneurol.2016.1114 [DOI] [PMC free article] [PubMed] [Google Scholar]
- 109.Xi Z, Zhang M, Bruni AC, Maletta RG, Colao R, Fratta P, et al. The C9orf72 repeat expansion itself is methylated in ALS and FTLD patients. Acta Neuropathol. (2015) 129:715–27. 10.1007/s00401-015-1401-8 [DOI] [PubMed] [Google Scholar]
- 110.Liu EY, Russ J, Wu K, Neal D, Suh E, McNally AG, et al. C9orf72 hypermethylation protects against repeat expansion-associated pathology in ALS/FTD. Acta Neuropathol. (2014) 128:525–41. 10.1007/s00401-014-1286-y [DOI] [PMC free article] [PubMed] [Google Scholar]
- 111.Gijselinck I, Van Mossevelde S, Van Der Zee J, Sieben A, Engelborghs S, De Bleecker J, et al. The C9orf72 repeat size correlates with onset age of disease, DNA methylation and transcriptional downregulation of the promoter. Mol Psychiatry. (2016) 21:1112–24. 10.1038/mp.2015.159 [DOI] [PMC free article] [PubMed] [Google Scholar]
- 112.Liu C, Jiang R, Yi X, Zhu W, Bu B. Role of diffusion tensor imaging or magnetic resonance spectroscopy in the diagnosis and disability assessment of amyotrophic lateral sclerosis. J Neurol Sci. (2015) 348:206–10. 10.1016/j.jns.2014.12.004 [DOI] [PubMed] [Google Scholar]
- 113.Young PE, Jew SK, Buckland ME, Pamphlett R, Suter CM. Epigenetic differences between monozygotic twins discordant for amyotrophic lateral sclerosis (ALS) provide clues to disease pathogenesis. PLoS ONE. (2017) 12:1–19. 10.1371/journal.pone.0182638 [DOI] [PMC free article] [PubMed] [Google Scholar]
- 114.Feneberg E, Oeckl P, Steinacker P, Verde F, Barro C, Van Damme P, et al. Multicenter evaluation of neurofilaments in early symptom onset amyotrophic lateral sclerosis. Neurology. (2018) 90:e22–30. 10.1212/WNL.0000000000004761 [DOI] [PubMed] [Google Scholar]
- 115.Ganesalingam J, An J, Shaw CE, Shaw G, Lacomis D, Bowser R. Combination of neurofilament heavy chain and complement C3 as CSF biomarkers for ALS. J Neurochem. (2011) 117:528–37. 10.1111/j.1471-4159.2011.07224.x [DOI] [PMC free article] [PubMed] [Google Scholar]
- 116.De Schaepdryver M, Jeromin A, Gille B, Claeys KG, Herbst V, Brix B, et al. Comparison of elevated phosphorylated neurofilament heavy chains in serum and cerebrospinal fluid of patients with amyotrophic lateral sclerosis. J Neurol Neurosurg Psychiatry. (2017) 89:367–73. 10.1136/jnnp-2017-316605 [DOI] [PubMed] [Google Scholar]
- 117.Gendron T, Bieniek K, Zhang Y-J, Jansen-West K, Ash P, Caulfield T, et al. Antisense transcripts of the expanded C9ORF72 hexanucleotide repeat form nuclear RNA foci and undergo repeat-associated non-ATG translation in c9FTD/ALS. Acta Neuropathol. (2013) 126:829–44. 10.1007/s00401-013-1192-8 [DOI] [PMC free article] [PubMed] [Google Scholar]
- 118.McCombe PA, Pfluger C, Singh P, Lim CYH, Airey C, Henderson RD. Serial measurements of phosphorylated neurofilament-heavy in the serum of subjects with amyotrophic lateral sclerosis. J Neurol Sci. (2015) 353:122–9. 10.1016/j.jns.2015.04.032 [DOI] [PubMed] [Google Scholar]
- 119.Gustafson MP, Staff NP, Bornschlegl S, Butler GW, Maas L, Kazamel M, et al. Comprehensive immune profiling reveals substantial immune system alterations in a subset of patients with amyotrophic lateral sclerosis. PLoS ONE. (2017) 12:e0182002. 10.1371/journal.pone.0182002 [DOI] [PMC free article] [PubMed] [Google Scholar]
- 120.Murdock BJ, Zhou T, Kashlan SR, Little RJ, Goutman SA, Feldman EL. Correlation of peripheral immunity with rapid amyotrophic lateral sclerosis progression. JAMA Neurol. (2017) 74:1446–54. 10.1001/jamaneurol.2017.2255 [DOI] [PMC free article] [PubMed] [Google Scholar]
- 121.Henkel JS, Beers DR, Wen S, Rivera AL, Toennis KM, Appel JE, et al. Regulatory T-lymphocytes mediate amyotrophic lateral sclerosis progression and survival. EMBO Mol Med. (2013) 5:64–79. 10.1002/emmm.201201544 [DOI] [PMC free article] [PubMed] [Google Scholar]
- 122.Beers DR, Henkel JS, Zhao W, Wang J, Huang A, Wen S, et al. Endogenous regulatory T lymphocytes ameliorate amyotrophic lateral sclerosis in mice and correlate with disease progression in patients with amyotrophic lateral sclerosis. Brain. (2011) 134:1293–314. 10.1093/brain/awr074 [DOI] [PMC free article] [PubMed] [Google Scholar]
- 123.Lu CH, Allen K, Oei F, Leoni E, Kuhle J, Tree T, et al. Systemic inflammatory response and neuromuscular involvement in amyotrophic lateral sclerosis. Neurol Neuroimmunol Neuroinflamm. (2016) 3:e244. 10.1212/NXI.0000000000000244 [DOI] [PMC free article] [PubMed] [Google Scholar]
- 124.Poloni M, Facchetti D, Mai R, Micheli A, Agnoletti L, Francolini G, et al. Circulating levels of tumour necrosis factor-alpha and its soluble receptors are increased in the blood of patients with amyotrophic lateral sclerosis. Neurosci Lett. (2000) 287:211–4. 10.1016/S0304-3940(00)01177-0 [DOI] [PubMed] [Google Scholar]
- 125.Cereda C, Baiocchi C, Bongioanni P, Cova E, Guareschi S, Metelli MR, et al. TNF and sTNFR1/2 plasma levels in ALS patients. J Neuroimmunol. (2008) 194:123–31. 10.1016/j.jneuroim.2007.10.028 [DOI] [PubMed] [Google Scholar]
- 126.Blasco H, Garcon G, Patin F, Veyrat-Durebex C, Boyer J, Devos D, et al. Panel of oxidative stress and inflammatory biomarkers in ALS: a Pilot Study. Can J Neurol Sci. (2017) 44:90–5. 10.1017/cjn.2016.284 [DOI] [PubMed] [Google Scholar]
- 127.Babu GN, Kumar A, Chandra R, Puri SK, Kalita J, Misra UK. Elevated inflammatory markers in a group of amyotrophic lateral sclerosis patients from northern India. Neurochem Res. (2008) 33:1145–9. 10.1007/s11064-007-9564-x [DOI] [PubMed] [Google Scholar]
- 128.Hu Y, Cao C, Qin X-Y, Yu Y, Yuan J, Zhao Y, et al. Increased peripheral blood inflammatory cytokine levels in amyotrophic lateral sclerosis: a meta-analysis study. Sci Rep. (2017) 7:9094. 10.1038/s41598-017-09097-1 [DOI] [PMC free article] [PubMed] [Google Scholar]
- 129.Goldknopf IL, Sheta EA, Bryson J, Folsom B, Wilson C, Duty J, et al. Complement C3c and related protein biomarkers in amyotrophic lateral sclerosis and Parkinson's disease. Biochem Biophys Res Commun. (2006) 342:1034–9. 10.1016/j.bbrc.2006.02.051 [DOI] [PubMed] [Google Scholar]
- 130.Xu Z, Lee A, Nouwens A, David Henderson R, Ann Mccombe P. Mass spectrometry analysis of plasma from amyotrophic lateral sclerosis and control subjects. Amyotroph Lateral Scler Frontotemporal Degener. (2018) 19:362–76. 10.1080/21678421.2018.1433689 [DOI] [PubMed] [Google Scholar]
- 131.Mantovani S, Gordon R, Macmaw JK, Pfluger CMM, Henderson RD, Noakes PG, et al. Elevation of the terminal complement activation products C5a and C5b-9 in ALS patient blood. J Neuroimmunol. (2014) 276:213–8. 10.1016/j.jneuroim.2014.09.005 [DOI] [PubMed] [Google Scholar]
- 132.Hou L, Jiao B, Xiao T, Zhou L, Zhou Z, Du J, et al. Screening of SOD1, FUS and TARDBP genes in patients with amyotrophic lateral sclerosis in central-southern China. Sci Rep. (2016) 6:32478. 10.1038/srep32478 [DOI] [PMC free article] [PubMed] [Google Scholar]
- 133.Nagel G, Peter RS, Rosenbohm A, Koenig W, Dupuis L, Rothenbacher D, et al. Adipokines, C-reactive protein and amyotrophic lateral sclerosis - results from a population- based ALS registry in Germany. Sci Rep. (2017) 7:4374. 10.1038/s41598-017-04706-5 [DOI] [PMC free article] [PubMed] [Google Scholar]
- 134.Lunetta C, Lizio A, Maestri E, Sansone VA, Mora G, Miller RG, et al. Serum C-reactive protein as a prognostic biomarker in amyotrophic lateral sclerosis. JAMA Neurol. (2017) 74:660–7. 10.1001/jamaneurol.2016.6179 [DOI] [PMC free article] [PubMed] [Google Scholar]
- 135.Pagliardini V, Pagliardini S, Corrado L, Lucenti A, Panigati L, Bersano E, et al. Chitotriosidase and lysosomal enzymes as potential biomarkers of disease progression in amyotrophic lateral sclerosis: a survey clinic-based study. J Neurol Sci. (2015) 348:245–50. 10.1016/j.jns.2014.12.016 [DOI] [PubMed] [Google Scholar]
- 136.Patin F, Corcia P, Madji Hounoum B, Veyrat-Durebex C, Respaud E, Piver E, et al. Biological follow-up in amyotrophic lateral sclerosis: decrease in creatinine levels and increase in ferritin levels predict poor prognosis. Eur J Neurol. (2015) 22:1385–90. 10.1111/ene.12754 [DOI] [PubMed] [Google Scholar]
- 137.Chiò A, Calvo A, Bovio G, Canosa A, Bertuzzo D, Galmozzi F, et al. Amyotrophic lateral sclerosis outcome measures and the role of albumin and creatinine: a population-based study. JAMA Neurol. (2014) 71:1134–42. 10.1001/jamaneurol.2014.1129 [DOI] [PubMed] [Google Scholar]
- 138.Bozik ME, Mitsumoto H, Brooks BR, Rudnicki SA, Moore DH, Zhang B, et al. A post hoc analysis of subgroup outcomes and creatinine in the phase III clinical trial (EMPOWER) of dexpramipexole in ALS. Amyotroph Lateral Scler Frontotemporal Degener. (2014) 15:406–13. 10.3109/21678421.2014.943672 [DOI] [PubMed] [Google Scholar]
- 139.Ikeda K, Hirayama T, Takazawa T, Kawabe K, Iwasaki Y. Relationships between disease progression and serum levels of lipid, urate, creatinine and ferritin in Japanese patients with amyotrophic lateral sclerosis: a cross-sectional study. Intern Med. (2012) 51:1501–8. 10.2169/internalmedicine.51.7465 [DOI] [PubMed] [Google Scholar]
- 140.Rafiq MK, Lee E, Bradburn M, McDermott CJ, Shaw PJ. Creatine kinase enzyme level correlates positively with serum creatinine and lean body mass, and is a prognostic factor for survival in amyotrophic lateral sclerosis. Eur J Neurol. (2016) 23:1071–8. 10.1111/ene.12995 [DOI] [PubMed] [Google Scholar]
- 141.van Eijk RPA, Eijkemans MJC, Ferguson TA, Nikolakopoulos S, Veldink JH, van den Berg LH. Monitoring disease progression with plasma creatinine in amyotrophic lateral sclerosis clinical trials. J Neurol Neurosurg Psychiatry. (2017) 89:156–61. 10.1136/jnnp-2017-317077 [DOI] [PMC free article] [PubMed] [Google Scholar]
- 142.Tai H, Cui L, Guan Y, Liu M, Li X, Shen D, et al. Correlation of creatine kinase levels with clinical features and survival in amyotrophic lateral sclerosis. Front Neurol. (2017) 8:322. 10.3389/fneur.2017.00322 [DOI] [PMC free article] [PubMed] [Google Scholar]
- 143.Ong ML, Tan PF, Holbrook JD. Predicting functional decline and survival in amyotrophic lateral sclerosis. PLoS ONE. (2017) 12:e0174925. 10.1371/journal.pone.0174925 [DOI] [PMC free article] [PubMed] [Google Scholar]
- 144.De Felice B, Guida M, Guida M, Coppola C, De Mieri G, Cotrufo R. A miRNA signature in leukocytes from sporadic amyotrophic lateral sclerosis. Gene. (2012) 508:35–40. 10.1016/j.gene.2012.07.058 [DOI] [PubMed] [Google Scholar]
- 145.Freischmidt A, Muller K, Zondler L, Weydt P, Volk AE, Bozic AL, et al. Serum microRNAs in patients with genetic amyotrophic lateral sclerosis and pre-manifest mutation carriers. Brain. (2014) 137(Pt. 11):2938–50. 10.1093/brain/awu249 [DOI] [PubMed] [Google Scholar]
- 146.Freischmidt A, Muller K, Zondler L, Weydt P, Mayer B, von Arnim CAF, et al. Serum microRNAs in sporadic amyotrophic lateral sclerosis. Neurobiol Aging. (2015) 36:e15–20. 10.1016/j.neurobiolaging.2015.06.003 [DOI] [PubMed] [Google Scholar]
- 147.Toivonen JM, Manzano R, Olivan S, Zaragoza P, Garcia-Redondo A, Osta R. MicroRNA-206: a potential circulating biomarker candidate for amyotrophic lateral sclerosis. PLoS ONE. (2014) 9:e89065. 10.1371/journal.pone.0089065 [DOI] [PMC free article] [PubMed] [Google Scholar]
- 148.Waller R, Goodall EF, Milo M, Cooper-Knock J, Da Costa M, Hobson E, et al. Serum miRNAs miR-206, 143-3p and 374b-5p as potential biomarkers for amyotrophic lateral sclerosis (ALS). Neurobiol Aging. (2017) 55:123–31. 10.1016/j.neurobiolaging.2017.03.027 [DOI] [PMC free article] [PubMed] [Google Scholar]
- 149.Raheja R, Regev K, Healy BC, Mazzola MA, Beynon V, Glehn FV, et al. Correlating serum microRNAs and clinical parameters in Amyotrophic lateral sclerosis. Muscle Nerve. (2018) 58:261–9. 10.1002/mus.26106 [DOI] [PMC free article] [PubMed] [Google Scholar]
- 150.de Andrade HM, de Albuquerque M, Avansini SH, de SRC, Dogini DB, Nucci A, et al. MicroRNAs-424 and 206 are potential prognostic markers in spinal onset amyotrophic lateral sclerosis. J Neurol Sci. (2016) 368:19–24. 10.1016/j.jns.2016.06.046 [DOI] [PubMed] [Google Scholar]
- 151.Takahashi I, Hama Y, Matsushima M, Hirotani M, Kano T, Hohzen H, et al. Identification of plasma microRNAs as a biomarker of sporadic amyotrophic lateral sclerosis. Mol Brain. (2015) 8:67. 10.1186/s13041-015-0161-7 [DOI] [PMC free article] [PubMed] [Google Scholar]
- 152.Mariosa D, Hammar N, Malmstrom H, Ingre C, Junger I, Ye W, et al. Blood biomarkers of carbohydrate, lipid and apolipoprotein metabolisms and risk of amyotrophic lateral sclerosis: a more than 20 year follow-up of the Swedish AMORIS cohort. Ann Neurol. (2017) 81:718–28. 10.1002/ana.24936 [DOI] [PubMed] [Google Scholar]
- 153.Cecchi M, Messina P, Airoldi L, Pupillo E, Bandettini di Poggio M, Calvo A, et al. (2014). Plasma amino acids patterns and age of onset of amyotrophic lateral sclerosis. Amyotroph Lateral Scler Frontotemporal Degener. 15:371–5. 10.3109/21678421.2014.920032 [DOI] [PubMed] [Google Scholar]
- 154.Lawton KA, Brown MV, Alexander D, Li Z, Wulff JE, Lawson R, et al. Plasma metabolomic biomarker panel to distinguish patients with amyotrophic lateral sclerosis from disease mimics. Amyotroph Lateral Scler Frontotemporal Degener. (2014) 15:362–70. 10.3109/21678421.2014.908311 [DOI] [PubMed] [Google Scholar]
- 155.Andreadou E, Kapaki E, Kokotis P, Paraskevas GP, Katsaros N, Libitaki G, et al. Plasma glutamate and glycine levels in patients with amyotrophic lateral sclerosis. In Vivo. (2008) 22:137–41. Available online at: http://iv.iiarjournals.org/content/22/1/137.long [PubMed] [Google Scholar]
- 156.Andreadou E, Kapaki E, Kokotis P, Paraskevas GP, Katsaros N, Libitaki G, et al. Plasma glutamate and glycine levels in patients with amyotrophic lateral sclerosis: the effect of riluzole treatment. Clin Neurol Neurosurg. (2008) 110:222–6. 10.1016/j.clineuro.2007.10.018 [DOI] [PubMed] [Google Scholar]
- 157.Niebroj-Dobosz I, Janik P, Kwiecinski H. Effect of Riluzole on serum amino acids in patients with amyotrophic lateral sclerosis. Acta Neurol Scand. (2002) 106:39–43. 10.1034/j.1600-0404.2002.00206.x [DOI] [PubMed] [Google Scholar]
- 158.Palma AS, De Carvalho M, Grammel N, Pinto S, Barata N, Conradt HS, et al. Proteomic analysis of plasma from Portuguese patients with familial amyotrophic lateral sclerosis. Amyotroph Lateral Scler. (2008) 9:339–49. 10.1080/17482960801934239 [DOI] [PubMed] [Google Scholar]
- 159.Lawton KA, Cudkowicz ME, Brown MV, Alexander D, Caffrey R, Wulff JE, et al. Biochemical alterations associated with ALS. Amyotroph Lateral Scler. (2012) 13:110–8. 10.3109/17482968.2011.619197 [DOI] [PubMed] [Google Scholar]
- 160.Conraux L, Pech C, Guerraoui H, Loyaux D, Ferrara P, Guillemot JC, et al. Plasma peptide biomarker discovery for amyotrophic lateral sclerosis by MALDI-TOF mass spectrometry profiling. PLoS ONE. (2013) 8:e79733. 10.1371/journal.pone.0079733 [DOI] [PMC free article] [PubMed] [Google Scholar]
- 161.Wuolikainen A, Jonsson P, Ahnlund M, Antti H, Marklund SL, Moritz T, et al. Multi-platform mass spectrometry analysis of the CSF and plasma metabolomes of rigorously matched amyotrophic lateral sclerosis, Parkinson's disease and control subjects. Mol BioSyst. (2016) 12:1287–98. 10.1039/C5MB00711A [DOI] [PubMed] [Google Scholar]
- 162.Nadjar Y, Gordon P, Corcia P, Bensimon G, Pieroni L, Meininger V, et al. Elevated serum ferritin is associated with reduced survival in amyotrophic lateral sclerosis. PLoS ONE. (2012) 7:e45034. 10.1371/journal.pone.0045034 [DOI] [PMC free article] [PubMed] [Google Scholar]
- 163.Keizman D, Ish-Shalom M, Berliner S, Maimon N, Vered Y, Artamonov I, et al. Low uric acid levels in serum of patients with ALS: further evidence for oxidative stress? J Neurol Sci. (2009) 285:95–9. 10.1016/j.jns.2009.06.002 [DOI] [PubMed] [Google Scholar]
- 164.Oh SI, Baek S, Park JS, Piao L, Oh KW, Kim SH. Prognostic role of serum levels of uric acid in amyotrophic lateral sclerosis. J Clin Neurol. (2015) 11:376–82. 10.3988/jcn.2015.11.4.376 [DOI] [PMC free article] [PubMed] [Google Scholar]
- 165.Zheng Z, Guo X, Wei Q, Song W, Cao B, Huang R, et al. Serum uric acid level is associated with the prevalence but not with survival of amyotrophic lateral sclerosis in a Chinese population. Metabol Brain Dis. (2014) 29:771–5. 10.1007/s11011-014-9510-y [DOI] [PubMed] [Google Scholar]
- 166.Zoccolella S, Simone IL, Capozzo R, Tortelli R, Leo A, D'Errico E, et al. An exploratory study of serum urate levels in patients with amyotrophic lateral sclerosis. J Neurol. (2011) 258:238–43. 10.1007/s00415-010-5735-9 [DOI] [PubMed] [Google Scholar]
- 167.O'Reilly ÉJ, Bjornevik K, Schwarzschild MA, McCullough ML, Kolonel LN, Le Marchand L, et al. Pre-diagnostic plasma urate and the risk of amyotrophic lateral sclerosis. Amyotroph Lateral Scler Frontotemporal Degener. (2017) 19:194–200. 10.1080/21678421.2017.1418005 [DOI] [PMC free article] [PubMed] [Google Scholar]
- 168.Paganoni S, Zhang M, Zárate AQ, Jaffa M, Yu H, Cudkowicz ME, et al. Uric acid levels predict survival in men with amyotrophic lateral sclerosis. J Neurol. (2012) 259:1923–8. 10.1007/s00415-012-6440-7 [DOI] [PMC free article] [PubMed] [Google Scholar]
- 169.Paganoni S, Nicholson K, Chan J, Shui A, Schoenfeld D, Sherman A, et al. Urate levels predict survival in amyotrophic lateral sclerosis: analysis of the expanded Pooled Resource Open-Access ALS clinical trials database. Muscle Nerve. (2018) 57:430–4. 10.1002/mus.25950 [DOI] [PMC free article] [PubMed] [Google Scholar]
- 170.Bocca B, Forte G, Oggiano R, Clemente S, Asara Y, Peruzzu A, et al. Level of neurotoxic metals in amyotrophic lateral sclerosis: a population-based case-control study. J Neurol Sci. (2015) 359:11–7. 10.1016/j.jns.2015.10.023 [DOI] [PubMed] [Google Scholar]
- 171.Forte G, Bocca B, Oggiano R, Clemente S, Asara Y, Sotgiu MA, et al. Essential trace elements in amyotrophic lateral sclerosis (ALS): results in a population of a risk area of Italy. Neurol Sci. (2017) 38:1609–15. 10.1007/s10072-017-3018-2 [DOI] [PubMed] [Google Scholar]
- 172.Oggiano R, Solinas G, Forte G, Bocca B, Farace C, Pisano A, et al. Trace elements in ALS patients and their relationships with clinical severity. Chemosphere. (2018) 197:457–66. 10.1016/j.chemosphere.2018.01.076 [DOI] [PubMed] [Google Scholar]
- 173.Pratico D, Lawson JA, FitzGerald GA. Cyclooxygenase-dependent formation of the isoprostane. 8-epi prostaglandin F2 alpha. J Biol Chem. (1995) 270:9800–8. 10.1074/jbc.270.17.9800 [DOI] [PubMed] [Google Scholar]
- 174.Ono S, Imai T, Matsubara S, Takahashi K, Jinnai K, Yamano T, et al. Decreased urinary concentrations of type IV collagen in amyotrophic lateral sclerosis. Acta Neurol Scand. (1999) 100:111–6. 10.1111/j.1600-0404.1999.tb01048.x [DOI] [PubMed] [Google Scholar]
- 175.Ono S, Shimizu N, Imai T, Rodriguez GP. Urinary collagen metabolite excretion in amyotrophic lateral sclerosis. Muscle Nerve. (2001) 24:821–5. 10.1002/mus.1075 [DOI] [PubMed] [Google Scholar]
- 176.Shepheard SR, Chataway T, Schultz DW, Rush RA, Rogers ML. The extracellular domain of neurotrophin receptor p75 as a candidate biomarker for amyotrophic lateral sclerosis. PLoS ONE. (2014) 9:e87398. 10.1371/journal.pone.0087398 [DOI] [PMC free article] [PubMed] [Google Scholar]
- 177.Jia R, Shepheard S, Jin J, Hu F, Zhao X, Xue L, et al. Urinary extracellular domain of neurotrophin receptor p75 as a biomarker for amyotrophic lateral sclerosis in a Chinese cohort. Sci Rep. (2017) 7:5127. 10.1038/s41598-017-05430-w [DOI] [PMC free article] [PubMed] [Google Scholar]
- 178.Shepheard SR, Wuu J, Cardoso M, Wiklendt L, Dinning PG, Chataway T, et al. Urinary p75(ECD): a prognostic, disease progression, and pharmacodynamic biomarker in ALS. Neurology. (2017) 88:1137–43. 10.1212/WNL.0000000000003741 [DOI] [PMC free article] [PubMed] [Google Scholar]
- 179.Wilkinson ID, Graves MJ. Chapter 5: magnetic resonance imaging, In: Adam A, Dixon AK, Gillard JH, Schaefer-Prokop CM. editors, Grainger & Allison's Diagnostic Radiology: A Textbook of Medical Imaging, 6th ed., Philadelphia, PA: Churchill Livingstone, Elsevere; (2014). p. 90–114. [Google Scholar]
- 180.Sarchielli P, Pelliccioli GP, Tarducci R, Chiarini P, Presciutti O, Gobbi G, et al. Magnetic resonance imaging and 1H-magnetic resonance spectroscopy in amyotrophic lateral sclerosis. Neuroradiology. (2001) 43:189–97. 10.1007/s002340000472 [DOI] [PubMed] [Google Scholar]
- 181.Grosskreutz J, Kaufmann J, Fradrich J, Dengler R, Heinze HJ, Peschel T. Widespread sensorimotor and frontal cortical atrophy in Amyotrophic Lateral Sclerosis. BMC Neurol. (2006) 6:17. 10.1186/1471-2377-6-17 [DOI] [PMC free article] [PubMed] [Google Scholar]
- 182.Mezzapesa DM, D'Errico E, Tortelli R, Distaso E, Cortese R, Tursi M, et al. Cortical thinning and clinical heterogeneity in amyotrophic lateral sclerosis. PLoS ONE. (2013) 8:e80748. 10.1371/journal.pone.0080748 [DOI] [PMC free article] [PubMed] [Google Scholar]
- 183.Chuang K-S, Tzeng H-L, Chen S, Wu J, Chen T-J. Fuzzy c-means clustering with spatial information for image segmentation. Comput Med Imaging Graph. (2006) 30:9–15. 10.1016/j.compmedimag.2005.10.001 [DOI] [PubMed] [Google Scholar]
- 184.Zhang Q, Mao C, Jin J, Niu C, Bai L, Dang J, et al. Side of limb-onset predicts laterality of gray matter loss in amyotrophic lateral sclerosis. Biomed Res Int. (2014) 2014:473250. 10.1155/2014/473250 [DOI] [PMC free article] [PubMed] [Google Scholar]
- 185.Mezzapesa DM, Ceccarelli A, Dicuonzo F, Carella A, De Caro MF, Lopez M, et al. Whole-brain and regional brain atrophy in amyotrophic lateral sclerosis. Am J Neuroradiol. (2007) 28:255–9. Available online at: http://www.ajnr.org/content/28/2/255.long [PMC free article] [PubMed] [Google Scholar]
- 186.Westeneng HJ, Verstraete E, Walhout R, Schmidt R, Hendrikse J, Veldink JH, et al. Subcortical structures in amyotrophic lateral sclerosis. Neurobiol Aging. (2015) 36:1075–82. 10.1016/j.neurobiolaging.2014.09.002 [DOI] [PubMed] [Google Scholar]
- 187.Pinkhardt EH, van Elst LT, Ludolph AC, Kassubek J. Amygdala size in amyotrophic lateral sclerosis without dementia: an in vivo study using MRI volumetry. BMC Neurol. (2006) 6:48. 10.1186/1471-2377-6-48 [DOI] [PMC free article] [PubMed] [Google Scholar]
- 188.Thivard L, Pradat PF, Lehéricy S, Lacomblez L, Dormont D, Chiras J, et al. Diffusion tensor imaging and voxel based morphometry study in amyotrophic lateral sclerosis: relationships with motor disability. J Neurol Neurosurg Psychiatry. (2007) 78:889–92. 10.1136/jnnp.2006.101758 [DOI] [PMC free article] [PubMed] [Google Scholar]
- 189.de Albuquerque M, Branco LM, Rezende TJ, de Andrade HM, Nucci A, Franca MC Jr. Longitudinal evaluation of cerebral and spinal cord damage in amyotrophic lateral sclerosis. Neuroimage Clin. (2017) 14:269–76. 10.1016/j.nicl.2017.01.024 [DOI] [PMC free article] [PubMed] [Google Scholar]
- 190.Grolez G, Kyheng M, Lopes R, Moreau C, Timmerman K, Auger F, et al. MRI of the cervical spinal cord predicts respiratory dysfunction in ALS. Sci Rep. (2018) 8:1828. 10.1038/s41598-018-19938-2 [DOI] [PMC free article] [PubMed] [Google Scholar]
- 191.Walhout R, Westeneng HJ, Verstraete E, Hendrikse J, Veldink JH, van den Heuvel MP, et al. Cortical thickness in ALS: towards a marker for upper motor neuron involvement. J Neurol Neurosurg Psychiatry. (2015) 86:288–94. 10.1136/jnnp-2013-306839 [DOI] [PubMed] [Google Scholar]
- 192.Abrahams S, Goldstein LH, Suckling J, Ng V, Simmons A, Chitnis X, et al. Frontotemporal white matter changes in amyotrophic lateral sclerosis. J Neurol. (2005) 252:321–31. 10.1007/s00415-005-0646-x [DOI] [PubMed] [Google Scholar]
- 193.Crespi C, Dodich A, Cappa SF, Canessa N, Iannaccone S, Corbo M, et al. Multimodal MRI quantification of the common neurostructural bases within the FTD-ALS continuum. Neurobiol Aging. (2018) 62:95–104. 10.1016/j.neurobiolaging.2017.09.019 [DOI] [PubMed] [Google Scholar]
- 194.Ellis CM, Suckling J, Amaro E Jr, Bullmore ET, Simmons A, Williams SC, et al. Volumetric analysis reveals corticospinal tract degeneration and extramotor involvement in ALS. Neurology. (2001) 57:1571–8. 10.1212/WNL.57.9.1571 [DOI] [PubMed] [Google Scholar]
- 195.Kassubek J, Unrath A, Huppertz HJ, Lule D, Ethofer T, Sperfeld AD, et al. Global brain atrophy and corticospinal tract alterations in ALS, as investigated by voxel-based morphometry of 3-D MRI. Amyotroph Lateral Scler Other Motor Neuron Disord. (2005) 6:213–20. 10.1080/14660820510038538 [DOI] [PubMed] [Google Scholar]
- 196.Meadowcroft MD, Mutic NJ, Bigler DC, Wang JL, Simmons Z, Connor JR, et al. Histological-MRI correlation in the primary motor cortex of patients with amyotrophic lateral sclerosis. J Magn Reson Imaging. (2015) 41:665–75. 10.1002/jmri.24582 [DOI] [PMC free article] [PubMed] [Google Scholar]
- 197.Chen J, Kostenko V, Pioro EP, Trapp BD. MR imaging-based estimation of upper motor neuron density in patients with amyotrophic lateral sclerosis: a feasibility study. Radiology. (2018) 287:955–64. 10.1148/radiol.2018162967 [DOI] [PMC free article] [PubMed] [Google Scholar]
- 198.Filippi M, Agosta F, Abrahams S, Fazekas F, Grosskreutz J, Kalra S, et al. EFNS guidelines on the use of neuroimaging in the management of motor neuron diseases. Eur J Neurol. (2010) 17:526-e20. 10.1111/j.1468-1331.2010.02951.x [DOI] [PMC free article] [PubMed] [Google Scholar]
- 199.Charil A, Corbo M, Filippi M, Kesavadas C, Agosta F, Munerati E, et al. Structural and metabolic changes in the brain of patients with upper motor neuron disorders: a multiparametric MRI study. Amyotroph Lateral Scler. (2009) 10:269–79. 10.3109/17482960902777339 [DOI] [PubMed] [Google Scholar]
- 200.Hecht MJ, Fellner F, Fellner C, Hilz MJ, Heuss D, Neundorfer B. MRI-FLAIR images of the head show corticospinal tract alterations in ALS patients more frequently than T2-, T1- and proton-density-weighted images. J Neurol Sci. (2001) 186:37–44. 10.1016/S0022-510X(01)00503-2 [DOI] [PubMed] [Google Scholar]
- 201.Peretti-Viton P, Azulay JP, Trefouret S, Brunel H, Daniel C, Viton JM, et al. MRI of the intracranial corticospinal tracts in amyotrophic and primary lateral sclerosis. Neuroradiology. (1999) 41:744–9. 10.1007/s002340050836 [DOI] [PubMed] [Google Scholar]
- 202.Abe K, Fujimura H, Kobayashi Y, Fujita N, Yanagihara T. Degeneration of the pyramidal tracts in patients with amyotrophic lateral sclerosis. A premortem and postmortem magnetic resonance imaging study. J Neuroimaging. (1997) 7:208–12. 10.1111/jon199774208 [DOI] [PubMed] [Google Scholar]
- 203.Mirowitz S, Sartor K, Gado M, Torack R. Focal signal-intensity variations in the posterior internal capsule: normal MR findings and distinction from pathologic findings. Radiology. (1989) 172:535–9. 10.1148/radiology.172.2.2748836 [DOI] [PubMed] [Google Scholar]
- 204.Oba H, Araki T, Ohtomo K, Monzawa S, Uchiyama G, Koizumi K, et al. Amyotrophic lateral sclerosis: T2 shortening in motor cortex at MR imaging. Radiology. (1993) 189:843–6. 10.1148/radiology.189.3.8234713 [DOI] [PubMed] [Google Scholar]
- 205.Ignjatovic A, Stevic Z, Lavrnic S, Dakovic M, Bacic G. Brain iron MRI: a biomarker for amyotrophic lateral sclerosis. J Magn Reson Imaging. (2013) 38:1472–9. 10.1002/jmri.24121 [DOI] [PubMed] [Google Scholar]
- 206.Adachi Y, Sato N, Saito Y, Kimura Y, Nakata Y, Ito K, et al. Usefulness of SWI for the detection of iron in the motor cortex in amyotrophic lateral sclerosis. J Neuroimaging. (2015) 25:443–51. 10.1111/jon.12127 [DOI] [PubMed] [Google Scholar]
- 207.Kwan JY, Jeong SY, Van Gelderen P, Deng HX, Quezado MM, Danielian LE, et al. Iron accumulation in deep cortical layers accounts for MRI signal abnormalities in ALS: correlating 7 tesla MRI and pathology. PLoS ONE. (2012) 7:e35241. 10.1371/journal.pone.0035241 [DOI] [PMC free article] [PubMed] [Google Scholar]
- 208.Hecht MJ, Fellner C, Schmid A, Neundorfer B, Fellner FA. Cortical T2 signal shortening in amyotrophic lateral sclerosis is not due to iron deposits. Neuroradiology. (2005) 47:805–8. 10.1007/s00234-005-1421-5 [DOI] [PubMed] [Google Scholar]
- 209.Vazquez-Costa JF, Mazon M, Carreres-Polo J, Hervas D, Perez-Tur J, Marti-Bonmati L, et al. Brain signal intensity changes as biomarkers in amyotrophic lateral sclerosis. Acta Neurol Scand. (2018) 137:262–71. 10.1111/ane.12863 [DOI] [PubMed] [Google Scholar]
- 210.Endo H, Sekiguchi K, Shimada H, Ueda T, Kowa H, Kanda F, et al. Low signal intensity in motor cortex on susceptibility-weighted MR imaging is correlated with clinical signs of amyotrophic lateral sclerosis: a pilot study. J Neurol. (2018) 265:552–61. 10.1007/s00415-017-8728-0 [DOI] [PubMed] [Google Scholar]
- 211.Ellis CM, Simmons A, Jones DK, Bland J, Dawson JM, Horsfield MA, et al. Diffusion tensor MRI assesses corticospinal tract damage in ALS. Neurology. (1999) 53:1051–8. 10.1212/WNL.53.5.1051 [DOI] [PubMed] [Google Scholar]
- 212.Graham JM, Papadakis N, Evans J, Widjaja E, Romanowski CA, Paley MN, et al. Diffusion tensor imaging for the assessment of upper motor neuron integrity in ALS. Neurology. (2004) 63:2111–9. 10.1212/01.WNL.0000145766.03057.E7 [DOI] [PubMed] [Google Scholar]
- 213.Filippini N, Douaud G, Mackay CE, Knight S, Talbot K, Turner MR. Corpus callosum involvement is a consistent feature of amyotrophic lateral sclerosis. Neurology. (2010) 75:1645–52. 10.1212/WNL.0b013e3181fb84d1 [DOI] [PMC free article] [PubMed] [Google Scholar]
- 214.Tang M, Chen X, Zhou Q, Liu B, Liu Y, Liu S, et al. Quantitative assessment of amyotrophic lateral sclerosis with diffusion tensor imaging in 3.0T magnetic resonance. Int J Clin Exp Med. (2015) 8:8295–303. Available online at: http://www.ijcem.com [PMC free article] [PubMed] [Google Scholar]
- 215.Wang S, Poptani H, Woo JH, Desiderio LM, Elman LB, McCluskey LF, et al. Amyotrophic lateral sclerosis: diffusion-tensor and chemical shift MR imaging at 3.0 T. Radiology. (2006) 239:831–8. 10.1148/radiol.2393050573 [DOI] [PubMed] [Google Scholar]
- 216.Iwata NK, Aoki S, Okabe S, Arai N, Terao Y, Kwak S, et al. Evaluation of corticospinal tracts in ALS with diffusion tensor MRI and brainstem stimulation. Neurology. (2008) 70:528–32. 10.1212/01.wnl.0000299186.72374.19 [DOI] [PubMed] [Google Scholar]
- 217.Ciccarelli O, Behrens TE, Johansen-Berg H, Talbot K, Orrell RW, Howard RS, et al. Investigation of white matter pathology in ALS and PLS using tract-based spatial statistics. Hum Brain Mapping. (2009) 30:615–24. 10.1002/hbm.20527 [DOI] [PMC free article] [PubMed] [Google Scholar]
- 218.Metwalli NS, Benatar M, Nair G, Usher S, Hu X, Carew JD. Utility of axial and radial diffusivity from diffusion tensor MRI as markers of neurodegeneration in amyotrophic lateral sclerosis. Brain Res. (2010) 1348:156–64. 10.1016/j.brainres.2010.05.067 [DOI] [PubMed] [Google Scholar]
- 219.Valsasina P, Agosta F, Benedetti B, Caputo D, Perini M, Salvi F, et al. Diffusion anisotropy of the cervical cord is strictly associated with disability in amyotrophic lateral sclerosis. J Neurol Neurosurg Psychiatry. (2007) 78:480–4. 10.1136/jnnp.2006.100032 [DOI] [PMC free article] [PubMed] [Google Scholar]
- 220.Nair G, Carew JD, Usher S, Lu D, Hu XP, Benatar M. Diffusion tensor imaging reveals regional differences in the cervical spinal cord in amyotrophic lateral sclerosis. Neuroimage. (2010) 53:576–83. 10.1016/j.neuroimage.2010.06.060 [DOI] [PubMed] [Google Scholar]
- 221.Agosta F, Pagani E, Rocca MA, Caputo D, Perini M, Salvi F, et al. Voxel-based morphometry study of brain volumetry and diffusivity in amyotrophic lateral sclerosis patients with mild disability. Hum Brain Mapping. (2007) 28:1430–8. 10.1002/hbm.20364 [DOI] [PMC free article] [PubMed] [Google Scholar]
- 222.Sage CA, Van Hecke W, Peeters R, Sijbers J, Robberecht W, Parizel P, et al. Quantitative diffusion tensor imaging in amyotrophic lateral sclerosis: revisited. Hum Brain Mapping. (2009) 30:3657–75. 10.1002/hbm.20794 [DOI] [PMC free article] [PubMed] [Google Scholar]
- 223.van der Graaff MM, Sage CA, Caan MW, Akkerman EM, Lavini C, Majoie CB, et al. Upper and extra-Moto neuron involvement in early Moto neuron disease: a diffusion tensor imaging study. Brain. (2011) 134(Pt. 4):1211–28. 10.1093/brain/awr016 [DOI] [PubMed] [Google Scholar]
- 224.Baldaranov D, Khomenko A, Kobor I, Bogdahn U, Gorges M, Kassubek J, et al. Longitudinal diffusion tensor imaging-based assessment of tract alterations: an application to amyotrophic lateral sclerosis. Front Hum Neurosci. (2017) 11:567. 10.3389/fnhum.2017.00567 [DOI] [PMC free article] [PubMed] [Google Scholar]
- 225.Foerster BR, Dwamena BA, Petrou M, Carlos RC, Callaghan BC, Churchill CL, et al. Diagnostic accuracy of diffusion tensor imaging in amyotrophic lateral sclerosis: a systematic review and individual patient data meta-analysis. Acad Radiol. (2013) 20:1099–106. 10.1016/j.acra.2013.03.017 [DOI] [PMC free article] [PubMed] [Google Scholar]
- 226.Kassubek J, Muller HP, Del Tredici K, Lule D, Gorges M, Braak H, et al. Imaging the pathoanatomy of amyotrophic lateral sclerosis in vivo: targeting a propagation-based biological marker. J Neurol Neurosurg Psychiatry. (2018) 89:374–81. 10.1136/jnnp-2017-316365 [DOI] [PMC free article] [PubMed] [Google Scholar]
- 227.Schuster C, Hardiman O, Bede P. Development of an automated MRI-based diagnostic protocol for amyotrophic lateral sclerosis using disease-specific pathognomonic features: a quantitative disease-state classification study. PLoS ONE. (2016) 11:e0167331. 10.1371/journal.pone.0167331 [DOI] [PMC free article] [PubMed] [Google Scholar]
- 228.Ferraro PM, Agosta F, Riva N, Copetti M, Spinelli EG, Falzone Y, et al. Multimodal structural MRI in the diagnosis of motor neuron diseases. Neuroimage Clin. (2017) 16:240–7. 10.1016/j.nicl.2017.08.002 [DOI] [PMC free article] [PubMed] [Google Scholar]
- 229.Kato Y, Matsumura K, Kinosada Y, Narita Y, Kuzuhara S, Nakagawa T. Detection of pyramidal tract lesions in amyotrophic lateral sclerosis with magnetization-transfer measurements. Am J Neuroradiol. (1997) 18:1541–7. [PMC free article] [PubMed] [Google Scholar]
- 230.Tanabe JL, Vermathen M, Miller R, Gelinas D, Weiner MW, Rooney WD. Reduced MTR in the corticospinal tract and normal T in Amyotrophic Lateral Sclerosis. Magn Reson Imaging. (1998) 16:1163–9. 10.1016/S0730-725X(98)00129-5 [DOI] [PMC free article] [PubMed] [Google Scholar]
- 231.Cosottini M, Pesaresi I, Piazza S, Diciotti S, Belmonte G, Battaglini M, et al. Magnetization transfer imaging demonstrates a distributed pattern of microstructural changes of the cerebral cortex in amyotrophic lateral sclerosis. Am J Neuroradiol. (2011) 32:704–8. 10.3174/ajnr.A2356 [DOI] [PMC free article] [PubMed] [Google Scholar]
- 232.Konrad C, Henningsen H, Bremer J, Mock B, Deppe M, Buchinger C, et al. Pattern of cortical reorganization in amyotrophic lateral sclerosis: a functional magnetic resonance imaging study. Exp Brain Res. (2002) 143:51–6. 10.1007/s00221-001-0981-9 [DOI] [PubMed] [Google Scholar]
- 233.Schoenfeld MA, Tempelmann C, Gaul C, Kuhnel GR, Duzel E, Hopf JM, et al. Functional motor compensation in amyotrophic lateral sclerosis. J Neurol. (2005) 252:944–52. 10.1007/s00415-005-0787-y [DOI] [PubMed] [Google Scholar]
- 234.Konrad C, Jansen A, Henningsen H, Sommer J, Turski PA, Brooks BR, et al. Subcortical reorganization in amyotrophic lateral sclerosis. Exp Brain Res. (2006) 172:361–9. 10.1007/s00221-006-0352-7 [DOI] [PubMed] [Google Scholar]
- 235.Stanton BR, Williams VC, Leigh PN, Williams SC, Blain CR, Jarosz JM, et al. Altered cortical activation during a motor task in ALS. Evidence for involvement of central pathways. J Neurol. (2007) 254:1260–7. 10.1007/s00415-006-0513-4 [DOI] [PubMed] [Google Scholar]
- 236.Poujois A, Schneider FC, Faillenot I, Camdessanche JP, Vandenberghe N, Thomas-Anterion C, et al. Brain plasticity in the motor network is correlated with disease progression in amyotrophic lateral sclerosis. Hum Brain Mapping. (2013) 34:2391–401. 10.1002/hbm.22070 [DOI] [PMC free article] [PubMed] [Google Scholar]
- 237.Mohammadi B, Kollewe K, Samii A, Krampfl K, Dengler R, Munte TF. Decreased brain activation to tongue movements in amyotrophic lateral sclerosis with bulbar involvement but not Kennedy syndrome. J Neurol. (2009b) 256:1263–9. 10.1007/s00415-009-5112-8 [DOI] [PubMed] [Google Scholar]
- 238.Kollewe K, Munte TF, Samii A, Dengler R, Petri S, Mohammadi B. Patterns of cortical activity differ in ALS patients with limb and/or bulbar involvement depending on motor tasks. J Neurol. (2011) 258:804–10. 10.1007/s00415-010-5842-7 [DOI] [PubMed] [Google Scholar]
- 239.Lule D, Diekmann V, Kassubek J, Kurt A, Birbaumer N, Ludolph AC, et al. Cortical plasticity in amyotrophic lateral sclerosis: motor imagery and function. Neurorehabil Neural Repair. (2007) 21:518–26. 10.1177/1545968307300698 [DOI] [PubMed] [Google Scholar]
- 240.Stanton BR, Williams VC, Leigh PN, Williams SC, Blain CR, Giampietro VP, et al. Cortical activation during motor imagery is reduced in amyotrophic lateral sclerosis. Brain Res. (2007) 1172:145–51. 10.1016/j.brainres.2007.07.044 [DOI] [PubMed] [Google Scholar]
- 241.Mohammadi B, Kollewe K, Samii A, Krampfl K, Dengler R, Munte TF. Changes of resting state brain networks in amyotrophic lateral sclerosis. Exp Neurol. (2009) 217:147–53. 10.1016/j.expneurol.2009.01.025 [DOI] [PubMed] [Google Scholar]
- 242.Goldstein LH, Newsom-Davis IC, Bryant V, Brammer M, Leigh PN, Simmons A. Altered patterns of cortical activation in ALS patients during attention and cognitive response inhibition tasks. J Neurol. (2011) 258:2186–98. 10.1007/s00415-011-6088-8 [DOI] [PMC free article] [PubMed] [Google Scholar]
- 243.Lule D, Diekmann V, Anders S, Kassubek J, Kubler A, Ludolph AC, et al. Brain responses to emotional stimuli in patients with amyotrophic lateral sclerosis (ALS). J Neurol. (2007) 254:519–27. 10.1007/s00415-006-0409-3 [DOI] [PubMed] [Google Scholar]
- 244.Palmieri A, Naccarato M, Abrahams S, Bonato M, D'Ascenzo C, Balestreri S, et al. Right hemisphere dysfunction and emotional processing in ALS: an fMRI study. J Neurol. (2010) 257:1970–8. 10.1007/s00415-010-5640-2 [DOI] [PubMed] [Google Scholar]
- 245.Lule D, Diekmann V, Muller HP, Kassubek J, Ludolph AC, Birbaumer N. Neuroimaging of multimodal sensory stimulation in amyotrophic lateral sclerosis. J Neurol Neurosurg Psychiatry. (2010) 81:899–906. 10.1136/jnnp.2009.192260 [DOI] [PubMed] [Google Scholar]
- 246.Abrahams S, Goldstein LH, Simmons A, Brammer M, Williams SC, Giampietro V, et al. Word retrieval in amyotrophic lateral sclerosis: a functional magnetic resonance imaging study. Brain. (2004) 127(Pt. 7):1507–17. 10.1093/brain/awh170 [DOI] [PubMed] [Google Scholar]
- 247.Ellis CM, Simmons A, Andrews C, Dawson JM, Williams SC, Leigh PN. A proton magnetic resonance spectroscopic study in ALS: correlation with clinical findings. Neurology. (1998) 51:1104–9. 10.1212/WNL.51.4.1104 [DOI] [PubMed] [Google Scholar]
- 248.Schuff N, Rooney WD, Miller R, Gelinas DF, Amend DL, Maudsley AA, et al. Reanalysis of multislice H MRSI in amyotrophic lateral sclerosis. Magn Reson Med. (2001) 45:513–6. [DOI] [PubMed] [Google Scholar]
- 249.Mitsumoto H, Ulug AM, Pullman SL, Gooch CL, Chan S, Tang MX, et al. Quantitative objective markers for upper and lower motor neuron dysfunction in ALS. Neurology. (2007) 68:1402–10. 10.1212/01.wnl.0000260065.57832.87 [DOI] [PubMed] [Google Scholar]
- 250.Jones AP, Gunawardena WJ, Coutinho CM, Gatt JA, Shaw IC, Mitchell JD. Preliminary results of proton magnetic resonance spectroscopy in motor neurone disease (amytrophic lateral sclerosis). J Neurol Sci. (1995) 129:85–9. 10.1016/0022-510X(95)00072-A [DOI] [PubMed] [Google Scholar]
- 251.Gredal O, Rosenbaum S, Topp S, Karlsborg M, Strange P, Werdelin L. Quantification of brain metabolites in amyotrophic lateral sclerosis by localized proton magnetic resonance spectroscopy. Neurology. (1997) 48:878–81. 10.1212/WNL.48.4.878 [DOI] [PubMed] [Google Scholar]
- 252.Han J, Ma L. Study of the features of proton MR spectroscopy (H-MRS) on amyotrophic lateral sclerosis. J Magn Reson Imaging. (2010) 31:305–8. 10.1002/jmri.22053 [DOI] [PubMed] [Google Scholar]
- 253.Sivak S, Bittsansky M, Kurca E, Turcanova-Koprusakova M, Grofik M, Nosal V, et al. Proton magnetic resonance spectroscopy in patients with early stages of amyotrophic lateral sclerosis. Neuroradiology. (2010) 52:1079–85. 10.1007/s00234-010-0685-6 [DOI] [PubMed] [Google Scholar]
- 254.Foerster BR, Callaghan BC, Petrou M, Edden RA, Chenevert TL, Feldman EL. Decreased motor cortex γ-aminobutyric acid in amyotrophic lateral sclerosis. Neurology. (2012) 78:1596–600. 10.1212/WNL.0b013e3182563b57 [DOI] [PMC free article] [PubMed] [Google Scholar]
- 255.Foerster BR, Pomper MG, Callaghan BC, Petrou M, Edden RA, Mohamed MA, et al. An imbalance between excitatory and inhibitory neurotransmitters in amyotrophic lateral sclerosis revealed by use of 3-T proton magnetic resonance spectroscopy. JAMA Neurol. (2013) 70:1009–16. 10.1001/jamaneurol.2013.234 [DOI] [PMC free article] [PubMed] [Google Scholar]
- 256.Weiduschat N, Mao X, Hupf J, Armstrong N, Kang G, Lange DJ, et al. Motor cortex glutathione deficit in ALS measured in vivo with the J-editing technique. Neurosci Lett. (2014) 570:102–7. 10.1016/j.neulet.2014.04.020 [DOI] [PubMed] [Google Scholar]
- 257.Sako W, Abe T, Izumi Y, Harada M, Kaji R. The ratio of N-acetyl aspartate to glutamate correlates with disease duration of amyotrophic lateral sclerosis. J Clin Neurosci. (2016) 27:110–3. 10.1016/j.jocn.2015.08.044 [DOI] [PubMed] [Google Scholar]
- 258.Cheong I, Marjanska M, Deelchand DK, Eberly LE, Walk D, Oz G. Ultra-High field proton MR spectroscopy in early-stage amyotrophic lateral sclerosis. Neurochem Res. (2017) 42:1833–44. 10.1007/s11064-017-2248-2 [DOI] [PMC free article] [PubMed] [Google Scholar]
- 259.Atassi N, Xu M, Triantafyllou C, Keil B, Lawson R, Cernasov P, et al. Ultra high-field (7tesla) magnetic resonance spectroscopy in amyotrophic lateral sclerosis. PLoS ONE. (2017) 12:e0177680. 10.1371/journal.pone.0177680 [DOI] [PMC free article] [PubMed] [Google Scholar]
- 260.Wang Y, Li X, Chen W, Wang Z, Xu Y, Luo J, et al. Detecting neuronal dysfunction of hand motor cortex in ALS: a MRSI study. Somatosens Mot Res. (2017) 34:15–20. 10.1080/08990220.2016.1275544 [DOI] [PubMed] [Google Scholar]
- 261.Pioro EP. MR spectroscopy in amyotrophic lateral sclerosis/motor neuron disease. J Neurol Sci. (1997) 152(Suppl. 1):S49–53. 10.1016/S0022-510X(97)00244-X [DOI] [PubMed] [Google Scholar]
- 262.Cwik VA, Hanstock CC, Allen PS, Martin WR. Estimation of brainstem neuronal loss in amyotrophic lateral sclerosis with in vivo proton magnetic resonance spectroscopy. Neurology. (1998) 50:72–7. 10.1212/WNL.50.1.72 [DOI] [PubMed] [Google Scholar]
- 263.Pioro EP, Majors AW, Mitsumoto H, Nelson DR, Ng TC. 1H-MRS evidence of neurodegeneration and excess glutamate + glutamine in ALS medulla. Neurology. (1999) 53:71–9. 10.1212/WNL.53.1.71 [DOI] [PubMed] [Google Scholar]
- 264.Carew JD, Nair G, Pineda-Alonso N, Usher S, Hu X, Benatar M. Magnetic resonance spectroscopy of the cervical cord in amyotrophic lateral sclerosis. Amyotroph Lateral Scler. (2011) 12:185–91. 10.3109/17482968.2010.515223 [DOI] [PubMed] [Google Scholar]
- 265.Ikeda K, Murata K, Kawase Y, Kawabe K, Kano O, Yoshii Y, et al. Relationship between cervical cord 1H-magnetic resonance spectroscopy and clinoco-electromyographic profile in amyotrophic lateral sclerosis. Muscle Nerve. (2013) 47:61–7. 10.1002/mus.23467 [DOI] [PubMed] [Google Scholar]
- 266.Verma G, Woo JH, Chawla S, Wang S, Sheriff S, Elman LB, et al. Whole-brain analysis of amyotrophic lateral sclerosis by using echo-planar spectroscopic imaging. Radiology. (2013) 267:851–7. 10.1148/radiol.13121148 [DOI] [PMC free article] [PubMed] [Google Scholar]
- 267.Pyra T, Hui B, Hanstock C, Concha L, Wong JC, Beaulieu C, et al. Combined structural and neurochemical evaluation of the corticospinal tract in amyotrophic lateral sclerosis. Amyotroph Lateral Scler. (2010) 11:157–65. 10.3109/17482960902756473 [DOI] [PubMed] [Google Scholar]
- 268.Chan S, Shungu DC, Douglas-Akinwande A, Lange DJ, Rowland LP. Motor neuron diseases: comparison of single-voxel proton MR spectroscopy of the motor cortex with MR imaging of the brain. Radiology. (1999) 212:763–9. 10.1148/radiology.212.3.r99au35763 [DOI] [PubMed] [Google Scholar]
- 269.Cervo A, Cocozza S, Saccà F, Giorgio SM, Morra VB, Tedeschi E, et al. The combined use of conventional MRI and MR spectroscopic imaging increases the diagnostic accuracy in amyotrophic lateral sclerosis. Eur J Radiol. (2015) 84:151–7. 10.1016/j.ejrad.2014.10.019 [DOI] [PubMed] [Google Scholar]
- 270.Kaufmann P, Pullman SL, Shungu DC, Chan S, Hays AP, Del Bene ML, et al. Objective tests for upper motor neuron involvement in amyotrophic lateral sclerosis (ALS). Neurology. (2004) 62:1753–7. 10.1212/01.WNL.0000125182.17874.59 [DOI] [PubMed] [Google Scholar]
- 271.Foerster BR, Carlos RC, Dwamena BA, Callaghan BC, Petrou M, Edden RA, et al. Multimodal MRI as a diagnostic biomarker for amyotrophic lateral sclerosis. Ann Clin Transl Neurol. (2014) 1:107–14. 10.1002/acn3.30 [DOI] [PMC free article] [PubMed] [Google Scholar]
- 272.Unrath A, Ludolph AC, Kassubek J. Brain metabolites in definite amyotrophic lateral sclerosis. A longitudinal proton magnetic resonance spectroscopy study. J Neurol. (2007) 254:1099–106. 10.1007/s00415-006-0495-2 [DOI] [PubMed] [Google Scholar]
- 273.Bowen BC, Pattany PM, Bradley WG, Murdoch JB, Rotta F, Younis AA, et al. MR imaging and localized proton spectroscopy of the precentral gyrus in amyotrophic lateral sclerosis. Am J Neuroradiol. (2000) 21:647–58. Available online at: http://www.ajnr.org/content/21/4/647.long [PMC free article] [PubMed] [Google Scholar]
- 274.Rule RR, Suhy J, Schuff N, Gelinas DF, Miller RG, Weiner MW. Reduced NAA in motor and non-motor brain regions in amyotrophic lateral sclerosis: a cross-sectional and longitudinal study. Amyotroph Lateral Scler Other Motor Neuron Disord. (2004) 5:141–9. 10.1080/14660820410017109 [DOI] [PMC free article] [PubMed] [Google Scholar]
- 275.Kalra S, Cashman NR, Genge A, Arnold DL. Recovery of N-acetylaspartate in corticomotor neurons of patients with ALS after riluzole therapy. Neuroreport. (1998) 9:1757–61. 10.1097/00001756-199806010-00016 [DOI] [PubMed] [Google Scholar]
- 276.Kalra S, Tai P, Genge A, Arnold DL. Rapid improvement in cortical neuronal integrity in amyotrophic lateral sclerosis detected by proton magnetic resonance spectroscopic imaging. J Neurol. (2006) 253:1060–3. 10.1007/s00415-006-0162-7 [DOI] [PubMed] [Google Scholar]
- 277.Kalra S, Cashman NR, Caramanos Z, Genge A, Arnold DL. Gabapentin therapy for amyotrophic lateral sclerosis: lack of improvement in neuronal integrity shown by MR spectroscopy. Am J Neuroradiol. (2003) 24:476–80. Available online at: http://www.ajnr.org/content/24/3/476.long [PMC free article] [PubMed] [Google Scholar]
- 278.Khiat A, D'Amour M, Souchon F, Boulanger Y. MRS study of the effects of minocycline on markers of neuronal and microglial integrity in ALS. Magn Reson Imaging. (2010) 28:1456–60. 10.1016/j.mri.2010.06.032 [DOI] [PubMed] [Google Scholar]
- 279.Atassi N, Ratai EM, Greenblatt DJ, Pulley D, Zhao Y, Bombardier J, et al. A phase I, pharmacokinetic, dosage escalation study of creatine monohydrate in subjects with amyotrophic lateral sclerosis. Amyotroph Lateral Scler. (2010) 11:508–13. 10.3109/17482961003797130 [DOI] [PMC free article] [PubMed] [Google Scholar]
- 280.Sacca F, Quarantelli M, Rinaldi C, Tucci T, Piro R, Perrotta G, et al. A randomized controlled clinical trial of growth hormone in amyotrophic lateral sclerosis: clinical, neuroimaging, and hormonal results. J Neurol. (2012) 259:132–8. 10.1007/s00415-011-6146-2 [DOI] [PubMed] [Google Scholar]
- 281.Garcia Santos JM, Inuggi A, Gomez Espuch J, Vazquez C, Iniesta F, Blanquer M, et al. Spinal cord infusion of stem cells in amyotrophic lateral sclerosis: magnetic resonance spectroscopy shows metabolite improvement in the precentral gyrus. Cytotherapy. (2016) 18:785–96. 10.1016/j.jcyt.2016.03.296 [DOI] [PubMed] [Google Scholar]
- 282.Govind V, Sharma KR, Maudsley AA, Arheart KL, Saigal G, Sheriff S. Comprehensive evaluation of corticospinal tract metabolites in amyotrophic lateral sclerosis using whole-brain 1H MR spectroscopy. PLoS ONE. (2012) 7:e35607. 10.1371/journal.pone.0035607 [DOI] [PMC free article] [PubMed] [Google Scholar]
- 283.Staff NP, Amrami KK, Howe BM. MRI abnormalities of peripheral nerve and muscle are common in amyotrophic lateral sclerosis and share features with multifocal motor neuropathy. Muscle Nerve. (2015) 52:137–9. 10.1002/mus.24630 [DOI] [PMC free article] [PubMed] [Google Scholar]
- 284.Cha CH, Patten BM. Amyotrophic lateral sclerosis: abnormalities of the tongue on magnetic resonance imaging. Ann Neurol. (1989) 25:468–72. 10.1002/ana.410250508 [DOI] [PubMed] [Google Scholar]
- 285.Simon NG, Lagopoulos J, Paling S, Pfluger C, Park SB, Howells J, et al. Peripheral nerve diffusion tensor imaging as a measure of disease progression in ALS. J Neurol. (2017) 264:882–90. 10.1007/s00415-017-8443-x [DOI] [PubMed] [Google Scholar]
- 286.Bryan WW, Reisch JS, McDonald G, Herbelin LL, Barohn RJ, Fleckenstein JL. Magnetic resonance imaging of muscle in amyotrophic lateral sclerosis. Neurology. (1998) 51:110–3. 10.1212/WNL.51.1.110 [DOI] [PubMed] [Google Scholar]
- 287.Gerevini S, Agosta F, Riva N, Spinelli EG, Pagani E, Caliendo G, et al. MR Imaging of brachial plexus and limb-girdle muscles in patients with amyotrophic lateral sclerosis. Radiology. (2016) 279:553–61. 10.1148/radiol.2015150559 [DOI] [PubMed] [Google Scholar]
- 288.Jenkins TM, Alix JJP, David C, Pearson E, Rao DG, Hoggard N, et al. Imaging muscle as a potential biomarker of denervation in motor neuron disease. J Neurol Neurosurg Psychiatry. (2018) 89:248–55. 10.1136/jnnp-2017-316744 [DOI] [PMC free article] [PubMed] [Google Scholar]
- 289.Ryan TE, Erickson ML, Verma A, Chavez J, Rivner MH, McCully KK. Skeletal muscle oxidative capacity in amyotrophic lateral sclerosis. Muscle Nerve. (2014) 50:767–74. 10.1002/mus.24223 [DOI] [PubMed] [Google Scholar]
- 290.Grehl T, Fischer S, Muller K, Malin JP, Zange J. A prospective study to evaluate the impact of 31P-MRS to determinate mitochondrial dysfunction in skeletal muscle of ALS patients. Amyotroph Lateral Scler. (2007) 8:4–8. 10.1080/17482960600765065 [DOI] [PubMed] [Google Scholar]
- 291.Zochodne DW, Thompson RT, Driedger AA, Strong MJ, Gravelle D, Bolton CF. Metabolic changes in human muscle denervation: topical 31P NMR spectroscopy studies. Magn Reson Med. (1988) 7:373–83. 10.1002/mrm.1910070402 [DOI] [PubMed] [Google Scholar]
- 292.Sharma KR, Kent-Braun JA, Majumdar S, Huang Y, Mynhier M, Weiner MW, et al. Physiology of fatigue in amyotrophic lateral sclerosis. Neurology. (1995) 45:733–40. 10.1212/WNL.45.4.733 [DOI] [PubMed] [Google Scholar]
- 293.Kent-Braun JA, Miller RG. Central fatigue during isometric exercise in amyotrophic lateral sclerosis. Muscle Nerve. (2000) 23:909–14. [DOI] [PubMed] [Google Scholar]
- 294.Hatazawa J, Brooks RA, Dalakas MC, Mansi L, Di Chiro G. Cortical motor-sensory hypometabolism in amyotrophic lateral sclerosis: a PET study. J Comput Assist Tomogr. (1988) 12:630–6. 10.1097/00004728-198807000-00019 [DOI] [PubMed] [Google Scholar]
- 295.Pagani M, Chio A, Valentini MC, Oberg J, Nobili F, Calvo A, et al. Functional pattern of brain FDG-PET in amyotrophic lateral sclerosis. Neurology. (2014) 83:1067–74. 10.1212/WNL.0000000000000792 [DOI] [PubMed] [Google Scholar]
- 296.Canosa A, Pagani M, Cistaro A, Montuschi A, Iazzolino B, Fania P, et al. 18F-FDG-PET correlates of cognitive impairment in ALS. Neurology. (2016) 86:44–9. 10.1212/WNL.0000000000002242 [DOI] [PubMed] [Google Scholar]
- 297.Van Weehaeghe D, Ceccarini J, Delva A, Robberecht W, Van Damme P, Van Laere K. Prospective validation of 18F-FDG brain PET discriminant analysis methods in the diagnosis of amyotrophic lateral sclerosis. J Nucl Med. (2016) 57:1238–43. 10.2967/jnumed.115.166272 [DOI] [PubMed] [Google Scholar]
- 298.Cistaro A, Valentini MC, Chiò A, Nobili F, Calvo A, Moglia C, et al. Brain hypermetabolism in amyotrophic lateral sclerosis: a FDG PET study in ALS of spinal and bulbar onset. Eur J Nucl Med Mol Imaging. (2012) 39:251–9. 10.1007/s00259-011-1979-6 [DOI] [PubMed] [Google Scholar]
- 299.D'hulst L, Van Weehaeghe D, Chiò A, Calvo A, Moglia C, Canosa A, et al. Multicenter validation of [18F]-FDG PET and support-vector machine discriminant analysis in automatically classifying patients with amyotrophic lateral sclerosis versus controls. Amyotroph Lateral Scler Frontotemporal Degener. 10.1080/21678421.2018.1476548. [Epub ahead of print]. [DOI] [PubMed] [Google Scholar]
- 300.Turner MR, Cagnin A, Turkheimer FE, Miller CC, Shaw CE, Brooks DJ, et al. Evidence of widespread cerebral microglial activation in amyotrophic lateral sclerosis: an [11C](R)-PK11195 positron emission tomography study. Neurobiol Dis. (2004) 15:601–9. 10.1016/j.nbd.2003.12.012 [DOI] [PubMed] [Google Scholar]
- 301.Zurcher NR, Loggia ML, Lawson R, Chonde DB, Izquierdo-Garcia D, Yasek JE, et al. Increased in vivo glial activation in patients with amyotrophic lateral sclerosis: assessed with [C]-PBR2(2016) 8. Neuroimage Clin. (2015) 7:409–14. 10.1016/j.nicl.2015.01.009 [DOI] [PMC free article] [PubMed] [Google Scholar]
- 302.Alshikho MJ, Zürcher NR, Loggia ML, Cernasov P, Chonde DB, Izquierdo Garcia D, et al. Glial activation colocalizes with structural abnormalities in amyotrophic lateral sclerosis. Neurology. (2016) 87:2554–61. 10.1212/WNL.0000000000003427 [DOI] [PMC free article] [PubMed] [Google Scholar]
- 303.Ratai E-M, Alshikho MJ, Zürcher NR, Loggia ML, Cebulla CL, Cernasov P, et al. Integrated imaging of [C]-PBR28 PET, MR diffusion and magnetic resonance spectroscopy H-MRS in amyotrophic lateral sclerosis. NeuroImage Clin. (2018) 20:357–64. 10.1016/j.nicl.2018.08.007 [DOI] [PMC free article] [PubMed] [Google Scholar]
- 304.Lloyd CM, Richardson MP, Brooks DJ, Al-Chalabi A, Leigh PN. Extramotor involvement in ALS: PET studies with the GABAA ligand [11C]flumazenil. Brain. (2000) 123:2289–96. 10.1093/brain/123.11.2289 [DOI] [PubMed] [Google Scholar]
- 305.Turner MR, Hammers A, Al-Chalabi A, Shaw CE, Andersen PM, Brooks DJ, et al. Distinct cerebral lesions in sporadic and ‘D90A’ SOD1 ALS: studies with [11C]flumazenil PET. Brain. (2005) 128:1323–9. 10.1093/brain/awh509 [DOI] [PubMed] [Google Scholar]
- 306.Turner MR, Rabiner EA, Hammers A, Al-Chalabi A, Grasby PM, Shaw CE, et al. [11C]-WAY100635 PET demonstrates marked 5-HT1A receptor changes in sporadic ALS. Brain. (2005) 128(Pt. 4):896–905. 10.1093/brain/awh428 [DOI] [PubMed] [Google Scholar]
- 307.Ikawa M, Okazawa H, Tsujikawa T, Matsunaga A, Yamamura O, Mori T, et al. Increased oxidative stress is related to disease severity in the ALS motor cortex. A PET study. Neurology. (2015) 84:2033–9. 10.1212/WNL.0000000000001588 [DOI] [PubMed] [Google Scholar]
- 308.Turner MR, Grosskreutz J, Kassubek J, Abrahams S, Agosta F, Benatar M, et al. Towards a neuroimaging biomarker for amyotrophic lateral sclerosis. Lancet Neurol. (2011b) 10:400–3. 10.1016/S1474-4422(11)70049-7 [DOI] [PubMed] [Google Scholar]
- 309.McComas AJ, Fawcett PR, Campbell MJ, Sica RE. Electrophysiological estimation of the number of motor units within a human muscle. J Neurol Neurosurg Psychiatry. (1971) 34:121–31. 10.1136/jnnp.34.2.121 [DOI] [PMC free article] [PubMed] [Google Scholar]
- 310.Gooch CL, Doherty TJ, Chan KM, Bromberg MB, Lewis RA, Stashuk DW, et al. Motor unit number estimation: a technology and literature review. Muscle Nerve. (2014) 50:884–93. 10.1002/mus.24442 [DOI] [PubMed] [Google Scholar]
- 311.Benmouna K, Milants C, Wang FC. Correlations between MUNIX and adapted multiple point stimulation MUNE methods. Clin Neurophysiol. (2017) 129:341–4. 10.1016/j.clinph.2017.11.012 [DOI] [PubMed] [Google Scholar]
- 312.Kadrie HA, Yates SK, Milner-Brown HS, Brown WF. Multiple point electrical stimulation of ulnar and median nerves. J Neurol Neurosurg Psychiatry. (1976) 39:973–85. [DOI] [PMC free article] [PubMed] [Google Scholar]
- 313.Shefner JM, Watson ML, Simionescu L, Caress JB, Burns TM, Maragakis NJ, et al. Multipoint incremental motor unit number estimation as an outcome measure in ALS. Neurology. (2011) 77:235–41. 10.1212/WNL.0b013e318225aabf [DOI] [PMC free article] [PubMed] [Google Scholar]
- 314.Yuen EC, Olney RK. Longitudinal study of fiber density and motor unit number estimate in patients with amyotrophic lateral sclerosis. Neurology. (1997) 49:573–8. 10.1212/WNL.49.2.573 [DOI] [PubMed] [Google Scholar]
- 315.Ridall PG, Pettitt AN, Henderson RD, McCombe PA. Motor unit number estimation–a Bayesian approach. Biometrics. (2006) 62:1235–50. 10.1111/j.1541-0420.2006.00577.x [DOI] [PubMed] [Google Scholar]
- 316.de Carvalho M, Swash M. Sensitivity of electrophysiological tests for upper and lower motor neuron dysfunction in ALS: a six-month longitudinal study. Muscle Nerve. (2010) 41:208–11. [DOI] [PubMed] [Google Scholar]
- 317.Aggarwal A, Nicholson G. Detection of preclinical motor neurone loss in SOD1 mutation carriers using motor unit number estimation. J Neurol Neurosurg Psychiatry. (2002) 73:199–201. 10.1136/jnnp.73.2.199 [DOI] [PMC free article] [PubMed] [Google Scholar]
- 318.Shefner JM, Cudkowicz ME, Zhang H, Schoenfeld D, Jillapalli D. Revised statistical motor unit number estimation in the Celecoxib/ALS trial. Muscle Nerve. (2007) 35:228–34. 10.1002/mus.20671 [DOI] [PubMed] [Google Scholar]
- 319.de Carvalho M, Swash M. Lower motor neuron dysfunction in ALS. Clin Neurophysiol. (2016) 127:2670–781. 10.1016/j.clinph.2016.03.024 [DOI] [PubMed] [Google Scholar]
- 320.van Dijk JP, Schelhaas HJ, Van Schaik IN, Janssen HM, Stegeman DF, Zwarts MJ. Monitoring disease progression using high-density motor unit number estimation in amyotrophic lateral sclerosis. Muscle Nerve. (2010) 42:239–44. 10.1002/mus.21680 [DOI] [PubMed] [Google Scholar]
- 321.Bostock H. Estimating motor unit numbers from a CMAP scan. Muscle Nerve. (2016) 53:889–96. 10.1002/mus.24945 [DOI] [PubMed] [Google Scholar]
- 322.Jacobsen AB, Bostock H, Tankisi H. Following disease progression in motor neuron disorders with 3 MUNE methods. Muscle Nerve. (2018) 59:82–7. 10.1002/mus.26304 [DOI] [PubMed] [Google Scholar]
- 323.Nandedkar SD, Nandedkar DS, Barkhaus PE, Stalberg EV. Motor unit number index (MUNIX). IEEE Trans Biomed Eng. (2004) 51:2209–11. 10.1109/TBME.2004.834281 [DOI] [PubMed] [Google Scholar]
- 324.Neuwirth C, Nandedkar S, Stalberg E, Barkhaus PE, Carvalho M, Furtula J, et al. Motor Unit Number Index (MUNIX): a novel neurophysiological marker for neuromuscular disorders; test-retest reliability in healthy volunteers. Clin Neurophysiol. (2011) 122:1867–72. 10.1016/j.clinph.2011.02.017 [DOI] [PubMed] [Google Scholar]
- 325.Neuwirth C, Barkhaus PE, Burkhardt C, Castro J, Czell D, de Carvalho M, et al. Tracking motor neuron loss in a set of six muscles in amyotrophic lateral sclerosis using the Motor Unit Number Index (MUNIX): a 15-month longitudinal multicentre trial. J Neurol Neurosurg Psychiatry. (2015) 86:1172–9. 10.1136/jnnp-2015-310509 [DOI] [PubMed] [Google Scholar]
- 326.Jacobsen AB, Bostock H, Fuglsang-Frederiksen A, Duez L, Beniczky S, Moller AT, et al. Reproducibility, and sensitivity to motor unit loss in amyotrophic lateral sclerosis, of a novel MUNE method: MScanFit MUNE. Clin Neurophysiol. (2017) 128:1380–8. 10.1016/j.clinph.2017.03.045 [DOI] [PubMed] [Google Scholar]
- 327.Boekestein WA, Schelhaas HJ, van Putten MJ, Stegeman DF, Zwarts MJ, van Dijk JP. Motor unit number index (MUNIX) versus motor unit number estimation (MUNE): a direct comparison in a longitudinal study of ALS patients. Clin Neurophysiol. (2012) 123:1644–9. 10.1016/j.clinph.2012.01.004 [DOI] [PubMed] [Google Scholar]
- 328.Neuwirth C, Braun N, Claeys KG, Bucelli R, Fournier C, Bromberg M, et al. Implementing Motor Unit Number Index (MUNIX) in a large clinical trial: real world experience from 27 centres. Clin Neurophysiol. (2018) 129:1756–62. 10.1016/j.clinph.2018.04.614 [DOI] [PubMed] [Google Scholar]
- 329.Escorcio-Bezerra ML, Abrahao A, Nunes KF, De Oliveira Braga NI, Oliveira ASB, Zinman L, et al. Motor unit number index and neurophysiological index as candidate biomarkers of presymptomatic motor neuron loss in amyotrophic lateral sclerosis. Muscle Nerve. (2018) 58:204–12. 10.1002/mus.26087 [DOI] [PubMed] [Google Scholar]
- 330.Neuwirth C, Barkhaus PE, Burkhardt C, Castro J, Czell D, de Carvalho M, et al. Motor Unit Number Index (MUNIX) detects motor neuron loss in pre-symptomatic muscles in Amyotrophic Lateral Sclerosis. Clin Neurophysiol. (2017) 128:495–500. 10.1016/j.clinph.2016.11.026 [DOI] [PubMed] [Google Scholar]
- 331.Grimaldi S, Duprat L, Grapperon AM, Verschueren A, Delmont E, Attarian S. Global motor unit number index sum score for assessing the loss of lower motor neurons in amyotrophic lateral sclerosis. Muscle Nerve. (2017) 56:202–6. 10.1002/mus.25595 [DOI] [PubMed] [Google Scholar]
- 332.Escorcio-Bezerra ML, Abrahao A, de Castro I, Chieia MAT, de Azevedo LA, Pinheiro DS, et al. MUNIX: reproducibility and clinical correlations in amyotrophic lateral sclerosis. Clin Neurophysiol. (2016) 127:2979–84. 10.1016/j.clinph.2016.06.011 [DOI] [PubMed] [Google Scholar]
- 333.de Carvalho M, Swash M. Nerve conduction studies in amyotrophic lateral sclerosis. Muscle Nerve. (2000) 23:344–52. [DOI] [PubMed] [Google Scholar]
- 334.Cheah BC, Vucic S, Krishnan AV, Boland RA, Kiernan MC. Neurophysiological index as a biomarker for ALS progression: validity of mixed effects models. Amyotroph Lateral Scler. (2011) 12:33–8. 10.3109/17482968.2010.531742 [DOI] [PubMed] [Google Scholar]
- 335.de Carvalho M, Scotto M, Lopes A, Swash M. Quantitating progression in ALS. Neurology. (2005) 64:1783–5. 10.1212/01.WNL.0000162036.76024.AB [DOI] [PubMed] [Google Scholar]
- 336.Geevasinga N, Menon P, Nicholson GA, Ng K, Howells J, Kril JJ, et al. Cortical function in asymptomatic carriers and patients with C9orf72 amyotrophic lateral sclerosis. JAMA Neurol. (2015) 72:1268–74. 10.1001/jamaneurol.2015.1872 [DOI] [PMC free article] [PubMed] [Google Scholar]
- 337.Vucic S, Kiernan MC. Novel threshold tracking techniques suggest that cortical hyperexcitability is an early feature of motor neuron disease. Brain. (2006) 129(Pt. 9):2436–46. 10.1093/brain/awl172 [DOI] [PubMed] [Google Scholar]
- 338.Park SB, Kiernan MC, Vucic S. Axonal excitability in amyotrophic lateral sclerosis: axonal excitability in ALS. Neurotherapeutics. (2017) 14:78–90. 10.1007/s13311-016-0492-9 [DOI] [PMC free article] [PubMed] [Google Scholar]
- 339.Bostock H, Cikurel K, Burke D. Threshold tracking techniques in the study of human peripheral nerve. Muscle Nerve. (1998) 21:137–58. [DOI] [PubMed] [Google Scholar]
- 340.Shibuta Y, Shimatani Y, Nodera H, Izumi Y, Kaji R. Increased variability of axonal excitability in amyotrophic lateral sclerosis. Clin Neurophysiol. (2013) 124:2046–53. 10.1016/j.clinph.2013.02.117 [DOI] [PubMed] [Google Scholar]
- 341.Kanai K, Kuwabara S, Misawa S, Tamura N, Ogawara K, Nakata M, et al. Altered axonal excitability properties in amyotrophic lateral sclerosis: impaired potassium channel function related to disease stage. Brain. (2006) 129(Pt. 4):953–62. 10.1093/brain/awl024 [DOI] [PubMed] [Google Scholar]
- 342.Vucic S, Kiernan MC. Upregulation of persistent sodium conductances in familial ALS. J Neurol Neurosurg Psychiatry. (2010) 81:222–7. 10.1136/jnnp.2009.183079 [DOI] [PubMed] [Google Scholar]
- 343.Kuo JJ, Siddique T, Fu R, Heckman CJ. Increased persistent Na(+) current and its effect on excitability in motoneurones cultured from mutant SOD1 mice. J Physiol. (2005) 563(Pt. 3):843–54. 10.1113/jphysiol.2004.074138 [DOI] [PMC free article] [PubMed] [Google Scholar]
- 344.Stys PK, Waxman SG, Ransom BR. Reverse operation of the Na(+)-Ca2+ exchanger mediates Ca2+ influx during anoxia in mammalian CNS white matter. Ann N Y Acad Sci. (1991) 639:328–32. 10.1111/j.1749-6632.1991.tb17321.x [DOI] [PubMed] [Google Scholar]
- 345.Geevasinga N, Menon P, Howells J, Nicholson GA, Kiernan MC, Vucic S. Axonal ion channel dysfunction in c9orf72 familial amyotrophic lateral sclerosis. JAMA Neurol. (2015) 72:49–57. 10.1001/jamaneurol.2014.2940 [DOI] [PubMed] [Google Scholar]
- 346.Kanai K, Yokota T, Shibuya K, Nakazato T, Kanouchi T, Iwai Y, et al. Increased motor axonal persistent sodium currents is associated with rapid regional spreading in amyotrophic lateral sclerosis. J Neurol Sci. (2017) 381:558 10.1016/j.jns.2017.08.3779 [DOI] [Google Scholar]
- 347.Kanai K, Shibuya K, Sato Y, Misawa S, Nasu S, Sekiguchi Y, et al. Motor axonal excitability properties are strong predictors for survival in amyotrophic lateral sclerosis. J Neurol Neurosurg Psychiatry. (2012) 83:734–8. 10.1136/jnnp-2011-301782 [DOI] [PubMed] [Google Scholar]
- 348.Rutkove SB. Electrical impedance myography: background, current state, and future directions. Muscle Nerve. (2009) 40:936–46. 10.1002/mus.21362 [DOI] [PMC free article] [PubMed] [Google Scholar]
- 349.Henderson RD, McCombe PA. Assessment of motor units in neuromuscular disease. Neurotherapeutics. (2017) 14:69–77. 10.1007/s13311-016-0473-z [DOI] [PMC free article] [PubMed] [Google Scholar]
- 350.Zaidman CM, Wang LL, Connolly AM, Florence J, Wong BL, Parsons JA, et al. Electrical impedance myography in Duchenne muscular dystrophy and healthy controls: a multicenter study of reliability and validity. Muscle Nerve. (2015) 52:592–7. 10.1002/mus.24611 [DOI] [PubMed] [Google Scholar]
- 351.Rutkove SB, Lee KS, Shiffman CA, Aaron R. Test-retest reproducibility of 50 kHz linear-electrical impedance myography. Clin Neurophysiol. (2006) 117:1244–8. 10.1016/j.clinph.2005.12.029 [DOI] [PubMed] [Google Scholar]
- 352.Rutkove SB, Caress JB, Cartwright MS, Burns TM, Warder J, David WS, et al. Electrical impedance myography correlates with standard measures of ALS severity. Muscle Nerve. (2014) 49:441–3. 10.1002/mus.24128 [DOI] [PubMed] [Google Scholar]
- 353.Rutkove SB, Caress JB, Cartwright MS, Burns TM, Warder J, David WS, et al. Electrical impedance myography as a biomarker to assess ALS progression. Amyotroph Lateral Scler. (2012) 13:439–45. 10.3109/17482968.2012.688837 [DOI] [PMC free article] [PubMed] [Google Scholar]
- 354.Garmirian LP, Chin AB, Rutkove SB. Discriminating neurogenic from myopathic disease via measurement of muscle anisotropy. Muscle Nerve. (2009) 39:16–24. 10.1002/mus.21115 [DOI] [PMC free article] [PubMed] [Google Scholar]
- 355.Sanchez B, Rutkove SB. Electrical impedance myography and its applications in neuromuscular disorders. Neurotherapeutics. (2017) 14:107–18. 10.1007/s13311-016-0491-x [DOI] [PMC free article] [PubMed] [Google Scholar]
- 356.Chio A, Logroscino G, Hardiman O, Swingler R, Mitchell D, Beghi E, et al. Prognostic factors in ALS: a critical review. Amyotroph Lateral Scler. (2009) 10:310–23. 10.3109/17482960802566824 [DOI] [PMC free article] [PubMed] [Google Scholar]
- 357.McIlduff CE, Yim SJ, Pacheck AK, Rutkove SB. Optimizing electrical impedance myography of the tongue in amyotrophic lateral sclerosis. Muscle Nerve. (2017) 55:539–43. 10.1002/mus.25375 [DOI] [PubMed] [Google Scholar]
- 358.Shellikeri S, Yunusova Y, Green JR, Pattee GL, Berry JD, Rutkove SB, et al. Electrical impedance myography in the evaluation of the tongue musculature in amyotrophic lateral sclerosis. Muscle Nerve. (2015) 52:584–91. 10.1002/mus.24565 [DOI] [PMC free article] [PubMed] [Google Scholar]
- 359.de Carvalho M, Dengler R, Eisen A, England JD, Kaji R, Kimura J, et al. Electrodiagnostic criteria for diagnosis of ALS. Clin Neurophysiol. (2008) 119:497–503. 10.1016/j.clinph.2007.09.143 [DOI] [PubMed] [Google Scholar]
- 360.Vucic S, Kiernan MC. Transcranial magnetic stimulation for the assessment of neurodegenerative disease. Neurotherapeutics. (2017) 14:91–106. 10.1007/s13311-016-0487-6 [DOI] [PMC free article] [PubMed] [Google Scholar]
- 361.Barker AT, Jalinous R, Freeston IL. Non-invasive magnetic stimulation of human motor cortex. Lancet. (1985) 1:1106–7. 10.1016/S0140-6736(85)92413-4 [DOI] [PubMed] [Google Scholar]
- 362.Vucic S, Ziemann U, Eisen A, Hallett M, Kiernan MC. Transcranial magnetic stimulation and amyotrophic lateral sclerosis: pathophysiological insights. J Neurol Neurosurg Psychiatry. (2013) 84:1161–70. 10.1136/jnnp-2012-304019 [DOI] [PMC free article] [PubMed] [Google Scholar]
- 363.Vucic S, Nicholson GA, Kiernan MC. Cortical hyperexcitability may precede the onset of familial amyotrophic lateral sclerosis. Brain. (2008) 131(Pt. 6):1540–50. 10.1093/brain/awn071 [DOI] [PubMed] [Google Scholar]
- 364.Menon P, Geevasinga N, Yiannikas C, Howells J, Kiernan MC, Vucic S. Sensitivity and specificity of threshold tracking transcranial magnetic stimulation for diagnosis of amyotrophic lateral sclerosis: a prospective study. Lancet Neurol. (2015) 14:478–84. 10.1016/S1474-4422(15)00014-9 [DOI] [PubMed] [Google Scholar]
- 365.Menon P, Geevasinga N, van den Bos M, Yiannikas C, Kiernan MC, Vucic S. Cortical hyperexcitability and disease spread in amyotrophic lateral sclerosis. Eur J Neurol. (2017) 24:816–24. 10.1111/ene.13295 [DOI] [PubMed] [Google Scholar]
- 366.Vucic S, Cheah BC, Yiannikas C, Kiernan MC. Cortical excitability distinguishes ALS from mimic disorders. Clin Neurophysiol. (2011) 122:1860–6. 10.1016/j.clinph.2010.12.062 [DOI] [PubMed] [Google Scholar]
- 367.Floyd AG, Yu QP, Piboolnurak P, Tang MX, Fang Y, Smith WA, et al. Transcranial magnetic stimulation in ALS: utility of central motor conduction tests. Neurology. (2009) 72:498–504. 10.1212/01.wnl.0000341933.97883.a4 [DOI] [PMC free article] [PubMed] [Google Scholar]
- 368.Mills KR. The natural history of central motor abnormalities in amyotrophic lateral sclerosis. Brain. (2003) 126(Pt. 11):2558–66. 10.1093/brain/awg260 [DOI] [PubMed] [Google Scholar]
- 369.Vucic S, Lin CS, Cheah BC, Murray J, Menon P, Krishnan AV, et al. Riluzole exerts central and peripheral modulating effects in amyotrophic lateral sclerosis. Brain. (2013) 136(Pt. 5):1361–70. 10.1093/brain/awt085 [DOI] [PubMed] [Google Scholar]
- 370.Feng Z, Yasui Y. Statistical considerations in combining biomarkers for disease classification. Dis Mark. (2004) 20:45–51. 10.1155/2004/214152 [DOI] [PMC free article] [PubMed] [Google Scholar]
- 371.Kuffner R, Zach N, Norel R, Hawe J, Schoenfeld D, Wang L, et al. Crowdsourced analysis of clinical trial data to predict amyotrophic lateral sclerosis progression. Nat Biotechnol. (2015) 33:51–7. 10.1038/nbt.3051 [DOI] [PubMed] [Google Scholar]
- 372.Gomeni R, Fava M. Amyotrophic lateral sclerosis disease progression model. Amyotroph Lateral Scler Frontotemporal Degener. (2014) 15:119–29. 10.3109/21678421.2013.838970 [DOI] [PubMed] [Google Scholar]
- 373.Lunetta C, Lizio A, Melazzini MG, Maestri E, Sansone VA. Amyotrophic Lateral Sclerosis Survival Score (ALS-SS): a simple scoring system for early prediction of patient survival. Amyotroph Lateral Scler Frontotemporal Degener. (2015) 17:93–100. 10.3109/21678421.2015.1083585 [DOI] [PubMed] [Google Scholar]
- 374.Benatar M, Boylan K, Jeromin A, Rutkove SB, Berry J, Atassi N, et al. ALS biomarkers for therapy development: state of the field and future directions. Muscle Nerve. (2016) 53:169–82. 10.1002/mus.24979 [DOI] [PMC free article] [PubMed] [Google Scholar]