Abstract
Patient satisfaction and department efficiency are central pillars in defining quality in medicine. Patient satisfaction is often linked to wait times. We describe a novel method to study workflow and simulate solutions to improve efficiency, thereby decreasing wait times and adding value. We implemented a real-time location system (RTLS) in our academic breast-imaging department to study workflow, including measuring patient wait time, quantifying equipment utilization, and identifying bottlenecks. Then, using discrete event simulation (DES), we modeled solutions with changes in staffing and equipment. Nine hundred and ninety-nine patient encounters were tracked over a 10-week period. The RTLS system recorded 551,512 raw staff and patient time stamps, which were analyzed to produce 17,042 staff and/or patient encounter time stamps. Mean patient wait time was 27 min. The digital breast tomosynthesis (DBT) unit had the highest utilization rate and was identified as a bottleneck. DES predicts a 19.2% reduction in patient length of stay with replacement of a full field digital mammogram (FFDM) unit by a DBT unit and the addition of technologists. Through integration of RTLS with discrete event simulation testing, we created a model based on real-time data to accurately assess patient wait times and patient progress through an appointment, evaluate patient staff-interaction, identify system bottlenecks, and quantitate potential solutions. This quality improvement initiative has important implications, potentially allowing data-driven decisions for staff hiring, equipment purchases, and department layout.
Keywords: Patient experience, Breast imaging, Value, Efficiency, Real-time location system
Introduction
In the current competitive and cost constrained medical practice environment, radiology departments must simultaneously prioritize patient centered care and fiscal responsibility. Prior studies have identified key factors in patient satisfaction. For example, in an analysis of patient complaints generated over 10 years in an academic radiology department, 44.5% of complaints were associated with operations and 20.2% were associated with delays [1]. Long patient wait times are strongly linked not only to patient satisfaction but also to confidence in the care provided, as longer wait times lead patients to perceive that care they received was poor quality [2].
Value in health care is defined as quality relative to cost and therefore is closely linked to efficiency in radiology workflow [3]. The workflow of an imaging facility impacts both patient experience and practice efficiency. The lean methodology of value stream mapping is a technique that visually depicts workflow with the aim of identifying and minimizing waste. Through our own prior quality improvement initiatives, we have found attempts to collect accurate and meaningful workflow data logistically challenging and imprecise using picture archiving and communications systems (PACS) and electronic medical record (EMR) resources. In our experience, gathering data to accurately depict workflow is complex, as it typically requires some active component of manual data collection. Such barriers have limited broad utilization of data to assess workflow and potential solutions targeting efficiency and patient centered care.
Some of these challenges can be overcome with use of real-time location systems (RTLS) that enable accurate real-time tracking of assets or people. RTLS has been utilized with various applications in the healthcare settings, including hospital intensive care units, operating rooms, and emergency departments [4–6]. Use of RTLS data to drive process improvements led one hospital to dramatically reduce their length of stay in the emergency department [5]. RTLS-driven asset tracking at another medical center resulted in decreased time workers spent looking for infusion pumps [7].
Information gleaned from RTLS data can be applied to lean methodology to improve productivity, costs, and quality [8, 9]. Discrete event simulation (DES), used in industry to model complex systems, has been used as a tool in process improvement and lean methodology in health care. Case studies report the use of DES to validate surgical suite design for improved functional layout, and coupled with RTLS data, used for planning of exam room clinic capacity for increased patient numbers [10].
Breast imaging brings a unique series of challenges related to complex patient workflow, equipment, and radiologist interactions and is therefore an ideal pilot target in a radiology department for intelligent decision-making. We are unaware of such a quality improvement initiative using RTLS-driven DES modeling in radiology or breast imaging.
The purpose of our study was to (1) accurately define department workflow, measure patient wait times, review technologists’ activities by location, and calculate exam room utilization via RTLS in a novel way and (2) use the data collected to simulate the impact on workflow of various changes in staffing and equipment.
Methods
This study was submitted to and acknowledged by the institutional review board and determined to not constitute human subjects research, thus not requiring IRB approval.
Environment
Our academic breast-imaging division has four sites, two hospital-based outpatient centers, and three stand-alone outpatient sites. This study was performed at the largest hospital-based outpatient breast-imaging department where both full field digital mammograms (FFDM) and digital breast tomosynthesis (DBT) exams are performed and where we have identified the longest patient wait times. At this site, approximately 4600 screening mammograms (3000 DBT, 1600 FFDM), 2850 diagnostic mammograms (1500 DBT, 1350 FFDM), and 1800 ultrasound exams are performed annually. Eight hundred ninety-two ultrasound and mammographic-guided procedures are performed per year (each week approximately seven ultrasound guided biopsies, eight needle localizations, and two stereotactic guided procedure are performed).
At the time the study was performed, there were six technologists: three performed only mammography exams, and three performed mammography and breast ultrasound exams. The breast imaging division was comprised of nine attending breast imaging specialist radiologists (seven of whom rotated through the hospital-based center) and two breast-imaging fellows. On average, two breast imagers and up to one breast fellow staff the hospital-based center.
The hospital-based breast-imaging clinic has three mammography units, 2 FFDM units and 1 DBT unit, and two ultrasound rooms, one of which is used for procedures. In addition, there is one prone stereotactic biopsy unit. Screening patients are scheduled every 10 min; diagnostic patients are scheduled every 20 min.
Data Collection
A RTLS was installed throughout the clinic, which permitted automated location data collection for patients and staff. We selected an RTLS system (CenTrak) that utilizes both radiofrequency as well as infrared (IR) technology. Infrared technology does not penetrate walls and thus provides room-level accuracy, which was essential to our study [4, 11].
The RTLS system works using a combination of infrared (IR) identification (ID) and radio frequency (RF) communication. Discrete IR monitors were installed on the ceilings, adjacent to room doors and in the hallways. Approximately 30 monitors were placed throughout the clinic. These monitors transmit an IR ID code that identifies specific locations in the clinic. Staff and patient badges provide an individual unique ID code. When a badge or tag is within the range of a monitor’s IR signal, it sends both the tag ID and the received monitor ID via RF communication to the central server. Badges transmit locations every 3 s, and the server time-stamps each location signal it receives. Basic functional testing was performed at installation to validate the accuracy and responsiveness of the system.
IR monitors were placed in the waiting rooms, dressing rooms, exam and procedure rooms, hallways, the technologists’ work room, and the radiology reading room. Badges were distributed to sonographers, technologists, technologist aides, and radiologists. At check-in, following a brief verbal explanation of the project by front desk staff as well as distribution of a patient handout, patients were offered an identification badge on a disposable bracelet. RTLS data was then compiled to create a “location history” for each patient and staff member.
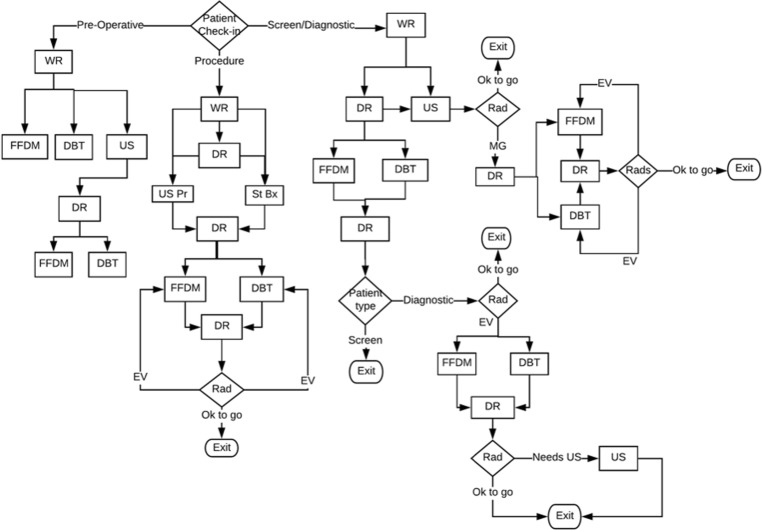
Data was collected from January 23, 2017 to March 18, 2017. Raw data files coupled with detailed workflow descriptions (Fig. 1) categorized data into patient visit and procedure types. Structured Query Language (SQL) code was written to recognize a pattern of activities or rules for each predetermined category. Patient encounter types were defined by movement of a patient through the department, the resources the patient utilized, and the staff with whom they interacted.
Fig. 1.
Breast imaging department workflow model. WR waiting room, FFDM full field digital mammogram, DBT digital breast tomosynthesis, US ultrasound, DR dressing room, US Pr ultrasound procedure, St Bx stereotactic biopsy, Rad radiologist, EV extra views, MG mammogram
To confirm accurate data from the RTLS system, we cross-referenced patient encounters and types of imaging procedures measured by the RTLS system with patient encounters and exam codes sourced from Epic (Epic Systems Corporation, version 2014, Verona, WI). Using this comparison, we confirmed consistent data capture by the RTLS system. We did not use time stamp data from Epic as based on previous projects it is known to be inconsistent related to variable technologist work patterns.
Primary Outcome Measures
Primary outcome measures were patient wait time and equipment utilization. Patient wait times were defined as the number of minutes a patient spent in a waiting room and/or dressing room. “Patient specific utilization” was defined as the percentage of the workday that rooms were occupied by a patient. “Overall time utilization” was defined as the percentage of the available workday that an exam or procedure room was occupied by patients but also by staff alone, for purposes such as cleaning or preparing the room for the next patient. We cross-referenced patient wait time with resources to identify bottlenecks in the workflow. We recorded technologist location when an exam room was available and a patient was waiting. We also reviewed radiologist location to evaluate if the radiologist impeded patient throughput.
Outcome Modeling
Patients that entered the mammography exam room more than once during their visit, or who had both a mammogram and ultrasound exam, were classified as a diagnostic patient. Patients who entered the mammogram exam room only once during their visit were classified as a single mammogram type patient, meaning the patient had either a screening mammogram or a straightforward diagnostic mammography exam. The data for our simulation was based on this division of patient encounters. Procedure patient types, image guided biopsy with ultrasound or stereotactic guidance, pre-operative localization with mammography or ultrasound, and sentinel node injections were categorized based on the modality of the procedure room utilized.
To model staffing and equipment resources, we developed a discrete event simulation (DES) using Flexsim Healthcare Software (version 5.1, 9/9/2016, Orem, UT). DES [12] is a mathematical and logical model of a physical system that changes at precise points in time. This is widely used in industry to model complex systems to understand resource interdependencies and is applied to improve throughput. A discrete event simulation was introduced to provide scale, run scenarios, collect predicted outcomes, and visualize the workflow and environment. We created a DES model for breast imaging workflows informed by the RTLS data.
With clinic layout drawings, a simulated environment was constructed. The RTLS data was analyzed to develop statistical distributions as inputs for patient encounters, arrival times, procedure types, and lengths of stay. Statistical distributions were applied to these trends to establish the probability of each visit type occurring throughout the day.
Introducing changes to the resources available, both equipment and staff created additional scenarios in which to test for changes in the measured outcomes. Simulation was used to test how changes in staffing and equipment would affect efficiency: the addition of one mammography technologist, the addition of one mammography technologist plus one technologist trained in both mammography and ultrasound, and replacement of one of the FFDM units with a DBT unit.
Results
Primary Outcome Measures
Over the course of 10 weeks, 999 patient encounters were tracked, representing 72% of the total number of patients that visited the department. Staff and/or patient encounter time stamps (17,042) were assessed.
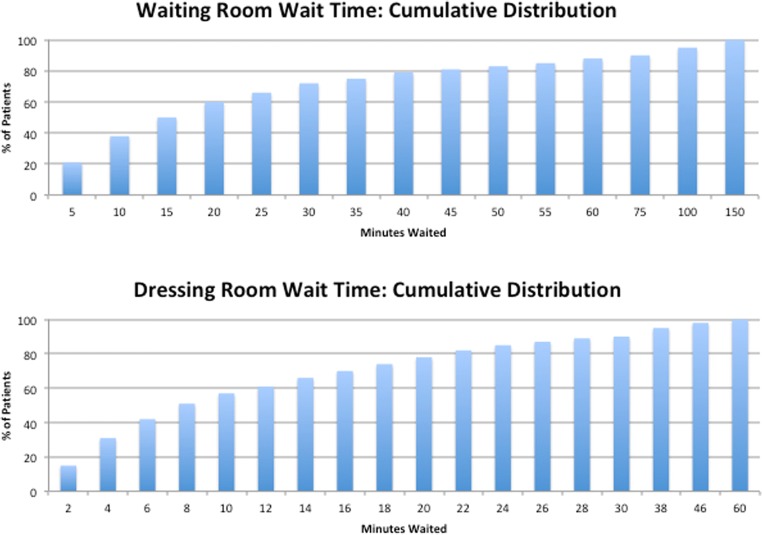
The mean patient time in the waiting room was 27 min (SD 32 min). The mean patient time in the dressing room was 12 min (SD 12 min) (Fig. 2).
Fig. 2.
Eighty percent of patients waited 45 min or less in the waiting room while 50% of patients waited 15 min or less. Eighty percent of patients waited 20 min or less in the dressing room, while 50% of patients waited 8 min or less
The average patient utilization time of the mammogram exam rooms was 9 min. The average patient utilization time of the ultrasound rooms was 23 min. The average patient utilization for ultrasound-guided procedures was 25 min and for the stereotactic prone biopsy room was 58 min.
The DBT exam room had the highest patient utilization at 32%. The mean total occupied utilization (meaning a patient and/or a technologist was in the room) of the DBT room was 46%. The DBT exam room patient utilization was highest between 8 am and 12 pm, reaching 42%.
Seventy-two percent of patients were tracked; therefore, our data shows a lower patient specific utilization than if there had been 100% patient tracking. If we model to account for 100% of patient visits, the DBT room utilization would increase to 50%.
For 21% of patients waiting for the DBT exam room, the DBT exam room was occupied for 100% of their wait. The average wait time for a diagnostic ultrasound exam was 30 min. Our data showed that in 100% of events, ultrasound room B is only used if ultrasound room A is in use at the same time. The average wait time for an ultrasound procedure was 28 min, and the average wait for a stereotactic biopsy was 21 min. The average wait for a physician and/or technologist for an ultrasound exam or procedure was 30 min and 28 min respectively.
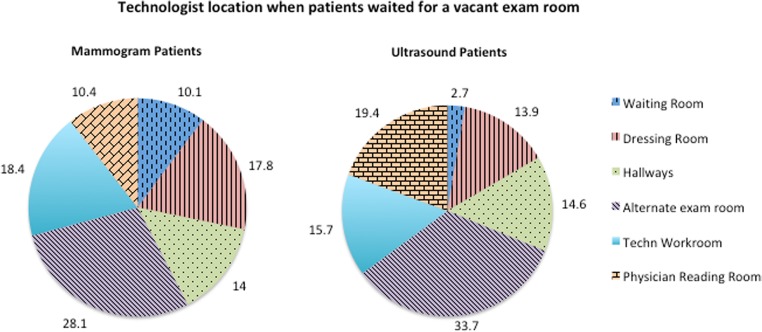
We assessed technologist location, given the condition that a patient waited for a vacant exam room (Fig. 3). Twenty-eight percent of patients wait for technologists who are in an different exam room with another patient or who are moving around the hallways (14%) of this very spread out department.
Fig. 3.
If a patient waited for a vacant exam room, the technologist was busy with patient facing activities, in the waiting room, dressing room, or an alternate exam room, 56% of the wait
Outcome Modeling
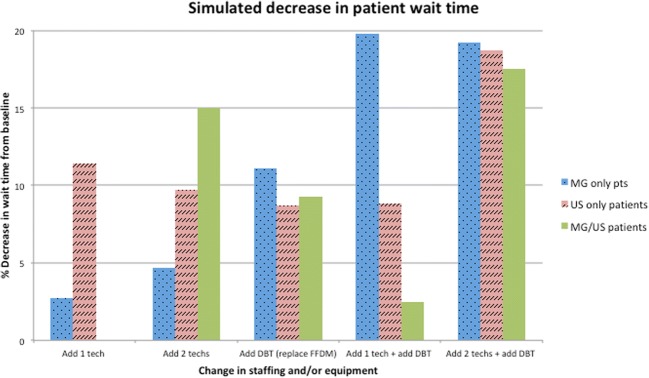
For mammogram only patients, a 19.2% reduction in length of stay is predicted with the replacement of one FFDM unit with a DBT unit and the addition of one mammography technologist. For patients who undergo mammogram and ultrasound or ultrasound alone, 18.7% and 17.5% reductions in length of stay are predicted, respectively with an additional DBT unit (to replace an FFDM unit) and both a mammogram technologist and a dual trained technologist (Fig. 4).
Fig. 4.
Simulation predicts a 19.2% reduction in patient length of stay with replacement of a full field digital mammogram (FFDM) unit by a DBT unit and the addition of technologists. MG mammogram, Tech technologist, US ultrasound, DBT digital breast tomosynthesis, FFDM full field digital mammogram
Discussion
RTLS accurately measures patient wait times, staff location, equipment and exam room utilization throughout the breast-imaging clinic. We identified equipment and staffing bottlenecks in patient throughput. Modeling variable changes in staffing and equipment, we estimated the impact on wait times and efficiency. We are optimistic that this process will inform future operational decisions, thereby increasing value by decreasing patient wait times (frequently correlated with improved patient experience) and increasing efficiency.
In an imaging department, exam room utilization includes the time for the actual exam, time needed to prepare the equipment, time to explain the exam to the patient, as well as time to clean the equipment and prepare the room for the next patient. With short exam times in breast imaging, the preparation and clean-up time occupy a greater percentage of the room utilization compared to other areas with longer procedures such as MRI or fluoroscopy. Exam room utilization does not equate perfectly to equipment utilization; however, they are inseparable. Our average mammography patient utilization is 9 min; the technologists report that patient positioning occupies the largest component of this time. At our institution, the patient fills out a patient history form prior to entering the exam room and any follow-up questions are asked by the technologist in a private dressing room. Only verification of patient identification is necessary in the exam room prior to beginning the mammogram exam.
There are some conclusions from our data regarding workflow bottlenecks. For example, the DBT exam room was fully occupied during 21% of patients’ waits, and for approximately two thirds of patients, the room was occupied 50% of their wait. This demonstrates that the lack of DBT equipment impedes patient throughput at our institution. This conclusion was supported by the simulation results, demonstrating that an 11.1% reduction in length of stay could be achieved with the addition of a second tomosynthesis unit. As our data demonstrated, the age and features of equipment may lead to patient requests (for DBT rather than FFDM) or preferential use by technologists and radiologists, leading to bottlenecks waiting for the preferred equipment. This information may be important for decisions regarding equipment purchases and operational efficiencies.
The system allowed us to study the pattern of technologist movements. Assessing technologist location when a patient is waiting for a vacant exam room helps identify workflow barriers (Fig. 3). When patients were waiting to enter a vacant exam room, the technologist was located in the hallway during 14% of their wait time, suggesting that alternate methods of communication, such as interactive viewing monitors, could spare technologists walking in order to communicate with team members, resulting in improved efficiency Additionally, for 28% of patients’ wait, the exam room was vacant but the technologist was with another patient. This suggests changes in technologists staffing and availability could improve patient throughput. Such directed data analysis could impact space planning, staffing decisions, and technologist–radiologist communications.
Maximizing clinic efficiency is central to increasing value [3]. Integration of an RTLS with discrete event simulation may permit radiology departments to operate with greater focus on efficiency, customer service, and throughput. These are strongly desired outcomes in the current medical environment of cost containment and competition to serve patients.
The study has several limitations. Less than 100% patient and staff tracking yielded imperfect data. Initial lower percentages of patient tracking were in part due to systems issues. Education and training time were required for rotating staff to become comfortable with the project and the process of administering patient tags, as this is a large outpatient center. Initial meetings with front desk staff and technologists prior to project implementation discussed the project purpose, use of the collected data, and logistical steps of tag distribution and retrieval. Additional meetings throughout the pilot project allowed us to troubleshoot any logistical issues of tag distribution and to share information on collected data. While most patients were eager to participate in the study, some had reservations about wearing such a tracking device and chose not to participate.
The RTLS system does not record data about specific activities. We accurately know where someone is located and the time spent in that location, but we must infer the exact activity being performed.
Our study was limited to a hospital-based, academic outpatient facility, and our results may not be generalizable to another academic institution- or community-based or private practice setting. The method of data collection and analysis however should be transferrable to a multitude of settings.
Lastly, heuristic data cleaning was sufficient for this pilot study, but is imperfect, and would need to be addressed with larger scale long-term system implementation. This limited our ability to apply further statistical validation models to our data.
As discussed above, replacement of an FFMD unit with a DBT unit, as well as addition of two technologists (one mammogram trained, and one dual trained in mammogram and ultrasound) can yield a 20% reduction in wait time and average length of stay. Reduced patient length of stay allows for improved patient experience and increased efficiency of department resources. Of course, this must be weighed against the cost of equipment and hiring. The critical question, not answered by our data, is: what is the ideal or correct time to act? A balance must be achieved of satisfied patients confident in their care who will be retained in the care system versus resources used. It is the value statement we strive to achieve. The department will consider many options in planning for change moving forward including shifting the times when patients are scheduled, altering what type of exam occurs at what times in the day, assessing staffing throughout the day to know when fewer or more technologists should be available, hiring of technology assistants to help decrease logistical burdens of the technologist’s work flow, and assessing availability of the radiologists. These types of workflow changes can now be planed, implemented, and tested.
In the future, a system with dynamic information could provide the clinic with improved efficiency as well as with superior staff and patient experience. Our vision is to integrate RTLS and the electronic medical record (EMR) with real-time visual displays throughout the clinic. Staff badges could be linked, alerting them to a “ready status” or indicating a next step in patient care. Real-time display of patient and staff location and status would improve awareness so that technologists could view alerts and ready a patient based on room availability, thereby decreasing wait time between patients.
We foresee the system sending alerts to patients for possible delays in their appointments and even rearranging schedules based on real-time events.
Conclusion
Through pilot implementation of a real-time location system, and development of a simulation, we were able to understand system bottlenecks in patient throughput and model variable solutions that would result in decreased patient wait time and increased equipment utilization.
Acknowledgements
We would like to thank Charlene Tomaselli and the Johns Hopkins (Radiology) Information Technology team.
Sources of Support
This research project was sponsored in part by St. Onge Company, a supply chain engineering company. The RTLS hardware was a donation provided by CenTrak for research purposes only.
Footnotes
Publisher’s Note
Springer Nature remains neutral with regard to jurisdictional claims in published maps and institutional affiliations.
References
- 1.Salazar G, Quencer K, Aran S, Abujudeh H. Patient satisfaction in radiology: qualitative analysis of written complaints generated over a 10-year period in an academic medical center. J Am Coll Radiol. 2013;10(7):513–517. doi: 10.1016/j.jacr.2013.03.013. [DOI] [PubMed] [Google Scholar]
- 2.Bleustein C, Rothschild DB, Valen A, Valatis E, Schweitzer L, Jones R. Wait times, patient satisfaction scores, and the perception of care. Am J Manag Care. 2014;20(5):393–400. [PubMed] [Google Scholar]
- 3.Porter ME. What is value in health care? N Engl J Med. 2010;363(26):2477–2481. doi: 10.1056/NEJMp1011024. [DOI] [PubMed] [Google Scholar]
- 4.Kamel Boulos MN, Berry G. Real-time locating systems (RTLS) in healthcare: a condensed primer. International journal of health geographics. 2012;11:25. doi: 10.1186/1476-072X-11-25. [DOI] [PMC free article] [PubMed] [Google Scholar]
- 5.[No authors listed]: Real-time tracking data drive process improvements, even while ED volumes continue to climb. ED Manag. 24 (6): 67–70, 2012 [PubMed]
- 6.Cobbley B: Easing patient flow. How an RTLS solution can help ES efficiency. Health Facil Manag 24(12):43–44 7, 201 [PubMed]
- 7.Kehoe B. Tracking IV pumps in real time. Mater Manag Health Care. 2007;16(7):20–24. [Google Scholar]
- 8.Johnson JE, Smith AL, Mastro KA. From Toyota to the bedside: nurses can lead the lean way in health care reform. Nurs Adm Q. 2012;36(3):234–242. doi: 10.1097/NAQ.0b013e318258c3d5. [DOI] [PubMed] [Google Scholar]
- 9.Melanson SE, Goonan EM, Lobo MM, Baum JM, Paredes JD, Santos KS, Gustafson ML, Tanasijevic MJ. Applying Lean/Toyota production system principles to improve phlebotomy patient satisfaction and workflow. Am J Clin Pathol. 2009;132(6):914–919. doi: 10.1309/AJCP7FIKZVVTFTXQ. [DOI] [PubMed] [Google Scholar]
- 10.Cai H, Jia J: Using discrete event simulation (DES) to support performance-driven healthcare design. HERD, 2018. 10.1177/1937586718801910 [DOI] [PubMed]
- 11.F. Zafari, A. Gkelias, K. Leung A survey of indoor localization systems and technologies, [online] Available: https://arxiv.org/abs/1709.01015. Accessed 4 Sept 2017
- 12.M.C. Albrecht PE. Introduction to discrete event simulation [Available from: http://www.albrechts.com/mike/DES/Introduction to DES.pdf. Accessed Jan 2010


