

Abstract
The measurement of absolute metabolite concentrations in small samples remains a significant analytical challenge. This is particularly the case when the sample volume is only a few microliters or less and cannot be determined accurately via direct measurement. We previously developed volume determination with two standards (VDTS) as a method to address this challenge for biofluids. As a proof-of-principle, we applied VDTS to NMR spectra of polar metabolites in the hemolymph (blood) of the tiny yet powerful genetic model Drosophila melanogaster. This showed that VDTS calculation of absolute metabolite concentrations in fed versus starved Drosophila larvae is more accurate than methods utilizing normalization to total spectral signal. Here, we introduce paired VDTS (pVDTS), an improved VDTS method for biofluids and solid tissues that implements the statistical power of paired control and experimental replicates. pVDTS utilizes new equations that also include a correction for dilution errors introduced by the variable surface wetness of solid samples. We then show that metabolite concentrations in Drosophila larvae are more precisely determined and logically consistent using pVDTS than using the original VDTS method. The refined pVDTS workflow described in this study is applicable to a wide range of different tissues and biofluids.
Keywords: metabolomics, nuclear magnetic resonance spectroscopy, Drosophila melanogaster, small volume, metabolites, larva, hemolymph, biofluid, tissue, sex-specific
Introduction
Metabolomics is the measurement via nuclear magnetic resonance (NMR) spectroscopy and/or mass spectrometry (MS) of multiple metabolites in samples of whole organisms, tissues, or biofluids.1−6 A snapshot of the small molecule profile (metabolome) of a biological sample provides important biological information that is complementary to that obtained from the proteome and the transcriptome. NMR and MS metabolomics have greatly increased our understanding of many biological and medical processes,7−11 including physiological changes during development and aging, and metabolic responses to dietary manipulations.12−17 If the volumes of biofluid analytes (e.g., blood or cerebrospinal fluid) are sufficient for accurate measurement, then sample-to-sample differences in volumes can be accounted for in a straightforward manner prior to chemometric analysis. In these analytes of known volume, the absolute concentration of metabolites in the starting sample can then be determined by reference to a single internal standard. In contrast, where analyte volumes are not known or are difficult to measure accurately (e.g., submicroliter samples), the accurate quantitation of absolute metabolite concentrations remains a significant challenge. In these cases, metabolite spectra are often normalized using methods based on their total signal strength such as probabilistic quotient normalization (PQN).18 These methods, however, tend to be ineffective when samples with very different total signal strengths (e.g., >50%) are being compared. Such circumstances can arise either when sample-to-sample differences in volume are large or when a large fraction of the most abundant metabolites in control versus experimental samples differ greatly in concentration. This can lead to failures to provide logically self-consistent sets of peak intensities in PCA loadings plots; for example, we found that different NMR multiplets from the same metabolite could demonstrate opposite sign in PQN-treated Drosophila larval hemolymph PCA loadings as shown in ref (19). We previously reported a generally applicable procedure, called volume determination using two standards (VDTS), which addresses the challenge of accurate quantitation of absolute metabolite concentrations in small biofluid samples of indeterminate volume.19 VDTS allows measurement of the absolute concentrations of polar metabolites via the accurate back-calculation of the starting volumes of low- to submicroliter samples of biofluids. As a proof-of-principle, this procedure was applied to profile the larval hemolymph (blood) from the genetic model organism Drosophila melanogaster using 1H NMR spectroscopy.19 VDTS enabled recorded spectra to be normalized to recovered hemolymph volumes and gave PCA outputs that were more biologically relevant than those based on normalization to the total signal strength of spectra.19 VDTS methodology also has the added value that recording of absolute rather than relative metabolite concentrations enables comparisons across experiments, experimenters, and different analytical platforms, thereby introducing an important element of standardization to metabolomics.
Here, we optimize both the “wet” and “dry” steps of the VDTS workflow, again using the analysis of hemolymph from Drosophila larvae as a proof-of-principle. Wet improvements to VDTS are introduced to the sample preparation technique and also by pairing negative control and experimental spectra from the same group of larvae (paired VDTS). Dry improvements include changes to the VDTS formulas to correct for small volumes of liquid present on the surface of the larval body that can inadvertently dilute the hemolymph sample. We also extend the utility of the VDTS approach from biofluids to solid tissue samples.
Experimental Section
Preparation of Drosophila Larvae
A Drosophila melanogaster isogenic strain (w1118iso 31)20 was used in this study. Larvae hatching within a 1 h time window were transferred to a standard yeast/cornmeal/agar food21 and raised at 25 °C for 90 h after larval hatching (ALH) until the late third instar (L3). Larvae were then floated from the medium using 30% glycerol/phosphate-buffered saline (PBS), rinsed with PBS, and prepared for polar metabolite extraction. The wet weights per larva at 90 h ALH were ∼1.7 mg (male) and ∼2.1 mg (female).
Paired VDTS for Hemolymph and Whole Larval Samples
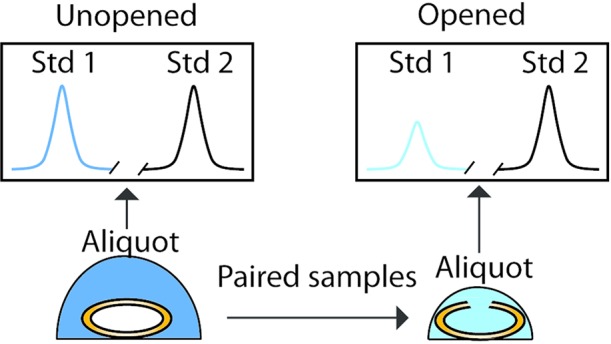
The workflow for polar metabolite analysis using paired VDTS (pVDTS) was adapted from ref (19) with significant differences (Figure 1). For hemolymph isolation, a 25 μL Hamilton syringe (Scientific Laboratory Supplies, SYR7095) was used to dispense 20 μL (Vf in Figure 1; see also below and Supporting Information) of ice-cold 25 mM ([f]0) sodium 13C-formate (the first NMR standard; Sigma-Aldrich, 279412) in ice-cold 0.9% w/v saline onto a group of larvae (n = 10–15 larvae) previously washed with PBS and blotted dry with a paper towel. Larvae were grouped together into a single pile in a 35 mm plastic tissue culture dish (Corning, 353001). For the “unopened” or “control” sample, after 1 min of contact with the larvae, 7.5 μL (Vt) of the sodium formate-saline solution was transferred with a Hamilton syringe to 100 μL deionized water in a 0.22 μm filter unit and spun into a microcentrifuge tube for 1 min at 13 000 rpm (Thermo Scientific, 75002425). The “opened” or “experimental” sample was prepared from the same larval drop as the unopened sample by carefully tearing the larval cuticle with watchmakers forceps (World Precision Instruments, 555227F) to release hemolymph into in the remaining sodium-formate-saline droplet. Using a Hamilton syringe, 7.5 μL (Vt, again) of this hemolymph solution was then transferred to a second aliquot of 100 μL deionized water in a in a 0.22 μm filter unit and spun into a microcentrifuge tube. Once filtered, 100 μL unopened and opened larval samples were then transferred into 200 μL (VD) of deionized water containing 90 μM ([D]0) sodium-4,4-dimethyl-4-silapentane-1-sulfonate (DSS; the second NMR standard; Sigma-Aldrich, 178837) in a glass vial (Agilent, 5182–0715). Polar metabolites were then extracted from unopened and opened samples in parallel, using the method of Bligh and Dyer.22 Briefly, each solution was vortexed with the addition of 750 μL 2:1 methanol–chloroform solution in a glass vial (Agilent, 5182–0715). Phase separation was then achieved by the addition of 250 μL chloroform followed by 250 μL of water and vortexing. The upper, aqueous layer was then aspirated using a positive displacement pipet (Gilson, F148506) and evaporated to dryness (Savant DNA centrifugal evaporator). Samples were then resuspended in 160 μL 99.9% D2O (Millipore, 7789–20–0) and transferred to two 3 mm NMR tubes (Bruker Biospin).
Figure 1.

The pVDTS workflow for liquid hemolymph samples. An accurately measured volume (Vf) of saline containing the chosen standard (sodium 13C-formate) at a known concentration [f]0 is transferred to a number of larvae (n), with a collective hemolymph volume Vh (a). An accurately measured volume of the droplet (Vt) is removed and transferred into water in a microcentrifuge column (b)—this constitutes the origin of the control “unopened” sample. Larval cuticles are then ruptured to release hemolymph into the droplet (c), and a second accurately measured volume (Vt) is removed from the droplet and transferred to water in a second microcentrifuge column (d). The following steps are then performed in parallel for the two samplings: microcentrifuge tubes are spun to remove debris and clear hemocytes from the “opened” sample (e). The cleared filtrates are then each transferred to a known volume (VD) of chloroform/methanol/water (green) containing a fixed concentration [D]0 of DSS (f). After further separation of polar and nonpolar components via the Bligh–Dyer method (g), the upper aqueous phases containing polar species are aspirated to a second pair of microcentrifuge tubes (h). The solutions are evaporated to dryness (i) and the residues suspended in D2O (j) prior to transfer to a pair of NMR tubes (k). Vh: Volume of released hemolymph. [X]h: Concentration of metabolite X in the hemolymph. I′1f: Intensity of 1H resonance of the 13C-formate standard when larvae do not have their cuticles ruptured (the “unopened” sample) in units relative the internal DSS concentration. I′2f: 1H resonance of the standard when larvae have their cuticles ruptured (the “opened” sample).
To analyze the polar metabolomes of whole larvae, a pVDTS workflow similar to the one for hemolymph was developed (Figure 2). Unopened samples were prepared in the manner as for hemolymph pVDTS. The paired opened samples were then prepared from the same larval drop by 30 s of homogenization in a microcentrifuge tube using a motorized hand-held pellet pestle (Kontes; Sigma-Aldrich, Z359947). The resulting larval tissue suspension was pelleted by centrifugation at 13 000 rpm for 2 min, 7.5 μL of the supernatant was then removed by Hamilton syringe and transferred to 200 μL deionized water containing 90 μM DSS. Samples were then methanol–chloroform extracted as described above.
Figure 2.

The pVDTS workflow for solid whole larval samples. An accurately measured volume (Vf) of saline containing 13C-formate at a known concentration [f]0 is transferred to a number of larvae (n) in a microcentrifuge tube (a). An accurately measured volume (Vt) is then removed from the larvae in the microcentrifuge tube for the “unopened” sample (b). Larvae are then homogenized using a motorized pellet pestle and the microcentrifuge tube as a mortar (c)—this will be the “opened” sample. An accurately measured volume (Vt) is then removed from the homogenized larvae and transferred to a known volume (VD) of chloroform/methanol/water (green) containing a fixed concentration [D]0 of DSS (d). The remaining steps (e–i) are the same as (e–i) in Figure 1. VWL: volume of homogenized whole larva. [X]WL: concentration of metabolite X in whole larval homogenate. I′1f and I′2f: “unopened” and “opened” sample signal intensities as per Figure 1.
Acquisition and Processing of NMR Spectra
One-dimensional (1D) 1H NMR spectra of metabolites were acquired as described in ref (19). This entailed spectral acquisition of each sample for ∼30 min, with a Bruker Avance III instrument with a nominal 1H frequency of 700 MHz. The standard Bruker pulse sequence noesypr1d was employed with the following parameters consistent with the recommendations of Chenomx NMR Suite (Chenomx, Edmonton, Canada): sweep width 20 ppm, acquisition time 4 s, relaxation delay 1 s, mixing period 10 ms, with solvent presaturation power of 0.02 mW (B1 field ∼50 Hz) applied to the residual HOD signal at 4.7 ppm. Typically, 300–500 transients were acquired per measurement. Free induction decays were then zero-filled, apodized with exponential multiplication (line broadening factor LB = 1 Hz), Fourier-transformed, and the resulting spectra were then phase corrected before baseline correction, all in the Processor component of the Chenomx software. The identification and assignment of metabolite NMR peaks was achieved via manually assisted fitting of reference metabolite spectra contained within the Chenomx NMR Suite Profiler database to the recorded spectral peaks. The ambiguous identity of a small number of peaks was resolved by spiking, and quantitation was obtained as for other compounds using a spectrum of a known concentration of the authenticated standard. Listings of the identified metabolites and their chemical shifts under the conditions of our experiments are provided in Table 1.
Table 1. Metabolites Identified in Drosophila Hemolymph and Whole Larvaea.
| metabolite | 1H (ppm) |
|---|---|
| 2-hydroxyglutarate | 1.835, 1.981, 2.235, 2.273, 4.035 |
| alanine | 1.467, 3.779 |
| arginine | 1.641, 1.717, 1.890, 1.916, 3.222, 3.763, 6.668, 7.226 |
| aspargine aspartate | 2.845, 2.940, 3.978, 6.922, 7.631 |
| 2.663, 2.802, 3.886 | |
| betaine | 3.253, 3.893 |
| carnosine* | 2.618, 2.660, 2.955, 3.112, 3.187, 3.212, 4.441, 7.075, 8.104, 8.117 |
| dimethylamine*,§ | 2.715 |
| fumarate | 6.505 |
| glucose | 3.235, 3.394, 3.404, 3.455, 3.481, 3.527, 3.704, 3.717, 3.759, 3.820, 3.835, 3.892, 4.632, 5.220 |
| glutamate | 2.043, 2.2120, 2.325, 2.354, 3.744 |
| glutamine | 2.113, 2.140, 2.424, 2.459, 3.761, 6.888, 7.615 |
| glycine | 3.544 |
| 3.144, 3.239, 3.990, 7.082, 7.869 | |
| inosine | 3.836, 3.907, 4.265, 4.433, 4.759, 6.090, 8.222, 8.331 |
| isoleucine | 0.927, 0.998, 1.248, 1.456, 1.970, 3.664 |
| leucine | 0.944, 0.955, 1.670, 1.698, 1.733, 3.728 |
| lysine | 1.428, 1.496, 1.717, 1.879, 1.910, 3.012, 3.752 |
| malate | 2.346, 2.656, 4.287 |
| methionine | 2.113, 2.123, 2.192, 2.631, 3.858 |
| NAD+ | 4.196, 4.226, 4.250, 4.358, 4.371, 4.420, 4.476, 4.498, 4.533, 6.030, 6.077, 8.167, 8.185, 8.418, 8.824, 9.138, 9.326 |
| O-phosphocholine | 3.208, 3.580, 4.155 |
| O-phosphoethanolamine | 3.206, 3.969 |
| O-phosphotyrosine* | 3.019, 3.190, 3.946, 7.170, 7.222 |
| phenylalanine | 3.118, 3.278, 3.989, 7.317, 7.375, 7.415 |
| proline | 1.979, 2.012, 2.061, 2.339, 3.325, 3.408, 4.119 |
| sarcosine | 2.725, 3.604 |
| succinate | 2.391 |
| taurine | 3.259, 3.411 |
| threonine | 1.317, 3.573, 4.239 |
| trehalose | 3.238, 3.636, 3.752, 3.814, 3.845, 3.848, 5.183 |
| tryptophan | 3.299, 3.475, 4.052, 7.190, 7.273, 7.305, 7.530, 7.725, 10.19 |
| tyramine* | 2.918, 3.232, 6.872, 7.210 |
| tyrosine | 3.046, 3.188, 3.928, 6.888, 7.182 |
| valine | 0.979, 1.030, 2.263, 3.597 |
| β-alanine | 2.541, 3.165 |
Table displays the metabolites assigned in the 1H NMR spectra of hemolymph and whole larval extracts with the associated chemical shifts (recorded in parts per million (ppm)) for each multiplet peak cluster. Metabolites were identified by reference to the Chenomx NMR Suite library except where indicated by *, where the identity was confirmed by spiking with an authenticated standard. The identity of the singlet resonance at 2.715 ppm is provisionally assigned to dimethylamine (§). Bold text indicates the resonance that was used for fitting to the experimental spectrum.
To confirm the identity of unknown metabolites, we performed spiking experiments. A solution of the standard was added to the sample at a level that increased the NMR resonance intensities of the “unknown” by approximately 50%. This level was established by first performing test spikes into a sample of buffer alone. Supplementary additions of the standard were then performed to confirm that any concentration-dependent trajectory of the chemical shift(s) can safely be back projected to the starting values, thereby giving a high degree of confidence for metabolite identification. For compounds with no library spectrum in Chenomx NMR Suite, such as O-phosphotyrosine, we prepared a standard solution at 1 mM, containing 0.1 mM DSS, and constructed a library spectrum using the Compound Builder component of the software. We note that spiking of dimethylamine appears to build robustly the singlet resonance at 2.715 ppm, but, as we were unable to cross-validate the identification by 2D 13C,1H NMR due to low concentration, the identification of this resonance as dimethylamine remains provisional.
Data Analysis
In silico simulations of pVDTS and VDTS workflows were conducted using Microsoft Excel. Linear regression analysis was performed using in-house written Python code. The fits incorporated estimation of the uncertainty in slope and intercept parameters by refitting data sets comprising Monte Carlo samples of the location of data points, in both axes, within a normal distribution defined by the experimental standard deviations.
Results
Optimization of a Paired VDTS Workflow
The original VDTS workflow was used to analyze the polar metabolite profiles of hemolymph from fed and nutrient-restricted (NR) Drosophila larvae. Fed and NR larvae grow at different rates and the total analyte quantities and volumes of hemolymph recovered from each were also very different.16,19 Recovered hemolymph volume (Vh) was of the order of 100–500 nL per larva and, even using groups of ten larvae, this viscous biofluid was difficult to measure directly and accurately. VDTS provided an indirect means to establish Vh by back-calculation and thereby to relate measured metabolite concentrations in the final (diluted) NMR tube back to that in the larval hemolymph. The VDTS method relied upon the first stage dilution (via tearing of the larval cuticle) of the target hemolymph sample into a droplet of known volume (Vf) containing a fixed concentration of one standard (sodium 13C-formate), followed by extraction of the polar metabolites using a solvent mix containing a known amount of a second standard (DSS, see Figure 2 from ref (19)). The VDTS procedure incorporated an important “unopened” control, in which a separate group of larvae were immersed in a droplet containing the first NMR standard but without rupture of the cuticle, i.e., hemolymph was not released into the droplet. This unopened sample therefore controls for larval “wetness”, i.e., carry-over of a small amount of nonhemolymph liquid from the surface of a group of larvae. We reported an equation to relate the relative NMR signal intensities of the two standards for the separate “opened” and “unopened” batches of larvae to the Vh/Vf ratio and hence to obtain both Vh and the absolute larval hemolymph concentrations of metabolites Xi, [X]i,h by back-calculation.19 Our original report applied VDTS to the analysis of hemolymph polar metabolomes of Drosophila larvae and identified compounds that differed between fed and nutrient restricted (NR) larvae. Importantly, fed and NR spectra were robustly separated in PCA plots using the VDTS workflow but not if PQN was directly applied to the recorded spectra. Unlike VDTS, direct application of PQN resulted in loadings showing a nonzero baseline offset and opposite signs for different NMR signal multiplets originating from the same metabolite, outcomes that are incompatible with any plausible model for the differences between the two diets. In summary, the VDTS workflow outperformed direct PQN normalization in terms of yielding logically consistent and biologically sensible results.19
We now introduce several improvements to the VDTS workflow that increase its accuracy and utility. One key refinement was prompted by our observation that groups of unopened larvae contribute a small but variable volume of carry over liquid which decreases the accuracy of the calculated hemolymph volume (Vh) for the opened larvae. Eq 2 from the original VDTS method assumed zero carry over liquid19 and subsequently could yield incorrect absolute metabolite concentrations, [X]h. To circumvent this limitation, we have now developed a paired VDTS (pVDTS) workflow that aims to correct for any adventitious carry over liquid. pVDTS uses the same group of larvae to prepare a pair of unopened and opened NMR samples. In this way, the volume of carry over liquid is systematically corrected for within each sample pair. When the process is applied across a set of samples, the paired approach intrinsically accounts for variation in “wetness” between groups of larvae. The pVDTS approach assumes that the number of moles of the second NMR standard (DSS) is the same in both the “unopened” and “opened” members of each sample pair. It then follows that the signal intensity for the first NMR standard (the 1H signal from 13C-formate ions), normalized to the DSS signal intensity in the same spectrum, is a function of the droplet volume at the time of sampling. Namely:
for the “unopened” sample: the dispensed droplet 13C-formate (“f”) volume plus any carry-over (“co”) wetness from the unopened larvae (Vf + Vco);
for the “opened” sample: the dispensed droplet volume plus any carry-over wetness from the unopened larvae, minus the transfer (“t”) volume removed to prepare the first “unopened” sample, and plus the volume of hemolymph released (Vf + Vco – Vt + Vh).
Hence the intensities of the DSS-normalized 13C-formate signals in the “unopened”/“opened” pair of spectra can be related to a set of experimentally known quantities and to the unknown volume of released hemolymph. This leads to the following pVDTS equations (full derivation in Supporting Information):
| 1 |
where:
| 2 |
and:
| 3 |
wherein the following apply:
Vh, volume of recovered hemolymph from one group of larvae;
Vt, volume transferred from the droplet for each of the “unopened” and “opened” samples (see Experimental Section);
n0f, number of moles of sodium 13C-formate in the initial droplet of volume Vf with concentration [f]0;
n0D, number of moles of DSS added to the sample, comprising a volume VD with concentration [D]0;
Iif, signal strength of the 1H NMR resonances for 13C-formate in (diluted) NMR sample i, where i = 1 (“unopened”), or 2 (“opened”), expressed in concentration units (obtained by fitting a spectrum of a standard sample of known concentration);
IiD, signal strength of the 1H NMR methyl group resonance for DSS in NMR sample i, expressed in concentration units;
Ii′f, effective concentration of the 13C-formate 1H NMR resonances in sample i, normalized to the DSS concentration in the same sample (thereby a unit-less quantity).
For the “unopened” sample from any matched pair, the larval cuticle carry-over volume, Vco, can be related to the DSS-normalized 13C-formate 1H signal strength according to
| 4 |
Eqs 1–4 indicate that both Vco and Vh can be obtained for each “unopened”/“opened” pair with only the prior knowledge of the volumes and concentrations of the two NMR standards employed in the pVDTS procedure.
The concentrations of polar metabolites in the NMR tube containing the opened sample can be measured, as in the original description of VDTS,19 by cumulative supervised fitting of reference library 1H NMR spectra of samples of known concentration. This fitting can achieved, for example, using the Profiler component of commercial software Chenomx NMR Suite. Such fitting yields the concentration of metabolite X relative the relevant NMR standard, in this instance DSS:
| 5 |
where the subscript 2 denotes the second, “opened” spectrum. Further computation (see Supporting Information) shows that the all-important absolute concentration of X in the hemolymph, [X]h, can be related to I2′X according to
| 6 |
Although not explicit in eq 6, any nonzero Vco is accounted for in the measured value of I1′f.
Application of pVDTS to a Biofluid
To validate the pVDTS workflow, we analyzed the hemolymph of Drosophila larvae fed a standard diet. This biofluid was analyzed late in the final larval instar at 90 h after larval hatching (ALH), an almost identical developmental stage to the 88 h time point used in the original VDTS description.19 We used pVDTS to analyze the polar hemolymph metabolomes of groups of males or females (ten larvae per group). The analysis used 4–6 groups of larvae (replicates) and was repeated in three independent experiments, totalling 140 male and 140 female animals. It should be noted that the relative limited sensitivity of NMR spectroscopy means that the coverage of the metabolome is necessarily limited, and it may be the case that there are further hemolymph metabolites that are present below the limit of detection, estimated in the present system to be of the order of 20–50 μM (depending upon the number of equivalent protons and any scalar couplings).
An example NMR spectrum obtained for a set of opened larvae is shown (Figure 3). The absolute concentrations of abundant polar metabolites calculated from the pVDTS NMR spectra using eq 6 are tabulated (Table 2). These concentrations range over ∼0.05–100 mM. Consistent with our previous VDTS study,19 we found that the hemolymph metabolome is dominated by the covalent glucose dimer trehalose and by a subset of amino acids, including O-phosphotyrosine. The complement of hemolymph metabolites and the range of their concentrations measured via pVDTS in Table 2 were very similar to those reported for the original VDTS method.19 Of note, in the original paper,19 the Chenomx Profiler metabolite database suggested that the hemolymph peaks at 2.74 and 2.73 ppm could be assigned to sarcosine and dimethlyamine, respectively. We have now spiked hemolymph samples with sarcosine and dimethylamine standards, revealing that the peak at 2.73 ppm corresponds to sarcosine and that a peak at ∼2.715 ppm corresponds to dimethylamine. The peak at 2.74 ppm (initially assigned as sarcosine) corresponds to an, as yet, unidentified metabolite. Application of the pVDTS formula (eq 3) to obtain estimates for the recovered larval hemolymph volume Vh yielded ∼290 ± 95 nL per animal for males and ∼295 ± 145 nL per animal for females. These Vh values are smaller than those reported using the original VDTS method and may reflect the use of less vigorous tearing of the larval cuticle; it should be noted that the experimental Vh reflects the efficiency of the hemolymph extraction procedure and not the total volume of larval hemolymph in the animal. In terms of calculating absolute metabolite concentrations, the value of Vh is indirectly encoded in eq 6 via the combination of I1′f and I2 and the other known “fixed” quantities VD, Vt and [D]0. Importantly, the design of the pVDTS workflow should ensure accurate estimation of absolute metabolite concentrations regardless of the completeness of the hemolymph recovery.
Figure 3.
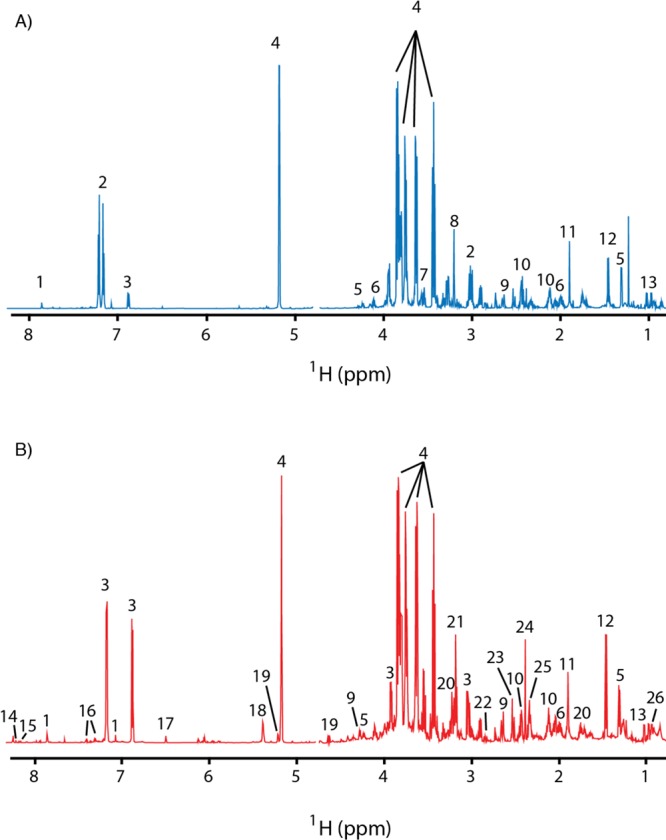
Comparison of polar metabolites in the hemolymph and whole larva. 700 MHz 1H NMR spectra are shown for hemolymph (A) and whole larval body (B) polar metabolites from batches of ten fed male larvae at 90 h ALH. The trimethylsilyl resonance of DSS is set to 0 ppm (not shown). Resonances corresponding to select resonances are highlighted: histidine (1); O-phosphotyrosine (2); tyrosine (3); trehalose (4); threonine (5); proline (6); glycine (7); O-phosphocholine (8); malate (9); glutamine (10); acetate (11); alanine (12); valine (13); inosine (14); nicotinamide adenine dinucleotide (15); phenylalanine (16); fumarate (17); maltose (18); glucose (19); arginine (20); choline (21); aspartate (22); citrate (23); succinate (24) and glutamate (25).
Table 2. Hemolymph Metabolite Concentrations Obtained Using Paired VDTSa.
| metabolite | male | female | p-value |
|---|---|---|---|
| alanine | 5.83 ± 2.69 | 3.51 ± 1.51 | 0.20 |
| arginine | 0.94 ± 0.53 | 0.99 ± 0.41 | 0.99 |
| aspargine | 3.53 ± 1.46 | 3.16 ± 1.29 | 0.99 |
| betaine | 0.26 ± 0.12 | 0.40 ± 0.23 | 0.60 |
| dimethylamine | 0.05 ± 0.02 | 0.04 ± 0.02 | 0.99 |
| fumarate | 0.21 ± 0.08 | 0.19 ± 0.08 | 0.99 |
| glucose | 0.71 ± 0.59 | 0.84 ± 0.66 | 0.99 |
| glutamine | 14.30 ± 5.26 | 14.18 ± 5.39 | 0.99 |
| glycine | 1.84 ± 0.75 | 1.40 ± 0.57 | 0.82 |
| 2.71 ± 1.20 | 2.58 ± 1.17 | 0.99 | |
| isoleucine | 0.47 ± 0.19 | 0.27 ± 0.08 | 0.02 |
| leucine | 0.85 ± 0.33 | 0.52 ± 0.19 | 0.07 |
| lysine | 4.30 ± 1.40 | 3.52 ± 1.38 | 0.94 |
| malate | 3.22 ± 1.22 | 2.93 ± 1.29 | 0.99 |
| methionine | 0.49 ± 0.20 | 0.48 ± 0.16 | 0.99 |
| O-phosphocholine | 2.32 ± 0.66 | 1.80 ± 0.60 | 0.55 |
| O-phosphotyrosine | 67.6 ± 22.09 | 63.22 ± 22.28 | 0.99 |
| phenylalanine | 0.30 ± 0.09 | 0.23 ± 0.07 | 0.44 |
| proline | 9.13 ± 2.65 | 7.78 ± 2.81 | 0.98 |
| sarcosine | 0.37 ± 0.14 | 0.21 ± 0.08 | 0.02 |
| succinate | 1.05 ± 0.28 | 0.92 ± 0.30 | 0.99 |
| taurine | 1.04 ± 0.45 | 0.99 ± 0.44 | 0.99 |
| threonine | 4.85 ± 1.86 | 4.24 ± 1.76 | 0.99 |
| trehalose | 75.22 ± 25.20 | 66.80 ± 22.49 | 0.99 |
| tryptophan | 0.23 ± 0.07 | 0.21 ± 0.09 | 0.99 |
| tyrosine | 5.28 ± 1.92 | 3.82 ± 1.49 | 0.53 |
| valine | 1.94 ± 0.77 | 1.23 ± 0.68 | 0.31 |
| β-alanine | 1.50 ± 0.54 | 1.50 ± 0.58 | 0.99 |
Entries show mean concentration ±1 standard deviation for three independent experiments, each with at least three biological replicates for each sex. Bold figures indicate statistically significant (p ≤ 0.05) differences between fed males and females. Statistical significance was determined via multiple t-tests, correcting for multiple comparisons using the Holm–Šídák method.25
Comparisons of the larval hemolymph metabolite concentrations obtained using pVDTS from spectra recorded for this work with those derived from the original VDTS method19 are displayed for males and females as log–log plots (Figure 4). The graphs show that the metabolite concentrations are strongly correlated between the two workflows. Nevertheless, pVDTS tends to give slightly higher concentrations than the original VDTS method, presumably reflecting the fact that the new method corrects for the surface wetness of larval samples. To test specifically for the contribution that the pairing of “unopened” and “opened” replicates makes to the calculation of metabolite concentrations, we analyzed the same set of raw spectra either using two different methods: pVDTS or the unpaired version of VDTS used previously.19 In the original method, the NMR peak intensities of the unopened samples are averaged across the replicates rather than each “unopened” replicate being individually paired with a corresponding “opened” replicate. This unpaired variant method gave metabolite concentrations in both males and females that were, on average, 1.3 fold higher, with mean coefficients of variation (CVs) that are 2-fold (2.0 ± 0.3) greater than those calculated by pVDTS (see Supporting Information S4). The narrower confidence limits obtained using pVDTS suggest that this new method should yield a greater precision and, as a result of the self-compensating nature of the paired design, higher accuracy than the original VDTS method.
Figure 4.
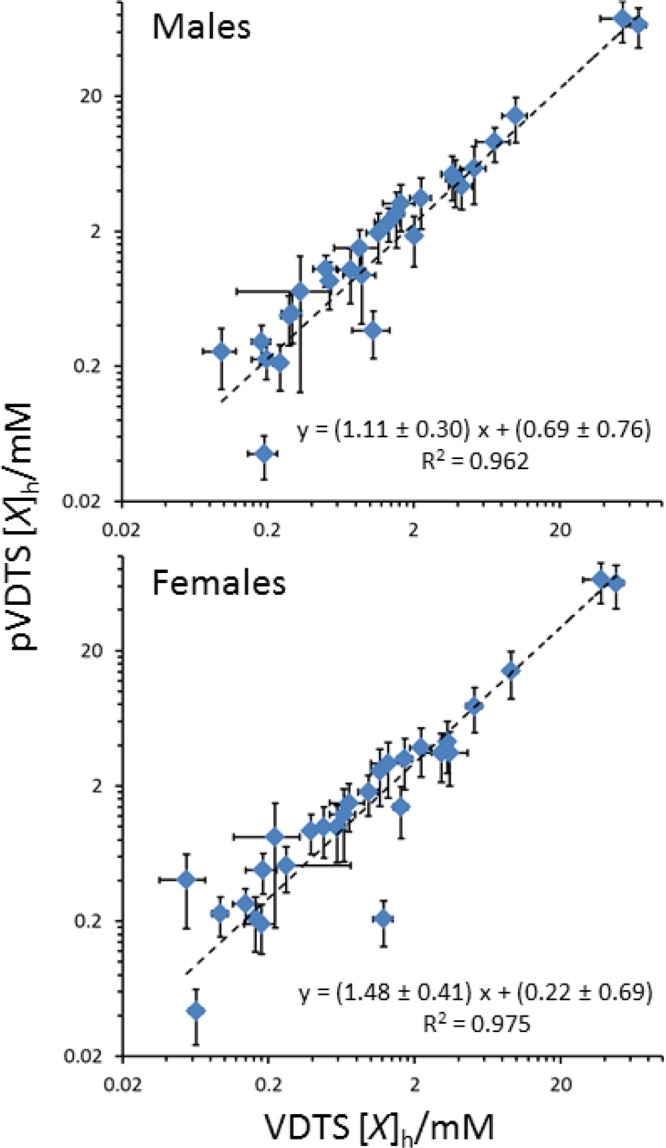
Comparison of pVDTS and VDTS calculated concentrations of hemolymph metabolites. Graphs show log–log plots of metabolite concentrations for male (top) and female (bottom) larvae with pVDTS values (this work; y-axis) compared to the original values obtained previously using VDTS (x-axis).19 The dashed lines represent the best fit obtained from linear regression with slope and intercept parameters estimated by Monte Carlo sampling within the uncertainties of the measurements.
To compare the performance of pVDTS with the original VDTS workflow, we conducted mock hemolymph release experiments. In the mock VDTS experiments, 3 μL of a defined mix of three “metabolites” (nicotinamide adenine dinucleotide (NAD+), scyllo-inositol, and sodium fumarate) was injected into buffered 20 μL droplets containing sodium 13C-formate and ten unopened larvae and extracted and processed a 7.5 μL Vt aliquot. Similarly, for the mock pVDTS experiments, 3 μL of the metabolite mix was injected into the “second stage” using ten larvae and the extraction step performed without opening up the animals. For both methods, five replicates of the extraction procedure were performed. These experiments therefore mimicked the release of hemolymph metabolites—represented by the 3 μL metabolite mixture—in the presence of potential carry-over wetness from the surface of the larvae (Supporting Information). An additional experiment was performed in which 3 μL of the metabolite mixture was injected directly into the DSS solution, dried down and resuspended in NMR buffer (i.e., avoiding the pipetting into and out of the formate droplet and the methanol–chloroform extraction). The CVs for the fitted metabolite concentration for this experiment were only ∼5%. In the VDTS workflow, we recovered a value for the nominal Vh of 2.3 ± 1.1 μL, with a coefficient of variation (CV), reflecting the precision of the measurement, of 46%. In the pVDTS workflow, the recovered Vh was 3.1 ± 0.4 μL with a CV of 14%. Although the ratio of recovered metabolite concentrations was essentially identical for the two workflows, the CV of the metabolite concentrations was up to 4-fold lower for pVDTS (CV ∼ 8%) than for VDTS (CV ∼ 33%). These mock hemolymph release experiments reveal that the new pVDTS workflow performs more accurately than the original VDTS method.
The relative performance of pVDTS and VDTS were also compared in silico by including random “noise” in the pipetted volumes Vf, Vt, and VD and simulating their effects on the measurement of 13C-formate concentration (see Supporting Information). It emerges that the paired design eliminates the impact of any “rogue” wet sample(s) that, in the VDTS method, would get averaged into the “unopened” 13C-formate measurement and so lead to potential bias. As with the experimental approach, the in silico approach supports our conclusion that the new pVDTS workflow is substantially improved, compared to the original VDTS method. Moreover, the design of the mock hemolymph release experiment described above allowed us to further assess the basis for this improvement. Namely, the “unopened” NMR measurements of the VDTS arm of the experiment could be combined with the “opened” NMR measurements of the pVDTS arm. This analysis using the VDTS formula yielded a value for the nominal Vh of 3.5 ± 0.4 μL with a CV of 11%. The low CV value suggests that at least a component of the improvement in the pVDTS measurement might derive from the fact that in the pVDTS workflow, the larvae are opened into a droplet that has a smaller initial volume than is employed in the VDTS workflow. As a result the dilution of the formate standard by the analyte (e.g., hemolymph) is greater and the difference in peak intensities between sample 1 (unopened) and sample 2 (opened) spectrum pairs correspondingly larger. This characteristic leads to a more numerically robust measurement of the volume of hemolymph released and subsequently derived quantities. Numerical modeling suggests that in the general case, as well as accounting for the potential for Vco carry over, both pairing and the adjusted sampling strategy, that effectively enhances the dilution of the 13C-formate standard, contribute to the superior precision of the pVDTS workflow over that of VDTS, with the balance of factors depending on the range and variation of the Vco volumes encountered. Together, the mock hemolymph release and in silico measurements provide strong evidence that the new pVDTS workflow is substantially improved compared to the original VDTS method.
Using the improved pVDTS method, we then revisited the sex-specific differences in polar hemolymph metabolite concentrations that were originally reported as statistically significant using the VDTS method.19 pVDTS showed that there is a very strong overall correlation ([X]female = (0.90 ± 0.19) [X]male – (0.01 ± 0.90); R2 = 0.998) between hemolymph metabolite concentrations in males and females (Figure 5). In line with this outcome, pVDTS reveals that the concentrations of the majority of the measured metabolites are not significantly different in the hemolymph between fed male and female larvae (Table 2). Nevertheless, the pVDTS workflow suggests that two of the 28 polar metabolites (isoleucine and sarcosine) do differ significantly (p < 0.025) between fed males and females, at least with the statistical assumption of independence of metabolite concentrations. Hence, sex-specific differences in the concentrations of polar hemolymph metabolites appear to be less widespread than reported previously.19
Figure 5.
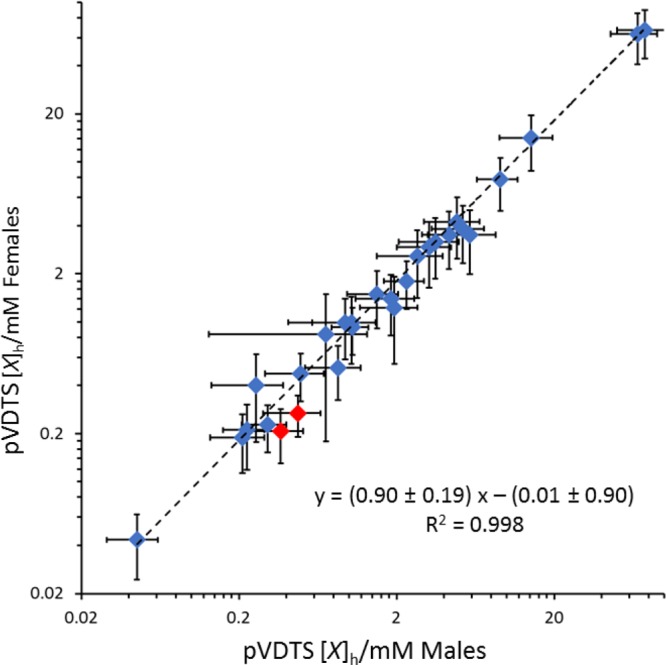
Many polar metabolites in the larval hemolymph are at similar concentrations in male and female larvae. Graph shows a log–log plot of metabolite concentrations in fed female (y-axis) and male (x-axis) larval hemolymph. The dashed line represents the best fit obtained from linear regression with slope and intercept parameters estimated by Monte Carlo sampling within the uncertainties of the measurements. The two metabolites shown in red (isoleucine and sarcosine) differ significantly between males and females (p < 0.05 using t tests and correcting for multiple comparisons using the Holm–Šídák method25).
Application of pVDTS to Solid Tissue Samples
The pVDTS approach for biofluids should be generalizable to solid tissues. As a pilot experiment, we adapted the workflow to measure the effective concentrations of polar metabolites in the whole larval body, which comprises the hemolymph and all the solid tissues (Figure 2). Note that the derived concentration is an aggregate value, representing an average over different tissue compartments, both intra- and extracellular. Similar to the analysis of larval hemolymph, a 20 μL droplet containing the first NMR standard was added to a group of ten larvae. The control “unopened” sample was generated by removing a 7.5 μL aliquot of the droplet for methanol–chloroform extraction. The corresponding experimental opened sample was then prepared by homogenization of the larvae within the remaining droplet volume and removal of a second aliquot for methanol–chloroform extraction. NMR spectra of the “unopened”/“opened” sample pairs were recorded and the data analyzed as for hemolymph samples. Representative NMR spectra of the whole larval polar metabolomes obtained for male and female larvae at 90 h ALH, fed a standard diet, are shown in Figure 3. The whole larval spectra contain more features than the hemolymph spectra, indicating that the homogenization step has released metabolites that are not present in the hemolymph alone. pVDTS was used to calculate the absolute concentrations of polar metabolites in whole male and female larvae at 90 h ALH, fed a standard diet (Table 3). Given that the whole larval body includes the hemolymph, it was not surprising that we detected all the metabolites previously found in hemolymph (Table 1). In addition to these molecules, we detected the following metabolites in the whole larval body: glutamate, aspartate, carnosine, inosine, O-phosphoethanolamine, tyramine, NAD+, maltose, citrate and 2-hydroxyglutarate. It makes biological sense that glutamate is abundant in larval tissues but needs to be kept at low levels in the hemolymph to avoid potential interference with its role as a neurotransmitter at the neuromuscular junction in Drosophila.19,23
Table 3. Whole Larval Metabolite Concentrations Obtained Using Paired VDTSa.
| metabolite | male | female | p-value |
|---|---|---|---|
| 2-hydroxyglutarate | 1.94 ± 0.42 | 2.32 ± 0.43 | 0.952 |
| alanine | 11.07 ± 0.84 | 7.40 ± 0.64 | 0.015 |
| arginine | 8.26 ± 0.30 | 6.25 ± 0.66 | 0.043 |
| asparagine | 3.55 ± 0.31 | 2.48 ± 0.31 | 0.076 |
| betaine | 0.40 ± 0.14 | 0.36 ± 0.03 | 0.989 |
| carnosine | 0.13 ± 0.04 | 0.10 ± 0.02 | 0.931 |
| dimethylamine | 0.03 ± 0.01 | 0.02 ± 0.01 | 0.931 |
| fumarate | 0.66 ± 0.08 | 0.50 ± 0.05 | 0.250 |
| glucose | 6.97 ± 0.93 | 6.49 ± 0.69 | 0.983 |
| glutamate | 14.30 ± 0.92 | 9.56 ± 1.26 | 0.028 |
| glutamine | 13.89 ± 1.95 | 11.56 ± 1.21 | 0.810 |
| glycine | 3.24 ± 0.74 | 2.26 ± 0.22 | 0.604 |
| histidine | 2.09 ± 0.25 | 1.86 ± 0.16 | 0.931 |
| inosine | 0.45 ± 0.08 | 0.42 ± 0.11 | 0.989 |
| isoleucine | 0.75 ± 0.08 | 0.51 ± 0.06 | 0.077 |
| leucine | 1.43 ± 0.10 | 1.10 ± 0.10 | 0.082 |
| lysine | 3.11 ± 0.72 | 2.83 ± 0.46 | 0.989 |
| malate | 8.33 ± 0.61 | 6.08 ± 0.52 | 0.041 |
| methionine | 0.80 ± 0.17 | 0.69 ± 0.05 | 0.952 |
| NAD+ | 0.47 ± 0.04 | 0.42 ± 0.05 | 0.931 |
| O-phosphocholine | 1.26 ± 0.49 | 0.84 ± 0.19 | 0.931 |
| O-phosphoethanolamine | 2.11 ± 0.08 | 1.35 ± 0.18 | 0.009 |
| O-phosphotyrosine | 2.90 ± 2.39 | 1.46 ± 0.75 | 0.952 |
| phenylalanine | 0.71 ± 0.08 | 0.68 ± 0.04 | 0.989 |
| proline | 9.97 ± 0.88 | 6.89 ± 0.64 | 0.040 |
| sarcosine | 0.35 ± 0.02 | 0.18 ± 0.01 | 0.0002 |
| succinate | 4.01 ± 0.24 | 3.29 ± 0.23 | 0.114 |
| taurine | 1.49 ± 0.31 | 1.46 ± 0.12 | 0.989 |
| threonine | 4.73 ± 0.57 | 3.29 ± 0.36 | 0.115 |
| trehalose | 60.40 ± 4.29 | 45.21 ± 4.72 | 0.078 |
| tryptophan | 0.29 ± 0.04 | 0.28 ± 0.05 | 0.989 |
| tyramine | 0.25 ± 0.05 | 0.20 ± 0.06 | 0.952 |
| tyrosine | 27.12 ± 3.50 | 22.90 ± 1.80 | 0.777 |
| valine | 2.18 ± 0.09 | 1.52 ± 0.17 | 0.018 |
| β-alanine | 2.95 ± 0.35 | 2.18 ± 0.34 | 0.321 |
Entries show mean concentration ±1 standard deviation for a single experiment with at least four biological replicates of each sex. Bold figures indicate statistically significant (p ≤ 0.05) differences between fed males and females. Statistical significance was determined via multiple t-tests, correcting for multiple comparisons using the Holm–Šídák method.25
Interestingly, we observed significant sex-specific differences in the concentrations of eight of the 36 polar metabolites measured in the whole body of fed larvae. This suggests that sex-specific differences could be more prevalent in solid tissue than in hemolymph metabolites. Thus, alanine, arginine, glutamate, malate, proline, sarcosine, valine, and O-phosphoethanolamine were all significantly (p < 0.05) higher in the males than in females. Even though these findings were replicated multiple times in our hands, further work is required before definitive conclusions can be made about precisely which subset of whole-body metabolites differ in concentration between the sexes.
Discussion
This study describes a new pVDTS workflow for the measurement of absolute concentrations of metabolites in a wide variety of small samples of biofluids and solid tissues. pVDTS offers four main improvements over the original VDTS metabolomics method for biofluids. First, the pairing of control (“unopened”) and experimental (“opened”) samples, combined with an adjustment to the protocol that enhances the dilution of the second NMR standard (13C-formate) provides a statistically superior method for dealing with biological and technical sources of variation between replicates than was employed with VDTS. Second, pVDTS workflows have been optimized for both biofluids and solid tissues. Third, new pVDTS equations have been derived to correct for potential dilution errors introduced by variable wetness on the surface of tissue/whole animal samples. And fourth, pVDTS makes economical use of valuable biological material by using the same source analyte to prepare both the control and the experimental replicate pair; i.e., the pVDTS workflow requires only half the number of biological samples as the corresponding application of the original VDTS procedure.
The new pVDTS workflow was applied to Drosophila larvae as a proof-of-principle. Comparisons with the original unpaired VDTS method, illustrate that pVDTS gives more logically consistent results. We also found that pVDTS identified fewer larval hemolymph metabolites with sex-specific concentrations than did the original VDTS method. One surprising reason why the original VDTS analysis gave false positive male–female differences appears to involve an observed sex-specific bias in the amount of carry over liquid that was present in unopened controls, an issue that becomes a systematic error in metabolite concentration calculation due to averaging of the 13C-formate signal for the control (“unopened”) samples. Hence, we have now reanalyzed the original raw VDTS data for fed larvae,19 revealing that the male versus female signal intensities for the first NMR standard (13C-formate H-1 signal) were very similar for the experimental (“opened”) replicates, yet differed for the control (“unopened”) replicates. Namely, the spectra obtained for “unopened” males tended to have a lower 13C-formate NMR signal than the corresponding spectra for “unopened” females, presumably reflecting a higher level of surface liquid carry-over for the male larvae. A weakness of the original VDTS workflow is that the spectra of the “unopened” and “opened” larvae are ultimately derived from physically different batches of larvae, potentially allowing for adventitious bias in the derived metabolite concentrations. The new pVDTS workflow now corrects for any sex- (or other similar variable-)dependent bias in sample volume back-calculations because any liquid carry-over equally dilutes the 13C-formate in the “unopened” and “opened” replicates of each sample pair. pVDTS is also robust to stochastic variations in liquid carry-over, as Vco is individually accounted for in each sample pair. Evidence for the improved accuracy of pVDTS was provided by in silico deletion of the pairing step from the workflow (accomplished by averaging across all “unopened” replicates), which eliminated all of the metabolites with a statistically significant male–female difference in concentration. The small number of metabolites with sex-specific concentrations that were robustly identified by pVDTS is biologically intriguing and can now be followed up by combining metabolomics with the power of Drosophila genetics. In this way, the genetic pathways involved in the uptake, excretion, biosynthesis and/or catabolism of these metabolites can be tested for functions in sex-specific physiology. For example, it will be interesting to determine whether any of the sex-specific differences in hemolymph or solid tissue metabolites that we have reported here are connected to the recently identified neuronal mechanism that controls the larger body size of females versus males.24
Conclusion
Paired VDTS (pVDTS) allows the reliable measurement of absolute concentrations of metabolites in small samples of biofluids or solid tissues of initially unknown volume. pVDTS constitutes a more statistically robust version of VDTS because spectra for each control sample are not group-averaged but, instead, they are individually paired with the corresponding experimental sample. pVDTS also allows more accurate back-calculation of small starting analyte volumes than with the original VDTS, as it corrects for the adventitious surface wetness of the unopened samples, which is potentially variable and can bias the estimation of metabolite concentrations. Like the original VDTS, pVDTS does not require statistical normalization of spectral intensities using methods such as PQN, which can fail if overall signal masses and metabolite profiles differ substantially between samples. The pVDTS workflows described here for biofluids and solid tissues were optimized using NMR spectroscopy but should be adaptable in principle to metabolomics platforms with higher sensitivity such as those employing mass spectrometry.
Acknowledgments
We thank Tom Frenkiel and the staff of the Medical Research Council Biomedical NMR Centre for assistance with spectroscopy and James MacRae of the Crick Metabolomics STP for support. We thank Alain Oregioni for critical reading of the manuscript. This work was supported by an Investigator Award to APG from The Wellcome Trust (104566/Z/14/Z) and by the Francis Crick Institute, which receives its core funding from Cancer Research UK (FC001088, FC001029), the UK Medical Research Council (FC001088, FC001029), and the Wellcome Trust (FC001088, FC001209).
Glossary
Abbreviations
- ALH
after larval hatching
- DSS
2,2-dimethyl-2-silapentane-5-sulfonate sodium salt
- MS
mass spectrometry
- NAD+
nicotinamide adenine dinucleotide
- NMR
nuclear magnetic resonance
- PBS
phosphate-buffered saline
- PCA
principal components analysis
- PQN
probabilistic quotient normalization
- VDTS
volume determination with two standards
- pVDTS
paired VDTS.
Supporting Information Available
The Supporting Information is available free of charge on the ACS Publications website at DOI: 10.1021/acs.jproteome.8b00773.
Derivation of paired VDTS equations; Consideration of potential sources of error; Mock hemolymph release experiments using pVDTS and VDTS workflows; In silico modeling of Vco and droplet size effects on the estimation of Vh; Hemolymph metabolite concentrations calculated using the data averaging formulation from the VDTS method (PDF)
The authors declare no competing financial interest.
Supplementary Material
References
- Riekeberg E.; Powers R. New frontiers in metabolomics: from measurement to insight. F1000Research 2017, 6, 1148. 10.12688/f1000research.11495.1. [DOI] [PMC free article] [PubMed] [Google Scholar]
- Marshall D. D.; Powers R. Beyond the paradigm: Combining mass spectrometry and nuclear magnetic resonance for metabolomics. Prog. Nucl. Magn. Reson. Spectrosc. 2017, 100, 1–16. 10.1016/j.pnmrs.2017.01.001. [DOI] [PMC free article] [PubMed] [Google Scholar]
- Markley J. L.; Bruschweiler R.; Edison A. S.; Eghbalnia H. R.; Powers R.; Raftery D.; Wishart D. S. The future of NMR-based metabolomics. Curr. Opin. Biotechnol. 2017, 43, 34–40. 10.1016/j.copbio.2016.08.001. [DOI] [PMC free article] [PubMed] [Google Scholar]
- Bingol K.; Bruschweiler R. Knowns and unknowns in metabolomics identified by multidimensional NMR and hybrid MS/NMR methods. Curr. Opin. Biotechnol. 2017, 43, 17–24. 10.1016/j.copbio.2016.07.006. [DOI] [PMC free article] [PubMed] [Google Scholar]
- Chong M.; Jayaraman A.; Marin S.; Selivanov V.; de Atauri Carulla P. R.; Tennant D. A.; Cascante M.; Gunther U. L.; Ludwig C. Combined Analysis of NMR and MS Spectra (CANMS). Angew. Chem., Int. Ed. 2017, 56 (15), 4140–4144. 10.1002/anie.201611634. [DOI] [PubMed] [Google Scholar]
- Gebregiworgis T.; Powers R. Application of NMR metabolomics to search for human disease biomarkers. Comb. Chem. High Throughput Screening 2012, 15 (8), 595–610. 10.2174/138620712802650522. [DOI] [PMC free article] [PubMed] [Google Scholar]
- Dumas M. E.; Kinross J.; Nicholson J. K. Metabolic phenotyping and systems biology approaches to understanding metabolic syndrome and fatty liver disease. Gastroenterology 2014, 146 (1), 46–62. 10.1053/j.gastro.2013.11.001. [DOI] [PubMed] [Google Scholar]
- Lindon J. C.; Nicholson J. K. The emergent role of metabolic phenotyping in dynamic patient stratification. Expert Opin. Drug Metab. Toxicol. 2014, 10 (7), 915–9. 10.1517/17425255.2014.922954. [DOI] [PubMed] [Google Scholar]
- Blydt-Hansen T. D.; Sharma A.; Gibson I. W.; Wishart D. S.; Mandal R.; Ho J.; Nickerson P.; Rush D. Urinary Metabolomics for Noninvasive Detection of Antibody-Mediated Rejection in Children After Kidney Transplantation. Transplantation 2017, 101 (10), 2553–2561. 10.1097/TP.0000000000001662. [DOI] [PubMed] [Google Scholar]
- Wishart D. S. Emerging applications of metabolomics in drug discovery and precision medicine. Nat. Rev. Drug Discovery 2016, 15 (7), 473–84. 10.1038/nrd.2016.32. [DOI] [PubMed] [Google Scholar]
- Wishart D. S.; Mandal R.; Stanislaus A.; Ramirez-Gaona M. Cancer Metabolomics and the Human Metabolome Database. Metabolites 2016, 6 (1), 10. 10.3390/metabo6010010. [DOI] [PMC free article] [PubMed] [Google Scholar]
- St Clair S. L.; Li H.; Ashraf U.; Karty J. A.; Tennessen J. M. Metabolomic Analysis Reveals That the Drosophila Gene lysine Influences Diverse Aspects of Metabolism. Genetics 2017, 1255–1261. 10.1534/genetics.117.300201. [DOI] [PMC free article] [PubMed] [Google Scholar]
- Cox J. E.; Thummel C. S.; Tennessen J. M. Metabolomic Studies in Drosophila. Genetics 2017, 206 (3), 1169–1185. 10.1534/genetics.117.200014. [DOI] [PMC free article] [PubMed] [Google Scholar]
- Li H.; Tennessen J. M. Methods for studying the metabolic basis of Drosophila development. Wiley interdisciplinary reviews. Developmental biology 2017, 6 (5), e280 10.1002/wdev.280. [DOI] [PMC free article] [PubMed] [Google Scholar]
- Tennessen J. M.; Bertagnolli N. M.; Evans J.; Sieber M. H.; Cox J.; Thummel C. S. Coordinated metabolic transitions during Drosophila embryogenesis and the onset of aerobic glycolysis. G3: Genes, Genomes, Genet. 2014, 4 (5), 839–50. 10.1534/g3.114.010652. [DOI] [PMC free article] [PubMed] [Google Scholar]
- Cheng L. Y.; Bailey A. P.; Leevers S. J.; Ragan T. J.; Driscoll P. C.; Gould A. P. Anaplastic Lymphoma Kinase Spares Organ Growth during Nutrient Restriction in Drosophila. Cell 2011, 146 (3), 435–447. 10.1016/j.cell.2011.06.040. [DOI] [PubMed] [Google Scholar]
- Stefana M. I.; Driscoll P. C.; Obata F.; Pengelly A. R.; Newell C. L.; MacRae J. I.; Gould A. P. Developmental diet regulates Drosophila lifespan via lipid autotoxins. Nat. Commun. 2017, 8 (1), 1384. 10.1038/s41467-017-01740-9. [DOI] [PMC free article] [PubMed] [Google Scholar]
- Dieterle F.; Ross A.; Schlotterbeck G.; Senn H. Probabilistic quotient normalization as robust method to account for dilution of complex biological mixtures. Application in H-1 NMR metabonomics. Anal. Chem. 2006, 78 (13), 4281–4290. 10.1021/ac051632c. [DOI] [PubMed] [Google Scholar]
- Ragan T. J.; Bailey A. P.; Gould A. P.; Driscoll P. C. Volume Determination with Two Standards Allows Absolute Quantification and Improved Chemometric Analysis of Metabolites by NMR from Submicroliter Samples. Anal. Chem. 2013, 85 (24), 12046–12054. 10.1021/ac403111s. [DOI] [PMC free article] [PubMed] [Google Scholar]
- Ryder E.; Blows F.; Ashburner M.; Bautista-Llacer R.; Coulson D.; Drummond J.; Webster J.; Gubb D.; Gunton N.; Johnson G.; O’Kane C. J.; Huen D.; Sharma P.; Asztalos Z.; Baisch H.; Schulze J.; Kube M.; Kittlaus K.; Reuter G.; Maroy P.; Szidonya J.; Rasmuson-Lestander A.; Ekstrom K.; Dickson B.; Hugentobler C.; Stocker H.; Hafen E.; Lepesant J. A.; Pflugfelder G.; Heisenberg M.; Mechler B.; Serras F.; Corominas M.; Schneuwly S.; Preat T.; Roote J.; Russell S. The DrosDel collection: a set of P-element insertions for generating custom chromosomal aberrations in Drosophila melanogaster. Genetics 2004, 167 (2), 797–813. 10.1534/genetics.104.026658. [DOI] [PMC free article] [PubMed] [Google Scholar]
- Gutierrez E.; Wiggins D.; Fielding B.; Gould A. P. Specialized hepatocyte-like cells regulate Drosophila lipid metabolism. Nature 2007, 445 (7125), 275–80. 10.1038/nature05382. [DOI] [PubMed] [Google Scholar]
- Bligh E. G.; Dyer W. J. A rapid method of total lipid extraction and purification. Can. J. Biochem. Physiol. 1959, 37 (8), 911–7. 10.1139/o59-099. [DOI] [PubMed] [Google Scholar]
- Liu W. W.; Wilson R. I. Glutamate is an inhibitory neurotransmitter in the Drosophila olfactory system. Proc. Natl. Acad. Sci. U. S. A. 2013, 110 (25), 10294–9. 10.1073/pnas.1220560110. [DOI] [PMC free article] [PubMed] [Google Scholar]
- Sawala A.; Gould A. P. The sex of specific neurons controls female body growth in Drosophila. PLoS Biol. 2017, 15 (10), e2002252 10.1371/journal.pbio.2002252. [DOI] [PMC free article] [PubMed] [Google Scholar]
- Aickin M.; Gensler H. Adjusting for multiple testing when reporting research results: the Bonferroni vs Holm methods. Am. J. Public Health 1996, 86 (5), 726–8. 10.2105/AJPH.86.5.726. [DOI] [PMC free article] [PubMed] [Google Scholar]
Associated Data
This section collects any data citations, data availability statements, or supplementary materials included in this article.