Abstract
Context
Total insulin clearance is decreased in nonalcoholic fatty liver disease (NAFLD), but the relationship between liver fat and hepatic insulin extraction (HIE) is unknown.
Objective
This cross-sectional study addresses the hypothesis that HIE is reduced in NAFLD and investigates metabolic and/or anthropometric characteristics most closely associated with insulin clearance.
Participants
Nondiabetic subjects with NAFLD (n = 13) and age- and body mass index (BMI)-matched controls with normal liver enzymes (n = 15) underwent abdominal CT, dual-energy X-ray absorptiometry, oral glucose tolerance test (OGTT), and labeled two-step hyperinsulinemic-euglycemic clamps.
Outcome Measurements
Liver fat was estimated by the CT liver/spleen ratio. Hepatic and extrahepatic insulin clearances were modeled using clamp and OGTT data.
Results
Extrahepatic insulin clearance and HIE were not different between NAFLD and controls and did not correlate with liver fat. HIE was positively correlated with insulin sensitivity [rate of glucose disposal (Rd; low r = +0.7, P < 0.001; high r = +0.6, P = 0.001), adiponectin (r = +0.55, P = 0.004), and insulin-mediated suppression of clamp nonesterified free fatty acid (NEFA; r = +0.67, P < 0.001)] but was not associated with fasting NEFA, insulin-mediated suppression of glucose production, or measures of adiposity. Extrahepatic insulin clearance was positively associated with percent body fat (r = +0.44, P = 0.02) and subcutaneous fat (r = +0.42, P = 0.03) but not BMI, intra-abdominal fat, liver fat, Rd, adiponectin, or NEFA.
Conclusions
HIE is not directly associated with hepatic steatosis but is associated with muscle and adipose tissue insulin resistance. The data suggest differential regulation of insulin clearance with extrahepatic insulin clearance being associated with body fat and not insulin sensitivity.
Modeling of clamp and oral glucose tolerance test data revealed that hepatic insulin extraction is not directly associated with hepatic steatosis but is associated with muscle and adipose tissue insulin sensitivity.
Type 2 diabetes results from inadequate insulin secretion in the setting of insulin resistance (1). Obesity is a common feature and is strongly related to lower insulin sensitivity. In the setting of insulin resistance, both increased insulin secretion and decreased insulin clearance are compensatory mechanisms that augment circulating insulin concentrations. Total insulin clearance includes that extracted by the liver, as well as that cleared by other tissues. Insulin is secreted directly into the portal vein, where it undergoes first-pass metabolism by the liver. Hepatic insulin extraction (HIE) is often on the order of 50% to 80% (2–4) and can be modulated on a minute-by-minute basis (3). Thus, the liver plays a major role in the regulation of peripheral insulin concentrations.
Nonalcoholic fatty liver disease (NAFLD) is defined as ectopic fat accumulation in the liver in individuals who do not drink excessive amounts of alcohol. It is more prevalent in those who are obese and is associated with insulin resistance, hyperinsulinemia, the metabolic syndrome, and an increased risk for developing type 2 diabetes (5). The small amount of data in the literature suggests that liver fat accumulation is associated with decreased total insulin clearance. Total insulin clearance, when based on insulin infusion rates during a hyperinsulinemic-euglycemic clamp, cannot distinguish insulin extracted by the liver and clearance by other peripheral tissues. It has been shown to relate inversely to liver fat content in nondiabetic subjects (6) and in those with type 2 diabetes (7). However, HIE has not been well characterized in NAFLD. One group estimated HIE using the ratio of the area under the curve (AUC) for insulin and C-peptide during an oral glucose tolerance test (OGTT) and found that those with NAFLD were more insulin resistant, had higher body mass index (BMI), and had slightly lower HIE (8). Whereas this comparison of AUC insulin and C-peptide ratios provides some measure of insulin clearance, it does not distinguish between hepatic and extrahepatic clearance (9, 10). Another study modeled data from an intravenous glucose tolerance test (IVGTT) and showed a trend to lower HIE in those with NAFLD (11), but the groups were not BMI matched, and the IVGTT protocol did not include an exogenous dose of insulin so as to estimate accurately the relative contributions of hepatic and extrahepatic insulin clearance.
To address the hypothesis that HIE is decreased in NAFLD, we analyzed data from hyperinsulinemic-euglycemic clamps and OGTTs using a mathematical model of insulin kinetics (12) that provides estimates of both HIE and extrahepatic insulin clearance. Furthermore, as HIE and extrahepatic insulin extraction may be differentially regulated (12), we also analyzed the data to determine which metabolic and/or anthropometric characteristics were most closely associated with HIE and extrahepatic insulin clearance.
Materials and Methods
Subjects
This analysis used data from a cross-sectional study comparing NAFLD (cases) with control subjects; portions of the data have been published previously (13). The study was approved by the Human Subjects Review Committees at the VA Puget Sound Health Care System and the University of Washington. All subjects gave written, informed consent to participate.
Subjects with NAFLD were recruited from local area gastroenterologists based on either a liver biopsy done separately for clinical indications within the past 3 years, demonstrating >5% liver fat or the presence of elevated liver enzymes in conjunction with imaging consistent with fatty liver disease. All subjects had no history of excessive alcohol intake. They were excluded if they had evidence of cirrhosis on a liver biopsy, substantial weight loss (>5%) since the liver biopsy, other known causes of elevated liver enzymes, or a serum alanine aminotransferase greater than five times the upper limit of normal (laboratory normal range: 0 to 39 U/L). Control subjects were recruited from the Seattle area by advertisement and fliers. Control subjects were excluded if they had a history of liver disease or liver enzymes above the normal range. Additional exclusion criteria for all subjects included the following: fasting glucose ≥126 mg/dL or history of diabetes; self-reported alcohol intake >20 g/d; other causes of elevated liver enzymes, such as hepatitis B or C; serum creatinine >1.4 mg/dL (men) and >1.3 mg/dL (women); hematocrit <33%; pregnancy or lactation; and any serious medical condition or use of medications known to affect insulin sensitivity, glucose metabolism, or liver fat accumulation. A total of 34 subjects were studied, and data on 28 were eligible for analysis. Three subjects (two cases and one control) were excluded based on OGTT results in the diabetic range. Full sets of samples were not available for an additional three subjects (all cases).
Metabolic tests
All study procedures were performed after an overnight fast of at least 10 hours on separate days within 2 weeks. Plasma samples were placed immediately on ice, processed in a refrigerated centrifuge at 4°C, and separated and aliquots frozen at −80°C until assayed.
OGTT
Glucose (75 g) was consumed within 5 minutes and blood samples drawn at −10, −5, −1, 10, 20, 30, 60, 90, and 120 minutes relative to the start of glucose ingestion. Glucose tolerance status was classified according to American Diabetes Association criteria (14).
Hyperinsulinemic-euglycemic clamp
An intravenous catheter was placed in each arm and the sampling arm wrapped in a heating pad to “arterialize” the blood. A primed (200 mg/m2 × glucose/100 given over 5 minutes), continuous (2 mg/m2/min) infusion of [6,6-2H2]glucose was started and continued throughout the clamp procedure. After a 3-hour basal period, a two-step hyperinsulinemic-euglycemic clamp was started with a 3-hour low-dose insulin infusion (20 mU/m2/min), followed by a primed 2-hour high-dose insulin infusion (160 mU/m2/min × 5 minutes and then 80 mU/m2/min). Blood glucose was measured every 5 minutes using a bedside iStat machine, and a variable rate infusion of 20% dextrose enriched with 2% [6,6-2H2]glucose was titrated to maintain the blood glucose concentration at 90 mg/dL. Samples were drawn for glucose and insulin every 30 minutes throughout the clamp. Samples for glucose, insulin, and [6,6-2H2]glucose were drawn every 15 minutes during the final half hour of the basal low-dose, and high-dose insulin periods. Samples for nonesterified free fatty acids (NEFAs) were drawn into tubes containing the lipolysis inhibitor Orlistat at −30, −15, −1, 10, 20, 30, and 60 minutes relative to the start of the low-dose insulin infusion and placed immediately on ice. NEFA samples were processed within 30 minutes and the plasma flash frozen before storage.
Body composition analyses
Body fat mass and lean mass were determined using dual-energy X-ray absorptiometry (Lunar; GE Medical Systems, Madison, WI). Unenhanced CT scan images were obtained on a General Electric Discovery HD750 CT scanner (GE Healthcare, Waukesha, WI). Intra-abdominal (IAF) and abdominal subcutaneous fat (SQF) areas were measured at the top of the iliac crest and quantified using the Tomovision program (SliceOMatic V4.3, Tomovision, Milletta, Magog, QC) by a trained technologist with an intraobserver coefficient of variation of <7% for IAF and <3% for SQF.
Liver fat was assessed by CT scan, measuring the density ratio between the liver and spleen by Hounsfield units [liver/spleen ratio (L/S)]. An L/S < 1 is considered consistent with fatty liver. Ten separate measurements distributed throughout the liver and spleen were obtained and the Hounsfield units averaged.
Analyses of samples
Plasma glucose was determined by the glucose oxidase method. Plasma insulin was measured by an automated electrochemiluminescence immunoassay (Cobas e 601; Roche Diagnostics, Indianapolis, IN), C-peptide using Tosoh reagents on a Tosoh 2000 autoanalyzer (Tosoh Biosciences, Inc., South San Francisco, CA), adiponectin by radioimmunoassay (Millipore, Billerica, MA), and plasma NEFA concentrations by an enzymatic method (Wako, Richmond, VA). Levels of [6,6-2H2]glucose were measured by mass spectrometry, as previously described (15, 16).
Calculations
Isotopic steady-state levels were achieved during the final 30 minutes of the basal low- and high-dose insulin periods of the clamp. Endogenous glucose production (EGP) was determined as the rate of glucose appearance, calculated using Steele’s steady-state equations (17). Whole-body insulin sensitivity was calculated as the rate of glucose disposal (Rd)/lean body mass at the end of both low- and high-insulin infusion periods. Hepatic insulin sensitivity was determined as percent suppression of EGP at the end of the low-dose hyperinsulinemic clamp. As an estimate of adipose tissue insulin sensitivity, suppression of free fatty acids (FFAs) was calculated as ΔFFA0–30 minutes clamp/basal FFA × 100.
Mathematical model to estimate hepatic insulin extraction and extrahepatic insulin clearance
Parameters for insulin clearance were calculated as previously described (12). In brief, for each subject, data from both the OGTT and hyperinsulinemic-euglycemic clamp were used to estimate a single set of insulin clearance parameters for that subject. Insulin secretion rates (ISRs) during the OGTT and clamps were calculated from the measured C-peptide concentrations using deconvolution (18). Then, the calculated ISRs, known insulin infusion rates (during the hyperinsulinemic clamps only), and measured plasma insulin concentrations were used to identify the insulin clearance parameters (describing hepatic and extrahepatic insulin clearance and the volume of distribution) for each subject who provided the best fit to the measured plasma insulin data from both the OGTTs and clamps. Extrahepatic insulin clearance was assumed to be linear in all subjects (19) and the extrahepatic clearance parameter was assumed to be the same for both the OGTT and the clamp. HIE for each subject was modeled using either a linear model (with a single parameter [fractional extraction liver (FEL)] describing the fractional extraction [hepatic extraction = FEL × insulin delivery rate to the liver]) or with a saturable nonlinear clearance model (with Vmax (maximal hepatic degradation rate) and Michaelis constant parameters), as previously described (12). The model that provided the better fit was retained for that subject, and the same model and parameters for hepatic clearance were used for both the OGTT and clamp study. Data are presented as fractional hepatic extraction to account for the total amount of insulin being delivered to the liver. HIE is given for each time point of the OGTT, as well as averaged over the 120 minutes of the OGTT.
Statistical methods
Data are presented as means ± SEM for normally distributed data and median (interquartile range) for non-normally distributed data. Variables were compared between cases and controls using independent Student’s t test; log transformation was done before comparison for variables that were not normally distributed. As in Polidori et al. (12), the goodness of fit of the model to the data was assessed using the normalized root mean square error. Time series-generalized estimating equations analysis was used to compare percent HIE during the OGTT between groups. Linear regression analysis was used to determine independent predictors of metabolic outcomes. Where appropriate, multiple regression analyses were performed to adjust for appropriate variables. P < 0.05 was considered significant. Analyses were performed using SPSS V19.0 (IBM).
Results
Subject characteristics
There were 13 subjects with NAFLD (nine white, two Hispanic, one Pacific Islander, and one mixed race) and 15 controls (12 white, two Native American, and one African American). Cases and controls were well matched for age, sex, and BMI (Table 1). There were also no differences in reported alcohol intake, hemoglobin A1c (HbA1c), body fat mass, or abdominal fat distribution between groups. As expected, the L/S was significantly lower in the NAFLD group.
Table 1.
Subject Characteristics, Body Anthropometrics, and Clamp Metabolic Parameters
| Controls, n = 15 | NAFLD, n = 13 | P Value | |
|---|---|---|---|
| Age, y | 50.6 ± 1.7 | 49.7 ± 2.3 | 0.8 |
| Sex, men/women | 8/7 | 9/4 | 0.3 |
| BMI, kg/m2 | 33.4 ± 1.28 | 32.6 ± 1.1 | 0.7 |
| HbA1c, % | 5.67 ± 0.07 | 5.62 ± 0.06 | 0.6 |
| Alcohol intake, drinks/wk | 3.5 ± 1.1 | 2.7 ± 1.1 | 0.7 |
| L/S | 1.22 ± 0.04 | 0.76 ± 0.06 | <0.001 |
| Body fat mass, % | |||
| Men | 34.2 ± 1.3 | 30.7 ± 1.3 | 0.08 |
| Women | 47.2 ± 2.8 | 48.7 ± 0.9 | 0.6 |
| Body fat mass, kg | 36.1 ± 2.4 | 34.1 ± 3.0 | 0.6 |
| IAF area, cm2 | 177.4 (85.3) | 155.0 (111.3) | 0.5 |
| SQF area, cm2 | 384.4 (200.9) | 355.5 (204.1) | 0.2 |
| Adiponectin, μg/mL | |||
| Men | 6.2 ± 1.2 | 7.0 ± 1.4 | 0.7 |
| Women | 13.5 ± 3.3 | 10.4 ± 1.8 | 0.5 |
| Basal EGP, mg/min | 160.4 ± 14.0 | 155.5 ± 12.4 | 0.8 |
| Suppression EGP end low-dose clamp, % | 56.4 ± 4.3 | 50.1 ± 7.1 | 0.5 |
| Fasting NEFAs, mEq/L | 0.43 ± 0.05 | 0.49 ± 0.03 | 0.3 |
| Suppression NEFAs 0–30 min, % | 40.5 ± 6.8 | 40.0 ± 5.9 | 0.9 |
Abbreviation: HbA1c, hemoglobin A1c.
Metabolic parameters: OGTT
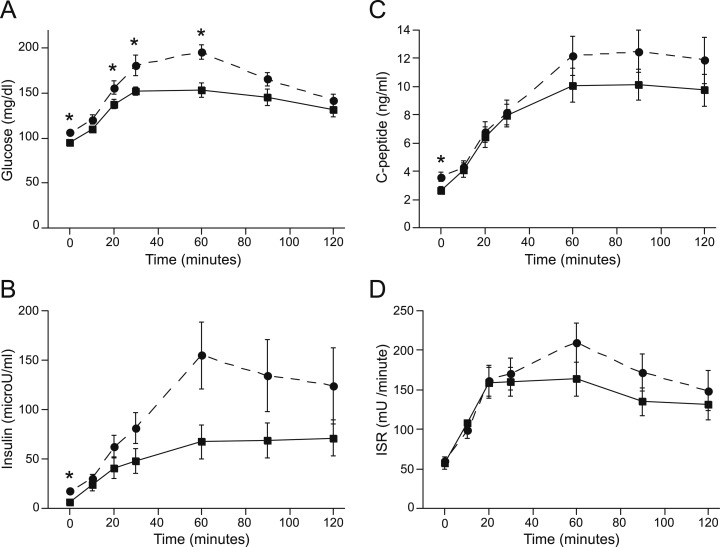
During the OGTT, plasma glucose levels were higher in the NAFLD group at fasting, 20, 30, and 60 minutes (Fig. 1). Fasting insulin and C-peptide levels were higher in the NAFLD group (Fig. 1). Incremental AUC insulin (7.4 ± 1.4 vs NAFLD 10.7 ± 2.7 mU/mL/120 min, P = 0.3) during the OGTT did not differ significantly between groups. ISRs also did not differ at any time point (Fig. 1).
Figure 1.
(A) Glucose, (B) insulin, (C) C-peptide, and (D) ISR profiles during the OGTT for control (square, solid line) and NAFLD (circle, dashed line) subjects. Fasting and 20-, 30-, and 60-minute glucose levels were higher in NAFLD. Fasting insulin and C-peptide levels were higher in NAFLD. *P < 0.05.
Metabolic parameters: clamp
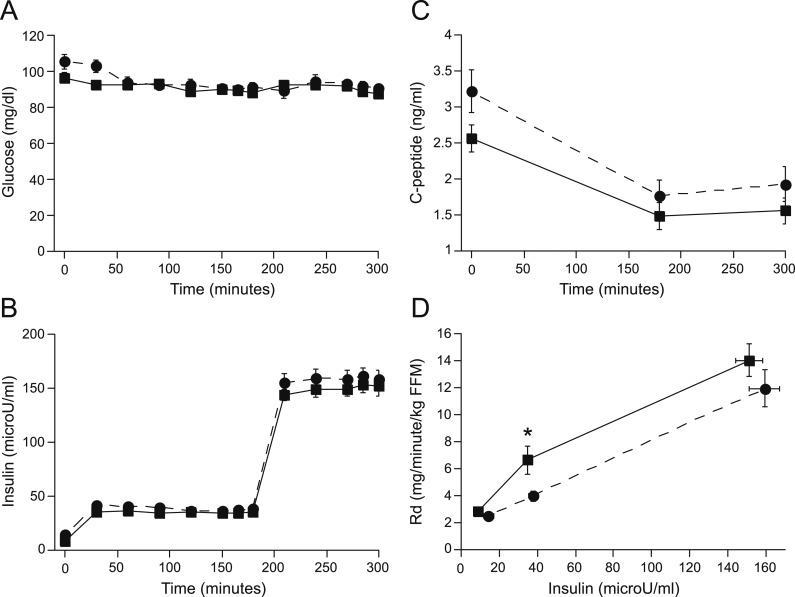
Insulin and glucose concentrations during the clamp did not differ between groups (Fig. 2). C-Peptide levels decreased during the insulin infusion in both groups but were also not different between groups (Fig. 2). Rd, during the low-dose insulin infusion, was lower in those with NAFLD but did not reach statistical significance at high-dose insulin (Fig. 2). Basal EGP and NEFAs and suppression of EGP and NEFAs also did not differ between NAFLD and control subjects (Table 1).
Figure 2.
(A) Glucose, (B) insulin, and (C) C-peptide levels during the clamp and (D) the Rd in control (square, solid line) and NAFLD (circle, dashed line) subjects; Rd low was significantly lower in NAFLD. *P = 0.02. FFM, fat-free mass.
Insulin clearance
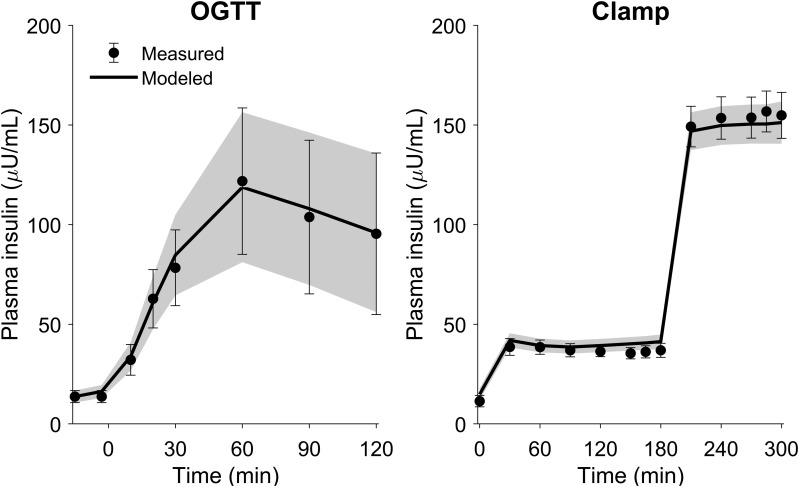
The model was able to describe accurately the plasma insulin time profiles during both the OGTT and hyperinsulinemic clamps (Fig. 3). The means ± SD normalized root mean square error was 5.0 ± 1.9%, and the parameters were estimated with good precision (means ± SD, coefficient of variation for all parameter estimates, was 16 ± 14%).
Figure 3.
Measured and modeled plasma insulin concentrations (mean and 95% CI) during the OGTT and hyperinsulinemic clamps. The measured data are shown with symbols and error bars and the modeled data are shown with the solid lines and shaded regions.
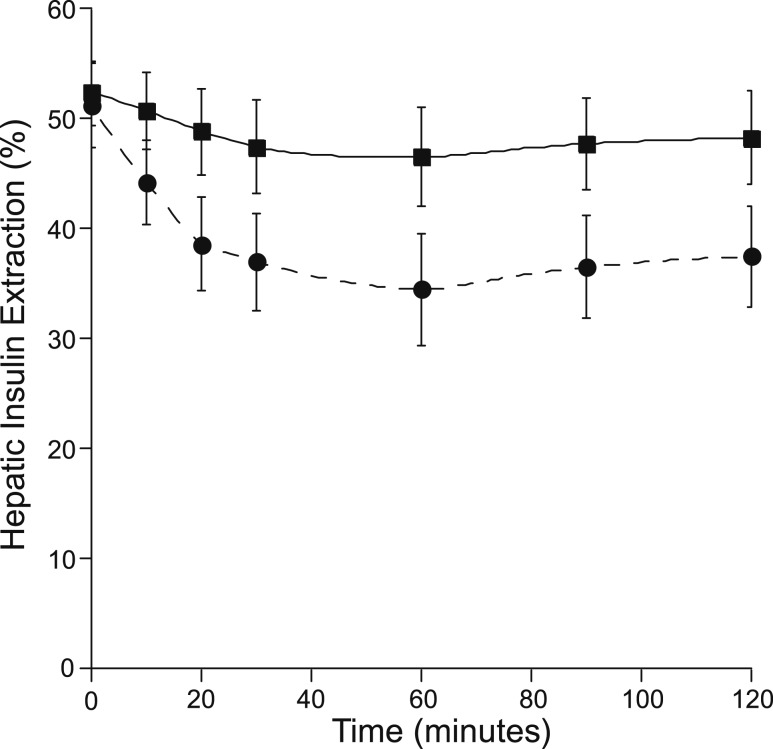
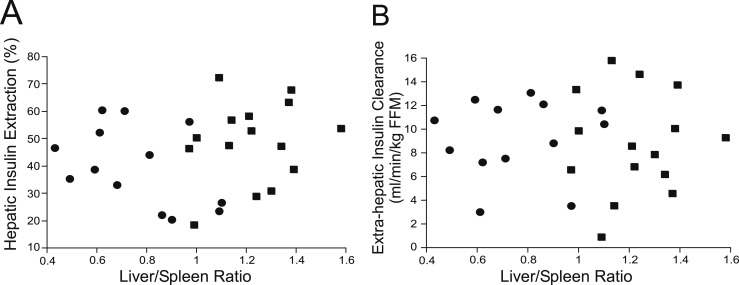
Extrahepatic insulin clearance [NAFLD 9.29 ± 0.90 vs controls 8.79 ± 1.11 mL/min/kg fat-free mass (FFM), P = 0.7] and basal HIE did not differ between NAFLD and controls (Fig. 4). Mean HIE during the OGTT not differ significantly between groups (P = 0.12). HIE trended lower in the NAFLD group at several time points during the OGTT but did not reach statistical significance (30 and 120 minutes, P = 0.1; 20, 60, and 90 minutes, P = 0.08; Fig. 4). With the use of generalized estimating equation time series analysis, there was no significant effect of group on HIE over the course of the OGTT (P = 0.1). Based on linear regression analysis, liver fat (L/S ratio) was not associated with HIE (basal: P = 0.6; mean OGTT: P = 0.4) or extrahepatic clearance (P = 0.9; Fig. 5).
Figure 4.
Fractional HIE during the OGTT in controls (square, solid line) and NAFLD (circle, dashed line). There were no statistically significant differences between groups (P < 0.05).
Figure 5.
Associations between liver fat by the L/S and measures of insulin clearance. There was no relationship between the L/S and mean OGTT (A) HIE or (B) extrahepatic insulin clearance. Controls (square) and NAFLD (circle).
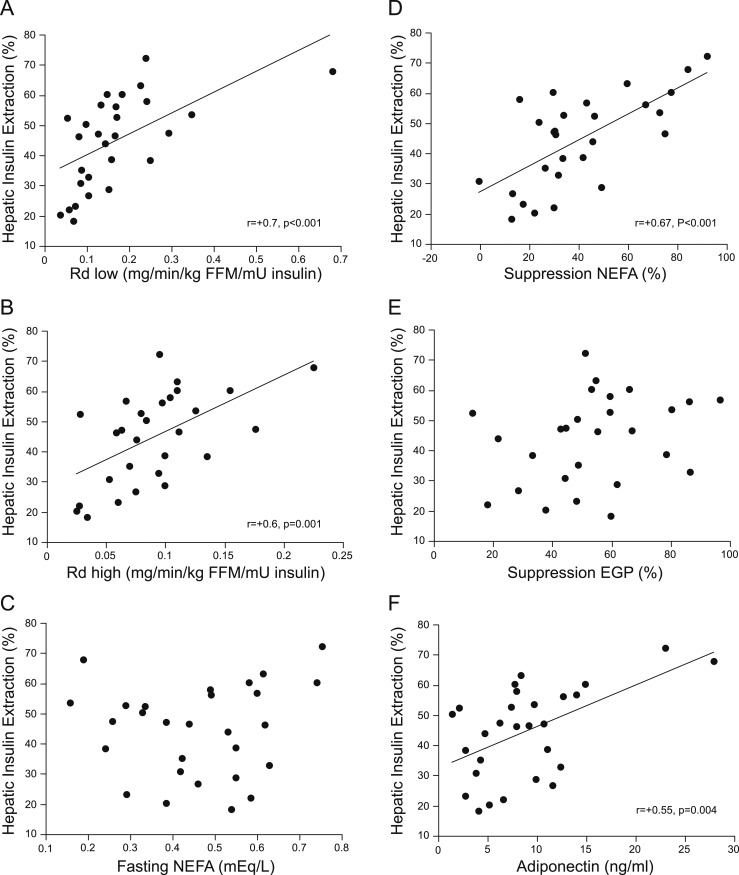
Further analyses were undertaken to determine factors associated with insulin clearance. Both basal and mean HIE during the OGTT were associated with muscle insulin sensitivity, determined both as Rd low (basal: r = +0.5, P < 0.01; mean OGTT: r = +0.7, P < 0.001; Fig. 6) and Rd high (basal: r = +0.5, P < 0.01; mean OGTT: r = +0.6, P = 0.001; Fig. 6). Both basal and OGTT HIE were strongly associated with percent suppression of NEFAs during the first 30 minutes of the low-dose clamp (basal: r = +0.44, P = 0.02; mean OGTT: r = +0.67, P < 0.001; Fig. 6) but not with fasting NEFAs (P = 0.6; Fig. 6). When adjusted for Rd, the association between basal HIE and suppression of NEFAs disappeared, but the association between mean OGTT HIE and suppression of NEFAs remained (P < 0.05). These associations remained significant after further adjustment for sex. HIE also was associated with adiponectin concentrations, which were adjusted for sex to account for known sex differences in this hormone (20) (r = +0.55, P = 0.004; Fig. 6). HIE was not associated with hepatic insulin sensitivity, as estimated by insulin suppression of EGP (P = 0.15; Fig. 6). HIE also was not associated with fasting (P = 0.9), 2-hour (P = 0.5) or AUC OGTT glucose (P = 0.14), or measures of adiposity [BMI (P = 0.7), percent fat mass (P = 0.3), IAF (P = 0.3), or SQF (P = 0.8)].
Figure 6.
Correlations between HIE and metabolic parameters in the whole cohort. Significant correlations were found between HIE and (A) Rd low and (B) Rd high, (D) suppression of NEFAs, and (F) adiponectin but not with (C) fasting NEFAs or (E) suppression of EGP.
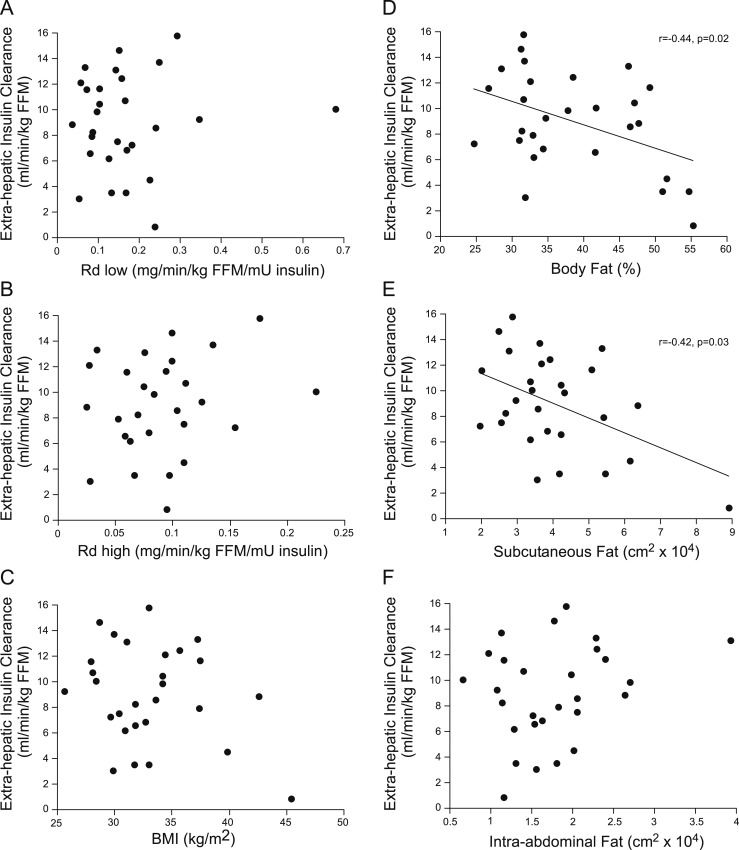
In contrast, extrahepatic clearance of insulin was not associated with Rd low (P = 0.8; Fig. 7) or Rd high (P = 0.7; Fig. 7). Extrahepatic insulin clearance was associated with percent body fat (r = +0.44, P = 0.02; Fig. 7) and SQF (r = +0.42, P = 0.03; Fig. 7) but not with BMI (P = 0.16; Fig. 7) or IAF (P = 0.13; Fig. 7). When adjusted for sex, the association with percent body fat remained (P = 0.05) but was lost for SQF (P = 0.1). There were no significant associations among extrahepatic insulin clearance and fasting NEFAs (P = 0.13), percent suppression of clamp NEFAs (P = 0.08), suppression of EGP (P = 0.4), fasting (P = 0.7) or 2-hour OGTT glucose (P = 0.6), or adiponectin concentrations (P = 0.4 adjusted for sex).
Figure 7.
Correlations between extrahepatic insulin clearance and metabolic and anthropometric variables in the whole cohort. Extrahepatic insulin clearance was significantly associated with (D) percent body fat and (E) abdominal SQF but not with (A) Rd low, (B) Rd high, (C) BMI, or (F) IAF.
The best-fit model for HIE was linear in 11/15 controls and 6/13 NAFLD subjects and nonlinear in the remainder (4/15 controls and 7/13 NAFLD). Those with nonlinear kinetics tended to have a slightly higher BMI (31.9 ± 1.1 linear vs 34.9 ± 1.1 kg/m2 nonlinear, P = 0.07) but otherwise, were well matched relative to those with linear kinetics for age, sex, body fat mass, L/S, HbA1c, and glucose (data not shown). HIE, during the OGTT, was similar in the basal state (51.9 ± 3.0% linear vs 52.0 ± 3.9% nonlinear, P = 0.9) but was significantly decreased at all other time points in those with nonlinear kinetics, with an overall mean of 51.9 ± 3.0% in those with linear kinetics and 33.9 ± 3.8% in those with nonlinear kinetics (P = 0.001). Those with nonlinear kinetics had higher fasting insulin concentrations (9.96 ± 1.06 linear vs 19.43 ± 2.87 nonlinear μU/mL, P = 0.009) and double the amount of insulin in the periphery during the OGTT (insulin AUC: 7.36 ± 0.88 linear vs 15.6 ± 3.5 mU/mL/120 min, P = 0.01), with higher ISRs at the 30- and 60-minute time points (P < 0.05). Whereas fasting NEFAs were not different (0.46 ± 0.04 linear vs 0.46 ± 0.04 nonlinear mEq/L, P = 0.8), those subjects with nonlinear kinetics had less insulin-mediated suppression of NEFAs during the first 30 minutes of the clamp (50.5 ± 5.8 linear vs 24.3 ± 3.6% nonlinear, P = 0.004). There were no differences between linear and nonlinear groups in Rd low or high or suppression of EGP.
Discussion
This study systematically examines hepatic and extrahepatic insulin clearance in subjects with and without NAFLD and relates these findings to liver fat content, as well as measures of insulin sensitivity obtained with the hyperinsulinemic-euglycemic clamp. Two major findings arise from this analysis. First, HIE was not associated with liver fat but instead, was strongly related to muscle and adipose tissue insulin sensitivity, as reflected by insulin-mediated glucose disposal and suppression of NEFAs during the clamp, with decreased HIE in those that were more insulin resistant. Of note, suppression of EGP during the low-dose clamp, a measure of hepatic insulin sensitivity, was not associated with HIE. Second, there appeared to be differential regulation of hepatic and extrahepatic insulin clearance; extrahepatic insulin clearance was not modulated by insulin sensitivity but was associated with measures of adiposity, including percent body fat and SQF.
Previous studies have shown that total insulin clearance is associated with greater adiposity (21–23), lower insulin sensitivity (22, 23), and an increased risk of diabetes (21, 24). However, these studies only examined total insulin clearance and also did not evaluate liver fat. In the few studies that examined liver fat and insulin clearance, one study showed that total insulin clearance was lower in those with NAFLD vs those with low liver fat (6), and two studies showed that estimated HIE suffered from methodological issues (8, 11). We found no difference in extrahepatic clearance between those with and without NAFLD. Whereas we found that HIE, during the OGTT, tended to be lower in those with NAFLD, this is likely explained by differences in insulin sensitivity and not liver fat per se, based on regression analysis, demonstrating no association between liver fat and HIE.
Our data suggest differential regulation of insulin clearance by the liver and the periphery. In the liver, HIE was clearly associated with insulin sensitivity but not with measures of adiposity. In contrast, extrahepatic insulin clearance was associated with measures of body fat and not insulin sensitivity. Polidori et al. (12) made a similar observation that hepatic and peripheral clearance values appeared to be independently regulated, with many subjects having relatively high values for one parameter and low values for the other. The strong association between HIE and insulin sensitivity was also observed by Peiris et al. (4). They observed lower cumulative HIE during an OGTT in obese (48%) vs nonobese (59%) premenopausal, healthy women, with a strong correlation between insulin sensitivity measured by clamp and the percent fractional HIE (4). In contrast, with the modeling of noninsulin-modified IVGTTs, Kautzky-Willer et al. (25) found no difference in fractional HIE in obese (78%) vs lean (78%) healthy men and women, despite lower whole-body insulin sensitivity. This discrepant finding may be explained by the fact that the study procedure lacked exogenous insulin to determine the kinetics of insulin clearance, which has been shown to demonstrate considerable interindividual variability (12). Animal data support the concept that regulation of HIE is an important compensatory mechanism in response to peripheral insulin resistance. A 12-week, high-fat feeding dog study, in which first-pass hepatic insulin clearance was directly measured by intraportal insulin infusion, found that as body fat increased, and the animals developed insulin resistance, insulin secretion increased, and HIE decreased from 59.5% at baseline to 43.9% at 12 weeks (19).
In some of our subjects, the preferred model for HIE was linear, whereas for others, the nonlinear model was preferred. Those with nonlinear kinetics had much higher insulin levels and also lower insulin-mediated suppression of NEFAs during the clamp but again, no difference in fasting NEFAs. One possible explanation for the difference between the subjects with linear and nonlinear hepatic extraction is that the delivery of insulin to the liver in subjects with lower ISRs and lower plasma insulin concentrations remained in a range where hepatic clearance is essentially linear, but if these subjects were challenged in a way that further increased portal insulin levels, hepatic insulin clearance would also be saturated. In dogs, portal infusion of insulin was linear until the concentration exceeded 110 μU/mL, demonstrating a saturable pathway at high insulin concentrations (26). In a small glucose dose-response study (n = 7 healthy men) with modeling of OGTTs, Eaton et al. (27) found that the increase of the dose of oral glucose (10, 25, and 100 g) led to increased insulin secretion and a progressive reduction in HIE (67%, 53%, and 42%).
It has been postulated that NEFAs act as an important metabolic signal and could be key regulators in HIE (28). The strong correlation that we observed between HIE and insulin-mediated suppression of NEFAs supports this concept. This idea also has support from work in animal models. Fatty acids inhibit insulin binding, degradation, and function in isolated rat hepatocytes (29), and perfusion of the rat liver in situ with NEFAs reduced hepatic clearance of insulin by 40%, whereas elevation of glucose alone had no effect (30). Peripheral infusion of intralipid plus heparin and intraportal insulin infusion in dogs decreased HIE (31). A study in lean women given an infusion of intralipid/heparin vs saline in the basal state and at 7 and 11 mM glucose concentrations demonstrated that the elevation in NEFAs increased insulin secretion but did not affect insulin clearance in the basal state. However, when NEFA concentrations increased during the 7- and 11-mM hyperglycemic clamps, a substantial decrease in insulin clearance was found (32). These data are in keeping with our finding that the association between HIE and NEFAs was only observed with insulin-mediated suppression of NEFAs and not with fasting NEFAs. Thus, the signal responsible for modulation of HIE may depend on both acute changes in NEFAs and other factors, such as glucose or insulin, that would occur during an OGTT or meal.
The strengths of our study include the pairing of OGTT data with hyperinsulinemic-euglycemic clamps with tracer to estimate insulin sensitivity at both the liver and muscle. The combination of data from an OGTT, where all insulin derives from endogenous secretion and is subject to first-pass hepatic extraction, with data from hyperinsulinemic clamps, where virtually all insulin is infused, enables both hepatic and extrahepatic insulin clearance to be estimated. There are some limitations to our study. Magnetic resonance spectroscopy (MRS) is a more robust method to quantify liver fat but was not feasible for this study. Whereas not as sensitive as MRS for detection of liver fat, CT analysis has a specificity of 93.5% for detecting liver fat if >5% (33) and has been previously correlated with liver-fat quantification by histology (34) and MRS (35). Seven of the 28 subjects in our study were not white, and there may be ethnic or racial differences in HIE. HIE has been shown to be decreased in those of African American descent (36, 37). Our study included only one person who identified as African American. To our knowledge, HIE has not been compared between whites and other racial/ethnic groups. Finally, the study is limited by its small size and cross-sectional nature and cannot determine cause and effect. However, the correlation analyses provide meaningful information to generate testable hypotheses.
In conclusion, we have shown that decreased HIE is associated with reduced insulin sensitivity and not related to high-liver fat content. The strong association between HIE and insulin-mediated suppression of NEFAs suggests that changes in NEFAs may be important signals regulating HIE. As HIE plays an important role in the regulation of peripheral insulin concentrations, it can function as a compensatory response in the setting of insulin resistance. Further studies to understand these normal physiologic responses better are warranted and could lead to development of novel therapies for patients with or at risk for type 2 diabetes.
Acknowledgments
We thank the study subjects for their time and effort in participating in the study and the nursing staff on the University of Washington General Clinical Research Unit who assisted with the clamps.
Financial Support: This work was supported by the Department of Veterans Affairs (Office of Research and Development Medical Research Service) and U.S. National Institutes of Health Grants UL1RR025014, P30DK035816, T32DK007247, and P30DK017047.
Author Contributions: K.M.U. designed the study, performed the study procedures, analyzed the data, and wrote the manuscript. D.C.P. modeled the data and contributed to writing the manuscript. S.E.K. assisted in study design and manuscript writing. All authors approved the final version of the manuscript.
Disclosure Summary: The authors have nothing to disclose.
Glossary
Abbreviations:
- AUC
area under the curve
- BMI
body mass index
- EGP
endogenous glucose production
- FFA
free fatty acid
- HbA1c
hemoglobin A1c
- HIE
hepatic insulin extraction
- IAF
intra-abdominal fat
- ISR
insulin secretion rate
- IVGTT
intravenous glucose tolerance test
- L/S
liver/spleen ratio
- MRS
magnetic resonance spectroscopy
- NAFLD
nonalcoholic fatty liver disease
- NEFA
nonesterified free fatty acid
- OGTT
oral glucose tolerance test
- Rd
rate of glucose disposal
- SQF
subcutaneous fat
References
- 1. Kahn SE, Hull RL, Utzschneider KM. Mechanisms linking obesity to insulin resistance and type 2 diabetes. Nature. 2006;444(7121):840–846. [DOI] [PubMed] [Google Scholar]
- 2. Field JB. Extraction of insulin by liver. Annu Rev Med. 1973;24(1):309–314. [DOI] [PubMed] [Google Scholar]
- 3. Meier JJ, Veldhuis JD, Butler PC. Pulsatile insulin secretion dictates systemic insulin delivery by regulating hepatic insulin extraction in humans. Diabetes. 2005;54(6):1649–1656. [DOI] [PubMed] [Google Scholar]
- 4. Peiris AN, Mueller RA, Smith GA, Struve MF, Kissebah AH. Splanchnic insulin metabolism in obesity. Influence of body fat distribution. J Clin Invest. 1986;78(6):1648–1657. [DOI] [PMC free article] [PubMed] [Google Scholar]
- 5. Utzschneider KM, Kahn SE. Review: The role of insulin resistance in nonalcoholic fatty liver disease. J Clin Endocrinol Metab. 2006;91(12):4753–4761. [DOI] [PubMed] [Google Scholar]
- 6. Kotronen A, Vehkavaara S, Seppälä-Lindroos A, Bergholm R, Yki-Järvinen H. Effect of liver fat on insulin clearance. Am J Physiol Endocrinol Metab. 2007;293(6):E1709–E1715. [DOI] [PubMed] [Google Scholar]
- 7. Kotronen A, Juurinen L, Tiikkainen M, Vehkavaara S, Yki-Järvinen H. Increased liver fat, impaired insulin clearance, and hepatic and adipose tissue insulin resistance in type 2 diabetes. Gastroenterology. 2008;135(1):122–130. [DOI] [PubMed] [Google Scholar]
- 8. Finucane FM, Sharp SJ, Hatunic M, Sleigh A, De Lucia Rolfe E, Aihie Sayer A, Cooper C, Griffin SJ, Wareham NJ. Liver fat accumulation is associated with reduced hepatic insulin extraction and beta cell dysfunction in healthy older individuals. Diabetol Metab Syndr. 2014;6:43. [DOI] [PMC free article] [PubMed] [Google Scholar]
- 9. Polonsky KS, Rubenstein AH. C-Peptide as a measure of the secretion and hepatic extraction of insulin. Pitfalls and limitations. Diabetes. 1984;33(5):486–494. [DOI] [PubMed] [Google Scholar]
- 10. Berzins R, Wieczorek KR, Rajotte RV, Molnar GD, Tam YK, McGregor JR, Fawcett DM. Accuracy of C-peptide:insulin molar ratio as a measure of hepatic removal of insulin. Diabetes Res Clin Pract. 1987;4(1):37–43. [DOI] [PubMed] [Google Scholar]
- 11. Mehta SR, Godsland IF, Thomas EL, Pavitt DV, Morin SX, Bell JD, Taylor-Robinson SD, Johnston DG. Intrahepatic insulin exposure, intrahepatocellular lipid and regional body fat in nonalcoholic fatty liver disease. J Clin Endocrinol Metab. 2012;97(6):2151–2159. [DOI] [PubMed] [Google Scholar]
- 12. Polidori DC, Bergman RN, Chung ST, Sumner AE. Hepatic and extrahepatic insulin clearance are differentially regulated: results from a novel model-based analysis of intravenous glucose tolerance data. Diabetes. 2016;65(6):1556–1564. [DOI] [PMC free article] [PubMed] [Google Scholar]
- 13. Utzschneider KM, Largajolli A, Bertoldo A, Marcovina S, Nelson JE, Yeh MM, Kowdley KV, Kahn SE. Serum ferritin is associated with non-alcoholic fatty liver disease and decreased Β-cell function in non-diabetic men and women. J Diabetes Complications. 2014;28(2):177–184. [DOI] [PMC free article] [PubMed] [Google Scholar]
- 14. American Diabetes Association Diagnosis and classification of diabetes mellitus. Diabetes Care. 2011;34(Suppl 1):S62–S69. [DOI] [PMC free article] [PubMed] [Google Scholar]
- 15. Kelley DE, McKolanis TM, Hegazi RA, Kuller LH, Kalhan SC. Fatty liver in type 2 diabetes mellitus: relation to regional adiposity, fatty acids, and insulin resistance. Am J Physiol Endocrinol Metab. 2003;285(4):E906–E916. [DOI] [PubMed] [Google Scholar]
- 16. Yarasheski KE, Cade WT, Overton ET, Mondy KE, Hubert S, Laciny E, Bopp C, Lassa-Claxton S, Reeds DN. Exercise training augments the peripheral insulin-sensitizing effects of pioglitazone in HIV-infected adults with insulin resistance and central adiposity. Am J Physiol Endocrinol Metab. 2011;300(1):E243–E251. [DOI] [PMC free article] [PubMed] [Google Scholar]
- 17. Wolfe R. Radioactive and Stable Isotope Tracers in Biomedicine. New York: Wiley-Liss; 1992. [Google Scholar]
- 18. Van Cauter E, Mestrez F, Sturis J, Polonsky KS. Estimation of insulin secretion rates from C-peptide levels. Comparison of individual and standard kinetic parameters for C-peptide clearance. Diabetes. 1992;41(3):368–377. [DOI] [PubMed] [Google Scholar]
- 19. Kim SP, Ellmerer M, Kirkman EL, Bergman RN. Beta-cell “rest” accompanies reduced first-pass hepatic insulin extraction in the insulin-resistant, fat-fed canine model. Am J Physiol Endocrinol Metab. 2007;292(6):E1581–E1589. [DOI] [PubMed] [Google Scholar]
- 20. Cnop M, Havel PJ, Utzschneider KM, Carr DB, Sinha MK, Boyko EJ, Retzlaff BM, Knopp RH, Brunzell JD, Kahn SE. Relationship of adiponectin to body fat distribution, insulin sensitivity and plasma lipoproteins: evidence for independent roles of age and sex. Diabetologia. 2003;46(4):459–469. [DOI] [PubMed] [Google Scholar]
- 21. Labadzhyan A, Cui J, Péterfy M, Guo X, Chen YI, Hsueh WA, Rotter JI, Goodarzi MO. Insulin clearance is associated with hepatic lipase activity and lipid and adiposity traits in Mexican Americans. PLoS One. 2016;11(11):e0166263. [DOI] [PMC free article] [PubMed] [Google Scholar]
- 22. Lorenzo C, Hanley AJ, Wagenknecht LE, Rewers MJ, Stefanovski D, Goodarzi MO, Haffner SM. Relationship of insulin sensitivity, insulin secretion, and adiposity with insulin clearance in a multiethnic population: the Insulin Resistance Atherosclerosis Study. Diabetes Care. 2013;36(1):101–103. [DOI] [PMC free article] [PubMed] [Google Scholar]
- 23. Goodarzi MO, Langefeld CD, Xiang AH, Chen YD, Guo X, Hanley AJ, Raffel LJ, Kandeel F, Nadler JL, Buchanan TA, Norris JM, Fingerlin TE, Lorenzo C, Rewers MJ, Haffner SM, Bowden DW, Rich SS, Bergman RN, Rotter JI, Watanabe RM, Wagenknecht LE. Insulin sensitivity and insulin clearance are heritable and have strong genetic correlation in Mexican Americans. Obesity (Silver Spring). 2014;22(4):1157–1164. [DOI] [PMC free article] [PubMed] [Google Scholar]
- 24. Lee CC, Haffner SM, Wagenknecht LE, Lorenzo C, Norris JM, Bergman RN, Stefanovski D, Anderson AM, Rotter JI, Goodarzi MO, Hanley AJ. Insulin clearance and the incidence of type 2 diabetes in Hispanics and African Americans: the IRAS Family Study. Diabetes Care. 2013;36(4):901–907. [DOI] [PMC free article] [PubMed] [Google Scholar]
- 25. Kautzky-Willer A, Pacini G, Ludvik B, Schernthaner G, Prager R. Beta-cell hypersecretion and not reduced hepatic insulin extraction is the main cause of hyperinsulinemia in obese nondiabetic subjects. Metabolism. 1992;41(12):1304–1312. [DOI] [PubMed] [Google Scholar]
- 26. Stevenson RW, Cherrington AD, Steiner KE. The relationship between plasma concentration and disappearance rate of immunoreactive insulin in the conscious dog. Horm Metab Res. 1985;17(11):551–553. [DOI] [PubMed] [Google Scholar]
- 27. Eaton RP, Allen RC, Schade DS. Hepatic removal of insulin in normal man: dose response to endogenous insulin secretion. J Clin Endocrinol Metab. 1983;56(6):1294–1300. [DOI] [PubMed] [Google Scholar]
- 28. Bergman RN. Non-esterified fatty acids and the liver: why is insulin secreted into the portal vein? Diabetologia. 2000;43(7):946–952. [DOI] [PubMed] [Google Scholar]
- 29. Svedberg J, Björntorp P, Smith U, Lönnroth P. Free-fatty acid inhibition of insulin binding, degradation, and action in isolated rat hepatocytes. Diabetes. 1990;39(5):570–574. [DOI] [PubMed] [Google Scholar]
- 30. Svedberg J, Strömblad G, Wirth A, Smith U, Björntorp P. Fatty acids in the portal vein of the rat regulate hepatic insulin clearance. J Clin Invest. 1991;88(6):2054–2058. [DOI] [PMC free article] [PubMed] [Google Scholar]
- 31. Wiesenthal SR, Sandhu H, McCall RH, Tchipashvili V, Yoshii H, Polonsky K, Shi ZQ, Lewis GF, Mari A, Giacca A. Free fatty acids impair hepatic insulin extraction in vivo. Diabetes. 1999;48(4):766–774. [DOI] [PubMed] [Google Scholar]
- 32. Hennes MM, Dua A, Kissebah AH. Effects of free fatty acids and glucose on splanchnic insulin dynamics. Diabetes. 1997;46(1):57–62. [DOI] [PubMed] [Google Scholar]
- 33. Bohte AE, van Werven JR, Bipat S, Stoker J. The diagnostic accuracy of US, CT, MRI and 1H-MRS for the evaluation of hepatic steatosis compared with liver biopsy: a meta-analysis. Eur Radiol. 2011;21(1):87–97. [DOI] [PMC free article] [PubMed] [Google Scholar]
- 34. Kan H, Kimura Y, Hyogo H, Fukuhara T, Fujino H, Naeshiro N, Honda Y, Kawaoka T, Tsuge M, Hiramatsu A, Imamura M, Kawakami Y, Aikata H, Ochi H, Arihiro K, Chayama K. Non-invasive assessment of liver steatosis in non-alcoholic fatty liver disease. Hepatol Res. 2014;44(14):E420–E427. [DOI] [PubMed] [Google Scholar]
- 35. Longo R, Ricci C, Masutti F, Vidimari R, Crocé LS, Bercich L, Tiribelli C, Dalla Palma L. Fatty infiltration of the liver. Quantification by 1H localized magnetic resonance spectroscopy and comparison with computed tomography. Invest Radiol. 1993;28(4):297–302. [PubMed] [Google Scholar]
- 36. Piccinini F, Polidori DC, Gower BA, Bergman RN. Hepatic but not extrahepatic insulin clearance is lower in African American than in European American women. Diabetes. 2017;66(10):2564–2570. [DOI] [PMC free article] [PubMed] [Google Scholar]
- 37. Osei K, Schuster DP, Owusu SK, Amoah AG. Race and ethnicity determine serum insulin and C-peptide concentrations and hepatic insulin extraction and insulin clearance: comparative studies of three populations of West African ancestry and white Americans. Metabolism. 1997;46(1):53–58. [DOI] [PubMed] [Google Scholar]


