Abstract
Phosphatases, the enzymes responsible for dephosphorylating proteins, play critical roles in many cellular processes. While their importance is widely recognized, phosphatase activity and regulation remain poorly understood. Currently, there are few assays available that are capable of directly measuring phosphatase activity and specificity. We have previously introduced SAMDI (self-assembled monolayers on gold for matrix-assisted laser desorption/ionization) mass spectrometry as a technique to profile the substrate specificities of enzymes. SAMDI mass spectrometry assays are well suited to examine phosphatase activities and offer many advantages over current methods. This technique uses monolayers that terminate with a peptide or molecular enzyme substrate and allows for enzyme reactions to be performed on a surface that can easily be rinsed and analyzed by mass spectrometry without the need for analyte labeling. In this chapter, we describe the process of combining SAMDI mass spectrometry with peptide arrays to study the substrate specificities of two protein tyrosine phosphatases.
1. INTRODUCTION
Phosphorylation is an important posttranslational modification that plays a critical role in most signaling pathways. Kinases and phosphatases act in dynamic balance to maintain the phosphoproteome and regulate cellular processes. Just as with kinases, mutation and disruption of phosphatase activity have been implicated in many human diseases (Hendriks et al., 2013; Julien, Dub´e, Hardy, & Tremblay, 2011; Peng & Maller, 2010). However, phosphatases remain poorly understood relative to kinases. A significant factor in this discrepancy is the lack of convenient and general assays that can measure phosphatase activity. Unlike kinases, for which many effective assay formats are available, it remains difficult to measure phosphatase activity, particularly in complex samples such as cell lysates (Geladopoulos, Sotiroudis, & Evangelopoulos, 1991; Takai & Mieskes, 1991; Welte et al., 2005). Current assays for studying phosphatase activity rely on measuring decreases in the amount of phosphosubstrate—typically with ELISA or a 32P-labeled substrate—or by measuring the phosphate ion by-product (Bose & Janes, 2013; Killilea, Cheng, & Wang, 1998; McAvoy & Nairn, 2010).
Our laboratory has developed SAMDI-MS (self-assembled monolayers of alkanethiolates on gold for matrix-assisted laser desorption/ionization mass spectrometry), a label-free, high-throughput analytical method for measuring enzyme activities, including phosphatase activity (Berns, Cabezas, & Mrksich, 2016; Gurard-Levin, Scholle, Eisenberg, & Mrksich, 2011; Mrksich, 2008; Su & Mrksich, 2002). SAMDI-MS uses self-assembled monolayers (SAMs) of alkanethiolates on gold that present a peptide (or other molecule) substrate for the enzyme of interest. The monolayers are prepared by immersing a gold-coated plate in a solution containing terminally substituted dialkyl disulfides. Most commonly, the monolayers present maleimide groups at a density of 10% against a tri(ethylene glycol) background (Fig. 1). Cysteine-terminated peptides can then be immobilized through conjugate addition to the maleimide groups. The tri(ethylene glycol) groups serve the important role of preventing nonspecific protein adsorption to the monolayer.
Fig. 1.
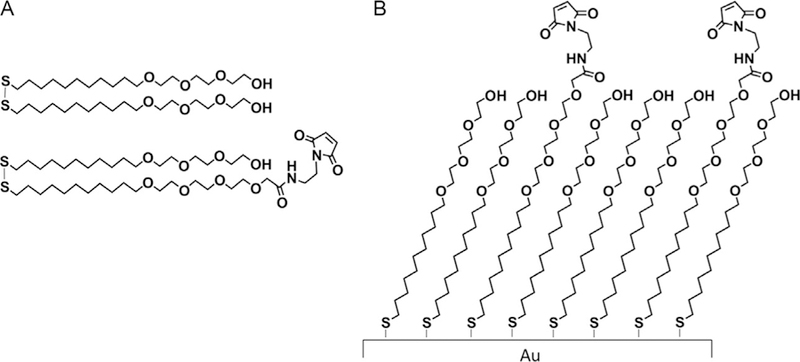
Formation of self-assembled monolayers on gold. (A) Chemical structures of tri(ethylene glycol) disulfide and tri(ethylene glycol)-maleimide disulfide. (B) Alkanethiolate monolayer self-assembled on gold. The SAMs present functional maleimide groups with a background of tri(ethylene glycol) groups.
To perform the SAMDI assay, an enzyme solution is directly applied to the monolayer. After the enzyme reaction is complete, the SAMDI plate is simply rinsed with water and then ethanol. The MALDI matrix is applied, and the plate is analyzed in an AB Sciex 5800 MALDI TOF/TOF. In the mass spectrometer, irradiation of the monolayer with the laser leads to cleavage of the gold–thiolate bond and release of the intact peptide–alkanethiolate (or corresponding disulfide) conjugates, whose molecular masses are then determined by time-of-flight (TOF). The SAMDI spectrum includes m/z peaks that correspond to the substrate and product(s). For phosphatase activity, the product appears at an m/z that is 80 Da lower than the substrate (Fig. 2).
Fig. 2.
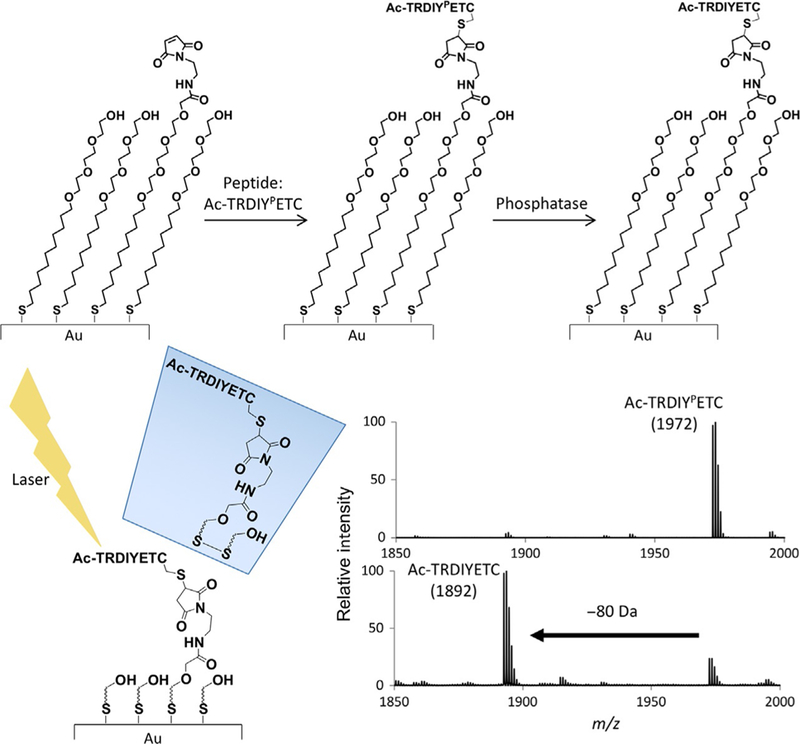
SAMDI assay workflow. Peptides are immobilized on self-assembled monolayers. After immobilization, peptides are treated with phosphatase solutions. After washing and matrix application, SAMDI plates are analyzed via MALDI mass spectrometry.
Peptide arrays have emerged as an approach for studying the substrate specificities of a variety of enzymes (Arsenault, Griebel, & Napper, 2011; Foong, Fu, Yao, & Uttamchandani, 2012; Katz et al., 2011; Szymczak, Kuo, & Mrksich, 2017; Thiele, Stangl, & Schutkowski, 2011). Peptide arrays allow enzyme activities to be measured on a broad range of substrates, giving a more complete understanding of specificity. A SAMDI assay is typically performed on an array plate of 384 (or 1536) gold spots (Fig. 3), where a different peptide is immobilized onto each spot. A solution containing the enzyme of interest is applied to each gold spot, and after reaction and analysis by SAMDI-MS, the extent of enzyme activity on each peptide in the array is quantified in a single experiment (Fig. 4).
Fig. 3.
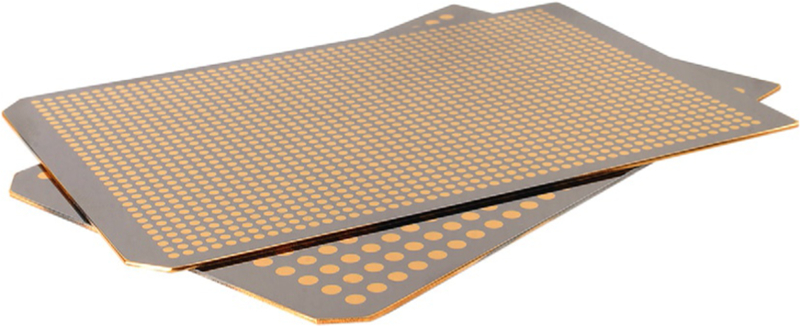
Gold-evaporated SAMDI array plates: 384 (bottom)- and 1536 (top) formats.
Fig. 4.
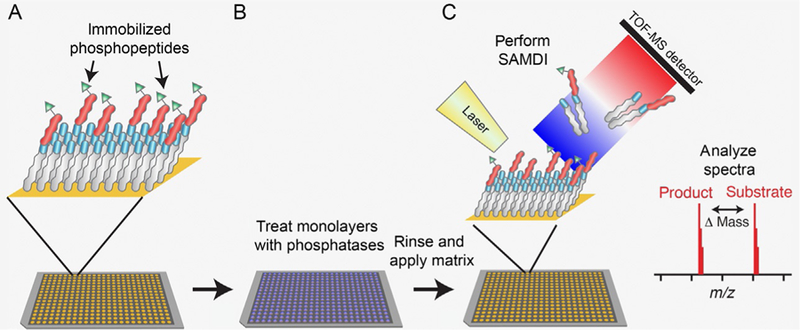
SAMDI array workflow. (A) Peptides in a peptide library are immobilized on self-assembled monolayers. (B) Peptides on the surface are treated with phosphatase solutions. (C) After rinsing and matrix application, plates are analyzed via MALDI mass spectrometry.
We have combined SAMDI-MS and peptide arrays to profile enzyme substrate specificities using large libraries of peptides or other substrates. These examples include profiling lysine deacetylase (KDAC) specificities (Gurard-Levin, Kilian, Kim, Bahr, & Mrksich, 2010; Gurard-Levin, Kim, & Mrksich, 2009), as well as the substrate specificity of the protease OmpT (Wood et al., 2017). Additionally, we have used SAMDI and peptide arrays to optimize substrates for glycosyl transferases, and we have used carbohydrate arrays to discover new glycosyl transferase activities (Ban et al., 2012; Kightlinger et al., 2018). SAMDI peptide arrays are also compatible with measuring enzyme activities in cell lysates, as shown in a study observing distinct profiles of deacetylase activity associated with differentiation (Kuo, DeLuca, Miller, & Mrksich, 2013).
There are several advantages to the SAMDI method that allow for straightforward high-throughput experiments to study enzyme activities. The use of the protein-resistant monolayer is important for experiments using complex samples because it ensures that the immobilized peptides are accessible to the enzyme and removes the need for blocking steps or analyte purification after reaction completion, allowing for a direct measurement of enzyme activity. After running a SAMDI experiment, analytes are not processed or transferred to another platform for analysis; the monolayer array plate is used both to perform the reactions and to measure the reaction product. Additionally, the use of mass spectrometry for analysis yields quantitative measurements of enzyme activity without the need for substrate or product labeling. These benefits make the SAMDI assay amenable to measuring enzyme activity in isolation or in cell lysates on many different peptide substrates.
In this chapter, we describe how to prepare and perform a SAMDI experiment with a phosphotyrosine peptide library to profile phosphatase activity. We will detail the steps of evaporation of gold onto steel plates, formation of the monolayer, peptide library design and synthesis, peptide immobilization, and finally the enzyme assay and analysis. In this example, we profile the substrate specificities of two commercially available protein tyrosine phosphatases (PTPs), PTPN14 and PTP1B.
2. PREPARATION OF SAMDI PEPTIDE ARRAYS
In this section, we outline the steps for gold evaporation on steel plates, self-assembled monolayer formation, peptide library design and synthesis, and peptide immobilization.
2.1. Gold Evaporation on Steel Plates
Equipment
12.25 cm× 8 cm Steel plates (the same size as standard MALDI loading plates)
Thermionics e-beam evaporator with a water chiller and turbo pump
Patterned masks with 384 spots for steel plates
Buffers and reagents
Hexanes
Ethanol
Milli-Q H2O
Titanium
Gold
Procedure
Washing Steel Plates
Remove protective coating from six steel plates.
Wash steel plates in hexanes and then ethanol.
Let plates soak in water and then ethanol for 5 min each.
Dry plates under N2.
Evaporation
Place six steel plates into a plate holder with masks that pattern the plates to have 384 spots.
Load the plate holder into a Thermionics e-beam evaporator.
Seal the evaporator, vacuum-pressurize to 1 × 10—6 Torr, and chill to 10°C.
Deposit titanium onto the plates at a rate of 0.2 Å/s until 50 Å have been deposited.
Deposit gold onto the titanium-coated plates at a rate of 0.5 Å/s until 300 Å have been deposited.
Depressurize the evaporator, warm back to room temperature, and remove the plates.
Store the plates in vacuum-sealed packs for up to 6 months.
2.2. Self-Assembled Monolayer Formation
Buffers and reagents
1 mM total disulfide solution of 0.8 mM tri(ethylene glycol)-terminated C11-alkane disulfide and 0.2 mM C11-alkane disulfide with one terminal tri(ethylene glycol) and one terminal maleimide in ethanol (Fig. 1A)
Ethanol
Milli-Q H2O
Procedure
Prepare a 1 mM total disulfide solution of 0.8 mM tri(ethylene glycol) disulfide and 0.2 mM tri(ethylene glycol)-maleimide disulfide in ethanol, which will produce a monolayer surface with 10% maleimide density (Fig. 1).
Soak plates in monolayer solution for 48 h at 4°C to allow monolayers to self-assemble onto the gold surfaces on the steel plates by forming gold–thiolate bonds.
Remove plates from monolayer solution and wash with ethanol, then water, and ethanol again. Dry under N2. Store in vacuum-sealed bag at −20°C for up to 1 month or use immediately.
Notes
The plates now have self-assembled monolayers on 384 gold spots presenting a functional maleimide group at 10% density. The maleimide group undergoes 1,4-Michael addition with thiol-containing molecules, allowing for immobilization of 384 unique thiol-containing molecules. The tri(ethylene glycol)background at 90% density functions to prevent nonspecific protein adsorption to the surface.
2.3. Phosphotyrosine Peptide Library Design
A peptide from the IR5 insulin receptor (TRDIYPETDYYRK) with sequence surrounding pY1146 has been used widely for kinase and phosphatase research (Keane et al., 1994; Madden, Bird, Man, Raven, & Myles, 1991; Stadtmauer & Rosen, 1986; Yu et al., 2013). We designed the pY library to study the importance of the specific amino acids surrounding pY1146. Our library consists of 361 peptides with the sequence Ac-TRDXYPZTC-NH2, where the X and Z positions represent all 19 amino acids, excluding cysteine. A cysteine is added to the original sequence at the C-terminus for peptide–maleimide immobilization to the SAM surface, as described earlier. We choose to make the peptides eight amino acids in length. Variable amino acid positions are placed at the +1 and −1 positions surrounding the phosphorylated tyrosine to study the effects and roles of those positions in phosphatase-substrate recognition. SAMDI peptide libraries can be designed to study any of the amino acid positions of interest (Gurard-Levin, Kilian, Kim, Bahr, & Mrksich, 2010; Kuo et al., 2013).
2.4. Peptide Synthesis
Cysteine-containing peptides are synthesized using standard solid-phase peptide synthesis methods (Høeg-Jensen, Havsteen Jakobsen, Olsen, & Holm, 1991). Briefly, Fmoc-Rink Amide MBHA resin is purchased from Anaspec, and Fmoc-protected amino acids are available from multiple commercial sources. The Fmoc-Rink Amide MBHA resin is swelled in dimethylformamide (DMF) for 30 min. The resin is then Fmoc-deprotected with 20% piperidine in DMF for 20 min. The resin is rinsed with DMF by vacuum filtration. The first amino acid is coupled to the resin with PyBop and N-methylmorpholine in DMF at a 4:4:8 molar excess, respectively, for 20 min. The resin is washed with DMF. The deprotection, wash, coupling, and wash steps are then repeated until the last amino acid is coupled. The Fmoc group on the last amino acid is deprotected as described previously (Høeg-Jensen et al., 1991), and the N-terminus is acetylated with 10% acetic anhydride in DMF for 60 min. The resin is washed with DMF and dichloromethane and dried in a vacuum desiccator. The peptides are cleaved from the resin with a solution of 95% trifluoroacetic acid (TFA), 2.5% triethylsilane, and 2.5% water for 16 h—many peptide cleavage protocols will suggest shorter times, but we have found that longer cleavage times result in more complete deprotection of the pY residue. The cleavage solution is evaporated using N2. The peptides are resuspended in 0.1% TFA in water, lyophilized, and resuspended again in 0.1% TFA in water to a peptide concentration of 200 μM.
2.5. Peptide Immobilization
Equipment
Tecan Robotic Liquid Handler (or pipette by hand)
Humidifying chamber (to prevent evaporation—simple option: use an empty pipette tip box with water in the bottom)
Plate centrifuge
Buffers and reagents
200 μM peptide in 0.1% TFA in H2O
TCEP beads
50 mM Tris buffer pH 7.5
Procedure
Dilute 5 μL of each peptide in 0.1% TFA in water into 40 μL 50 mM Tris buffer pH 7.5 and 5 μL of a TCEP bead slurry to prevent the formation of disulfides. The peptides will now be at a concentration of 20 μM.
Spin the plate at 3000 rpm for 1 min to sediment the TCEP beads.
Pipette or use a robotic liquid handler to transfer each peptide to an individual spot on the SAMDI array plate.
Put the SAMDI array plate in a humidifying chamber and incubate for 1 h at 37°C to immobilize peptides.
Wash the SAMDI array plate with water followed by ethanol. Dry under N2. Store in vacuum-sealed bag at −20°C.
Notes
The cysteine-containing peptides are immobilized through conjugate addition of the thiol side chain of cysteine and the maleimide groups of the monolayer.
3. PROFILING PHOSPHATASE ACTIVITY USING SAMDI-MS
In this section, we describe the steps of running and analyzing a phosphatase assay using SAMDI-MS.
3.1. SAMDI Phosphatase Assay
Equipment
Multidrop combi and small tube plastic tip dispensing cassette (Thermo Scientific)
Buffers and reagents
PTPN14, active human recombinant protein 5 mg/mL (Sigma-Aldrich)
PTP1B full-length, active human 0.5 mg/mL (Sigma-Aldrich)
Phosphatase buffer: 100 mM Tris–HCl (Tris(hydroxymethyl)-aminomethane hydrochloride) pH 7.5, 50 mM NaCl, 100 μM TCEP (Tris(2-carboxyethyl)phosphine) made fresh
Procedure
Thaw the PTPN14 and PTP1B stock (aliquots stored at −80°C) on ice.
Dilute 4 μL PTPN14 into 2 mL phosphatase buffer (final concentration: 1 μg/mL). Gently mix with pipette.
Rinse the combi cassette with 10 mL deionized water and 10 mL phosphatase buffer.
Use the combi to apply 2 μL PTPN14 solution to each gold spot on the SAMDI plate.
Place the plate in a humidifying chamber to avoid evaporation and incubate at 37°C for 6 h.
Quench the reaction by rinsing the plate with deionized water (>50 mL).
Rinse the plate with ethanol and dry under N2. Analyze by MALDI-MS immediately or place the plate in a vacuum-sealed bag and store at −20°C for up to 2 weeks.
For PTP1B: Dilute 1 μL PTP1B into 2.5 mL phosphatase buffer (final concentration: 0.2 μg/mL). Mix and repeat steps 4–7 with PTP1B solution. The reaction incubation time for PTP1B is 1 h.
Notes
The SAM surface is sensitive to reducing agents. The TCEP concentration should not exceed 500 μM.
The concentration of enzyme and time of reaction should be determined in advance of the array experiment. We use a standard peptide, Ac-IYPERC-NH2, immobilized on the surface, and examine the extent of phosphatase activity at various enzyme concentrations to determine the optimal conditions for the peptide-array experiment.
3.2. SAMDI-MS
Equipment
MALDI (AB Sciex TOF/TOF 5800 System)
Multidrop combi and small tube plastic tip dispensing cassette (Thermo Scientific)
Buffers and reagents
Phosphopeptide matrix solution: 10 mg/mL THAP (2,4,6-trihydroxyacetophenone) and 5 mg/mL ammonium citrate dibasic in 50% acetonitrile, 50% deionized water, and 0.1% phosphoric acid.
Procedure
If SAMDI plate was stored at −20°C, thaw at room temperature for 15 min, rinse the plate with ethanol, and dry under N2.
Rinse the combi cassette with 50% acetonitrile and 50% deionized water.
Use the combi to apply 1 μL phosphopeptide matrix solution to each gold spot on the plate.
Allow the matrix to dry and crystallize for 20 min.
Read the plate by MALDI-MS using MS positive reflector mode. Spectra are collected in the mass range of 1300–2500 Da with the focus on 1900 Da. A 355 nm Nd:YAG laser is used as a desorption/ionization source with intensity set at 5200; 900 laser shots are collected per spectrum on each gold spot. Detector voltage multiplier is set at 0.72.
Notes
The parameters for MALDI settings vary from day to day. It is best to calibrate the parameters using a standard peptide for optimal SAMDI signal.
Addition of ammonium citrate to the MALDI matrix has been shown to enhance the ionization efficiency of phosphopeptides (Asara & Allison, 1999).
3.3. Analyzing the SAMDI Array
Procedure
Identify the dialkyl disulfide substrate and product peaks (−80 m/z) in each of the 361 spectra. The dialkyl disulfide peak is the original peptide mass plus 850.5 m/z for the H+ adduct. Other adduct peaks, including Na+ and K+, are often observed and can be included in the analysis.
Integrate the area under the curve (AUC) for each monoisotopic peak using the software provided by the mass spectrometer vendor (Fig. 5).
Calculate activities for each peptide according to the definition Activity .
Using Microsoft Excel, arrange the activities into a 19 × 19 matrix where each column represents an amino acid at X position and each row represents an amino acid at Z position in the pY library so that every box is the PTP activity on a unique combination of X and Z.
Create a heatmap by transforming the numeric chart into gray scale (conditional formatting color scales). Define 100% activity as black and 0% activity as white.
Fig. 5.
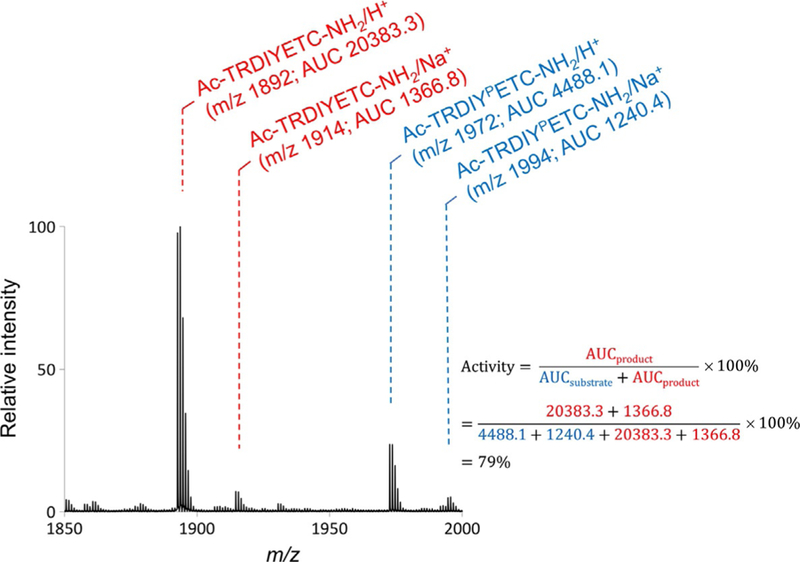
Analysis of the mass spectrum to measure phosphatase activity on a peptide. The mass spectrum quantifies the amounts of unreacted phosphorylated substrate and reacted dephosphorylated product. We calculate the area under the curve (AUC) to determine the extent of dephosphorylation of the peptide. The spectra above shows both the substrate and product peaks as well as their integrated areas. To calculate percent activity, we divide the AUC of the product peak(s) by the AUC of both the substrate and product peaks.
Notes
Methionine (M) and Tryptophan (W) residues are often found oxidized in MALDI measurements. Therefore, oxidation peaks (+17 m/z for M and +33 m/z for W) should be included for peptides containing these residues.
We use custom software to automate the process described earlier and are able to analyze the data from a library in less than 5 min.
3.4. Data Interpretation
The heatmaps of PTPN14 and PTP1B on the pY library are shown in Fig. 6. The heatmaps show that PTPN14 prefers substrates with a glycine (G) in the + 1 (Z) position and a tryptophan (W) in the −1 (X) position. PTP1B shows different specificity disfavoring substrates with a proline (P) in the +1 (Z) position. These different heatmap profiles help us determine the substrate specificity of phosphatases and allow us to begin to understand recognition and the active-site structure of the enzyme.
Fig. 6.
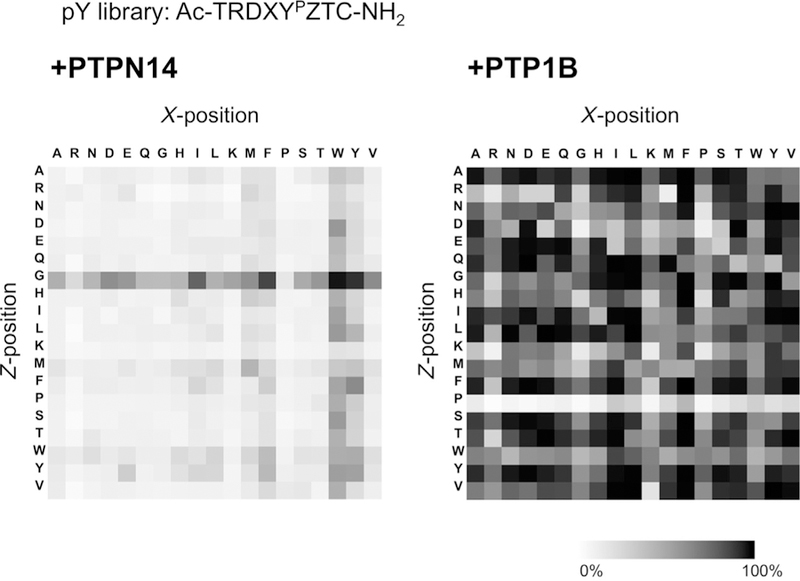
Heatmaps of PTPN14 (left) and PTP1B (right) specificity on pY library peptide array. PTPN14 exhibits a clear preference for glycine (G) in the Z (+1) position and tryptophan (W) in the X (−1) position. PTP1B exhibits different sequence selectivity, where proline (P) is disfavored at Z (+1) position.
4. SUMMARY AND CONCLUSION
Insight into the specificities of phosphatase enzymes is important for a better understanding of the regulation of the phosphoproteome and its role in various cellular processes. This work describes the use of peptide arrays and SAMDI-MS to profile phosphatase activities. SAMDI-MS is a powerful tool for understanding the specificities and regulation of various enzymes, but is particularly significant for phosphatases as there are few other existing assays capable of directly measuring dephosphorylation. The advantages of the SAMDI method—including the use of an inert surface background preventing nonspecific protein adsorption, the lack of a need for analyte labeling, the compatibility with high-throughput experiments, and the use of mass spectrometry for direct and quantitative data—make it easily extendable to measuring phosphatase activities in complex samples such as cell lysates.
ACKNOWLEDGMENTS
Our recent work with phosphatases has been supported by the National Cancer Institute of the National Institute of Health under Award Number U54CA199091; the Department of Defense, Defense Threat Reduction Agency under Award Number HDTRA1–15-1–0052; the Air Force Research Laboratory under Award Number FA8650–15-2–5518; and the NU-NTU Institute for Nano Medicine located at the International Institute for Nanotechnology, Northwestern University, USA; and the Nanyang Technological University, Singapore, under Award Number Agmt10/20/14.
ABBREVIATIONS
- AUC
area under the curve
- DMF
dimethylformamide
- MALDI
matrix-assisted laser desorption/ionization
- MS
mass spectrometry
- PTP
protein tyrosine phosphatase
- SAM
self-assembled monolayer
- SAMDI
self-assembled monolayers of alkanethiolates on gold for matrix-assisted laser desorption/ionization
- TFA
trifluoroacetic acid
- TOF
time-of-flight
REFERENCES
- Arsenault R, Griebel P, & Napper S (2011). Peptide arrays for kinome analysis: New opportunities and remaining challenges. Proteomics, 11(24), 4595–4609. [DOI] [PubMed] [Google Scholar]
- Asara JM, & Allison J (1999). Enhanced detection of phosphopeptides in matrix-assisted laser desorption/ionization mass spectrometry using ammonium salts. Journal of the American Society for Mass Spectrometry, 10(1), 35–44. [DOI] [PubMed] [Google Scholar]
- Ban L, Pettit N, Li L, Stuparu AD, Cai L, Chen W, et al. (2012). Discovery of glycosyltransferases using carbohydrate arrays and mass spectrometry. Nature Chemical Biology, 8(9), 769–773. [DOI] [PMC free article] [PubMed] [Google Scholar]
- Berns EJ, Cabezas MD, & Mrksich M (2016). Cellular assays with a molecular endpoint measured by SAMDI mass spectrometry. Small, 12(28), 3811–3818. [DOI] [PMC free article] [PubMed] [Google Scholar]
- Bose AK, & Janes KA (2013). A high-throughput assay for phosphoprotein-specific phosphatase activity in cellular extracts. Molecular & Cellular Proteomics, 12(3), 797–806. [DOI] [PMC free article] [PubMed] [Google Scholar]
- Foong YM, Fu J, Yao SQ, & Uttamchandani M (2012). Current advances in peptide and small molecule microarray technologies. Current Opinion in Chemical Biology, 16(1–2), 234–242. [DOI] [PubMed] [Google Scholar]
- Geladopoulos TP, Sotiroudis TG, & Evangelopoulos AE (1991). A malachite green colorimetric assay for protein phosphatase activity. Analytical Biochemistry, 192(1), 112–116. [DOI] [PubMed] [Google Scholar]
- Gurard-Levin ZA, Kilian KA, Kim J, Bahr K, & Mrksich M (2010). Peptide arrays identify isoform-selective substrates for profiling endogenous lysine deacetylase activity. ACS Chemical Biology, 5(9), 863–873. [DOI] [PMC free article] [PubMed] [Google Scholar]
- Gurard-Levin ZA, Kim J, & Mrksich M (2009). Combining mass spectrometry and peptide arrays to profile the specificities of the histone deacetylases. Chembiochem: A European Journal of Chemical Biology, 10(13), 2159–2161. [DOI] [PMC free article] [PubMed] [Google Scholar]
- Gurard-Levin ZA, Scholle MD, Eisenberg AH, & Mrksich M (2011). High-throughput screening of small molecule libraries using SAMDI mass spectrometry. ACS Combinatorial Science, 13(4), 347–350. [DOI] [PMC free article] [PubMed] [Google Scholar]
- Hendriks WJAJ, Elson A, Harroch S, Pulido R, Stoker A, & den Hertog J (2013). Protein tyrosine phosphatases in health and disease. FEBS Journal, 280(2), 708–730. [DOI] [PubMed] [Google Scholar]
- Høeg-Jensen T, Havsteen Jakobsen M, Olsen CE, & Holm A (1991). Formation of peptide thioamides by use of Fmoc amino monothioacids and PyBOP. Tetrahedron Letters, 32(51), 7617–7620. [Google Scholar]
- Julien SG, Dub´e N, Hardy S, & Tremblay ML (2011). Inside the human cancer tyrosine phosphatome. Nature Reviews Cancer, 11, 35–49. [DOI] [PubMed] [Google Scholar]
- Katz C, Levy-Beladev L, Rotem-Bamberger S, Rito T, Rudiger SGD, & Friedler A (2011). Studying protein-protein interactions using peptide arrays. Chemical Society Reviews, 40(5), 2131–2145. [DOI] [PubMed] [Google Scholar]
- Keane NE, Chavanieu A, Quirk PG, Evans JS, Levine BA, Calas B, et al. (1994). Structural determinants of substrate selection by the human insulin-receptor proteintyrosine kinase. European Journal of Biochemistry, 226(2), 525–536. [DOI] [PubMed] [Google Scholar]
- Kightlinger W, Lin L, Rosztoczy M, Li W, DeLisa MP, Mrksich M, et al. (2018). Design of glycosylation sites by rapid synthesis and analysis of glycosyltransferases. Nature Chemical Biology 10.1038/s41589-018-0051-2. [DOI] [PubMed] [Google Scholar]
- Killilea SD, Cheng Q, & Wang Z-X (1998). Protein phosphatase type 1 and type 2A assays. In Ludlow JW (Ed.), Protein phosphatase protocols (pp. 23–33). Totowa, NJ: Humana Press. [DOI] [PubMed] [Google Scholar]
- Kuo H-Y, DeLuca TA, Miller WM, & Mrksich M (2013). Profiling deacetylase activities in cell lysates with peptide arrays and SAMDI mass spectrometry. Analytical Chemistry, 85(22), 10635–10642. [DOI] [PMC free article] [PubMed] [Google Scholar]
- Madden JA, Bird MI, Man Y, Raven T, & Myles DD (1991). Two nonradioactive assays for phosphotyrosine phosphatases with activity toward the insulin receptor. Analytical Biochemistry, 199(2), 210–215. [DOI] [PubMed] [Google Scholar]
- McAvoy T, & Nairn AC (2010). Serine/threonine protein phosphatase assays. Current Protocols in Molecular Biology, 92 18.18.11–18.18.11. [DOI] [PMC free article] [PubMed] [Google Scholar]
- Mrksich M (2008). Mass spectrometry of self-assembled monolayers: A new tool for molecular surface science. ACS Nano, 2(1), 7–18. [DOI] [PMC free article] [PubMed] [Google Scholar]
- Peng A, & Maller JL (2010). Serine/threonine phosphatases in the DNA damage response and cancer. Oncogene, 29(45), 5977–5988. [DOI] [PubMed] [Google Scholar]
- Stadtmauer L, & Rosen OM (1986). Increasing the cAMP content of IM-9 cells alters the phosphorylation state and protein kinase activity of the insulin receptor. Journal of Biological Chemistry, 261(7), 3402–3407. [PubMed] [Google Scholar]
- Su J, & Mrksich M (2002). Using mass spectrometry to characterize self-assembled monolayers presenting peptides, proteins, and carbohydrates. Angewandte Chemie International Edition, 41(24), 4715–4718. [DOI] [PubMed] [Google Scholar]
- Szymczak LC, Kuo H-Y, & Mrksich M (2018). Peptide arrays: Development and application. Analytical Chemistry, 90, 266–282. [DOI] [PMC free article] [PubMed] [Google Scholar]
- Takai A, & Mieskes G (1991). Inhibitory effect of okadaic acid on the p-nitrophenyl phosphate phosphatase activity of protein phosphatases. The Biochemical Journal, 275(Pt. 1), 233–239. [DOI] [PMC free article] [PubMed] [Google Scholar]
- Thiele A, Stangl GI, & Schutkowski M (2011). Deciphering enzyme function using peptide arrays. Molecular Biotechnology, 49(3), 283–305. [DOI] [PubMed] [Google Scholar]
- Welte S, Baringhaus KH, Schmider W, Muller G, Petry S, & Tennagels N (2005). 6,8-Difluoro-4-methylumbiliferyl phosphate: A fluorogenic substrate for protein tyrosine phosphatases. Analytical Biochemistry, 338(1), 32–38. [DOI] [PubMed] [Google Scholar]
- Wood SE, Sinsinbar G, Gudlur S, Nallani M, Huang C-F, Liedberg B, et al. (2017). A bottom-up proteomic approach to identify substrate specificity of outer-membrane protease OmpT. Angewandte Chemie International Edition, 56(52), 16531–16535. [DOI] [PubMed] [Google Scholar]
- Yu B, Liu W, Yu W-M, Loh ML, Alter S, Guvench O, et al. (2013). Targeting protein tyrosine phosphatase SHP2 for the treatment of PTPN11-associated malignancies. Molecular Cancer Therapeutics, 12(9), 1738–1748. [DOI] [PMC free article] [PubMed] [Google Scholar]


