

Abstract
Problem:
How does menstrual cup (MC) compare to other genital sampling methods for HIV RNA recovery?
Method of study:
We compared HIV RNA levels between MC, endocervical swab (ECS), and ECS-enriched cervicovaginal lavage (eCVL) specimens in 51 HIV-positive, antiretroviral therapy-naive women at enrollment, 3 and 6 months, with order rotated by visit. Paired comparisons were analyzed with McNemar’s exact tests, signed-rank tests, and an extension of Somer’s D for pooled analyses across visits.
Results:
MC specimens had the highest proportion of quantifiable HIV VL at enrollment and month 3, but more MC specimens (n=12.8%) were insufficient for testing, compared with ECS (2%, P=0.006) and eCVL (0%, P<0.001). Among sufficient specimens, median VL was significantly higher for MC (2.62 log10 copies/mL) compared to ECS (1.30 log10 copies/mL, P<0.001) and eCVL (1.60 log10 copies/mL, P<0.001) across visits.
Conclusion:
MC may be more sensitive than eCVL and CVS, provided insufficient specimens are reduced.
Keywords: cervicovaginal lavage, endocervical swab, female genital tract sampling, genital HIV viral load, menstrual cup
1 |. INTRODUCTION
Sexual transmission of HIV is strongly correlated with genital HIV viral load (VL).1 Genital HIV detection and VL in HIV-positive women are intermittent and associated with various factors, including age,2 coinfections with other reproductive tract infections (RTIs),3 and use of antiretroviral therapy.4 Reproducible cervicovaginal sampling methods are needed to understand more clearly what causes genital HIV VL to change and its subsequent role in sexual and vertical HIV transmission.
Cervicovaginal secretions have been collected using a wide range of methods including the endocervical swab (ECS),5–8 cervicovaginal lavage (CVL),7–12 and menstrual cup (MC).11,12 Yet, relatively few studies have tested the validity and reproducibility of these methods to collect samples for genital HIV VL detection.8,11,12 Volumes recovered in CVLs can be highly variable relative to the amount of fluid instilled,13 which can affect the volume of cell-free and cell-associated virus collected, prompting transition to swab enrichment of lavage specimens.12 CVL provides an advantage over ECS in that increased surface area is sampled.14 However, this increase in surface area prohibits identification of the location of HIV within the genital tract. In contrast, ECS allows for targeted sampling of the endocervical compartment but can also lead to blood contamination through abrasion and disruption of the mucosal barrier, which interferes with HIV VL quantification.15
The MC has been proposed as an alternative genital sampling method,16 based on its safety and acceptability for use during menses,17–19 and the possibility for self-insertion,16 which many women prefer.20 The MC, like CVL, collects fluid from a larger surface area and larger sample volumes than ECS.16 The MC has been used for in vitro assessments of HIV infection susceptibility and reproductive immunogenicity,21,22 but few studies have compared its performance to other collection methods.11
The optimal sampling method to measure genital HIV VL in women has not been determined. This study compares MC, ECS, and swab-enriched CVL (eCVL) sampling methods for genital HIV RNA detection and quantification of VL among HIV-positive women not yet eligible for antiretroviral therapy (ART).
2 |. MATERIALS AND METHODS
This study was nested within a double-blinded (participants and outcome assessors) randomized controlled trial comparing the levonorgestrel intrauterine device (LNG IUD) and the copper IUD with respect to HIV progression and potential transmission to sexual partners among HIV-positive women in Cape Town, South Africa (trial registration: NCT01721798). This nested study followed women for 6 months, with visits at screening, enrollment (IUD insertion), month 3, and month 6, and was approved by ethics committees of the University of Cape Town, South Africa, and FHI 360, United States.
Eligible women were 18–40 years old, with known HIV infection and CD4 ≥350 cells/mm3 (the criteria in South Africa for ART initiation during enrollment included CD4 <350 cells/mm3), not pregnant/not wishing to become pregnant in the next 2 years, intending to reside in the area for the next 30 months, and without any condition contraindicating IUD use. Participants were tested for some common RTIs (Neisseria gonorrhea (NG), Chlamydia trachomatis (CT), Trichomonas vaginalis (TV), Treponema pallidum, and bacterial vaginosis (BV)) at the screening visit and treated if positive. Women who tested negative or were within 2 weeks of treatment for any of these RTIs were eligible to enroll, with IUD insertion occurring at the end of the enrollment visit. The RTI testing and treatment were performed as a safety measure to reduce risk of possible pelvic inflammatory disease at the time of IUD insertion. Tests for these RTIs were repeated at the month 3 and 6 visits. At each visit, whole blood was collected from each woman and processed for HIV plasma VL.
For each eligible woman providing consent, three different genital tract samples (MC, ECS, and eCVL) were collected for HIV RNA detection at enrollment and month 3 and 6 visits. Visits were scheduled to avoid menstrual bleeding, and women were instructed not to insert any products vaginally or to have vaginal intercourse 48 hours prior to the visit. Samples were obtained prior to IUD insertion at enrollment and, among women electing to continue the IUD, the IUD was in place during sampling at the 3-and 6-month visits. At each visit, women completed a sociodemographic, reproductive and sexual history questionnaire, as well as questions about their experiences with MC specimen collection.
2.1 |. Genital specimen collection
For the MC sample, women either self-inserted (enrollment) or had a clinician insert (months 3, month and 6) an individually wrapped, single use Instead Softcup™ (Evofem Inc., San Diego, CA, USA). Self-insertion was only feasible at enrollment, based on the order of specimen collection. The MC was inserted to cover the cervix and was to remain in place for at least 60 minutes before being removed by a clinician and transferred to a sterile 50-mL Falcon tube. Clinicians recorded the exact time of MC insertion and removal. For the ECS samples, a clinician collected endocervical fluid with elongated tapered flocked swabs (Copan Diagnostics, Murrieta, CA, USA) during a pelvic examination. Each swab was allowed to absorb fluid inside the endocervical canal for 60 seconds, without rotating the swab to prevent micro-abrasion. Collected swabs were placed into individual cryovials with 1.5 mL phosphate-buffered saline (PBS). The first swab was used for HIV RNA detection, and a second swab was stored for future use. For the eCVL sample, an elongated tapered flocked swab was collected as with ECS and inserted into a transport tube. Next, a flexible plastic pipette was used to introduce 5 mL of normal saline into the posterior vaginal fornix for a 60-second lavage with three consecutive aspirations and discharges against the vaginal walls and the cervix. Total fluid was recovered from the posterior fornix by a final aspiration and added to the transport tube with the swab. Once collected, samples were stored at 4°C until processing, which occurred within four hours of collection. The order of sample collection was rotated by study visit (enrollment: MC/ECS/eCVL; month 3: ECS/eCVL/MC; and month 6: eCVL/MC/ECS). Specimen collection for NG, CT, TV, and BV tests always occurred after the eCVL.
2.2 |. Genital sample processing
The 50-mL centrifuge tube containing the MC sample was weighed and the volume of secreted fluid calculated and recorded by subtracting the average weight of ten 50-mL tubes containing an unused MC. Using a sterile wooden disposable spatula, the MC membrane was inverted to allow the content to collect at the bottom of the tube. The tube was closed and centrifuged at 850 g for 10 minutes. After centrifugation, any residual secretion on the MC was removed by pipette, and the MC removed and discarded. The tube content was resuspended in PBS. Using the determined weight of secretions and assuming 1 g=1 mL genital secretion, a 10-fold dilution was made, which was aliquoted and stored at −70°C. For specimens weighing less than 0.08 g (n=6), an additional volume of PBS was added prior to aliquoting to ensure sufficient volume (0.6 mL) for the HIV assay. The ECS sample was resuspended by mixing the tube (ECS with 1.5 mL PBS) on a vortex mixer for 1 minute. All fluid was removed from the swab by gently scraping the swab head against the inside of the tube before discarding it. ECS samples were aliquoted and stored at −70°C. The eCVL specimens were centrifuged at 850 g for 10 minutes with the swabs intact. The supernatant was aspirated, and 4 mL of supernatant was aliquoted and stored at −70°C. PBS was used for dilution of MC and ECS specimens based on methodology recommended by those with MC experience (personal communication, Dr. N. Karasavva) and used by prior publications.7,11 We used normal saline for eCVL rather than PBS for comparability to methodology of many published studies.7,11,23,24 To our knowledge, there are no publications that have documented HIV RNA recovery based on diluent used for lavage, but Dezzutti et al. found that diluent did not impact recovery of most soluble chemokines in the absence of BV.7 For ECS and eCVL specimens, the amount of diluent was determined as described in the literature.7,11,23
Prior to storage, 10 μL of each of the three samples from each visit was tested for hemoglobin and erythrocytes using Combur3 Test E strips (Cobas, Roche Diagnostics Ltd., Rotkreuz, Switzerland). While women were instructed not to engage in vaginal intercourse 48 hours prior to the visit, we tested a subsample of specimens for the presence of prostate specific antigen (PSA) by ELISA (Human Kallikrein 3/PSA Quantikine ELISA, R&D Systems, Minneapolis, US). A positive PSA represented unprotected sex ≤48 hours prior to visit and, thus, potential HIV RNA contamination from a partner. As only one plate was available for this testing, eCVL samples were used due to larger number of available aliquots with this sampling method. For PSA testing, one aliquot from each enrollment eCVL specimen and from 13 specimens at month 3 and 14 specimens at month 6 was selected. At months 3 and 6, samples were selected based on genital tract HIV RNA levels, with equal inclusion of high (>50 000 copies/mL), medium (10 000–50 000 copies/ mL), and low (<10 000 copies/mL) VL measures to improve representation. All PSA samples were run on the same plate, and a standard curve constructed by plotting the mean absorbance for each standard run in duplicate. The concentration of PSA in each sample was determined by reading the absorbance from the standard curve generated. A PSA concentration >4 ng/mL was considered positive for semen contamination.
2.3 |. HIV VL test
Each participant’s plasma and genital tract MC, ECS, and eCVL specimens at each visit were tested for HIV RNA concentration using the Abbott M2000SP/RT viral load assay (Abbott Diagnostics, Illinois, USA) with a lower limit of detection of 40 copies/mL. This method has been validated at the National Health Laboratory Services Division of Medical Virology in South Africa for detection of HIV-1 subtype C in plasma.25 Per laboratory protocol, specimen quantity of 0.6 mL was required for testing, with an additional 0.4 mL available for repeat assays.
2.4 |. Statistical analysis
The primary outcome was genital HIV VL compared between paired MC, ECS, and eCVL specimens for each woman at each visit. HIV VL was dichotomized as non-detectable/non-quantifiable vs quantifiable with a continuous number recorded in copies/mL. For calculations of medians, non-quantifiable specimens were assigned a value of 40 copies/mL (the assay’s lower detection limit), and specimens with non-detectable values were assigned a value of 20 copies/mL. To adjust for the three different comparisons (MC vs ECS, MC vs eCVL, ECS vs eCVL), we used a Bonferroni adjusted critical alpha value of 0.017 (i.e., 0.05 divided by 3) to determine statistical significance. Paired comparisons between specimen collection methods were analyzed with McNemar’s exact tests for dichotomous outcomes and Wilcoxon rank-sum tests for continuous outcomes. For pooled analyses across visits, comparisons were adjusted for clustering at the individual level and stratified by visit using an extension of Somer’s D.26
For specimen quality measures, we compared the proportion with insufficient samples for HIV VL detection, as well as the presence of hemoglobin and erythrocytes. Any sample with a liquid fraction less than 0.6 mL in volume was considered insufficient. Hemoglobin and erythrocyte results were dichotomized into 0–2 vs 3–4+. Plasma and genital HIV VL measures were compared using Spearman’s correlation. For the MC, we also estimated Spearman’s correlation between genital HIV VL and insertion time and specimen weight, respectively. We calculated 95% confidence intervals for Spearman’s correlations using a Fisher’s Z transformation. To avoid the possibility of contamination by blood and/or semen, we ran sensitivity analyses restricting comparisons to specimens that did not test positive (3–4+) for hemoglobin, and women whose eCVL specimens did not test positive for PSA. We also ran a sensitivity analysis in which we gave any insufficient specimens a value of non-detectable to assess the impact of differential insufficient specimens by collection method on findings.
3 |. RESULTS
Fifty-one women enrolled in this study, from whom a total of 148 specimens per collection method were analyzed for HIV V. three women missed their month 3, and two women their month 6 visits. At enrollment, participants had a median age of 30 years (interquartile range, IQR, 26, 33), with a median time since HIV diagnosis of 44 months (IQR 13, 69). Most had experienced at least one pregnancy (94%) and were with a steady sexual partner (84%) at enrollment, as well as month 3 (81%) and month 6 (84%). At screening, 16% (n=8) tested positive for BV, 8% (n=4) for TV, 6% (n=3) for CT and 6% (n=3) for NG; all were treated prior to enrollment. The median CD4 count at screening was 571 cells/mm3, ranging from 357 to 1222 cells/mm3, and the median plasma VL at enrollment was 3.78 log10 copies/mL, ranging from non-detectable (n=2) to 5.34 log10 copies/mL. All women reported not using ART within the last 6 months at enrollment.
3.1 |. Specimen quality: insufficient specimens, presence of hemoglobin, erythrocytes, and PSA
Across all visits, volumes recovered from MC specimens (13%) were more likely to be insufficient for HIV RNA VL testing, compared with ECS (2%, P=0.006) and eCVL (0%, P<0.001). Insufficient MC specimens were collected at each visit: n=4 at enrollment; n=2 at month 3; and n=6 at month 6. For potential blood contamination, in paired comparisons at enrollment, eCVL specimens (collected third) were significantly more likely to test positive for hemoglobin in the 3–4+ range (n=25, 49%) than the ECS (collected second, n=11, 21%, P=0.001) or the MC (collected first, n=8, 16%, P<0.001). There were no statistically significant differences in hemoglobin levels at the 3-and 6-month visits (ranging from 39%−50% of specimens positive in the 3–4+ range). In contrast to hemoglobin measurement, the presence of whole erythrocytes was very low, with only two MC (1%), three ECS (2%), and one eCVL (1%) specimen with high (3–4+) levels of erythrocytes across all visits (P>0.17 for each of the three paired comparisons). Seven (14%) enrollment eCVL specimens tested positive for PSA, suggesting recent unprotected sexual contact (≤48 hours); four of 13 were PSA-positive at month 3, and four of 14 at month 6.
3.2 |. MC insertion time, weight, and acceptability
The median MC insertion time across all visits was 81 minutes (IQR 65, 103). As the MC insertion was the first specimen collected at enrollment, the median insertion time was longer than at months 3 and 6 (115 minutes vs 70 and 72 minutes, P<0.001). However, all but 13 MC specimens (9%) resulted from MCs inserted for at least 60 minutes across all visits. The median MC specimen weight across visits was 0.31 grams (IQR 0.21, 0.47) and was modestly correlated with insertion time (Spearman’s ρ=0.20, 95% CI: 0.04, 0.35). The median weight was 0.24 g (IQR: 0.15, 0.29) for specimens inserted for <60 minutes, 0.30 g (IQR: 0.20, 0.43) for MCs inserted for 60–90 minutes, 0.34 g (IQR: 0.21, 0.48) for MCs inserted for 91–120 minutes, and 0.38 g (IQR 0.26, 0.64) for >121 minutes. MC specimens with quantifiable HIV RNA (n=73) weighed more (0.35 g, IQR: 0.29, 0.53) than specimens with non-quantifiable/non-detectable HIV RNA (n=63; 0.28 g, IQR: 0.19, 0.41; P=0.015). However, there was no statistically significant difference in HIV RNA detection by insertion time, with a median insertion time of 85 minutes (IQR: 64, 112) for those with quantifiable HIV RNA compared to 76 minutes (IQR: 65, 103; P=0.78) for those with non-detectable/non-quantifiable levels for all visits combined.
Most women (72%) reported the MC to be very (30%) or somewhat (42%) comfortable at enrollment; this proportion increased to 88% at month 3 (48% very/40% somewhat, P=0.03) and 90% at month 6 (54% very/36% somewhat, P=0.07). Only three women (6%) had difficulties removing the MC at any of the visits, and each only for a single visit. Most (83%−90% depending on the visit) wanted the nurse practitioner to remove the MC. Five women (10%) reported that they minded being asked to use the MC for this study at any of the visits and each only for a single visit. At enrollment, 17 (35%) reported they would consider using the MC for their menses in the future, which decreased to 14 (30%) at month 3 (P=0.40) and 8 (17%) at month 6 (P=0.007).
3.3 |. HIV RNA VL by genital specimen collection method
Of all the methods compared, MC specimens had the highest proportion of quantifiable HIV RNA at enrollment and month 3 (Figure 1). At enrollment, 60% of MC specimens had quantifiable HIV RNA compared to 38% of ECS (P=0.004) and 41% of eCVL specimens (P=0.004); in sensitivity analysis with insufficient specimens (n=4) coded as non-detectable, this became non-significant at P=0.065. This trend continued at the 3-month visit, with no significant differences in proportion quantifiable at month 6 (Table 1). When restricted to paired specimens with quantifiable RNA, the median VL was significantly higher for MC specimens compared to both ECS and eCVL specimens, as seen in Table 1. For all specimens, MC specimens had the highest median HIV VL compared to the other methods at each visit, regardless of collection order (Figure 2). In pooled analyses across visits, median VL was significantly higher for MC specimens (2.62 log10 copies/mL) compared to ECS (1.30 log10 copies/mL, P<0.001) or eCVL specimens (1.60 log10 copies/mL, P<0.001). The median VL was also significantly higher in eCVL specimens compared to ECS specimens (P<0.001). These comparisons remained statistically significant (P<0.001) when restricted to specimens that did not show signs of hemoglobin contamination and tested negative for the presence of male semen by PSA (data not shown). However, in sensitivity analysis in which insufficient specimens were coded as non-detectable, the eCVL now had a statistically significantly higher median VL than MC specimens (1.45 log10 copies/mL, P < 0.001); both the eCVL and MC still had statistically significant higher median VL than the ECS.
FIGURE 1.
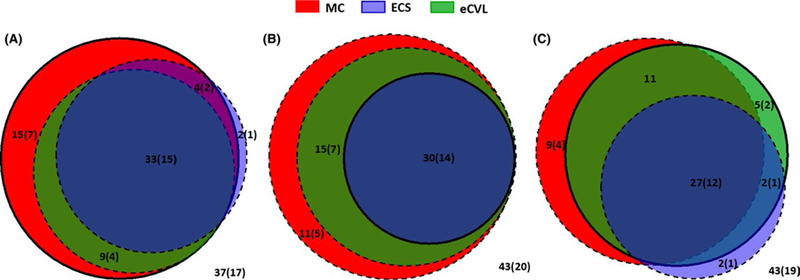
Comparison in sensitivity to detect HIV RNA concentrations in genital tract specimens collected using different sampling methods. MC, menstrual cup (red); ECS, endocervical swab (blue); eCVL, swab-enriched cervicovaginal lavage (green) with A=enrollment, B=month 3, and C=month 6 visits. Each circle’s area is proportional to the number of samples with quantifiable HIV RNA and their subset, with solid lines indicating the sample that was taken first. Values within circles indicate percentage of total (all women) with quantifiable HIV RNA; the values in brackets indicate the number of total. Values outside of circles indicate the percentage (and number in brackets) of samples, where HIV RNA was not detectable/not quantifiable
TABLE 1.
Comparison of specimen collection methods for genital HIV viral load (VL) detection by type of specimen and visit among HIV-positive women not using ART in Cape Town, South Africa
| Menstrual Cup (MC) | Endocervical swab (ECS) | Swab-enriched cervicovaginal lavage (eCVL) |
P-values* |
|||
|---|---|---|---|---|---|---|
| MC vs ECS | MC vs eCVL | eCVL vs ECS | ||||
| Enrollment visit (n=51) | ||||||
| Order of specimen collection | First | Second | Third | |||
| Insufficient specimen, n (%) | 4 (8%) | 3 (6%) | 0 (0%) | 1.000 | 0.125 | 0.250 |
| Among those with sufficient specimen, n (%) with quantifiable HIV VL | 28 (60%) | 18 (38%) | 21 (41%) | 0.004 | 0.004 | 1.000 |
| Among those with quantifiable HIV VL, median log 10 copies/mL of HIV RNA (IQR)a | 3.55 (3.07, 4.14) | 2.97 (2.42, 3.47) | 3.05 (2.84, 3.37) | 0.002 | <0.001 | 0.820 |
| Median log 10 copies/mL of plasma HIV VL (IQR) | 3.78 (3.16, 4.30) | |||||
| Spearman’s correlation (95% CIs) between genital and plasma HIV VL (including ND and NQ) | 0.44 (0.18, 0.64) | 0.47 (0.22, 0.66) | 0.45 (0.20, 0.64) | |||
| Month 3 visit (n=48) | ||||||
| Order of specimen collection | Third | First | Second | |||
| Insufficient specimen, n (%) | 2 (4%) | 0 (0%) | 0 (0%) | 0.500 | 0.500 | 1.000 |
| Among those with sufficient specimen, n (%) with quantifiable HIV VL | 26 (57%) | 14 (29%) | 21 (44%) | 0.001 | 0.062 | 0.016 |
| Among those with quantifiable HIV VL, median log 10 copies/mL of HIV RNA (IQR)a | 3.70 (3.23, 4.14) | 2.76 (2.50, 3.37) | 2.96 (2.77, 3.64) | 0.001 | <0.001 | 0.064 |
| Median log 10 copies/mL of plasma HIV VL (IQR) | 3.77 (2.99, 4.45) | |||||
| Spearman’s correlation (95% Cis) between genital and plasma HIV VL (including ND and NQ) | 0.62 (0.40, 0.77) | 0.46 (0.20, 0.66) | 0.64 (0.44, 0.78) | |||
| Month 6 visit (n=49) | ||||||
| Order of specimen collection | Second | Third | First | |||
| Insufficient specimen, n (%) | 6 (12%) | 0 (0%) | 0 (0%) | 0.031 | 0.031 | 1.000 |
| Among those with sufficient specimen, n (%) with quantifiable HIV VL | 19 (44%) | 16 (33%) | 23 (47%) | 0.146 | 1.000 | 0.065 |
| Among those with quantifiable HIV VL, median log 10 copies/mL of HIV RNA (IQR)a | 3.71 (3.29, 4.36) | 2.99 (2.45, 3.31) | 3.09 (2.71, 3.76) | 0.005 | 0.002 | 0.140 |
| Median log 10 copies/mL of plasma HIV VL (IQR) | 3.74 (3.23, 4.04) | |||||
| Spearman’s correlation (95% Cis) between genital and plasma HIV VL (including ND and NQ) | 0.52 (0.26, 0.71) | 0.48 (0.23, 0.67) | 0.59 (0.37, 0.74) | |||
IQR, interquartile range; ND, non-detectable; NQ, non-quantifiable
Matched analyses using McNemar’s exact for proportion and Wilcoxon rank-sum for medians.
Medians are presented for all of that type of specimen with quantifiable VL; P-values are computed for those in which both types of specimens had quantifiable VL.
FIGURE 2.

Comparison of HIV RNA concentrations in menstrual cup (MC), endocervical swab (ECS), and enriched cervicovaginal lavage (eCVL) samples, by sampling order. At enrollment, the specimen collection order was as follows: MC/ECS/eCVL (left panel). At month 3, the order was ECS/eCVL/MC (middle panel). At month 6, the order was eCVL/MC/ECS (right panel). Each dot represents the HIV RNA concentration in each woman’s sample; gray lines link matched sample sets for each woman. Wilcoxon rank-signed test was performed to compare viral loads between sample methods for matched sets, and P-values <0.017 were considered significant
3.4 |. Correlation between HIV RNA concentrations in matching genital sample sets and plasma
We examined correlations between HIV RNA concentrations in matched MC, ECS, and eCVL genital samples (Figure 3). Although MC detected the most HIV RNA in the genital tract with higher median VLs (Figure 2), genital VLs detected by MC, ECS, and eCVL sampling were significantly correlated: eCVL correlated most strongly with MC (Spearman’s ρ scores >0.80), while ECS was least correlated with MC (Spearman’s ρ scores <0.75). Further, the correlation between genital and plasma HIV VL was similar across MC, ECS, and eCVL specimens, ranging from 0.44 to 0.64, in analysis inclusive of all sufficient specimens (Table 1).
FIGURE 3.

Correlation between HIV RNA concentrations detected in matching MC, ECS, and eCVL genital samples, according to sampling order. Each dot represents the HIV RNA concentration in each woman’s matching sample pairs. Spearman correlation was performed, and P-values <0.017 were considered significant. Dotted line represents the line of equivalence (x=y)
4 |. DISCUSSION
In this study, among pairs of sufficient specimens, MC specimens yielded higher median levels of HIV RNA than eCVL or ECS specimens, and eCVL specimens generally had higher levels than ECS. Both MC and eCVL methods sample a larger surface area of the lower reproductive tract than ECS, which may explain why these specimens yielded higher HIV VL than ECS. Another study comparing CVL (without swab enrichment) to MC for HIV-1 antibody (IgG) similarly found that MCs resulted in a higher proportion of specimens with detectable HIV-1 (99% of specimens vs 80%, P=0.029).11 These findings may be due to greater time in the genital tract for collection or by the increased MC surface area and adherence of viscous secretions to the MC that do not easily dissolve in lavage fluid for eCVL. Alternately, the higher dilution volumes used for ECS and eCVL may have reduced the chances of HIV RNA detection by these methods simply due to the MC specimen being more concentrated. The similar rates of HIV RNA detection between MC and eCVL at visit 3, where eCVL was performed first, suggest dilution is less of an issue than actual quantity of genital tract secretions recovered.
Conversely, there were higher levels of insufficient specimens in the MC compared to ECS and eCVL across all visits. Correct placement of the MC may be harder to achieve than collection of cells from targeted sites using the eCVL and ECS. The issue of insufficient specimen may be greater for HIV RNA testing as a relatively large specimen is required, as compared to chemokine or RTI assays. The lower IQR of 0.15 g meant that 25% of samples had secretion weights below this value. Extra PBS was added to make up this volume to 0.6 mL, the minimum sample volume required for HIV RNA testing. Further, for some samples, repeated HIV RNA testing was required and the volume available was insufficient for this, resulting in insufficient sample status. For the ECS, the swab absorbs a considerable amount of the PBS. The recovered volume was typically around 1.2 mL, of which 1 mL was sent for HIV RNA testing and volume for samples requiring repeat testing would have been insufficient.
Further, we eliminated more MC samples due to insufficient volume than eCVL or ECS, where a set dilution amount was used regardless of recovered genital tract fluid quantity. This exclusion of insufficient MC samples may have falsely elevated the proportion of MC samples with detectable HIV RNA. To counter this, in the sensitivity analysis in which we assumed all insufficient specimens were non-detectable, the eCVL had a higher median VL than the MC. However, this sensitivity analysis is a very conservative estimate; given that 54% of sufficient MC specimens had detectable RNA, it is unlikely that all 12 insufficient MC specimens would have been non-detectable had there been sufficient sample. Further research is needed on MC insertion and removal techniques to reduce the likelihood of insufficient specimen collection for HIV VL testing.
There were higher levels of hemoglobin in the eCVL compared to MC or ECS at the enrollment visit. This finding may be a result of the eCVL specimen being the last specimen to be collected at the enrollment visit. A study comparing eCVL and CVL found that eCVL specimens had higher amounts of microscopic blood present (29% vs 22%) but that eCVL resulted in highest HIV detection rate even when restricted to specimens without blood present.12 Presence of hemoglobin was similar, and somewhat high, across methods at months 3 and 6. This observation may be attributable to IUD use, particularly of the LNG IUD, as subclinical uterine bleeding may occur due to inflam-matory response and the effects of progestin.27,28
Of note, proportions of specimens with detectable HIV RNA at each visit are somewhat lower than previously reported among other cohorts including ART-naïve HIV-infected women.29–32 The restriction of our cohort to women with CD4 counts >350 cells/mm3 and with recent RTI screening and treatment may have contributed to this observation. We treated all women with prevalent infection at screening, ideally reducing any contribution of RTIs to genital tract HIV shedding at enrollment, and there were few incident infections detected in this group. Two women had undetectable plasma viral load at all visits and all participants, including these two women, had documented positive HIV antibody testing at screening. We note that other studies have attributed this finding to undisclosed ART use.33 We do not believe that HIV RNA detection was impacted by the dilution factor used, identical to that of other studies and considered standard practice.23 Given the large number of factors that impact genital tract HIV RNA shedding, those detected in this study are within the range reported in the literature.
The MC appeared acceptable to most women, as only 6% reported difficulties with insertion, and, for each of these women, only at a single visit. Further, comfort level with the MC increased over time with women’s use experience. Another study in South Africa similarly found that user comfort with the MC for menstrual management was high in this setting and increased over time.19 All of the women in our study were willing to self-insert the MC at enrollment. In another study in South Africa, all 20 participants preferred for a provider to insert the MC, but only one-quarter were not willing to try self-insertion.11
This study is among the first to directly compare the MC, eCVL and ECS for HIV RNA detection and VL quantification. Study strengths include rotation of specimen collection over three visits among the same group of women for paired comparisons, sensitivity analyses to assess the potential role of blood contamination and semen on HIV RNA quantification, and inclusion of HIV-positive women not using ART, for whom the probability of genital shedding of HIV is higher than for women using ART.
This study also has several limitations. The preferable method design would have been randomizing sampling order within visits, but this was not feasible for clinical staff at the busy site clinic, although rotation of the order of sampling by visit ensured that each method had the same number of observations of being used first, second or third. Not all specimens were tested for PSA to rule out the role the presence of semen may have played in HIV VL detection levels. However, sensitivity analyses among PSA-negative specimens still showed that the MC yielded higher median HIV VL as compared to eCVL and ECS specimens. Reproducibility of the MC and eCVL could not be assessed as these sampling techniques were not replicated in the same participant at a similar point in time. Last, nearly half of all specimens at months 3 and 6 contained 3–4+ hemoglobin levels, suggesting possible blood contamination which may have affected the correlation with plasma VL levels. Similarly, some of the HIV RNA component may have been derived from cell-associated RNA. We did not separately analyze cell-free and cell-associated RNA but, based on the hemoglobin levels in specimens, we do not believe that cell disruption was more likely with MC sampling than with the other methods, which both included endocervical swab collection. Future method comparison studies in which MC is included should consider this analysis.
In summary, eCVL and MC sampling are both superior to ECS for HIV RNA detection and quantification and, if yield of sufficient specimens can be improved, MC may be superior to eCVL. MC sample mass was generally greater, which may prove advantageous to studies where multiple assays are planned from the same sample. MC sampling may also be completed by the patient herself, without provider time and associated cost. However, MC sampling also may require longer insertion time with a potential disadvantage in terms of longer study visits. Further study is needed to determine optimal MC insertion time and technique to optimize genital tract secretion recovery as well as to delineate the utility of MC sampling compared to other methods for other immunological measures, such as immunoglobulins or cytokines.
ACKNOWLEDGMENTS
We thank the staff of the Gugulethu Green Clinic for their efforts and our patients for their time and trust. We thank Nicos Karasavva, PhD, for his guidance on menstrual cup sample processing techniques. This study was supported by grants from the Eunice Kennedy Shriver National Institute of Child Health and Development (5R01HD071804) and the Preventive Technologies Agreement (No. GHO-A-00–09-00016–00) from the United States Agency for International Development. OSOM® BV Blue and Trichomonas test kits were donated by Sekisui Diagnostics and some Xpert® CT/NG kits by Cepheid Diagnostics. Mirena® levonorgestrel intrauterine devices were donated by Bayer Pharmaceuticals. SZJ was supported by postdoctoral funding from the Poliomyelitis Research Foundation of South Africa. The study sponsors played no role in study design; collection, management, analysis, and interpretation of data; writing of this report; and the decision to submit this report for publication.
Funding information
Eunice Kennedy Shriver National Institute of Child Health and Human Development, Grant/ Award Number: 5R01HD071804; United States Agency for International Development, Preventive Technologies Agreement, Grant/ Award Number: GHO-A-00–09-00016–00; Poliomyelitis Research Foundation of South Africa (Dr. Jaumdally).
REFERENCES
- 1.Baeten JM, Kahle E, Lingappa JR, et al. Genital HIV-1 RNA predicts risk of heterosexual HIV-1 transmission. Sci Transl Med 2011;3:77ra29. [DOI] [PMC free article] [PubMed] [Google Scholar]
- 2.Ananworanich J, Kerr SJ, Vernazza P, et al. Genital shedding of HIV after scheduled treatment interruption. Int J STD AIDS 2011;22:61–66. [DOI] [PubMed] [Google Scholar]
- 3.Johnson LF, Lewis DA. The effect of genital tract infections on HIV-1 shedding in the genital tract: a systematic review and meta-analysis. Sex Transm Dis 2008;35:946–959. [DOI] [PubMed] [Google Scholar]
- 4.Ondoa P, Gautam R, Rusine J, et al. Twelve-month antiretroviral ther-apy suppresses plasma and genital viral loads but fails to alter genital levels of cytokines, in a cohort of HIV-infected Rwandan women. PLoS ONE 2015;10:e0127201. [DOI] [PMC free article] [PubMed] [Google Scholar]
- 5.Jones HE, Allan BR, van de Wijgert JH, et al. Agreement between self-and clinician-collected specimen results for detection and typing of high-risk human papillomavirus in specimens from women in Gugulethu, South Africa. J Clin Microbiol 2007;45:1679–1683. [DOI] [PMC free article] [PubMed] [Google Scholar]
- 6.van de Wijgert J, Altini L, Jones H, et al. Two methods of self-sampling compared to clinician sampling to detect reproductive tract infections in Gugulethu, South Africa. Sex Transm Dis 2006;33:516–523. [DOI] [PubMed] [Google Scholar]
- 7.Dezzutti CS, Hendrix CW, Marrazzo JM, et al. Performance of swabs, lavage, and diluents to quantify biomarkers of female genital tract soluble mucosal mediators. PLoS ONE 2011;6:e23136. [DOI] [PMC free article] [PubMed] [Google Scholar]
- 8.John GC, Sheppard H, Mbori-Ngacha D, et al. Comparison of tech-niques for HIV-1 RNA detection and quantitation in cervicovaginal secretions. J Acquir Immune Defic Syndr 2001;26:170–175. [DOI] [PMC free article] [PubMed] [Google Scholar]
- 9.Coutlée F, Hankins C, Lapointe N. Comparison between vaginal tampon and cervicovaginal lavage specimen collection for detection of human papillomavirus DNA by the polymerase chain reaction. The Canadian Women’s HIV Study Group. J Med Virol 1997;51:42–47. [DOI] [PubMed] [Google Scholar]
- 10.Snowhite IV, Jones WE, Dumestre J, et al. Comparative analysis of methods for collection and measurement of cytokines and immuno-globulins in cervical and vaginal secretions of HIV and HPV infected women. J Immunol Methods 2002;263:85–95. [DOI] [PubMed] [Google Scholar]
- 11.Archary D, Liebenberg LJ, Werner L, et al. Randomized cross-sectional study to compare HIV-1 specific antibody and cytokine concentrations in female genital secretions obtained by menstrual cup and cervicovaginal lavage. PLoS ONE 2015;10:e0131906. [DOI] [PMC free article] [PubMed] [Google Scholar]
- 12.Delany S, Rosas R, Mlaba N, et al. Comparison of cervicovaginal la-vage, cervicovaginal lavage enriched with cervical swab, and vaginal tampon for the detection of HIV-1 RNA and HSV-2 DNA in genital secretions. J Acquir Immune Defic Syndr 2008;49:406–409. [DOI] [PubMed] [Google Scholar]
- 13.Bélec L, Meillet D, Lévy M, et al. Dilution assessment of cervicovaginal secretions obtained by vaginal washing for immunological assays. Clin Diagn Lab Immunol 1995;2:57–61. [DOI] [PMC free article] [PubMed] [Google Scholar]
- 14.Ndjoyi-Mbiguino A, Ozouaki F, Legoff J, et al. Comparison of washing and swabbing procedures for collecting genital fluids to assess cervicovaginal shedding of herpes simplex virus type 2 DNA. J Clin Microbiol 2003;41:2662–2664. [DOI] [PMC free article] [PubMed] [Google Scholar]
- 15.Hart CE, Lennox JL, Pratt-Palmore M, et al. Correlation of human immunodeficiency virus type 1 RNA levels in blood and the female genital tract. J Infect Dis 1999;179:871–882. [DOI] [PubMed] [Google Scholar]
- 16.Boskey ER, Moench TR, Hees PS, Cone RA. A self-sampling method to obtain large volumes of undiluted cervicovaginal secretions. Sex Transm Dis 2003;30:107–109. [DOI] [PubMed] [Google Scholar]
- 17.North BB, Oldham MJ. Preclinical, clinical, and over-the-counter postmarketing experience with a new vaginal cup: menstrual collection. J Women’s Health Larchmt 2011;20:303–311. [DOI] [PMC free article] [PubMed] [Google Scholar]
- 18.Howard C, Rose CL, Trouton K, et al. FLOW (finding lasting options for women): multicentre randomized controlled trial comparing tampons with menstrual cups. Can Fam Physician 2011;57:e208–e215. [PMC free article] [PubMed] [Google Scholar]
- 19.Beksinska ME, Smit J, Greener R, et al. Acceptability and performance of the menstrual cup in South Africa: a randomized crossover trial comparing the menstrual cup to tampons or sanitary pads. J Women’s Health (Larchmt) 2015;24:151–158. [DOI] [PubMed] [Google Scholar]
- 20.Jones HE, Wiegerinck MA, Nieboer TE, et al. Women in the Netherlands prefer self-sampling with a novel lavaging device to clinician collection of specimens for cervical cancer screening. Sex Transm Dis 2008;35:916–917. [DOI] [PubMed] [Google Scholar]
- 21.Patel MV, Fahey JV, Rossoll RM, et al. Innate immunity in the vagina (part I): estradiol inhibits HBD2 and elafin secretion by human vaginal epithelial cells. Am J Reprod Immunol 2013;69:463–474. [DOI] [PMC free article] [PubMed] [Google Scholar]
- 22.Patel MV, Ghosh M, Fahey JV, et al. Innate immunity in the vagina (Part II): Anti-HIV activity and antiviral content of human vaginal secretions. Am J Reprod Immunol 2014;72:22–33. [DOI] [PMC free article] [PubMed] [Google Scholar]
- 23.Jespers V, Francis SC, van de Wijgert J, Crucitti T. Methodological issues in sampling the local immune system of the female genital tract in the context of HIV prevention trials. Am J Reprod Immunol 2011;65:368–376. [DOI] [PubMed] [Google Scholar]
- 24.Francis SC, Hou Y, Baisley K, et al. Immune activation in the female genital tract: expression profiles of soluble proteins in women at high risk for HIV infection. PLoS ONE 2016;11:e0143109. [DOI] [PMC free article] [PubMed] [Google Scholar]
- 25.Stevens WS, Marshall TM. Challenges in implementing HIV load testing in South Africa. J Infect Dis 2010;201(Suppl 1):S78–S84. [DOI] [PubMed] [Google Scholar]
- 26.Newson R Confidence intervals for rank statistics: Somers’ D and extension. Stata J 2006;6:309–334. [Google Scholar]
- 27.Hidalgo M, Bahamondes L, Perrotti M, et al. Bleeding patterns and clinical performance of the levonorgestrel-releasing intrauterine system (Mirena) up to two years. Contraception 2002;65:129–132. [DOI] [PubMed] [Google Scholar]
- 28.Backman T, Huhtala S, Tuominen J, et al. Sixty thousand woman-years of experience on the levonorgestrel intrauterine system: an epidemiological survey in Finland. Eur J Contracept Reprod Health Care 2001;6(Suppl 1): 23–26. [DOI] [PubMed] [Google Scholar]
- 29.Forhan SE, Dunne EF, Sternberg MR, et al. HIV-1 and herpes simplex virus type-2 genital shedding among co-infected women using self-collected swabs in Chiang Rai, Thailand. Int J STD AIDS 2012;23:560–564. [DOI] [PubMed] [Google Scholar]
- 30.Lawn SD, Subbarao S, Wright TC Jr, et al. Correlation between human immunodeficiency virus type 1 RNA levels in the female genital tract and immune activation associated with ulceration of the cervix. J Infect Dis 2000;181:1950–1956. [DOI] [PubMed] [Google Scholar]
- 31.Homans J, Christensen S, Stiller T, et al. Permissive and protective factors associated with presence, level, and longitudinal pattern of cervicovaginal HIV shedding. J Acquir Immune Defic Syndr 2012;60:99–110. [DOI] [PMC free article] [PubMed] [Google Scholar]
- 32.Todd J, Riedner G, Maboko L, et al. Effect of genital herpes on cervicovaginal HIV shedding in women co-infected with HIV AND HSV-2 in Tanzania. PLoS ONE 2013;8:e59037. [DOI] [PMC free article] [PubMed] [Google Scholar]
- 33.Kahle EM, Kashuba A, Baeten JM, et al. Partners in Prevention HSVHIV Transmission Study Team. Unreported antiretroviral use by HIV-1-infected participants enrolling in a prospective research study. J Acquir Immune Defic Syndr 2014;65:e90–e94. [DOI] [PMC free article] [PubMed] [Google Scholar]