Key Points
Only pDCs among all human DC subsets react robustly to EBV infection with a distinct production of type I IFN subtypes.
EBV infections limit pDC activation, and even exogenous IFN supplementation or pDC expansion delays EBV infection only transiently.
Abstract
Infectious mononucleosis, caused by infection with the human gamma-herpesvirus Epstein-Barr virus (EBV), manifests with one of the strongest CD8+ T-cell responses described in humans. The resulting T-cell memory response controls EBV infection asymptomatically in the vast majority of persistently infected individuals. Whether and how dendritic cells (DCs) contribute to the priming of this near-perfect immune control remains unclear. Here we show that of all the human DC subsets, plasmacytoid DCs (pDCs) play a central role in the detection of EBV infection in vitro and in mice with reconstituted human immune system components. pDCs respond to EBV by producing the interferon (IFN) subtypes α1, α2, α5, α7, α14, and α17. However, the virus curtails this type I IFN production with its latent EBV gene products EBNA3A and EBNA3C. The induced type I IFNs inhibit EBV entry and the proliferation of latently EBV-transformed B cells but do not influence lytic reactivation of the virus in vitro. In vivo, exogenous IFN-α14 and IFN-α17, as well as pDC expansion, delay EBV infection and the resulting CD8+ T-cell expansion, but pDC depletion does not significantly influence EBV infection. Thus, consistent with the observation that primary immunodeficiencies compromising type I IFN responses affect only alpha- and beta-herpesvirus infections, we found that EBV elicits pDC responses that transiently suppress viral replication and attenuate CD8+ T-cell expansion but are not required to control primary infection.
Visual Abstract
Introduction
Epstein-Barr virus (EBV) is a common gamma herpesvirus affecting only humans.1 EBV is one of the most successful viruses, persistently infecting >95% of the adult population. Its success in establishing persistence in humans is due to a cascade of latent gene expression programs that allow infected cells to gain access to the long-lived memory B-cell pool.2 The transition of latently EBV-infected B cells to the virus-associated tumors that express the same latent gene products is believed to be prevented by cell-mediated immune control3 because immunodeficiencies affecting cytotoxic lymphocytes predispose for different EBV-positive lymphomas.4-6 Dendritic cells (DCs) might play a crucial role in priming this protective immune control during primary EBV infection.7,8
In response to this requirement, the distribution of receptors that recognize pathogen-associated molecular patterns (PAMPs) on human DCs could have been shaped by successful pathogens such as EBV during their virus–host coevolution. This action might be one reason why human DCs differ significantly in their PAMP recognition from the mouse.9 Indeed, the Toll-like receptors 7 (TLR7) and TLR9 that recognize as PAMPs, respectively, viral RNA and double-stranded DNA, as packaged in herpesviruses, have peculiar distributions. They are primarily expressed by B cells and plasmacytoid DCs (pDCs) in humans, whereas they are present on nearly all DC subsets in mice.9,10 This differential response by DCs to TLR stimulation can also be observed in mice with human immune system components (huNSG mice) after reconstitution with CD34+ hematopoietic progenitor cells.11,12 These in vivo models allow the interrogation of mouse and human DCs in parallel upon injection of TLR stimuli. TLR7 stimulation elicits efficient type I interferon (IFN) production by human pDCs but nearly no interleukin-12 (IL-12) production by human conventional DCs (cDCs).11 In contrast, mouse DC compartments react with both cytokines to TLR7 stimulation. Similarly, bacterial cell wall components such as TLR4 agonists elicit both type I IFN and IL-12 by mouse DCs but are not efficiently detected by human pDCs or cDCs due to low or absent TLR4 expression. The human DC compartments of huNSG mice can therefore be used to interrogate innate immune detection of EBV by human DCs to further characterize the antigen-presenting cells that are involved in the priming of the near-perfect immune control of this tumor virus.
As one of these human DC compartments, pDCs respond primarily with type I IFN to viral infections. Type I IFNs are a pleiotropic family of cytokines with important functions in eliciting antiviral immune responses within the host. Type I IFNs consist of 12 distinct IFN-α subtypes, IFN-β, IFN-ε, IFN-κ, and IFN-ω.13 All IFN-α subtypes lack introns, and their protein length varies between 161 and 167 amino acids. Their protein sequences are highly conserved, with 75% to 99% amino acid sequence identity.14,15 They all bind to the IFN-α/β receptor (IFNAR) receptor, although binding affinity to the receptor subunits IFNAR1 and IFNAR2 differs between subtypes.16 The activation of distinct signaling cascades may occur in a subtype-specific manner,17 possibly due to different binding affinities, cell type specificities, the microenvironment, and timing or preconditioning of signaling pathways.18,19 These factors ultimately result in specific patterns of IFN-stimulated genes (ISGs) induced by the individual IFN-α subtypes. This action in turn explains their distinct antiviral and immunomodulatory properties in different viral infections.20-26 However, the biological role of individual IFN-α subtypes during EBV infection has not been studied thus far, partly due to lack of a suitable in vivo infection model.
After EBV infection in vivo, we found that IFN-α responses predominated over those of IL-12, suggesting that pDCs were the main DC subset responding to EBV infection. We further found a specific IFN-α signature elicited by EBV infection characterized by robust production of IFN-α1, IFN-α2, IFN-α5, IFN-α7, IFN-α14, and IFN-α17. Although type I IFN responses were not required for EBV-driven T-cell expansion, IFN-α was capable of limiting EBV entry into B cells in vitro and delaying EBV infection in vivo. These studies suggest that pDCs are part of the innate immune response to EBV but that EBV has developed countermeasures against type I IFN production, including expression of the latent gene products EBNA3A and EBNA3C.
Materials and methods
EBV virus purification
EBV B95-8 was produced from EBNA3A knock-out (3aKO), EBNA3C knock-out (3cKO), or wild-type bacterial artificial chromosomes maintained in human embryonic kidney HEK293 cells, as described elsewhere.27 To calculate Raji green units (RGU), the green fluorescent protein (GFP)–expressing viruses were titrated on Raji cells (ATCC) in serial dilution, and the GFP-expressing cells were analyzed by flow cytometry 2 days later.
Isolation of cell subsets from peripheral blood mononuclear cells
Peripheral blood mononuclear cells (PBMCs) from healthy donors were isolated by density gradient centrifugation on Ficoll-Paque Premium (GE Healthcare). pDCs and B cells were isolated with BDCA-4 and CD19 microbeads, respectively, by using an AutoMACS pro (Miltenyi Biotec GmbH). For the pDC-depleted fractions, BDCA-4 microbeads were used, and the most stringent AutoMACS depletion program (deplete 025) was applied.
Recombinant IFN-α subtypes and inhibition assays
The recombinant IFN-α subtypes used in this study were produced and purified as previously described.24 Raji, Ramos, or primary B cells were distributed in 96 well plates and exposed to IFN-α subtypes and EBV at the indicated concentrations and multiplicities of infection (MOIs) for 48 hours, and viral entrance into the cell nucleus was detected by GFP expression according to flow cytometry. B-cell or EBV-transformed lymphoblastoid cell line (LCL) proliferation was measured by using the CellTrace Violet Cell Proliferation Kit (Thermo Fisher Scientific), following the manufacturer’s instructions. Alternatively, proliferation was measured by thymidine incorporation: after 8 days of culture, [3H]thymidine (1 μCi/well) was added for the last 16 hours before the cells were harvested, and the level of [3H]thymidine incorporation was measured by using a 1450 MicroBeta Plus liquid scintillation counter (PerkinElmer).
TLR ligands
Class C CpG ODN 2395 (CpG C) was purchased from InvivoGen, R848 from Enzo Life Sciences, and Poly (I:C) from InvivoGen.
Mice
NOD-scid γcnull (NSG) mice were obtained from The Jackson Laboratory, and huNSG mice were generated as previously described.27-29 Newborn NSG mice (1-5 days old) were irradiated with 1 Gy and reconstituted after 5 to 7 hours by intrahepatic injection of 1 to 3 × 10⁵ CD34+ human fetal liver–derived hematopoietic progenitor cells (Advanced Bioscience Resources). Twelve weeks later, the reconstitution of human immune system components in the peripheral blood of the huNSG mice was analyzed by using flow cytometry. For cell preparations, spleens were mechanically disrupted and filtered by using a 70-μm cell strainer before erythrocyte lysis. Lymph nodes were mechanically disrupted and filtered through a 70-μm cell strainer. Bone marrow cells were flushed from excised tibia and femurs or isolated via centrifugation. Whole blood was treated by 2 to 3 rounds of erythrocyte lysis. All animal protocols were approved by the Cantonal Veterinary Office Zurich (148/2011, ZH209/2014, and ZH159/17).
EBV infection and treatment of mice
huNSG mice were injected intraperitoneally (IP) with 1 × 10⁵ RGU or 5 ×10⁵ RGU EBV wild-type, 5 × 10⁵ RGU 3aKO, or 5 × 10⁵ RGU 3cKO. For IFN-α treatment, recombinant IFN-α subtypes IFN-α14 or IFN-α17 (8000 U per mouse) were injected IP for 14 consecutive days, starting 1 day before EBV infection. For DC expansions, mice were injected IP with 10 μg of recombinant human Fms-related tyrosine kinase 3 ligand (FLT3L, generously provided by Amgen Inc.) daily for 5 to 8 consecutive days before EBV infection. For pDC depletions, mice were injected IP with 3 doses of 30 mg/kg anti–CD303-LFB (α-CD303) as per manufacturer’s recommendations (generously provided by LFB Biotechnologies). Anti–CD303-LFB is the humanized version of chimeric 122A2 antibody previously described.30 Depletion efficiency was monitored according to flow cytometric analysis of peripheral blood samples beginning before EBV infection and weekly thereafter. At experimental termination, depletion was further assessed in blood, spleen, bone marrow, and lymph nodes.
Assessment of EBV viral titer in blood and spleen
EBV viral loads were measured as previously described.27,29,31
Enzyme-linked immunosorbent assay
IFN-α Pan and IL-12p40 enzyme-linked immunosorbent assay kits were purchased from Mabtech AB, and assays were performed according to the manufacturer’s recommendations.
Statistical analysis
Statistical analyses were performed by using Prism software (GraphPad Software). Paired Student t tests, unpaired Student t tests, or 2-tailed Mann-Whitney U tests were used as indicated. Differences with P < .05 were considered statistically significant and are displayed in the figures.
Results
EBV infection is mainly sensed by pDCs via type I IFN production in human leukocytes
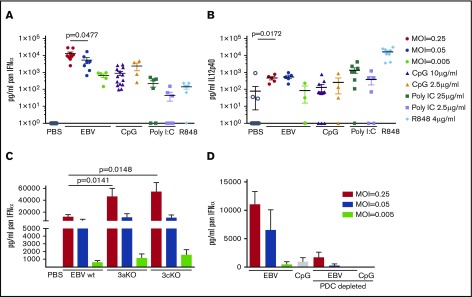
To evaluate innate immune detection of EBV by human leukocytes, we characterized production of the pDC- or cDC-specific signature cytokines IFN-α (total IFNα, including all subtypes) and IL-12, respectively,32,33 in human PBMCs after EBV infection. Eighteen to 24 hours after infection with the B95-8 strain of EBV at different MOIs, substantial IFN-α production could be measured, with levels similar to, or exceeding, stimulation with the TLR9 agonist CpG, the TLR3 agonist Poly I:C, and the TLR7/8 agonist R848 (Figure 1A). IFN-β was also produced but at 10-fold lower levels (supplemental Figure 1C). In contrast, only minimal IL-12p40, with concentrations 10-fold lower than R848 stimulation, could be detected (Figure 1B). In good agreement with previous findings that the nuclear antigen 3C of EBV (EBNA3C) interferes with IFN regulatory factors,34 we observed that PBMCs produced fivefold higher IFN-α levels in response to infection with EBNA3A- and EBNA3C-deficient viruses (3aKO and 3cKO) (Figure 1C). IFN-α production by wild-type, 3aKO, and 3cKO viruses was dependent on pDCs because their depletion reduced IFN-α concentrations to background levels upon EBV infection (Figure 1D; supplemental Figure 1A). Interestingly, and in contrast to IFN-α production, the low levels of IL-12p40 production were further decreased in the absence of EBNA3A or EBNA3C (supplemental Figure 1B). Regardless of the presence or absence of EBNA3A or EBNA3C, EBV infection did not influence pDC viability (supplemental Figure 1D). These findings support the notion that pDCs are the primary DC subtype responding to initial EBV infection.
Figure 1.
EBV infection elicits type I IFN production in PBMCs in a pDC-dependent manner. Total PBMCs were exposed to EBV, CpG C, Poly I:C, or R848 at the indicated concentrations, and culture supernatants were collected after 18 to 24 hours and analyzed for cytokine production according to enzyme-linked immunosorbent assay. IFN-α (A) and IL-12p40 (B) content was measured. (C) PBMCs were inoculated with wild-type EBV (wt), EBNA3A-deficient EBV (3aKO), or EBNA3C-deficient EBV (3cKO), and IFN-α production was measured. MOI 0.005, n = 5; MOI 0.05, n = 7; and MOI 0.25, n = 9. (D) Total PBMCs were compared with pDC-depleted PBMCs. MOI 0.005, n = 2; MOI 0.05, n = 4; and MOI 0.25, n = 2. Paired Student t tests were used for all graphs.
pDCs preferentially produce IFN-α1, IFN-α2, IFN-α5, IFN-α7, IFN-α14, and IFN-α17 after EBV infection of human leukocytes
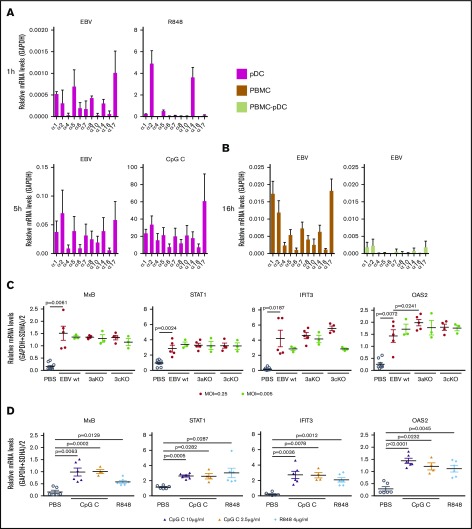
Recent studies have identified significant differences in the efficacy of IFN-α subtypes during hepatitis B virus, HIV, and simian immunodeficiency virus infections.35 We therefore addressed which human IFN-α subtypes were elicited upon exposure of pDCs (Figure 2A) or PBMCs (Figure 2B) to EBV. For this purpose, IFN-α subtype transcription was characterized in purified pDCs at 1 and 5 hours post-EBV exposure or incubation with R848 or CpG. At 5 hours, EBV elicited mainly IFN-α1, IFN-α2, IFN-α5, IFN-α7, IFN-α14, and IFN-α17. Expression of IFN-α5 and IFN-α17 was further observed already at 1 hour postexposure when transcript levels were still very low. In contrast, IFN-α production in response to R848 was dominated by IFN-α2 and IFN-α14, whereas CpG elicited mainly IFN-α17. The same IFN-α subtype pattern in response to EBV was also observed in infected PBMCs 16 hours after EBV exposure and, likewise, was strictly pDC dependent. As a confirmation of EBV-dependent IFN-α transcription, we analyzed messenger RNA levels of the ISG myxovirus resistance protein B (MxB),36 signal transducer and activator of transcription 1 (STAT1),37 IFN-induced protein with tetratricopeptide repeats 3 (IFIT3),38 and 2′-5′-oligoadenylate synthetase 2 (OAS2).39 All of these ISGs were efficiently induced by EBV exposure, and both IFIT3 and OAS2 exhibited a trend toward higher induction by EBNA3A- and EBNA3C-deficient viruses (Figure 2C). ISG transcription upon EBV exposure reached similar or higher levels compared with CpG and R848 stimulation (Figure 2D). Thus, EBV sensing by pDCs results in the preferential production of IFN-α1, IFN-α2, IFN-α5, IFN-α7, IFN-α14, and IFN-α17.
Figure 2.
EBV elicits IFN-α1, IFN-α2, IFN-α5, IFN-α7, IFN-α14, and IFN-α17 preferentially after pDC stimulation in PBMCs. (A) Relative messenger RNA (mRNA) levels of IFN-α subtypes were measured in isolated pDCs exposed to EBV or R848 for 1 hour (n = 2) or to EBV (n = 4 for IFN-α16 and IFN-α17; n = 5 for the other IFN-α subtypes) or CpG C (n = 2) for 5 hours. (B) Relative mRNA levels of IFN-α subtypes were measured on total PBMCs or pDC-depleted PBMCs 16 hours after infection (n = 3). (C) Total PBMCs were exposed to wild-type EBV (wt), EBNA3A-deficient EBV (3aKO), or EBNA3C-deficient EBV (3cKO) for 24 hours. Relative mRNA levels of the ISGs MxB, STAT1, IFIT3, and OAS2 were measured by using quantitative real-time polymerase chain reaction. (D) Total PBMCs were exposed to class C CpG ODN 2395 (CpG C) or R848 for 24 hours. Relative mRNA levels of the ISGs were assessed as in panel D. Paired Student t tests were used for statistical analyses. Glyceraldehyde 3-phosphate dehydrogenase (GAPDH) and succinate dehydrogenase complex flavoprotein subunit A (SDHA) were used to normalize mRNA levels.
IFN-α subtypes inhibit EBV entry and proliferation of latently EBV-infected B cells but not lytic EBV reactivation
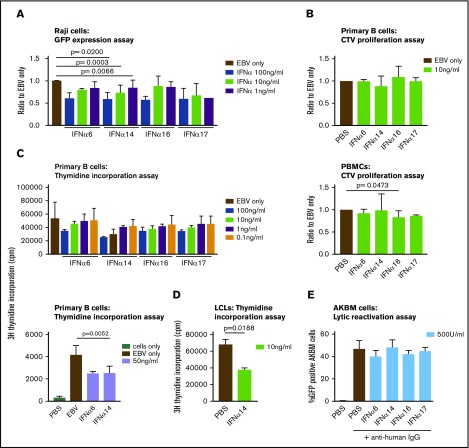
We next assessed the ability of various IFN-α subtypes to modulate different stages of the EBV life cycle.40 We chose the 2 IFN-α subtypes that were abundantly produced during EBV infection of human leukocytes, IFN-α14 and IFN-α17, and 2 that were subdominant, IFN-α6 and IFN-α16. We first tested to what extent titrated doses of the IFN-α subtypes, including 10 ng/mL (which we detected during EBV stimulation of PBMCs), were able to inhibit EBV entry (Figure 3A). For this purpose, recombinant EBV viruses encoding GFP were used to infect the Raji or Ramos Burkitt lymphoma cell lines or primary human B cells. GFP expression as a measure of viral DNA delivery to the nucleus was evaluated in the presence of 1, 10, and 100 ng/mL of IFN-α6, IFN-α14, IFN-α16, or IFN-α17. All IFN-α subtypes, including IFN-α14, were able to inhibit GFP expression in a dose-dependent manner after EBV entry into Raji cells, as well as into Ramos and primary human B cells (supplemental Figure 2A). B-cell viability was not influenced by this treatment (supplemental Figure 2B).
Figure 3.
IFN-α6, IFN-α14, IFN-α16, and IFN-α17 inhibit EBV entry and B-cell transformation into LCLs. (A) Raji cells were exposed to EBV and the indicated concentrations of IFN-α subtypes for 48 hours. GFP expression as a measure of EBV entry was determined by using flow cytometry, and the ratios of EBV plus IFN-α to EBV only are shown in the graph. Statistical analysis was done on raw data (percent GFP-positive cells), and paired Student t tests were applied. IFN-α6: n = 3. IFN-α14: 100 ng/mL, n = 6; 10 ng/mL, n = 15; 1 ng/mL, n = 12. IFN-α16: 100 ng/mL, n = 3; 10 ng/mL and 1 ng/mL, n = 5. IFN-α17: 100 ng/mL and 10 ng/mL, n = 4; 1 ng/mL, n = 1. (B) Isolated B cells or total PBMCs were exposed to EBV in the presence or absence of the IFN-α subtypes for 6 days, and proliferation was measured by CellTrace Violet (CTV) dilution. Statistical analysis was performed on raw data (percent proliferating cells), and paired Student t tests were applied. B cells: IFNα6, n = 2; IFN-α14, n = 16; IFN-α16, n = 4; IFN-α17, n = 2. PBMCs: IFN-α6, n = 2; IFN-α14, n = 16; IFN-α16, n = 6; IFN-α17, n = 2. (C) Proliferation of isolated B cells was also measured after 8 days of culture by pulsing the cells with [3H]-thymidine for 16 hours and thereafter measuring [3H]-thymidine incorporation (n = 2). In the lower graph, n = 2 for IFN-α6 and n = 4 for IFN-α14. (D) The proliferation of LCLs in the presence or absence of IFN-α14 was measured after 4 days by thymidine incorporation (n = 3). Paired Student t tests were applied. (E) Resistance of lytic EBV reactivation against IFN-α subtypes was shown by using AKBM cells (n = 5 for PBS, n = 4 for IFN-α6 and IFN-α14, n = 3 for IFN-α16 and IFN-α17).
Furthermore, B-cell proliferation as a result of latent EBV infection after EBV entry was measured by dilution of the CellTrace Violet fluorescent dye or radioactive thymidine incorporation. This proliferation was inhibited in a dose-dependent manner by some IFN-α subtypes, including IFN-α14 (Figure 3B-C). Finally, the proliferation of established B-cell lines transformed by latent EBV infection, LCLs, was also inhibited by 10 ng/mL of recombinant IFN-α14 (Figure 3D). In contrast, lytic EBV reactivation upon B-cell receptor cross-linking on the Akata Burkitt lymphoma cell–derivative AKBM was not altered by the tested IFN-α subtypes (Figure 3E). All of the tested IFN-α subtypes stimulated similar STAT1 phosphorylation, downstream of the type I IFN receptor, as measured by using intracellular flow cytometry or Western blotting (supplemental Figure 3). These studies indicate that EBV entry and latent EBV-driven B-cell expansion can be partially inhibited by different IFN-α subtypes, including IFN-α14, produced in response to EBV infection, whereas lytic EBV reactivation is not affected by type I IFNs.
EBV infection elicits type I IFN production in mice with reconstituted human immune system components
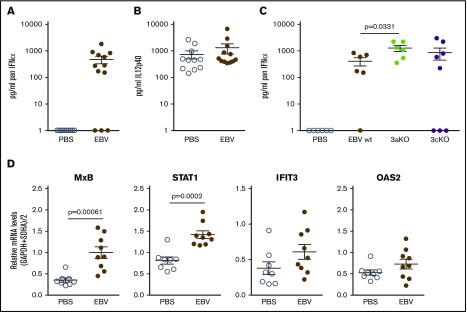
To extend these in vitro studies to EBV infection in vivo, we infected NOD-scid γc−/− mice that had been reconstituted with human immune system compartments by neonatal intrahepatic injection of human CD34+ hematopoietic progenitor cells28 with 5 × 10⁵ RGU of recombinant EBV viruses. Eighteen hours after infection, we detected ∼1 ng/mL of total IFN-α and not detectable or <10 pg/mL of IFN-β in the peripheral blood of infected, but not uninfected, mice (Figure 4A; supplemental Figure 4A). No significant increase in IL-12 production could be detected at 18 and 72 hours after infection (Figure 4B), mirroring the in vitro findings in PBMCs (Figure 1A-B). Although unchanged IL-12p40 concentrations could be detected, IL-12p70 levels were below the detection limit (data not shown). An increase in IFN-α production could also be detected upon in vivo infection with EBNA3A- and EBNA3C-deficient viruses (Figure 4C). However, IL-12 production was not altered in the absence of EBNA3A or EBNA3C. Confirming the IFN-α induction, an increase in ISG transcription was observed after EBV infection, which reached statistical significance for MxB and STAT1 (Figure 4D). These observations suggest that EBV infection elicits IFN-α, but not IL-12, production in huNSG mice.
Figure 4.
EBV infection elicits type I IFN production in huNSG mice. huNSG mice were infected with 5 × 10⁵ RGU EBV, and blood samples were analyzed 18 hours postinfection. IFN-α (A) or IL-12p40 (B) production was measured in the serum by enzyme-linked immunosorbent assay (PBS, n = 11; EBV, n = 12). (C) IFN-α levels were compared in the serum of huNSG mice that were PBS treated (n = 6) or infected with either 5 × 10⁵ RGU of wild-type EBV (wt, n = 6), EBNA3A-deficient EBV (3aKO, n = 6), or EBNA3C-deficient EBV (3cKO, n = 8). (D) ISG induction was measured in blood leukocyte lysates by using quantitative real-time polymerase chain reaction. n = 8 for PBS; n = 9 for EBV. Unpaired Student t tests were applied.
Type I IFN injection transiently attenuates viral loads and CD8+ T-cell expansion after EBV infection in vivo
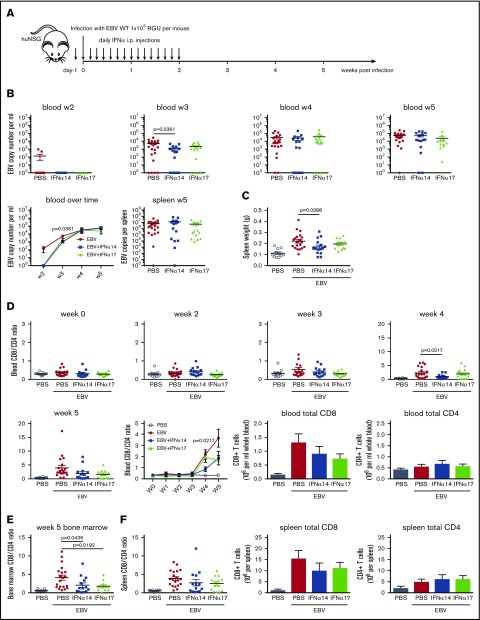
After IFN-α detection upon EBV infection, we investigated whether injections of exogenous IFN-α influenced EBV infection of huNSG. Mice were injected daily with 8000 U of IFN-α14 or IFN-α17, or phosphate-buffered saline (PBS) as a control, beginning 1 day before infection with EBV. Blood viral loads and peripheral T-cell responses were monitored weekly over the course of infection (Figure 5A). Viral loads were reliably detectable in peripheral blood of huNSG mice beginning 3 weeks’ postinfection.41 At this time point, reduced viral loads were observed in peripheral blood of IFN-α–treated animals compared with PBS control animals. However, at weeks 4 and 5 postinfection, peripheral viral loads were similar between the treated and untreated groups (Figure 5B). Nevertheless, spleen weight was significantly lower in EBV-infected, IFN-α–treated animals at the time of euthanization (Figure 5C). Although only data from IFN-α14–treated animals reached statistical significance, similar effects on viral loads and spleen weighs were observed in both IFN-α14– and IFN-α17–treated groups.
Figure 5.
Type I IFN injection transiently controls viral loads and attenuates CD8+T-cell expansion after EBV infection in huNSG mice. (A) huNSG mice were treated with either PBS, IFN-α14, or IFN-α17 for 15 consecutive days, starting 1 day before infection with 1 × 10⁵ RGU EBV (schematic depiction). (B) Viral DNA loads were determined by quantitative polymerase chain reaction in the blood over time and in the spleen at week 5. (C) Spleen weight was measured upon euthanization at week 5. (D) The ratio of CD8/CD4 T cells in the blood of huNSG mice was determined by using flow cytometry and monitored over time. Total CD8 and CD4 T-cell counts were determined at week 5. In the summary graphs over time (B,D), data are presented as the mean ± standard error of the mean (SEM). (E) The ratio of CD8/CD4 bone marrow T cells was determined by using flow cytometry. (F) The ratio of CD8/CD4 splenic T cells and total CD8 and CD4 T-cell numbers per spleen was determined by using flow cytometry at week 5. Data were pooled from 5 independent experiments (PBS, n = 20; IFN-α14, n = 15; IFN-α17, n = 15), and unpaired Student t tests were used.
Spleen size increases upon EBV infection are due to EBV-transformed B-cell proliferation but mostly due to expanding CD8+ T cells.41 We therefore analyzed CD8+ T-cell expansion in response to EBV infection of huNSG mice after IFN-α14 or IFN-α17 treatment. CD8+ T-cell expansion after EBV infection was similar in spleen and blood in the absence or presence of an HLA-A2 transgene in huNSG mice (supplemental Figure 4B). In IFN-α14–treated animals, reduced blood viral titers were observed at week 3 postinfection, with a corresponding reduction in CD8+ T-cell expansion in the blood at week 4 (Figure 5D). A similar trend was present in IFN-α14– and IFN-α17–treated animals at week 5 postinfection, which was further detected in the bone marrow and spleen at euthanization (Figure 5E-F). Decreased CD8+ T-cell expansion further correlated with diminished spleen size in EBV-infected, IFN-α–treated huNSG mice compared with nontreated, infected animals but did not significantly alter CD8+, EBNA2+, or CD20+ cell distribution in splenic tissue sections (supplemental Figure 4C). Taken together, these experiments show that the presence of IFN-α early in infection can limit EBV infection and/or viral replication and may reduce CD8+ T-cell expansion as a consequence.
EBV infection may redistribute pDCs in vivo, which, upon expansion, transiently control viral loads
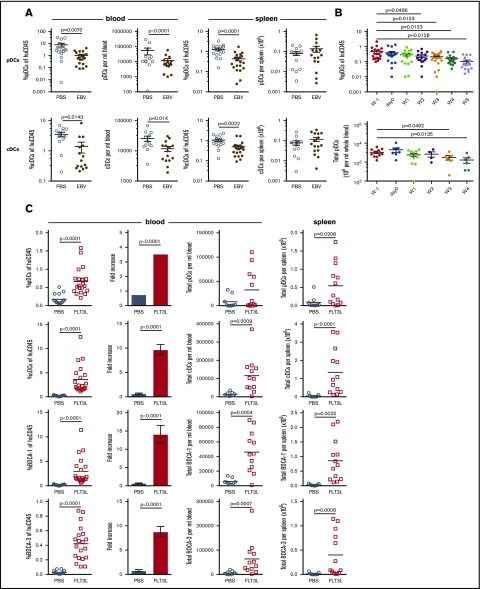
To characterize which DC subpopulations respond during EBV infection of huNSG mice, we monitored pDCs and cDCs after intraperitoneal inoculation with 105 RGU of EBV. We observed that percentages and total numbers of pDCs and cDCs dropped in the peripheral blood upon EBV infection (Figure 6A). Although pDC and cDC percentages also decreased in the spleen after infection, presumably due to lymphocyte expansion, total splenic DC numbers were unchanged or perhaps slightly increased. The decreased percentages and total numbers of pDCs in the peripheral blood were detectable as early as 3 weeks’ postinfection and were maintained for the duration of infection (Figure 6B), whereas no loss of pDC viability could be detected during EBV infection (supplemental Figure 5B), suggesting that blood pDCs redistribute to secondary lymphoid tissues after EBV infection.
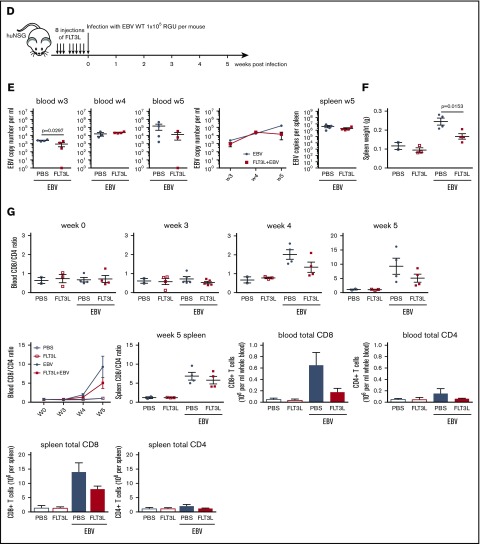
Figure 6.
EBV infection decreases pDCs in the blood of huNSG mice. (A) The DC subsets, pDCs (huCD45+, HLA-DR+, CD3CD19CD56–, CD14CD16–, CD11c–, and BDCA-2+), and cDCs (huCD45+, HLA-DR+, CD3CD19CD56–, CD14CD16–, and CD11c+) were examined by using flow cytometry (see supplemental Figure 5A for gating strategy) in the blood and spleens of huNSG mice, 5 to 6 weeks after infection with 1 × 10⁵ RGU EBV IP or PBS treatment as a control. The DC frequencies of huCD45+ cells (n = 16-21, from 6 individual cohorts) and total numbers (n = 12-15, from 5 individual cohorts) of the DC subsets were determined. (B) pDC frequencies (n = 16-20, paired Student t test) and total numbers (n = 4-11, unpaired Student t test) were measured over time. (C) FLT3L (20 μg per mouse) or PBS was injected IP into huNSG mice for 5 or 8 consecutive days to expand the DC compartment. The DC frequencies of huCD45+ cells, their fold increase, and total DC numbers in the blood (PBS, n = 15; FLT3L, n = 20), as well as the total DC number in the spleen (PBS, n = 9; FLT3L, n = 13), were assessed for pDCs, cDCs, and the BDCA-1+ or BDCA-3+ cDC subsets. (D) After 8 IP injections of FLT3L, huNSG mice from one cohort were infected with 1 × 10⁵ RGU EBV and thereafter monitored for T-cell expansion and EBV viral load in the blood (schematic depiction). (E) EBV viral load was determined at weeks 3 to 5 in the blood and at week 5 in the spleen. (F) Spleen weight was determined at week 5, and unpaired Student t tests were applied. (G) Conversion of the CD8/CD4 T-cell ratio was monitored weekly in the blood and in the spleen at week 5. Total CD8+ and CD4+ T-cell numbers per milliliter whole blood and per spleen at week 5 are depicted. In the summary graphs over time (E,G), data are presented as the mean ± SEM (PBS, n = 2; FLT3L, n = 3; EBV + PBS, n = 4; EBV + FLT3L, n = 4).
We further analyzed the effect of therapeutic DC expansion on EBV infection in huNSG mice. For this purpose, we injected recombinant FLT3L, a cytokine essential for efficient DC development,42 before EBV infection (Figure 6D). FLT3L treatment significantly expanded both pDCs (up to fivefold) and cDCs (up to 10-fold) in huNSG mice (Figure 6C). The flow cytometric gating strategy for the quantification of these DC populations, as well as the CD1c+ (BDCA-1+) and CD141+ (BDCA-3+) cDC subsets, is shown in supplemental Figure 5A and is similar to our previous assessment.11 Consistent with recombinant IFN-α subtype injections, FLT3L-mediated DC expansion resulted in delayed EBV infection with reduced viral titers at week 3 after virus injection (Figure 6E). Furthermore, spleen weights of DC-expanded and EBV-infected huNSG mice were reduced at the time of euthanization (Figure 6F). This reduction in spleen size was likely also the result of decreased CD8+ T-cell expansion, detectable in the peripheral blood 4 weeks’ postinfection and in the spleen at euthanization (Figure 6G). Accordingly, CD8+ T-cell expansion was found to correlate with viral loads in the spleen, and the drop in DC frequency with increased viral loads in the spleen most likely resulted from the significant CD8+ T-cell expansion after EBV infection (supplemental Figure 6A). No differences in viral loads, CD8+ T-cell, pDC, and cDC frequencies and total numbers were found in EBV-induced lymphoma-bearing mice vs tumor-free mice (supplemental Figure 6B). Thus, DCs may redistribute to secondary lymphoid organs during EBV infection, and expanding them therapeutically with FLT3L before EBV infection leads to a transient improvement in viral immune control.
pDC depletion does not alter EBV infection or CD8+ T-cell expansion
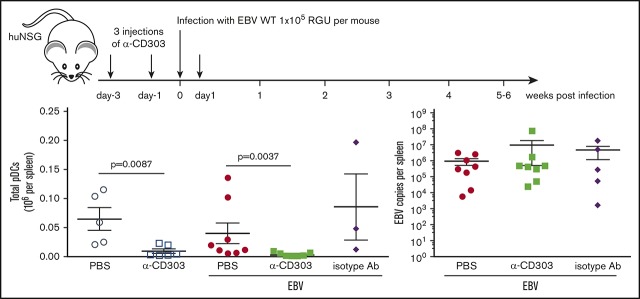
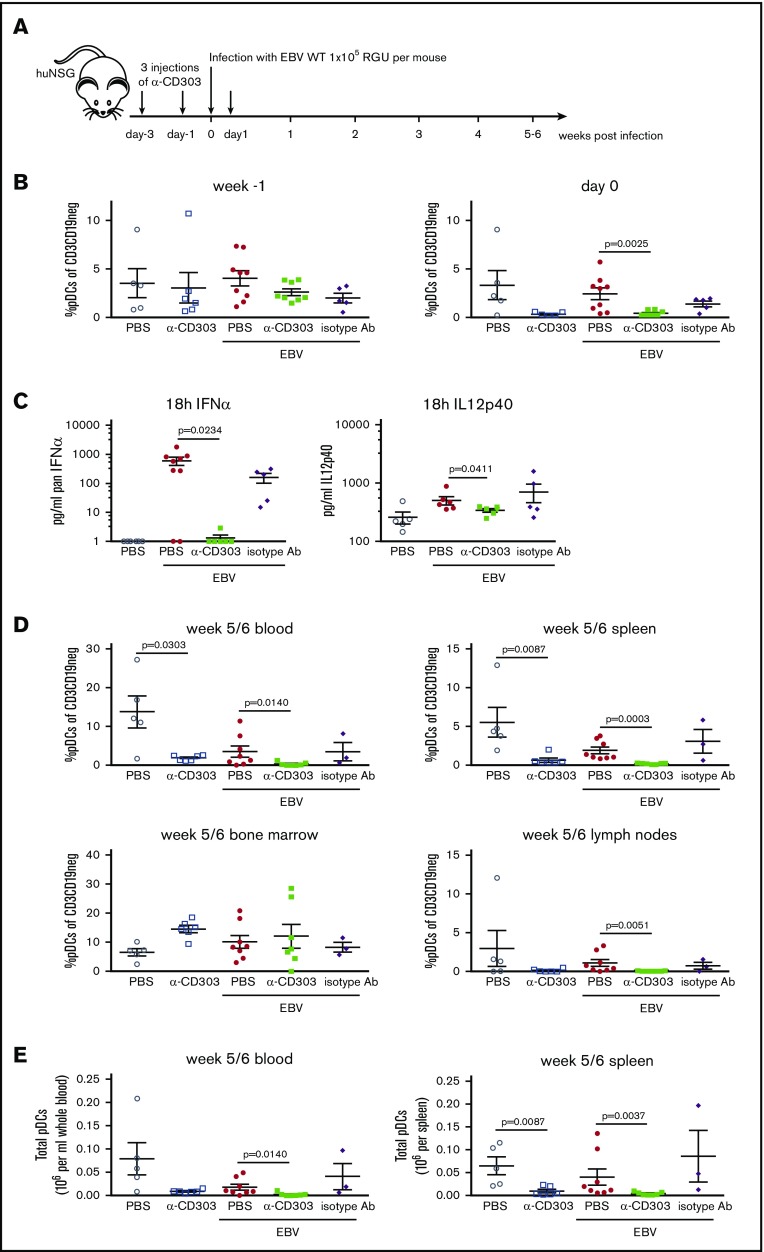
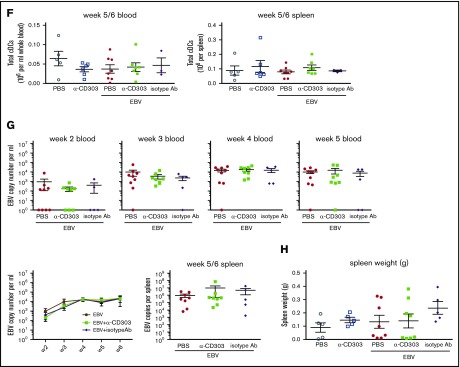
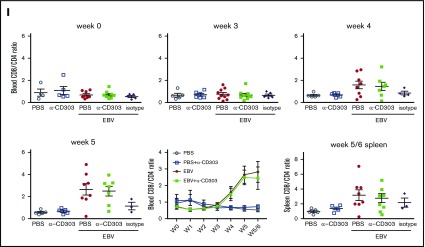
These gain-of-function experiments suggested that improved pDC-mediated IFN-α production delays EBV infection in vivo. However, the reconstituted human immune system compartments of huNSG mice contain ∼1% pDCs, a frequency similar to that of human blood.43 We therefore characterized whether this physiological level of pDCs is sufficient to execute innate immune control of EBV infection and influence adaptive T-cell responses to the virus. Accordingly, we depleted pDCs with a CD303 (BDCA-2)-specific antibody (anti–CD303-LFB) before and 1 day after EBV infection (Figure 7A). This treatment efficiently removed pDCs from the blood of huNSG mice (Figure 7B) and further abolished IFN-α production, and even the minimal IL-12 production, occurring in response to EBV infection (Figure 7C). It also significantly diminished ISG transcription for MxB and STAT1 (supplemental Figure 7B). This depletion persisted in the blood until euthanization and was also detectable in spleen and lymph nodes but not in the bone marrow (Figure 7D-E). cDCs were not affected by the CD303-specific pDC depletion (Figure 7F). The pDC depletion did not affect EBV viral loads longitudinally in blood or spleen at euthanization (Figure 7G). Furthermore, spleen weights were not significantly altered in EBV-infected, pDC-depleted huNSG mice (Figure 7H). Accordingly, CD8+ T-cell expansion and activation, as well as natural killer cell frequencies, were comparable with and without pDC depletion in blood, lymph nodes, bone marrow, and spleen (Figure 7I; supplemental Figure 7C-F). These findings suggest that pDC expansion and IFN-α injection transiently improve immune control of EBV but that the physiological pDC response to EBV infection is not sufficient to alter infection and immune control of the virus in vivo.
Figure 7.
pDC depletion alters neither viral load nor T-cell expansion in EBV-infected huNSG mice. (A) pDCs were depleted in huNSG mice by using 3 injections of a CD303-specific antibody (anti–CD303-LFB; designated α-CD303 throughout the figures) before infection with 1 × 10⁵ RGU EBV. Alternatively, PBS or isotype antibody treatment was used as controls (schematic depiction). (B) Percentage of pDCs was determined by flow cytometry gating on HLA-DR+, CD19–, CD3–, NKp46–, CD14CD16–, CD11c–, CD123+, and CD4+ cells (supplemental Figure 7A). Before treatment and at day 0, after 2 α-CD303 injections, the pDC depletion efficiency was analyzed. Mann-Whitney U tests were applied. (C) The impact of the α-CD303 treatment on cytokine secretion in terms of IFN-α and IL-12p40 production was measured in huNSG mice that were infected with 5 × 10⁵ RGU EBV. Unpaired Student t tests were applied. (D) To compare the depletion efficiency of α-CD303 in the different organs, pDC frequencies were determined in processed blood, spleen, bone marrow, and lymph node cells at the time of euthanization (week 5 or 6). Mann-Whitney U tests were applied. Total pDC (E) or cDC (F) counts in blood and spleen at the time of euthanization are depicted. Mann-Whitney U tests were applied. (G) EBV viral loads were determined at weeks 2 to 5 in the blood and at the time of euthanization in the spleen. (H) Spleen weight was measured at the time of euthanization. (I) The ratio of CD8/CD4 T cells was monitored weekly in the blood and at week 5/6 in the spleen. Data were pooled from 1 independent experiment (PBS, n = 5; PBS + α-CD303, n = 5; EBV + PBS, n = 9; EBV + α-CD303, n = 8; EBV + isotype, n = 5). In the summary graphs over time (G, I), data are presented as the mean ± SEM. WT, wild-type.
Discussion
Our study found that of all DC compartments, pDCs reacted most robustly to EBV infection of PBMCs in vitro and of huNSG mice in vivo. They preferentially produced IFN-α1, IFN-α2, IFN-α5, IFN-α7, IFN-α14, and IFN-α17 after EBV infection, and this type I IFN production was suppressed by the latent EBV antigens EBNA3A and EBNA3C. IFN-α subtypes inhibited EBV entry and proliferation but not lytic reactivation of EBV. Furthermore, administration of exogenous IFN-α14 or IFN-α17 to huNSG mice delayed EBV infection but did not significantly influence the viral load set point. Although EBV infection activates pDCs after infection of huNSG mice and leads to their loss from blood in both huNSG mice and humans during primary EBV infection,44,45 their depletion does not influence viral titers. Therefore, pDCs detect EBV and participate in the innate immune response to this tumor virus but do not significantly influence the outcome of its infection.
These data are in good agreement with previous in vitro studies that described innate immune recognition of EBV via TLR9 of pDCs.46-49 TLR9 preferentially detects nonmethylated CpG motifs in viral DNA.10 This recognition targets the linear viral DNA in virus particles.47 However, after B-cell infection with EBV, viral DNA rapidly circularizes into an episome, which is then heavily methylated and thereby presumably invisible to innate immune detection.50 In addition, TLR2 and TLR3, which are preferentially expressed by cDCs and myeloid cells, have been implicated in EBV detection.51-53 However, we detected very little direct cDC activation as measured by IL-12 production. Moreover, primarily hairpin structures in EBV-encoded small RNAs have been suggested to stimulate both TLR3 and RIG-I as endosomal and cytosolic PAMP receptors for double-stranded RNA,53,54 but we have previously detected no significant changes in EBV infection and associated T-cell expansions in huNSG mice after infection with EBV-encoded small RNA–deficient EBV.55 Thus, EBV readily activates pDCs and pDC-mediated type I IFN production but only marginally stimulates cDCs.
Despite their activation, depletion of pDCs resulted in no significant changes in EBV infection and immune control in huNSG mice in the present study. These findings are also mirrored by primary immunodeficiencies that affect the type I IFN pathway, including mutations in STAT1 and TYK2 that compromise type I IFN receptor signaling, or in UNC-93B and NEMO that compromise endosomal TLR signaling.56-59 Affected individuals are primarily susceptible to alpha- and beta-herpesvirus infections, including herpes simplex encephalitis, but rarely experience EBV-associated diseases. Similarly, IL-12 and IL-12 receptor mutations, resulting in diminished IFN-γ production during viral infections, do not predispose for EBV-associated diseases but are clinically characterized primarily as Mendelian susceptibility to mycobacterial disease.56 Supporting the notion that IFNs have only transient effects on EBV infection, viral transformation of B cells is only sensitive during the first 24 hours to type I IFN and to type II IFNs for up to 3 weeks, whereas LCLs seem to be less sensitive to both IFN classes.60 In good agreement with this, we find little IL-12 production to drive IFN-γ production and no significant alterations of EBV infection of huNSG mice after pDC depletion, as the main type I IFN source. This scenario obviously begs the question how efficient cell-mediated immune control of EBV is established, which protects most persistently infected individuals from lymphomagenesis. We and others have assumed that these responses need to be primed by DCs before efficient expansion by EBV-transformed B cells.7,61 However, the absence of efficient cDC maturation during EBV infection and the limited effects of pDC depletion on viral loads and antiviral T-cell responses force us to reconsider this notion. Similarly, future studies might need to reevaluate the T-cell priming potential of EBV-infected B cells in vivo.
Supplementary Material
The full-text version of this article contains a data supplement.
Acknowledgments
FLT3L for this study was generously provided by Amgen Inc.
This study was supported by Cancer Research Switzerland (KFS-4091-02-2017), KFSPMS, and KFSPHHLD of the University of Zürich; the Vontobel Foundation; the Baugarten Foundation; the Sobek Foundation; the Swiss Vaccine Research Institute; the Swiss MS Society; the Swiss National Science Foundation (310030_162560 and CRSII3_160708); COST (European Cooperation in Science and Technology); and the COST Action BM1404 MyeEUNITER (http://www.mye-euniter.eu) (C.M.) COST is part of the EU Framework Programme Horizon 2020. C.G. was the recipient of a Marie-Heim Vögtlin fellowship from the Swiss National Science Foundation (PMPDP3_145504) and received support from the EMDO Foundation.
Authorship
Contribution: C.G., A. Murer, A. Müller, and D.V. performed the experiments; C.G. and C.M. designed the research; K.S., E.J., N.F., J.K., A.Z., R.C., A.D., P.M., and U.D. contributed essential information or vital reagents; and C.G. and C.M. wrote the manuscript.
Conflict-of-interest disclosure: E.J., N.F., and P.M. work for LFB Biotechnologies, which provided the α-CD303 depleting antibody. A.D. works for Miltenyi Biotec GmbH, which provided a second α-CD303 antibody. The remaining authors declare no competing financial interests.
Correspondence: Christian Münz, Viral Immunobiology, Institute of Experimental Immunology, University of Zürich, Winterthurerstr 190, CH-8057 Zürich, Switzerland; e-mail: christian.muenz@uzh.ch.
References
- 1.Cesarman E. Gammaherpesviruses and lymphoproliferative disorders. Annu Rev Pathol. 2014;9(1):349-372. [DOI] [PubMed] [Google Scholar]
- 2.Thorley-Lawson DA. EBV persistence—introducing the virus. Curr Top Microbiol Immunol. 2015;390(pt 1):151-209. [DOI] [PMC free article] [PubMed] [Google Scholar]
- 3.Taylor GS, Long HM, Brooks JM, Rickinson AB, Hislop AD. The immunology of Epstein-Barr virus-induced disease. Annu Rev Immunol. 2015;33(1):787-821. [DOI] [PubMed] [Google Scholar]
- 4.Totonchy J, Cesarman E. Does persistent HIV replication explain continued lymphoma incidence in the era of effective antiretroviral therapy? Curr Opin Virol. 2016;20:71-77. [DOI] [PMC free article] [PubMed] [Google Scholar]
- 5.Tangye SG, Palendira U, Edwards ES. Human immunity against EBV—lessons from the clinic. J Exp Med. 2017;214(2):269-283. [DOI] [PMC free article] [PubMed] [Google Scholar]
- 6.Cohen JI. Primary immunodeficiencies associated with EBV disease. Curr Top Microbiol Immunol. 2015;390(pt 1):241-265. [DOI] [PMC free article] [PubMed] [Google Scholar]
- 7.Bickham K, Goodman K, Paludan C, et al. . Dendritic cells initiate immune control of Epstein-Barr virus transformation of B lymphocytes in vitro. J Exp Med. 2003;198(11):1653-1663. [DOI] [PMC free article] [PubMed] [Google Scholar]
- 8.Steinman RM. Decisions about dendritic cells: past, present, and future. Annu Rev Immunol. 2012;30(1):1-22. [DOI] [PubMed] [Google Scholar]
- 9.Iwasaki A, Medzhitov R. Toll-like receptor control of the adaptive immune responses. Nat Immunol. 2004;5(10):987-995. [DOI] [PubMed] [Google Scholar]
- 10.Gilliet M, Cao W, Liu YJ. Plasmacytoid dendritic cells: sensing nucleic acids in viral infection and autoimmune diseases. Nat Rev Immunol. 2008;8(8):594-606. [DOI] [PubMed] [Google Scholar]
- 11.Meixlsperger S, Leung CS, Rämer PC, et al. . CD141+ dendritic cells produce prominent amounts of IFN-α after dsRNA recognition and can be targeted via DEC-205 in humanized mice. Blood. 2013;121(25):5034-5044. [DOI] [PMC free article] [PubMed] [Google Scholar]
- 12.Ding Y, Wilkinson A, Idris A, et al. . FLT3-ligand treatment of humanized mice results in the generation of large numbers of CD141+ and CD1c+ dendritic cells in vivo. J Immunol. 2014;192(4):1982-1989. [DOI] [PubMed] [Google Scholar]
- 13.van Pesch V, Lanaya H, Renauld JC, Michiels T. Characterization of the murine alpha interferon gene family. J Virol. 2004;78(15):8219-8228. [DOI] [PMC free article] [PubMed] [Google Scholar]
- 14.Hardy MP, Owczarek CM, Jermiin LS, Ejdebäck M, Hertzog PJ. Characterization of the type I interferon locus and identification of novel genes. Genomics. 2004;84(2):331-345. [DOI] [PubMed] [Google Scholar]
- 15.Zwarthoff EC, Mooren AT, Trapman J. Organization, structure and expression of murine interferon alpha genes. Nucleic Acids Res. 1985;13(3):791-804. [DOI] [PMC free article] [PubMed] [Google Scholar]
- 16.Lavoie TB, Kalie E, Crisafulli-Cabatu S, et al. . Binding and activity of all human alpha interferon subtypes. Cytokine. 2011;56(2):282-289. [DOI] [PubMed] [Google Scholar]
- 17.Cull VS, Tilbrook PA, Bartlett EJ, Brekalo NL, James CM. Type I interferon differential therapy for erythroleukemia: specificity of STAT activation. Blood. 2003;101(7):2727-2735. [DOI] [PubMed] [Google Scholar]
- 18.Tomasello E, Pollet E, Vu Manh TP, Uzé G, Dalod M. Harnessing mechanistic knowledge on beneficial versus deleterious IFN-I effects to design innovative immunotherapies targeting cytokine activity to specific cell types. Front Immunol. 2014;5:526. [DOI] [PMC free article] [PubMed] [Google Scholar]
- 19.Moll HP, Maier T, Zommer A, Lavoie T, Brostjan C. The differential activity of interferon-α subtypes is consistent among distinct target genes and cell types. Cytokine. 2011;53(1):52-59. [DOI] [PMC free article] [PubMed] [Google Scholar]
- 20.Gibbert K, Joedicke JJ, Meryk A, et al. . Interferon-alpha subtype 11 activates NK cells and enables control of retroviral infection. PLoS Pathog. 2012;8(8):e1002868. [DOI] [PMC free article] [PubMed] [Google Scholar]
- 21.Scagnolari C, Trombetti S, Selvaggi C, et al. . In vitro sensitivity of human metapneumovirus to type I interferons. Viral Immunol. 2011;24(2):159-164. [DOI] [PubMed] [Google Scholar]
- 22.Cull VS, Broomfield S, Bartlett EJ, Brekalo NL, James CM. Coimmunisation with type I IFN genes enhances protective immunity against cytomegalovirus and myocarditis in gB DNA-vaccinated mice. Gene Ther. 2002;9(20):1369-1378. [DOI] [PubMed] [Google Scholar]
- 23.Härle P, Cull V, Agbaga MP, et al. . Differential effect of murine alpha/beta interferon transgenes on antagonization of herpes simplex virus type 1 replication. J Virol. 2002;76(13):6558-6567. [DOI] [PMC free article] [PubMed] [Google Scholar]
- 24.Song J, Li S, Zhou Y, et al. . Different antiviral effects of IFNα subtypes in a mouse model of HBV infection. Sci Rep. 2017;7(1):334. [DOI] [PMC free article] [PubMed] [Google Scholar]
- 25.Harper MS, Guo K, Gibbert K, et al. . Interferon-α subtypes in an ex vivo model of acute HIV-1 infection: expression, potency and effector mechanisms. PLoS Pathog. 2015;11(11):e1005254. [DOI] [PMC free article] [PubMed] [Google Scholar]
- 26.Lavender KJ, Gibbert K, Peterson KE, et al. . Interferon alpha subtype-specific suppression of HIV-1 infection in vivo. J Virol. 2016;90(13):6001-6013. [DOI] [PMC free article] [PubMed] [Google Scholar]
- 27.Murer A, McHugh D, Caduff N, et al. . EBV persistence without its EBNA3A and 3C oncogenes in vivo. PLoS Pathog. 2018;14(4):e1007039. [DOI] [PMC free article] [PubMed] [Google Scholar]
- 28.Strowig T, Gurer C, Ploss A, et al. . Priming of protective T cell responses against virus-induced tumors in mice with human immune system components. J Exp Med. 2009;206(6):1423-1434. [DOI] [PMC free article] [PubMed] [Google Scholar]
- 29.Landtwing V, Raykova A, Pezzino G, et al. . Cognate HLA absence in trans diminishes human NK cell education. J Clin Invest. 2016;126(10):3772-3782. [DOI] [PMC free article] [PubMed] [Google Scholar]
- 30.Fournier N, Jacque E, Fontayne A, et al. . Improved in vitro and in vivo activity against CD303-expressing targets of the chimeric 122A2 antibody selected for specific glycosylation pattern. MAbs. 2018;10(4):651-663. [DOI] [PMC free article] [PubMed] [Google Scholar]
- 31.Chijioke O, Müller A, Feederle R, et al. . Human natural killer cells prevent infectious mononucleosis features by targeting lytic Epstein-Barr virus infection [published correction appears in Cell Reports. 2015;12(5):901]. Cell Reports. 2013;5(6):1489-1498. [DOI] [PMC free article] [PubMed] [Google Scholar]
- 32.Liu YJ. IPC: professional type 1 interferon-producing cells and plasmacytoid dendritic cell precursors. Annu Rev Immunol. 2005;23(1):275-306. [DOI] [PubMed] [Google Scholar]
- 33.Trinchieri G. Interleukin-12 and the regulation of innate resistance and adaptive immunity. Nat Rev Immunol. 2003;3(2):133-146. [DOI] [PubMed] [Google Scholar]
- 34.Banerjee S, Lu J, Cai Q, et al. . The EBV latent antigen 3C inhibits apoptosis through targeted regulation of interferon regulatory factors 4 and 8. PLoS Pathog. 2013;9(5):e1003314. [DOI] [PMC free article] [PubMed] [Google Scholar]
- 35.Sutter K, Dickow J, Dittmer U. Interferon α subtypes in HIV infection. Cytokine Growth Factor Rev. 2018;40:13-18. [DOI] [PubMed] [Google Scholar]
- 36.Crameri M, Bauer M, Caduff N, et al. . MxB is an interferon-induced restriction factor of human herpesviruses. Nat Commun. 2018;9(1):1980. [DOI] [PMC free article] [PubMed] [Google Scholar]
- 37.Levy DE, Darnell JE Jr. Stats: transcriptional control and biological impact. Nat Rev Mol Cell Biol. 2002;3(9):651-662. [DOI] [PubMed] [Google Scholar]
- 38.Johnson B, VanBlargan LA, Xu W, et al. . Human IFIT3 modulates IFIT1 RNA binding specificity and protein stability. Immunity 2018;48(3):487-499.5. [DOI] [PMC free article] [PubMed] [Google Scholar]
- 39.García-Álvarez M, Berenguer J, Jiménez-Sousa MA, et al. . Mx1, OAS1 and OAS2 polymorphisms are associated with the severity of liver disease in HIV/HCV-coinfected patients: a cross-sectional study. Sci Rep. 2017;7(1):41516. [DOI] [PMC free article] [PubMed] [Google Scholar]
- 40.Young LS, Yap LF, Murray PG. Epstein-Barr virus: more than 50 years old and still providing surprises. Nat Rev Cancer. 2016;16(12):789-802. [DOI] [PubMed] [Google Scholar]
- 41.Münz C. Humanized mouse models for Epstein Barr virus infection. Curr Opin Virol. 2017;25:113-118. [DOI] [PubMed] [Google Scholar]
- 42.Liu K, Nussenzweig MC. Origin and development of dendritic cells. Immunol Rev. 2010;234(1):45-54. [DOI] [PubMed] [Google Scholar]
- 43.MacDonald KP, Munster DJ, Clark GJ, Dzionek A, Schmitz J, Hart DN. Characterization of human blood dendritic cell subsets. Blood. 2002;100(13):4512-4520. [DOI] [PubMed] [Google Scholar]
- 44.Dunmire SK, Grimm JM, Schmeling DO, Balfour HH Jr, Hogquist KA. The incubation period of primary Epstein-Barr virus infection: viral dynamics and immunologic events. PLoS Pathog. 2015;11(12):e1005286. [DOI] [PMC free article] [PubMed] [Google Scholar]
- 45.Panikkar A, Smith C, Hislop A, et al. . Cytokine-mediated loss of blood dendritic cells during Epstein-Barr virus-associated acute infectious mononucleosis: implication for immune dysregulation. J Infect Dis. 2015;212(12):1957-1961. [DOI] [PubMed] [Google Scholar]
- 46.Münz C. Dendritic cells during Epstein Barr virus infection. Front Microbiol. 2014;5:308. [DOI] [PMC free article] [PubMed] [Google Scholar]
- 47.Fiola S, Gosselin D, Takada K, Gosselin J. TLR9 contributes to the recognition of EBV by primary monocytes and plasmacytoid dendritic cells. J Immunol. 2010;185(6):3620-3631. [DOI] [PubMed] [Google Scholar]
- 48.Severa M, Giacomini E, Gafa V, et al. . EBV stimulates TLR- and autophagy-dependent pathways and impairs maturation in plasmacytoid dendritic cells: implications for viral immune escape. Eur J Immunol. 2013;43(1):147-158. [DOI] [PubMed] [Google Scholar]
- 49.Younesi V, Shirazi FG, Memarian A, Amanzadeh A, Jeddi-Tehrani M, Shokri F. Assessment of the effect of TLR7/8, TLR9 agonists and CD40 ligand on the transformation efficiency of Epstein-Barr virus in human B lymphocytes by limiting dilution assay. Cytotechnology. 2014;66(1):95-105. [DOI] [PMC free article] [PubMed] [Google Scholar]
- 50.Woellmer A, Arteaga-Salas JM, Hammerschmidt W. BZLF1 governs CpG-methylated chromatin of Epstein-Barr virus reversing epigenetic repression. PLoS Pathog. 2012;8(9):e1002902. [DOI] [PMC free article] [PubMed] [Google Scholar]
- 51.Gaudreault E, Fiola S, Olivier M, Gosselin J. Epstein-Barr virus induces MCP-1 secretion by human monocytes via TLR2. J Virol. 2007;81(15):8016-8024. [DOI] [PMC free article] [PubMed] [Google Scholar]
- 52.Ariza ME, Glaser R, Kaumaya PT, Jones C, Williams MV. The EBV-encoded dUTPase activates NF-kappa B through the TLR2 and MyD88-dependent signaling pathway. J Immunol. 2009;182(2):851-859. [DOI] [PubMed] [Google Scholar]
- 53.Iwakiri D, Zhou L, Samanta M, et al. . Epstein-Barr virus (EBV)-encoded small RNA is released from EBV-infected cells and activates signaling from Toll-like receptor 3. J Exp Med. 2009;206(10):2091-2099. [DOI] [PMC free article] [PubMed] [Google Scholar]
- 54.Samanta M, Iwakiri D, Kanda T, Imaizumi T, Takada K. EB virus-encoded RNAs are recognized by RIG-I and activate signaling to induce type I IFN. EMBO J. 2006;25(18):4207-4214. [DOI] [PMC free article] [PubMed] [Google Scholar]
- 55.Gregorovic G, Boulden EA, Bosshard R, et al. Epstein-Barr viruses (EBVs) deficient in EBER-encoded RNAs have higher levels of latent membrane protein 2 RNA expression in lymphoblastoid cell lines and efficiently establish persistent infections in humanized mice. J Virol. 2015;89(22):11711-11714. [DOI] [PMC free article] [PubMed] [Google Scholar]
- 56.Casanova JL, Abel L. The genetic theory of infectious diseases: a brief history and selected illustrations. Annu Rev Genomics Hum Genet. 2013;14(1):215-243. [DOI] [PMC free article] [PubMed] [Google Scholar]
- 57.Casanova JL, Abel L, Quintana-Murci L. Human TLRs and IL-1Rs in host defense: natural insights from evolutionary, epidemiological, and clinical genetics. Annu Rev Immunol. 2011;29(1):447-491. [DOI] [PubMed] [Google Scholar]
- 58.Sancho-Shimizu V, Perez de Diego R, Jouanguy E, Zhang SY, Casanova JL. Inborn errors of anti-viral interferon immunity in humans. Curr Opin Virol. 2011;1(6):487-496. [DOI] [PMC free article] [PubMed] [Google Scholar]
- 59.Giardino G, Cirillo E, Gallo V, et al. . B cells from nuclear factor kB essential modulator deficient patients fail to differentiate to antibody secreting cells in response to TLR9 ligand. Clin Immunol. 2015;161(2):131-135. [DOI] [PubMed] [Google Scholar]
- 60.Lotz M, Tsoukas CD, Fong S, Carson DA, Vaughan JH. Regulation of Epstein-Barr virus infection by recombinant interferons. Selected sensitivity to interferon-gamma. Eur J Immunol. 1985;15(5):520-525. [DOI] [PubMed] [Google Scholar]
- 61.Leung CS, Maurer MA, Meixlsperger S, et al. . Robust T-cell stimulation by Epstein-Barr virus-transformed B cells after antigen targeting to DEC-205. Blood. 2013;121(9):1584-1594. [DOI] [PMC free article] [PubMed] [Google Scholar]
Associated Data
This section collects any data citations, data availability statements, or supplementary materials included in this article.


