

Abstract
Lamin B receptor (LBR) is an inner nuclear membrane protein that associates with the nuclear lamina and harbors sterol reductase activity essential for cholesterol biosynthesis. Several LBR mutations implicated in human congenital disorders give rise to C-terminal truncations which render LBR metabolically unstable, resulting in their rapid turnover in the nucleus. These LBR variants serve as model substrates for investigating the poorly understood protein quality control pathways in the mammalian nuclear envelope (NE). Here we describe a split-GFP based method for tagging these model substrates to enable live cell imaging and flow cytometry for the identification and characterization of NE-resident protein turnover machinery. Furthermore, we describe a facile subcellular fractionation method to isolate a soluble LBR degradation intermediate, allowing the deconvolution of the membrane extraction and proteasomal turnover steps. The combination of imaging-based and biochemical approaches described here facilitates detailed mechanistic studies to dissect protein turnover in the nuclear compartment.
Keywords: Lamin B receptor, nuclear lamina, inner nuclear membrane, ERAD, p97, ubiquitin, proteasome, nucleus
1. INTRODUCTION
Lamin B receptor (LBR) is a multifunctional integral membrane protein residing at the inner nuclear membrane (Olins, Rhodes, Welch, Zwerger, & Olins, 2010). The N-terminal portion of LBR associates with the nuclear lamina (Worman, Yuan, Blobel, & Georgatos, 1988; Q. Ye & Worman, 1994) and contains a Tudor-domain that interacts with heterochromatin (Makatsori et al., 2004; Pyrpasopoulou, Meier, Maison, Simos, & Georgatos, 1996). The polytopic C-terminal domain exhibits sterol C14 reductases activity that catalyzes a reduction step in the cholesterol biosynthesis pathway (Li, Roberti, & Blobel, 2015; Prakash, Sengupta, Aparna, & Kasbekar, 1999; Silve, Dupuy, Ferrara, & Loison, 1998)(for recent reviews, see (Kasbekar, 2018; Nikolakaki, Mylonis, & Giannakouros, 2017). Two human congenital diseases, Pelger-Huët anomaly and Greenberg skeletal dysplasia, are known to be associated with mutations in LBR, which cause pathologies ranging from hypolobulated granulocyte nuclei to embryonic lethality depending on the allelic state and nature of the specific mutation (Oosterwijk et al., 2003; Turner & Schlieker, 2016). So far, all LBR mutations implicated in these diseases have been mapped to its C-terminal domain, and we recently found that the disease-causing mutations indeed severely perturb the C14 sterol reductase activity embedded within LBR (Tsai et al., 2016).
Notably, two of these mutant LBR variants with C-terminal truncations, LBR1600* and LBR1402TΔ, are still targeted to the inner nuclear membrane (INM) but are then rapidly degraded via the ubiquitin-proteasome system in the nucleus, suggesting that their degradation is distinct from the canonical endoplasmic reticulum (ER)-associated degradation (ERAD) pathway (Tsai et al., 2016). The degradation of these truncated LBR variants is dependent on the proteasome and p97, an AAA+ (ATPases Associated with various cellular Activities) ATPase that is also responsible for dislocating misfolded proteins from the ER membrane (Y. Ye et al., 2001). In the presence of the proteasome inhibitor MG132, LBR1600* is stabilized and accumulates in the nucleoplasm. In contrast, a p97 dominant-negative mutant, p97QQ (Y. Ye et al., 2001), or the p97 inhibitor CB-5083 (Anderson et al., 2015) prevents LBR1600* from dislocating from the nuclear membrane (Fig. 1) (Tsai et al., 2016). These properties provide us with a useful toolkit to probe for activities involved in LBR1600 degradation via assessing the localization changes of LBR1600* upon depleting the components of the degradation pathway.
Fig. 1.
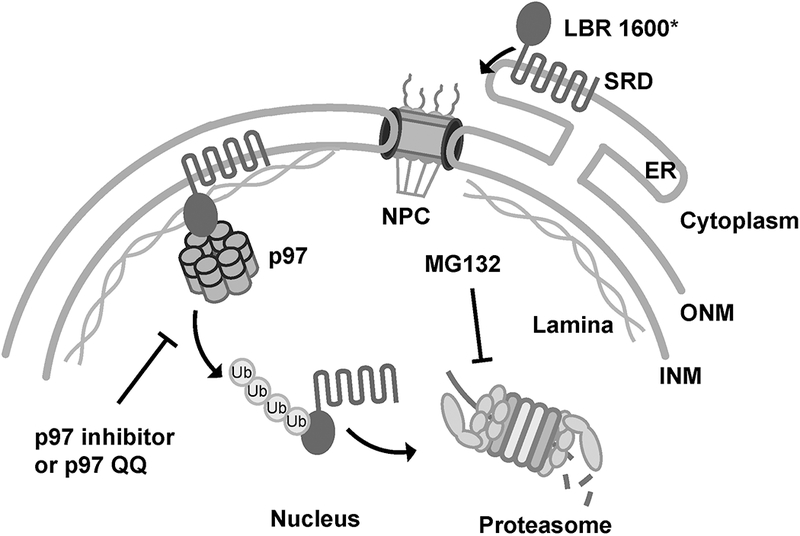
Proposed inner nuclear membrane protein turnover pathway in mammalian cells. LBR 1600* is a C-terminal truncated version of LBR, which is synthesized into the ER, diffuses throughout the ER membrane, and passes through the pore membrane, where it is retained at the INM via interaction with nuclear lamina through its N-terminal domain. The misfolded C-terminal sterol reductase domain leads to its poly-ubiquitylation by a yet-unknown ubiquitin ligase, followed by membrane dislocation/extraction, and ultimately to LBR1600* degradation via proteasome. Protein degradation at the NE can be blocked at the step of membrane dislocation or degradation via a dominant negative mutant p97QQ or a p97 inhibitor (CB-5083), or after dislocation by the proteasome inhibitor MG132. A small portion of LBR1600* might also be degraded by the canonical ER-associated degradation pathway before reaching the inner nuclear membrane. For clarity, several ERAD components are omitted in this diagram. INM: inner nuclear membrane, ONM: outer nuclear membrane, ER: endoplasmic reticulum, NPC: nuclear pore complex, SRD: sterol reductase domain.
Currently, the mechanisms responsible for protein homeostasis at the nuclear envelope of mammalian cells remain poorly understood (Rose & Schlieker, 2012; Shibata & Morimoto, 2014; Ungricht & Kutay, 2017; Webster & Lusk, 2016), and the absence of suitable model substrates in higher eukaryotes has been one of the major limitations towards identifying and characterizing NE-resident turnover machinery. Protein quality control mechanisms at the nuclear envelope have been identified in yeast (Deng & Hochstrasser, 2006; Foresti, Rodriguez-Vaello, Funaya, & Carvalho, 2014; Khmelinskii et al., 2014) (for a recent review, see Mehrtash & Hochstrasser, 2018); however, many of these components (e.g. the Asi ubiquitin ligase) do not have corresponding orthologs identified in human cells. Given that the truncated LBR variants have very short half-lives and the degradation can be arrested at either the membrane dislocation or degradation steps via dominant negative constructs or suitable small molecule inhibitors (Fig. 1), we now can utilize these LBR disease variants as model substrates for illuminating the mechanisms of protein quality control at the mammalian nuclear envelope.
In this chapter, we describe the use of a “split-GFP” system to tag the LBR 1600* model substrate, followed by immunofluorescence, pulse-chase analysis, flow cytometry, and biochemical fractionation of cell homogenates as tools to monitor INM protein turnover.
2. TAGGING STRATEGY FOR INNER NUCLEAR MEMBRANE PROTEINS
Inner nuclear membrane proteins are synthesized at the ER, diffuse through the ER membrane, pass through the pore membrane, and anchor at the INM via association with chromatin and nuclear lamina (Boni et al., 2015; Ungricht, Klann, Horvath, & Kutay, 2015; Ungricht & Kutay, 2015). Tagging inner nuclear membrane proteins can be challenging, since the fused fluorescent protein may cause protein misfolding or mislocalization, particularly when the size of the nuclear domain exceeds 60 kDa, which causes the protein to become incapable of diffusing through the peripheral cavity of the nuclear pore complex, resulting in ER retention (Boni et al., 2015; Ohba, Schirmer, Nishimoto, & Gerace, 2004; Ungricht et al., 2015). We previously demonstrated that truncated variants of LBR are degraded rapidly in the nucleus (Tsai et al., 2016). To study the turnover mechanism of LBR1600* without disrupting its localization and the turnover rate, we here employ the split-GFP system that has been intensely used in visualizing subcellular protein localization (Cabantous, Terwilliger, & Waldo, 2005; Feng et al., 2017; Kamiyama et al., 2016; Van Engelenburg & Palmer, 2010). In this system, GFP (green fluorescent protein) is split into two fragments composed of a small fragment of GFP, S11 (β-strand 11, amino acids 215-230) and a large fragment of GFP, GFP1-10 (β-strands 1-10, amino acids 1-214). Neither of these individual fragments exhibit fluorescence, but upon association, these fragments spontaneously mature into the active fluorescent protein (Cabantous et al., 2005).
The advantage of using the split-GFP system is that the small fragment of GFP is only 16 amino acids in length, which does not interfere with INM targeting of LBR1600* (Fig. 2A, B), in contrast to fusion with intact GFP, which results in ER retention (data not shown). The tagging strategy we used was to fuse the small fragment of GFP, S11, to LBR1600* and supply the cell line with the complementary fragment, GFP1-10 (Fig. 2A). LBR1600*-S11 has a rapid turnover rate (Fig. 2C) that faithfully mimics previously observed turnover kinetics of the naturally occurring disease allele (Tsai et al., 2016), resulting in a low GFP signal; however, if LBR1600*-S11 turnover is inhibited (e.g. by proteasomal inhibition via MG132, cf. Fig. 2C) more GFP molecules are assembled into active forms, leading to an increased signal intensity (Fig. 2A, E).
Fig. 2.
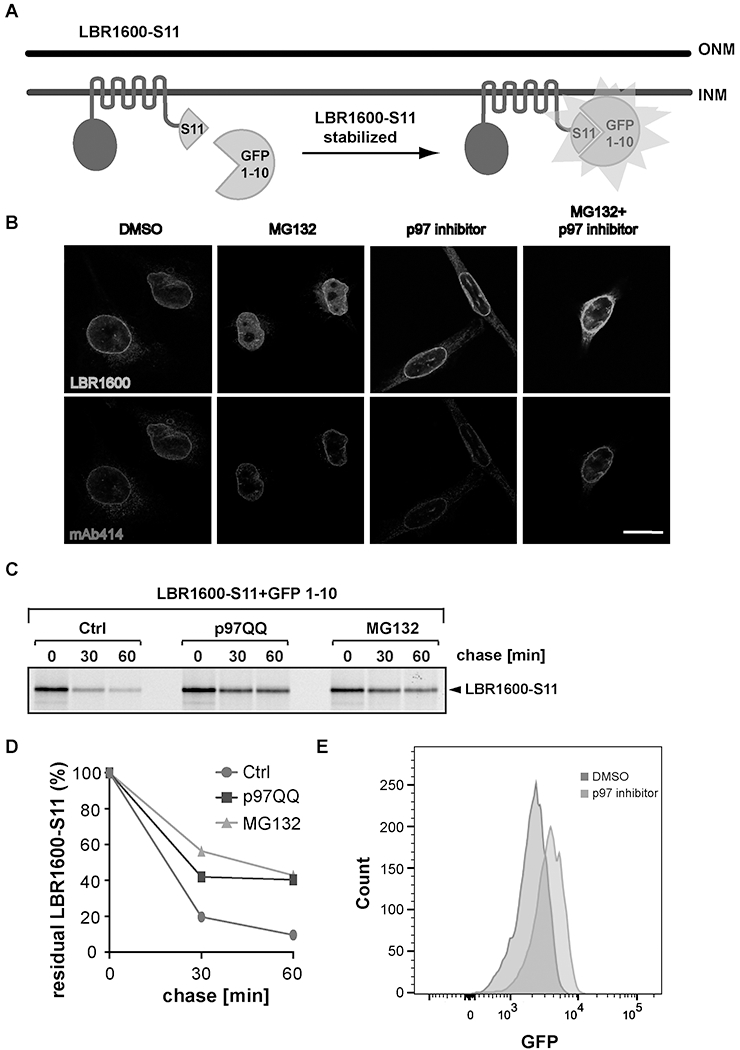
Imaging approaches to monitor INM/LBR1600* turnover. (A) A split-GFP system to monitor LBR1600* stability. LBR1600-S11 is comprised of LBR1600* and the C-terminal fragment S11 of GFP (amino acids 215-230). A stable LBR KO-derived cell line, termed LBR1600S11/GFP1-10, was engineered to uniformly express both LBR1600-S11 and the large GFP fragment GFP1-10 (amino acids 1-214). (B) LBR1600S11/GFP1-10 cells were treated with DMSO, 10 μM MG132, or 10 μM p97 inhibitor individually, or a combination of 10 μM MG132 and 10 μM p97 inhibitor for 4h, stained with anti-LBR and Mb414 (recognizes several FG-nucleoporins and serves as NE marker), and imaged via confocal microscopy. Scale bar=20 μm. (C) Pulse-chase analysis of LBR1600S11/GFP1-10 cells transfected with empty vector or p97QQ, or treated with 10 μM MG132 during the chase period. (D) Densitometric quantification of the pulse chase experiment depicted in (C). (E) LBR1600S11/GFP1-10 cells were treated with DMSO or 10 μM p97 inhibitor for 4h and analyzed using flow cytometry. Note that a subpopulation of cells exhibits higher GFP signal upon p97 inhibition indicating the LBR1600*S11 was stabilized.
2.1. Construct Design and Stable Cell Line Generation
2.1.1. Cloning
To establish a cell line stably expressing the LBR1600*-S11 fusion and the complementary fragment of GFP, GFP1-10, we used a retroviral vector to carry gene expression constructs (Retro-X Tet-On advanced inducible expression system, Takara Bio). The sequence of the small fragment GFP S11 was fused to LBR1600* using PCR. The reverse primer was composed of an EcoRI site, a linker encoding the GDGGSGGGS peptide, and amino acids 215-230 of GFP (RDHMVLHEYVNAAGIT); the forward primer carried a BamHI site. The sequence of GFP1-10 (amino acids 1-214) was cloned from the pCMV-mGFP 1-10 plasmid (Sandia Biotech) by PCR with a forward primer containing a BamHI site and the SV40 nuclear localization sequence PKKKRKV together with a reverse primer carrying an EcoRI site. The resulting PCR products were then subcloned into the pRetroX-Tight-Pur-GOI vector (Takara Bio) after restriction enzyme digestion.
Notes:
The GFP S11 fragment can be fused to the N- or C-terminus of a protein. When tagging a new protein, one might need to try both ends and optimize the length of the linker sequence in order to maximize accessibility to GFP1-10. In some cases, protein folding or aggregation might cause the inaccessibility of the S11 tag, preventing GFP complementation. Also, GFP S11 appended to a protein terminus that lies in the ER-lumen will be inaccessible to GFP1-10 unless the protein is retrotranslocated into the cytosol or nucleoplasm. In general, we found it to be critical that LBR1600* derivatives are expressed at low to moderate levels since transient transfections with high-expression CMV-based promoters can overburden the INM-resident turnover machinery or lead to an undesired accumulation of the fusion protein at the ER. Therefore, the generation of stable cell lines is generally recommended. In any case, it is critical to confirm the authentic NE-localization of the fusion construct via microscopy (cf. 2.2).
2.1.2. Virus Transduction and Single Cell selection
The detailed procedures of retrovirus production were performed using the Retro-X Tet-On system (Takara Bio) following the manufacturer’s instructions. This system establishes a stable cell line in which target gene expression is regulated by the presence of the antibiotic doxycycline. Below is a summary of the modified procedures.
2.1.2.1. Buffers and Reagents
Growth medium: Dulbecco’s Modified Eagle Medium (DMEM) +10% fetal bovine serum+ 100 units/mL penicillin and 100 μg/mL streptomycin (Thermo Fisher Scientific)
0.05% trypsin-EDTA (Thermo Fisher Scientific)
Phosphate buffered saline (PBS) (Thermo Fisher Scientific)
Puromycin dihydrochloride (MilliporeSigma)
Geneticin selective antibiotic (G418 sulfate) (Thermo Fisher Scientific)
2.1.2.2. Equipment
CO2 incubator (37°C, 5% CO2)
Class II Laminar Flow Hood designed for BSL-2 (SterilGARD, Baker or similar)
2.1.2.3. Procedure
Seed low-passage 293T cells in three 10-cm plates with a density of 3.5×10⁶ cells per plate the day before transfection.
-
On the next day, replace the medium with 6 mL fresh medium and transfect each plate with three plasmids encoding: MMLV gag/pol (2 μg), viral envelope protein VSV-G (1 μg), and either pRetroX-Tight-Pur-LBR1600*-S11 (6 μg), pRetroX-Tight-Pur-GFP1-10 (6 μg), or pRetroX-Tet-On (6 μg). Transfection reagent X-tremeGENE 9 (Roche) is used at a 3:1 ratio to DNA, 3 μL transfection reagent to 1 μg plasmid DNA.
Note: For producing retroviral particles, three plasmid components are required: (1) a packaging vector encoding MMLV proteins gag and pol. Gag is a polyprotein further processed into matrix and other viral core proteins. Pol is the reverse transcriptase. (2) an envelope vector specifying VSV-G. VSV-G mediated-viral entry via membrane fusion does not depend on proteinaceous cell surface receptors; therefore, VSVG-enveloped retroviruses can be used to transduce a broad range of cell types. (3) a transfer vector encoding the transgene of interest.
-
After 72 h, harvest supernatants containing the three respective retroviruses carrying genes encoding LBR1600*-S11, GFP1-10, and a mutant Tet repressor. Filter each through a 0.45 μm filter unit, aliquot into screw-cap tubes, and store at −80°C. These cryostocks are stable for at least 12 months.
Note: Ideally, use a multiplicity of infection (MOI) between 0.5 and 1 for retroviral transduction. Retrovirus titers can be determined using commercial qRT-PCR kits (Takara Bio or similar) or colony formation; however, it takes 7-14 days for colony formation to work. An alternative and faster way to achieve adequate ratios of virus per host cell is to add a serial dilution of viral solution by adding 50-200 μL into a 6-well plate with a cell density of 2×10⁵ cells/well (adjust the volume for all wells to 2 ml with growth medium). Forty-eight hours post transduction, apply 0.75 μg/mL puromycin, incubate for 48 h, and observe the cell death of each well under a light microscope. If there is no observable cell death in a well, this indicates that each cell is infected with at least one or multiple viruses. It is important to include a negative control where no virus is added, which should result in near-complete cell death. For low copy insertions, use at most the smallest virus volume necessary to achieve complete survival, or the next lowest dilution of the series.
Seed the targeted cells (e.g. HeLa) in a 6-well plate at a density of 2×10⁵ per well one day before transduction.
On the next day, replace the medium with 2 mL fresh medium supplemented with 4 μg/mL of the cationic polymer polybrene, which is used to neutralize the electrostatic repulsion between the virus and the cell surface (Davis, Rosinski, Morgan, & Yarmush, 2004). Add 100 μL of each retrovirus solution made in step 3 into the same well, shake the plate gently and incubate for 48 h.
Aspirate the medium, wash the cells with PBS once, add 0.5 mL of 0.05% trypsin-EDTA to cover the cells, incubate at 37°C for 5 min, and then monitor the cells under a microscope to ensure that cells are rounded up and detached. Add 1 mL of growth medium that includes 10% fetal bovine serum to neutralize the trypsin, pipet the solution 5 times and transfer them into a 10-cm plate with the medium supplemented with 0.75 μg/mL puromycin and 800 μg/mL G418 for selecting cells expressing the gene of interest and the Tet repressor. Incubate for 3 days.
Trypsinize the cells as described in step 6 and seed them into several 10-cm plates at very low densities, such as 25, 50, 100, and 200 cells/plate. Supplement the medium with 800 μg/mL G418. Replace the medium every 3 days until the single cell-derived colonies form. This usually takes ~10 days. Puromycin usually takes 3-4 days to kill all non-transduced cells, and G418 takes roughly 10-14 days.
Mark the colony position at the bottom of the plate with a marker pen and prepare a 96-well plate filled with 20 μL of 0.05% trypsin-EDTA in each well.
Gently wash the cells in the plate with 5 mL PBS twice to remove unattached cells and overlay the plate with 2 mL PBS. Set a P20 pipette to 6 μL and directly pick up the target colony with the pipette tip and pipet into a well of the 96-well plate. Mark the well having cells with marker pen and repeat the steps until ~20 colonies are picked up. After a 5-min incubation, add 80 μL of growth medium into each well to neutralize the trypsin and wait for 3 days.
When the cells are confluent, trypsinize the cells with 30 μL of 0.05% trypsin-EDTA, neutralize them with 70 μL of growth medium, and transfer 30% of cells from each well into a well of 24-well plate that includes a coverslip and 0.5 mL growth medium supplemented with 0.5 μg/mL doxycycline to induce gene expression.
Transfer the remaining cells of each well into a duplicate 24 well plate for passaging.
After 24 h doxycycline induction, treat cells with either vehicle (DMSO) or 10 μM MG132. After 4 h, fix cells with 4% paraformaldehyde, mount, and image GFP using a fluorescence microscope. Colonies with enhanced GFP can be propagated from the duplicate plate and used for future experiments.
Notes:
The retrovirus using VSV-G as an envelope protein can infect human cells. This handling therefore requires a BioSafety Level 2 facility (BSL2); researchers need to acquire proper training and equipment before starting these experiments.
Different cell types require different concentrations of antibiotics and durations for selection. Therefore, the optimal concentration of puromycin and G418 need to be titrated before step 6. A serial dilution of puromycin ranging from 0.5-2 μg/mL and G418 ranging from 200-800 μg/mL can be applied to non-transduced cells, respectively. The minimum concentration capable of killing all cells in 3 days (puromycin) and 10 days (G418) were selected for use. Avoid applying very high concentrations of antibiotics for selection, which will select only the cells with high copy number integration.
An alternative way to select the cells with proper GFP signal intensity is using flow cytometry to directly sort out the single cells into a 96-well plate. For weakly adherent cells (e.g. 293T), washing cells with PBS might disturb the colonies; single cell sorting might be a better option for this type of cell line.
It is recommended to prepare permanent cryostocks of stable cell lines as soon as the functionality of the transgene is established as judged by NE localization (cf. 2.2, Fig. 2B) and pulse-chase analysis (cf. 2.3, Fig. 2C, D).
2.2. Immunofluorescence Analysis of Tagged Inner Nuclear Membrane Proteins
Immunofluorescence analysis is a very straightforward way to examine protein localization and to assess expression levels to ensure the validity of the generated cell lines for future experimentation. More importantly, we can exploit this technique in conjunction with transfections of dominant negative alleles or pharmacological inhibitors to evaluate individual steps of protein turnover at the NE and nucleoplasm. For example, in the presence of the proteasome inhibitor MG132, the degradation intermediate of LBR1600* accumulates in the nucleoplasm after its dislocation from the INM (Tsai et al., 2016)(Fig. 2B). This characteristic provides a useful tool to probe the protein turnover pathways at the nucleus via examining the localization changes of LBR1600* in the presence of MG132 upon depletion or inhibition of other components of the turnover pathway. This “epistasis strategy” also allows the experimentalist to place a newly identified component involved in INM turnover at a specific point in the pathway. For example, both the p97 inhibitor CB-5083 and a dominant negative p97 variant (delivered by transfection) inhibit INM turnover but also result in a blockage of the membrane dislocation step as judged by the lack of nucleoplasmic accumulation in the presence of MG132 and the concomitant accumulation of the model substrate at the INM. This allowed us assign p97 to a role in dislocating LBR1600* from the INM prior to proteasomal turnover (Tsai et al., 2016)(Fig. 1, Fig. 2B). On the other hand, any newly identified component acting downstream of the INM dislocation step would be predicted to lead to a nucleoplasmic accumulation even in the absence of MG132, but without a buildup of the model substrate at the INM.
2.2.1. Buffers and Reagents
MG132 (MilliporeSigma)
p97 inhibitor (CB-5083) (Selleckchem)
Primary antibodies: anti-LBR (ab32535, Abcam); anti-Nuclear pore complex proteins (mAb414) (ab24609, Abcam)
Alexa Fluor secondary antibodies (Thermo Fisher Scientific)
Fluoromount-G (Thermo Fisher Scientific)
Phosphate Buffered Saline (PBS)
Blocking solution: 5 mg/mL bovine serum albumin in PBS (MilliporeSigma)
Hoechst 33342 (Thermo Fisher Scientific): 2.5 μg/mL in PBS
Triton X-100 (MilliporeSigma)
16% paraformaldehyde (Electron Microscopy Sciences)
2.2.2. Equipment
Confocal microscope (Zeiss or similar)
2.2.3. Procedure
To assess if tagging with GFP S11 alters the localization of LBR1600*, place 12-mm round coverslips into a 12-well plate, seed 6×10⁴ cells in each well and leave the cells to adhere on coverslips overnight. On the next day, treat cells with DMSO, 10 μM MG132, 10 μM p97 inhibitor or MG132 plus p97 inhibitor for 4 h.
Fix the cells with 4% paraformaldehyde in PBS at room temperature for 15 min and wash with PBS three times. Note that the wash here means adding the PBS into the well, aspirating it, and repeating this. The washing requires no incubation time.
Permeabilize the cells with 0.2% Triton X-100 at room temperature for 5 min, and wash with PBS three times.
Create a humidified chamber by placing a wet filter paper in a 15 cm dish and put a piece of parafilm on top of the wet filter paper. Pipet 15 μL of BSA blocking solution for each coverslip on the parafilm and invert the coverslips bearing the fixed cells onto the drops of blocking solution. Incubate for 10 min. Note that the amount 15 μL is for a 12-mm round coverslip. If larger coverslips are used, the amount of reagent should be scaled up accordingly.
Pipet 15 μL of primary antibodies prepared in blocking solution onto the parafilm. Blot the edge of coverslips against kimwipes to remove excess solution and invert the coverslip onto the drop of primary antibodies. Incubate for 1 h at room temperature.
Dip the coverslips sequentially through three beakers filled with 150 mL PBS for a quick rinse and blot the edge of coverslips on kimwipes to remove buffer.
Pipet 15 μL of secondary antibodies prepared in blocking solution to the parafilm. Invert the washed coverslips onto the drop of Alexa-Fluor conjugated secondary antibody and incubate for 1 h in the dark or cover the dish with aluminum foil.
Repeat the washing described in step 6, and invert the coverslip onto a drop of Hoechst to stain DNA, incubate for 5 min in the dark.
Repeat the washing as in step 6.
Pipet 15 μL of Fluoromount-G on a microscope slide, and invert the coverslip from step 9 onto the drop of mounting media.
Absorb excess mounting media with filter paper and leave it to dry in the dark. After the slide is dry, seal the coverslip edges with clear nail polish.
Notes:
Alexa-Fluor and Hoechst dye are light sensitive and slides should therefore be stored in the dark.
Tagging the small GFP fragment S11 to LBR-1600* does not alter its distribution. Note that the LBR1600*-S11 shows accumulation in nucleoplasm upon proteasome inhibition (Fig. 2B), which is similar to the untagged LBR1600* described in our previous study (Tsai et al., 2016).
An improved splitGFP system with lower background fluorescence was recently reported (Feng et al., 2017) and can likely be engineered analogously for live cell imaging applications. N-terminal tagging of LBR1600* with commonly used epitope tags is sufficient for microscopy using fixed samples (cf. Fig. 2B) and biochemical analysis (sections 2.3 and 3). The use of a hemagglutinin (HA) tag is recommended, since the Flag tag slightly alters the LBR1600* localization, which might be attributable to charge repulsion between DNA and the negative net charge of the Flag tag.
2.3. Pulse-Chase Experiment for Protein Turnover Analysis
This protocol relies on pulse-chase labeling using metabolic labeling with 35S-Cys/Met and is adapted from previously described methods (Ernst, Mueller, Ploegh, & Schlieker, 2009). Together with SDS-PAGE and autoradiography, this method allows for the direct measurement of protein stability in a cellular setting. For laboratories not authorized for the use of radioactivity, cycloheximide-chase assays and immunoblotting are an alternative (cf. Hwang et al., 2017).
2.3.1. Buffers and Reagents
Starvation medium (100 mL Eagle’s medium (D0422, Sigma), 1 mL 100× Penicillin/Streptomycin (10,000 units/mL penicillin and 10,000 μg/mL streptomycin, 1 mL 100× L-glutamine (200 mM), 10 mL dialyzed FBS)
35S protein labeling mix (NEG072007MC, Perkin Elmer)
Recovery medium (3 mL normal cell culture medium with 30 μL of 100× L-Cys and L-Met (50 mM L-Cys and 250 mM L-Met)
Standard SDS-PAGE equipment
Benzonase (MilliporeSigma)
NET buffer (50 mM Tris-HCl, pH 7.5, 75 mM NaCl, 5 mM MgCl2, and 0.5% Nonidet P-40)
Dimethyl sulfoxide (DMSO)
5%(wt/vol) PPO (2,5-diphenyloxazole from MilliporeSigma) in DMSO
Trichloroacetic acid (TCA)
2.3.2. Equipment
Thermomixer (Eppendorf)
Benchtop centrifuge (Eppendorf)
SDS-PAGE equipment (Dan-Kar or similar)
Power supply (Bio-Rad)
Gel dryer (Bio-Rad)
Stainless steel trays
Large film cassettes (Thermo Fisher Scientific)
Storm 860 Molecular Imager (GE Healthcare) or similar
Imaging plates (Fujifilm)
Carestream Kodak BioMax MR film (35 cm × 43 cm, MilliporeSigma)
2.3.3. Procedure
Seed HeLa cells in 10-cm plates at a density of 1.2×10⁶ per plate the day before transfection.
On the next day, transfect the cells with plasmids encoding the gene of interest. Incubate overnight.
Trypsinize the cells, transfer them into 50-mL Falcon tubes, and spin at 800 × g for 3 min.
Resuspend cells in 10 mL starvation medium and centrifuge at 800 × g for 3 min.
Resuspend cells in 3 mL starvation medium and incubate at 37°C for 30 min. Gently swirl the tube every 5-10 min to keep the cells from settling.
Meanwhile, thaw 35S protein-labeling mix in a fume hood, label 2 mL-tubes for all samples and time-points, add 0.5 mL ice-cold PBS to each tube, and prepare recovery medium.
Spin down cells at 800 × g for 3 min and resuspend cells with 300 μL starvation medium.
Add 30 μL of 35S protein-labeling mix to the cells in the fume hood using filter tips, and incubate cells on a programmed Thermo-mixer (pulse shake (1-min off/4-sec on) at 500 rpm) for 10 min.
Stop labeling reaction by addition of 3 mL of recovery medium to each tube.
Transfer 900 μL cell suspension to a 2 mL-tube with 500 μL ice-cold PBS and spin down cells at 800 × g for 3 min at 4°C.
Wash cells with 1 mL cold PBS, spin down cells at 800 × g for 3 min at 4°C, aspirate PBS, and freeze the cell pellets at −80°C (time-point 0 h).
Take aliquots after 0.5 h and 1 h, repeat the PBS wash described in step 11 when harvesting each aliquot, and store them at −80°C.
After all time points are collected, add 100 μL of 1% SDS/PBS to cell pellets and vortex tubes vigorously 5 times with a quick pulse for 5 second each time; incubate samples at 50 °C for 15 min.
Cool down samples to room temperature, briefly spin the tubes at 10,000 × g for 30 seconds to collect droplets on tube walls and add 4 μL of diluted benzonase (2 μL benzonase stock (500U) in 50 μL PBS) into each tube. Vortex tubes and incubate at room temperature for 20 min to eliminate DNA.
Inactivate benzonase by putting samples at 100°C for 2-3 min, briefly spin down the lysate, add 1 mL of NET buffer to tubes, vortex, and centrifuge at 16,000 × g at 4°C for 10 min.
-
Determine counts per minute [cpm] of the zero time point (t = 0) of each time series. Note: since later samples of each time series will be standardized relative to the zero time point (t = 0) of the corresponding series, this step 16 only needs to be performed on the t = 0 samples.
Using a pencil, mark out a long piece of Whatman paper with enough 1.5 cm × 1.5 cm squares to accommodate as many time-zero timepoints as present. Only the time-zero timepoint of each set is measured. Spot 10 μL of each t = 0 lysate to the center of each square and leave it to air dry in the fume hood for 10 min.
Immerse the paper in 5% TCA in a plastic container big enough to accommodate the whole piece of the Whatman paper for 10 min.
Immerse the paper in 100% ethanol for 1 min.
Immerse the paper in acetone for 1 min and let it dry in the fume hood for 10 min.
Cut out each square with a scissor and place it onto the bottom of a scintillation vial.
Add 5 mL scintillation solution and count the radioactivity (1-3 million counts per minute (cpm) would be a typical range)
Standardize the volume of t = 0 samples to the one with lowest cpm by taking the necessary volume to give equal cpm for all samples. Continue to use the same volume for other time points of each series. Example: if there are two sets of samples A and B, each of them includes three time points (0 h, 0.5 h, and 1h). Measure cpm of t = 0 samples in both A and B as described above. If t = 0 of A has a reading of 2 million cpm and B has a reading of 2.5 million cpm, transfer 900 μL of A into a new 1.5 ml tube. The residual volume (~ 100 μL or more) will be disposed along with the old tube to avoid transfer of the pellet material into the immunoprecipitation step, which would increase the background. Once the volume of all t = 0 samples is determined, we take the same volume for other time points in the same set. In this example case, we tranfer 900 μL lysates from each time point in series A to a new tube and transfer 720 μL from each sample in the B series to a new tube, respectively. Adjust all volumes to 1 mL with NET buffer/0.1% SDS.
Pre-clear lysates of proteins that bind directly to protein A by incubating each tube with 30 μL protein-A beads (equilibrated with NET buffer/0.1% SDS). Rock at 4°C for 1 h and then sediment the beads by centrifugation at 2,400 × g for 1 min.
Transfer 950 μL supernatant to a new tube and start immunoprecipitation with specific antibody at the desired dilution and 30 μL Protein-A beads.
After 3 h or overnight incubation, wash beads with 1.3 mL NET buffer/0.1% SDS three times.
Aspirate the buffer with a fine needle after last wash, add 65 μL of 1× SDS sample buffer, and incubate at 65°C for 5 min. Spin for 1 min and load the supernatant onto an SDS-PAGE gel.
2.3.4. SDS-PAGE and autoradiography
The detailed protocol for gel development and fluorography was previously described (Ploegh, 2001).
Run an SDS-PAGE gel (32 cm × 25 cm × 1 mm, L × W × T) overnight at 70 – 90 V in 1 × Laemmli Resolving Gel Buffer.
Carefully transfer gel into a stainless steel tray containing DMSO and incubate for at least 30 min with gentle shaking.
Change to refresh DMSO and shake for another 30 min.
Change to 5% (w/v) PPO in DMSO and shake for 1 h
Wash the gel four times with water for 3 min each time.
Transfer the gel carefully onto filter paper in a gel dryer and dry the gel at 80°C for 2 h.
Transfer the dried gel into a large film cassette and develop with a film at − 80°C or an imaging plate at room temperature.
Notes:
A typical pulse-chase result is provided in Figs. 2C and D. In the presence of p97QQ or MG132 inhibitor, LBR1600*-S11 was stabilized as expected. Notice that tagging S11 to LBR1600* and expressing GFP1-10 in the system do not interfere with the turnover of LBR1600* as evidenced by the half-life of LBR1600*-S11 (about 10-15 min), which is very similar to the naturally occurring disease allele (LBR1600*) determined previously using anti-LBR antibodies. (Tsai et al., 2016).
The spilt-GFP system can also be monitored by FACS analysis (Fig. 2E), which can be exploited to seed cells in single cell format to generate clonal cell lines. Moreover, FACS separation can be applied as a readout in the context of genetic screens (cf.(Timms et al., 2016)).
The PPO step can be omitted if gels are not imaged using photographic films (e.g. by using imaging plates).
3. FRACTIONATION OF NUCLEI INTO NUCLEAR ENVELOPE AND NUCLEOPLASM
This protocol was developed to rapidly separate nucleoplasm from the NE membrane fraction to establish a biochemical readout for the generation of a dislocated or “soluble” LBR1600* degradation intermediate previously observed by light microscopy (Tsai et al., 2016) (cf. Fig. 2B, second panel). This procedure is loosely based on a method introduced in (Emig, Schmalz, Shakibaei, & Buchner, 1995) with several modifications to increase the speed of the fractionation procedure and to avoid the use of an ultracentrifuge. In brief, cells are homogenized by repeated passing through a needle and subjected to a low-speed centrifugation over a sucrose cushion to pellet the nuclei. Isolated nuclei are then subjected to heparin/nuclease treatment and centrifugation, which results in the release of nucleoplasm into the supernatant (Fig. 3A).
Fig. 3.
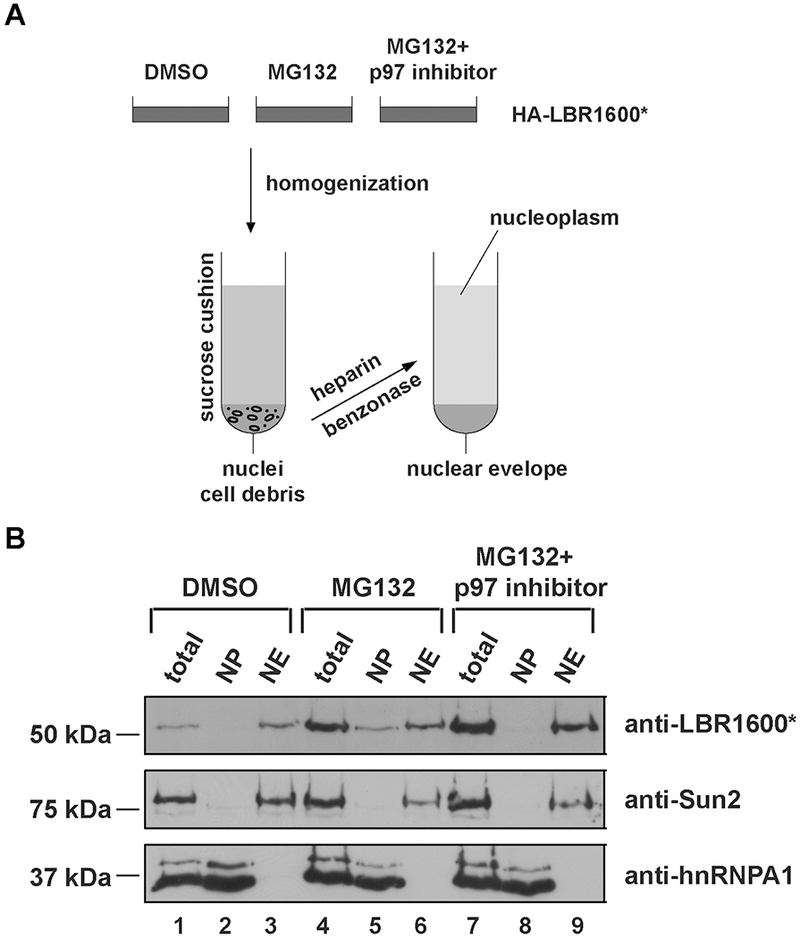
Flow chart describing the isolation and the fractionation of nuclei into nuclear envelope and nucleoplasm. (A) A stable cell line expressing HA-LBR1600* was treated either with DMSO, 10 μM MG132, or 10 μM p97 inhibitor plus MG132 for 4h, and homogenized by passing through a 25G needle. The homogenates were sedimented through a low-speed sucrose cushion, and the resulting pellets were resuspended in buffer including heparin and benzonase. After the final centrifugation, the supernatant contains nucleoplasm, and the resulting pellet is the nuclear envelope fraction. (B) Five percent of each fraction in each condition was subjected to SDS-PAGE and immunoblotted with anti-LBR, and the indicated control antibodies to assess the quality of the fractionation. We used anti-Sun2 as a marker for the nuclear envelope fraction, and anti-hnRNPA1 as the marker for nucleoplasm. Total: 5% of cells saved for loading control before fractionation, NP: nucleoplasm, NE: nuclear envelope.
3.1. Buffers and Reagents
Phosphate Buffered Saline (PBS)
Buffer A (10 mM HEPES, pH 7.4, 250 mM sucrose, 2 mM MgCl2) supplemented with 1 mM phenylmethanesulfonyl fluoride (PMSF).
STM 0.9 (Sucrose-Tris-Magnesium) buffer: (50 mM Tris-HCl, pH 7.4, 0.9 M sucrose, 5 mM MgCl2) supplemented with 1 mM PMSF.
TP buffer: (10 mM Tris-HCl, pH 8.0, 10 mM Na2HPO4, 2 mM MgCl2) supplemented with heparin (24 mg/12 mL buffer), benzonase nuclease (1 μL/ 0.5 mL buffer), 1 mM PMSF, and 1× protease inhibitor cocktail without EDTA (Roche).
hnRNP A1 antibody (ab5832, Abcam), Sun2 antibody (06-1038, MilliporeSigma)
Benzonase (MilliporeSigma)
10 mM MG132 (1000×) (MilliporeSigma)
10 mM p97 inhibitor CB-5083 (1000×) (Selleckchem)
Notes:
PMSF is not stable in aqueous solution; make a fresh 100 mM stock in ethanol, and dilute 100-fold into buffer A immediately prior the experiment begins.
Protease inhibitor cocktail can be dissolved in 1 mL water (50×) and diluted into TP buffer before starting the experiment.
3.2. Equipment
Benchtop centrifuge (Sorvall Legend X1R, Thermo Fisher Scientific or similar)
Microcentrifuge (Eppendorf or similar)
Standard SDS-PAGE equipment (Bio-Rad or similar)
3.3. Procedure
Treat three 10 cm-plates of HeLa cells (6×10⁶ cells/plate) with 10 μL DMSO, 10 μM MG132, or 10 μM of both p97 inhibitor and MG132 in 10 mL growth medium. Incubate for 4 h at a cell culture incubator.
Trypsinize the cells, transfer cells into 15 mL tubes, and spin at 500 × g for 5 min at 4°C.
Resuspend the cells with 5 mL cold PBS, and set 250 μL cells from each sample aside as input loading controls. Lyse the input fractions with SDS-PAGE loading buffer, incubate at 65°C for 5 min, and store at −20°C.
Spin down the remaining cells at 500 × g for 5 min at 4°C.
Resuspend the three pellets in 5 mL of buffer A and spin at 500 × g for 5 min at 4°C.
Discard the supernatants and resuspend the pellets in 100 μL of buffer A. Incubate on ice for 10 min. Prepare three 15 mL tubes filled with 10 mL of chilled STM 0.9 buffer on ice.
Homogenize the cells via passing through a 1 mL syringe with a 25-gauge needle 10 times and gentle layer each homogenate directly onto the top of the STM 0.9 buffer in the 15-mL tubes. Centrifuge the tubes at 1000 × g for 10 min at 4°C.
Remove 9 mL supernatant from each tube and repeat the centrifugation as in step 7. After this step, a solid white pellet should be observed at the bottom of the tube.
Aspirate the supernatants and wash the pellets with 0.5 mL of TP buffer without supplements. Spin at 1000 × g for 10 min at 4°C and remove the supernatants.
Resuspend the pellets in another 0.5 mL of TP buffer with all supplements (heparin, benzonase, and protease inhibitors), and rock at 4°C for 2.5 h.
Centrifuge at 15,000 × g for 45 min at 4°C. The supernatant is the nucleoplasmic fraction. Transfer the supernatants into fresh 1.5-mL tubes. Remove a 50 μL aliquot from each for SDS-PAGE analysis; these are then mixed with an equal volume of 2× SDS-PAGE sample buffer, heat the samples at 65°C for 5 min, and store at −20°C.
Wash the pellet with 0.5 mL of TP buffer, spin at 15,000 × g for 10 min at 4°C, and lyse the final pellets with 50 μL SDS-PAGE sample buffer and heat at 65°C for 5 min. Pellets include membrane fractions enriched for NE and ER membranes. Note that additional steps (see (Emig et al., 1995)) would be required to achieve a more homogenous preparation of NEs if experiments require high purity of nuclear membranes; however, these are not necessary to monitor the membrane extraction step of LBR1600*.
Resolve five percent of each fraction by SDS-PAGE and immunoblot with antibodies against LBR and the markers.
Notes:
The input cell number can be scaled up if immunoprecipitation will be performed after the fractionation. The buffer volumes in the procedure should be proportional to the input cell number to ensure that there is enough buffer to extract the nucleoplasm. In some cases, if there is not enough TP buffer or incubation time, the last membrane fraction will contain intact nuclei, evident by the viscous solution caused by DNA release when the final pellets were lysed. This has to be avoided since a failure to separate membranes from nucleoplasm can lead to invalid conclusions. It is therefore critical to use appropriate markers (cf. Fig. 3B) to control for the identity of the fractions. To assess the quality of the fractionation, hnRNPA1 and Sun2 are recommended as markers. hnRNPA1 is one of the most abundant nuclear proteins, localizes at the nucleoplasm, binds to mRNA, and is shuttled between the nucleus and cytoplasm (Purice & Taylor, 2018). Sun2 is an inner nuclear membrane protein (Lee & Burke, 2018) and serves as a marker of the insoluble membrane fraction. A typical result is provided in Fig. 3B, where Sun2 was only present in the membrane fractions and hnRNPA1 was only present in nucleoplasm fractions, indicating the fractionation was successful. In accordance with our previous study and microscopy data (cf. Fig. 2B and (Tsai et al., 2016)), LBR 1600* appears to be dislocated from the nuclear envelope and degraded in the nucleoplasm. The LBR 1600* turnover can be inhibited at the steps of membrane dislocation or degradation using p97 inhibitor or proteasome inhibitor MG132, respectively. In the presence of MG132, a portion of LBR 1600* is observed in the soluble nucleoplasmic fraction, and it is barely detected in the DMSO treatment (cf. Fig 3B, lane 5 and lane 2); however, in the presence of p97 inhibitor, LBR 1600* was stabilized and trapped at the membrane fraction as expected (cf. Fig. 3B, lane 5 and lane 8; Fig. 2B, last panel).
4. CONCLUDING REMARKS
Dysfunctions of INM proteins give rise to many human diseases also known as nuclear envelopathies (Dauer & Worman, 2009). While the involvement of protein quality control systems in pathologies is firmly established (Labbadia & Morimoto, 2015), much remains to be learned about the protein quality control mechanisms at the inner nuclear membrane. The set of methods described here establishes both model substrates and readouts for measuring protein turnover in the NE. The split-GFP approach (Section 2) provides a widely applicable platform for large-scale experimental approaches to studying NE quality control; for example, it should allow the identification of novel INM turnover machinery through forward genetic screens (Timms et al., 2016). The biochemical fractionation described in Section 3, in conjunction with suitable inhibitors or dominant-negative alleles, will facilitate the identification of LBR1600*-associated proteins, and can be employed in proteomics-based approaches analogous to studies that successfully uncovered mammalian ERAD components (Christianson et al., 2011; Ernst et al., 2011).
In principle, our experimental platform can be successfully adapted for many other INM-resident proteins. However, it should be noted that some optimization might be required to achieve appropriate expression levels and that engineering of fusion constructs entails the testing of, for example, various linker sequences or lengths to achieve authentic localization to the INM.
ACKNOWLEDGMENTS
We thank members of Schlieker laboratory for comments on the manuscript. This work was supported by NIH grants R01GM114401 and R01GM126835 to C.S.
REFERENCES
- Anderson DJ, Le Moigne R, Djakovic S, Kumar B, Rice J, Wong S, … Rolfe M (2015). Targeting the AAA ATPase p97 as an Approach to Treat Cancer through Disruption of Protein Homeostasis. Cancer Cell, 28(5), 653–665. doi: 10.1016/j.ccell.2015.10.002 [DOI] [PMC free article] [PubMed] [Google Scholar]
- Boni A, Politi AZ, Strnad P, Xiang W, Hossain MJ, & Ellenberg J (2015). Live imaging and modeling of inner nuclear membrane targeting reveals its molecular requirements in mammalian cells. J Cell Biol, 209(5), 705–720. doi: 10.1083/jcb.201409133 [DOI] [PMC free article] [PubMed] [Google Scholar]
- Cabantous S, Terwilliger TC, & Waldo GS (2005). Protein tagging and detection with engineered self-assembling fragments of green fluorescent protein. Nat Biotechnol, 23(1), 102–107. doi: 10.1038/nbt1044 [DOI] [PubMed] [Google Scholar]
- Christianson JC, Olzmann JA, Shaler TA, Sowa ME, Bennett EJ, Richter CM, … Kopito RR (2011). Defining human ERAD networks through an integrative mapping strategy. Nat Cell Biol, 14(1), 93–105. doi: 10.1038/ncb2383 [DOI] [PMC free article] [PubMed] [Google Scholar]
- Dauer WT, & Worman HJ (2009). The nuclear envelope as a signaling node in development and disease. Dev Cell, 17(5), 626–638. doi: 10.1016/j.devcel.2009.10.016 [DOI] [PubMed] [Google Scholar]
- Davis HE, Rosinski M, Morgan JR, & Yarmush ML (2004). Charged polymers modulate retrovirus transduction via membrane charge neutralization and virus aggregation. Biophys J, 86(2), 1234–1242. doi: 10.1016/S0006-3495(04)74197-1 [DOI] [PMC free article] [PubMed] [Google Scholar]
- Deng M, & Hochstrasser M (2006). Spatially regulated ubiquitin ligation by an ER/nuclear membrane ligase. Nature, 443(7113), 827–831. doi: 10.1038/nature05170 [DOI] [PubMed] [Google Scholar]
- Emig S, Schmalz D, Shakibaei M, & Buchner K (1995). The nuclear pore complex protein p62 is one of several sialic acid-containing proteins of the nuclear envelope. J Biol Chem, 270(23), 13787–13793. [DOI] [PubMed] [Google Scholar]
- Ernst R, Claessen JH, Mueller B, Sanyal S, Spooner E, van der Veen AG, … Ploegh HL (2011). Enzymatic blockade of the ubiquitin-proteasome pathway. PLoS Biol, 8(3), e1000605. doi: 10.1371/journal.pbio.1000605 [DOI] [PMC free article] [PubMed] [Google Scholar]
- Ernst R, Mueller B, Ploegh HL, & Schlieker C (2009). The otubain YOD1 is a deubiquitinating enzyme that associates with p97 to facilitate protein dislocation from the ER. Mol Cell, 36(1), 28–38. doi: 10.1016/j.molcel.2009.09.016 [DOI] [PMC free article] [PubMed] [Google Scholar]
- Feng S, Sekine S, Pessino V, Li H, Leonetti MD, & Huang B (2017). Improved split fluorescent proteins for endogenous protein labeling. Nat Commun, 8(1), 370. doi: 10.1038/s41467-017-00494-8 [DOI] [PMC free article] [PubMed] [Google Scholar]
- Foresti O, Rodriguez-Vaello V, Funaya C, & Carvalho P (2014). Quality control of inner nuclear membrane proteins by the Asi complex. Science, 346(6210), 751–755. doi: 10.1126/science.1255638 [DOI] [PubMed] [Google Scholar]
- Hwang J, Walczak CP, Shaler TA, Olzmann JA, Zhang L, Elias JE, & Kopito RR (2017). Characterization of protein complexes of the endoplasmic reticulum-associated degradation E3 ubiquitin ligase Hrd1. J Biol Chem, 292(22), 9104–9116. doi: 10.1074/jbc.M117.785055 [DOI] [PMC free article] [PubMed] [Google Scholar]
- Kamiyama D, Sekine S, Barsi-Rhyne B, Hu J, Chen B, Gilbert LA, … Huang B (2016). Versatile protein tagging in cells with split fluorescent protein. Nat Commun, 7, 11046. doi: 10.1038/ncomms11046 [DOI] [PMC free article] [PubMed] [Google Scholar]
- Kasbekar DP (2018). A cross-eyed geneticist’s view I. Making sense of the lamin B receptor, a chimeric protein. J Biosci, 43(2), 235–237. [PubMed] [Google Scholar]
- Khmelinskii A, Blaszczak E, Pantazopoulou M, Fischer B, Omnus DJ, Le Dez G, … Knop M (2014). Protein quality control at the inner nuclear membrane. Nature, 516(7531), 410–413. doi: 10.1038/nature14096 [DOI] [PMC free article] [PubMed] [Google Scholar]
- Labbadia J, & Morimoto RI (2015). The biology of proteostasis in aging and disease. Annu Rev Biochem, 84, 435–464. doi: 10.1146/annurev-biochem-060614-033955 [DOI] [PMC free article] [PubMed] [Google Scholar]
- Lee YL, & Burke B (2018). LINC complexes and nuclear positioning. Semin Cell Dev Biol, 82, 67–76. doi: 10.1016/j.semcdb.2017.11.008 [DOI] [PubMed] [Google Scholar]
- Li X, Roberti R, & Blobel G (2015). Structure of an integral membrane sterol reductase from Methylomicrobium alcaliphilum. Nature, 517(7532), 104–107. doi: 10.1038/nature13797 [DOI] [PMC free article] [PubMed] [Google Scholar]
- Makatsori D, Kourmouli N, Polioudaki H, Shultz LD, McLean K, Theodoropoulos PA, … Georgatos SD (2004). The inner nuclear membrane protein lamin B receptor forms distinct microdomains and links epigenetically marked chromatin to the nuclear envelope. J Biol Chem, 279(24), 25567–25573. doi: 10.1074/jbc.M313606200 [DOI] [PubMed] [Google Scholar]
- Mehrtash AB, & Hochstrasser M (2018). Ubiquitin-dependent Protein Degradation at the Endoplasmic Reticulum and Nuclear Envelope. Semin Cell Dev Biol. doi: 10.1016/j.semcdb.2018.09.013 [DOI] [PMC free article] [PubMed] [Google Scholar]
- Nikolakaki E, Mylonis I, & Giannakouros T (2017). Lamin B Receptor: Interplay between Structure, Function and Localization. Cells, 6(3). doi: 10.3390/cells6030028 [DOI] [PMC free article] [PubMed] [Google Scholar]
- Ohba T, Schirmer EC, Nishimoto T, & Gerace L (2004). Energy- and temperature-dependent transport of integral proteins to the inner nuclear membrane via the nuclear pore. J Cell Biol, 167(6), 1051–1062. doi: 10.1083/jcb.200409149 [DOI] [PMC free article] [PubMed] [Google Scholar]
- Olins AL, Rhodes G, Welch DB, Zwerger M, & Olins DE (2010). Lamin B receptor: multi-tasking at the nuclear envelope. Nucleus, 1(1), 53–70. doi: 10.4161/nucl.1.1.10515 [DOI] [PMC free article] [PubMed] [Google Scholar]
- Oosterwijk JC, Mansour S, van Noort G, Waterham HR, Hall CM, & Hennekam RC (2003). Congenital abnormalities reported in Pelger-Huet homozygosity as compared to Greenberg/HEM dysplasia: highly variable expression of allelic phenotypes. J Med Genet, 40(12), 937–941. [DOI] [PMC free article] [PubMed] [Google Scholar]
- Ploegh HL (2001). One-dimensional isoelectric focusing of proteins in slab gels. Curr Protoc Protein Sci, Chapter 10, Unit 10 12. doi: 10.1002/0471140864.ps1002s00 [DOI] [PubMed] [Google Scholar]
- Prakash A, Sengupta S, Aparna K, & Kasbekar DP (1999). The erg-3 (sterol delta14,15-reductase) gene of Neurospora crassa: generation of null mutants by repeat-induced point mutation and complementation by proteins chimeric for human lamin B receptor sequences. Microbiology, 145 ( Pt 6), 1443–1451. doi: 10.1099/13500872-145-6-1443 [DOI] [PubMed] [Google Scholar]
- Purice MD, & Taylor JP (2018). Linking hnRNP Function to ALS and FTD Pathology. Front Neurosci, 12, 326. doi: 10.3389/fnins.2018.00326 [DOI] [PMC free article] [PubMed] [Google Scholar]
- Pyrpasopoulou A, Meier J, Maison C, Simos G, & Georgatos SD (1996). The lamin B receptor (LBR) provides essential chromatin docking sites at the nuclear envelope. EMBO J, 15(24), 7108–7119. [PMC free article] [PubMed] [Google Scholar]
- Rose A, & Schlieker C (2012). Alternative nuclear transport for cellular protein quality control. Trends Cell Biol, 22(10), 509–514. doi: 10.1016/j.tcb.2012.07.003 [DOI] [PMC free article] [PubMed] [Google Scholar]
- Shibata Y, & Morimoto RI (2014). How the nucleus copes with proteotoxic stress. Curr Biol, 24(10), R463–474. doi: 10.1016/j.cub.2014.03.033 [DOI] [PMC free article] [PubMed] [Google Scholar]
- Silve S, Dupuy PH, Ferrara P, & Loison G (1998). Human lamin B receptor exhibits sterol C14-reductase activity in Saccharomyces cerevisiae. Biochim Biophys Acta, 1392(2–3), 233–244. [DOI] [PubMed] [Google Scholar]
- Timms RT, Menzies SA, Tchasovnikarova IA, Christensen LC, Williamson JC, Antrobus R, … Lehner PJ (2016). Genetic dissection of mammalian ERAD through comparative haploid and CRISPR forward genetic screens. Nat Commun, 7, 11786. doi: 10.1038/ncomms11786 [DOI] [PMC free article] [PubMed] [Google Scholar]
- Tsai PL, Zhao C, Turner E, & Schlieker C (2016). The Lamin B receptor is essential for cholesterol synthesis and perturbed by disease-causing mutations. Elife, 5. doi: 10.7554/eLife.16011 [DOI] [PMC free article] [PubMed] [Google Scholar]
- Turner EM, & Schlieker C (2016). Pelger-Huet anomaly and Greenberg skeletal dysplasia: LBR-associated diseases of cholesterol metabolism. Rare Dis, 4(1), e1241363. doi: 10.1080/21675511.2016.1241363 [DOI] [PMC free article] [PubMed] [Google Scholar]
- Ungricht R, Klann M, Horvath P, & Kutay U (2015). Diffusion and retention are major determinants of protein targeting to the inner nuclear membrane. J Cell Biol, 209(5), 687–703. doi: 10.1083/jcb.201409127 [DOI] [PMC free article] [PubMed] [Google Scholar]
- Ungricht R, & Kutay U (2015). Establishment of NE asymmetry-targeting of membrane proteins to the inner nuclear membrane. Curr Opin Cell Biol, 34, 135–141. doi: 10.1016/j.ceb.2015.04.005 [DOI] [PubMed] [Google Scholar]
- Ungricht R, & Kutay U (2017). Mechanisms and functions of nuclear envelope remodelling. Nat Rev Mol Cell Biol, 18(4), 229–245. doi: 10.1038/nrm.2016.153 [DOI] [PubMed] [Google Scholar]
- Van Engelenburg SB, & Palmer AE (2010). Imaging type-III secretion reveals dynamics and spatial segregation of Salmonella effectors. Nat Methods, 7(4), 325–330. doi: 10.1038/nmeth.1437 [DOI] [PMC free article] [PubMed] [Google Scholar]
- Webster BM, & Lusk CP (2016). Border Safety: Quality Control at the Nuclear Envelope. Trends Cell Biol, 26(1), 29–39. doi: 10.1016/j.tcb.2015.08.002 [DOI] [PMC free article] [PubMed] [Google Scholar]
- Worman HJ, Yuan J, Blobel G, & Georgatos SD (1988). A lamin B receptor in the nuclear envelope. Proc Natl Acad Sci U S A, 85(22), 8531–8534. [DOI] [PMC free article] [PubMed] [Google Scholar]
- Ye Q, & Worman HJ (1994). Primary structure analysis and lamin B and DNA binding of human LBR, an integral protein of the nuclear envelope inner membrane. J Biol Chem, 269(15), 11306–11311. [PubMed] [Google Scholar]
- Ye Y, Meyer HH, & Rapoport TA (2001). The AAA ATPase Cdc48/p97 and its partners transport proteins from the ER into the cytosol. Nature, 414(6864), 652–656. doi: 10.1038/414652a [DOI] [PubMed] [Google Scholar]