Figure 2:
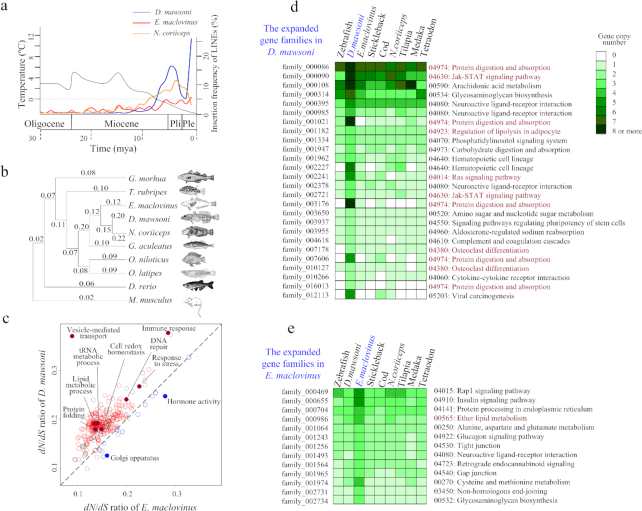
Evolution of the genomes and genes. (A) Timing and frequency of LINE insertion in D. mawsoni, E. maclovinus, and N. coriiceps showing correlation between onset of late Miocene deep cooling and burst LINE insertions in the Antarctic toothfish and bullhead notothen. The black trace indicates global temperature trends during the Oligocene, Miocene, Pliocene (Pli), and Pleistocene (Ple) from 30 to 0 mya, modified from Zachos et al. (2008) [58], Near et al. (2012) [9], and Favre et al. (2015) [59]. The red and blue lines indicate the insertion frequency of LINEs (the percentage of the calculated LINE pairs) in the D. mawsoni and E. maclovinus genomes, respectively, during these periods. (B) Reconstructed phylogeny of 9 teleost fish lineages using 2,936 orthologous genes (mouse serving as outgroup) and the calculated dN/dS ratio for each branch, showing a 2-fold faster evolutionary rate in the Antarctic notothenioids. (C) Comparison of adaptive evolution between D. mawsoni and E. maclovinus genomes. Data points represent the mean dN/dS value of each GO term, each of which consists of ≥30 genes. The red and blue circles show the GO terms with significantly higher dN/dS ratios (P < 0.05, binomial test) in D. mawsoni and E. maclovinus, respectively. The grey circles are those showing no significant difference. GO terms falling on the dashed line of linearity have the same dN/dS ratios in the 2 species. (D) Gene duplication in D. mawsoni. A subset [56] of the 202 gene families detected to contain higher gene copy numbers in the D. mawsoni genome relative to other species are listed on the left, with their respective KEGG pathway listed on the right. The gene copy numbers are measured by color difference. The pathways highlighted in red are especially abundant in D. mawsoni and might be relevant to physiological adaptation of D. mawsoni in the freezing environment. (E) A subset of duplicated gene families in E. maclovinus, showing different KEGG pathways between D. mawsoni and E. maclovinus in terms of gene duplication. The red highlighted pathway (ether lipid metabolism) indicates that a common duplication occurred in the 3 notothenioids.

