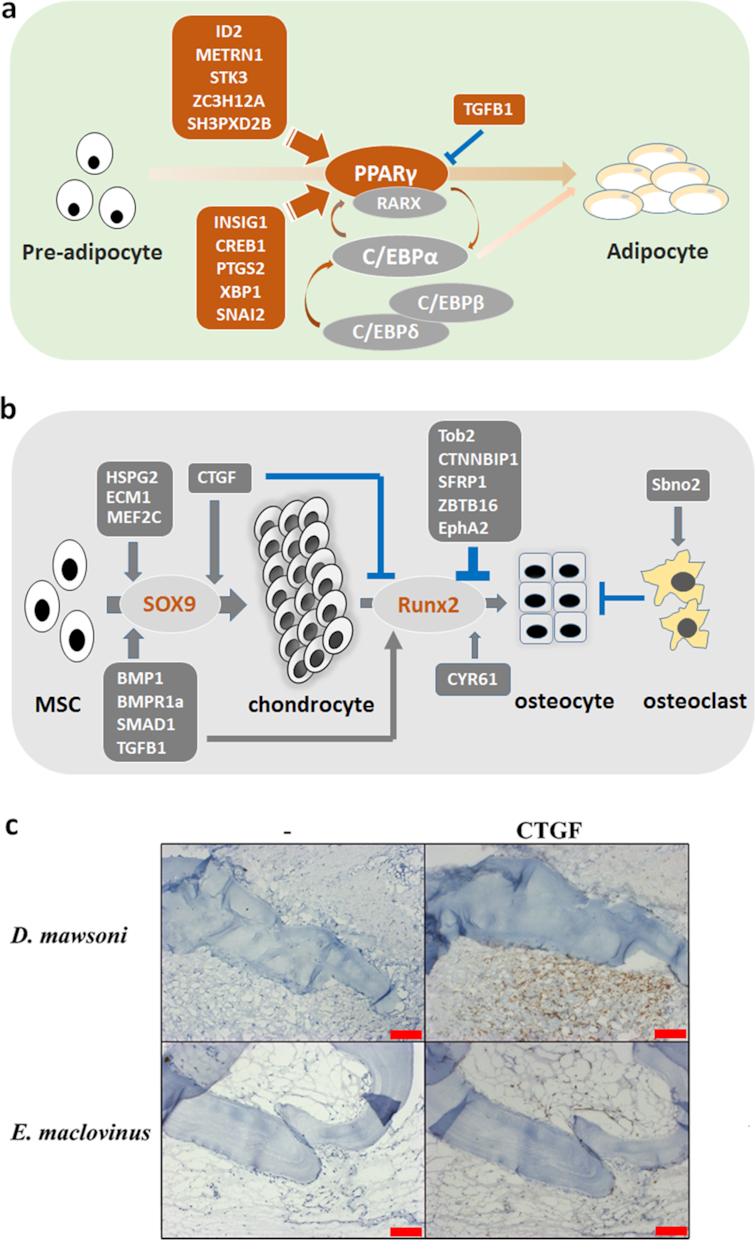
Figure 5:

Schematic diagram showing changed regulation of buoyancy-related developmental pathways. (A) Enhanced adipogenetic pathways in D. mawsoni muscle. The genes shadowed in red were upregulated in D. mawsoni while those shadowed in grey were unchanged. (B) Changed osteogenetic regulation in D. mawsoni bone. Genes shadowed in dark grey were upregulated in D. mawsoni while those in light grey were not changed. The arrows (in dark red or dark grey) indicate a positive effect on the process while blocked (in blue) lines indicate inhibitory effect. MSC: mesenchymal stem cell. (C). Immunohistochemical staining to detect the abundance of CTGF in cross sections of pelvic fin of D. mawsoni and E. maclovinus. The left panels of each fish are immunohistochemical staining without the first antibody as negative control. The presence of CTGF is indicated by the brown staining in the tissues shown at right. Scale bar, 50 μm.
