

Abstract
Background
A panic attack is a discrete period of fear or anxiety that has a rapid onset, reaches a peak within 10 minutes and in which at least four of 13 characteristic symptoms are experienced, including racing heart, chest pain, sweating, shaking, dizziness, flushing, stomach churning, faintness and breathlessness. Panic disorder is common in the general population with a lifetime prevalence of 1% to 4%. The treatment of panic disorder includes psychological and pharmacological interventions. Amongst pharmacological agents, antidepressants and benzodiazepines are the mainstay of treatment for panic disorder. Different classes of antidepressants have been compared; and the British Association for Psychopharmacology, and National Institute for Health and Care Excellence (NICE) consider antidepressants (mainly selective serotonin reuptake inhibitors (SSRIs)) as the first‐line treatment for panic disorder, due to their more favourable adverse effect profile over monoamine oxidase inhibitors (MAOIs) and tricyclic antidepressants (TCAs). In addition to antidepressants, benzodiazepines are widely prescribed for the treatment of panic disorder.
Objectives
To assess the evidence for the effects of antidepressants and benzodiazepines for panic disorder in adults.
Search methods
The Specialised Register of the Cochrane Common Mental Disorders Group (CCMDCTR) to 11 September 2015. This register includes relevant randomised controlled trials from the Cochrane Central Register of Controlled Trials (CENTRAL), MEDLINE (1950‐), Embase (1974‐) and PsycINFO (1967‐). Reference lists of relevant papers and previous systematic reviews were handsearched. We contacted experts in this field for supplemental data.
Selection criteria
All double‐blind randomised controlled trials allocating adult patients with panic disorder to antidepressants or benzodiazepines versus any other active treatment with antidepressants or benzodiazepines.
Data collection and analysis
Two review authors independently checked eligibility and extracted data using a standard form. Data were entered in RevMan 5.3 using a double‐check procedure. Information extracted included study characteristics, participant characteristics, intervention details, settings and outcome measures in terms of efficacy, acceptability and tolerability.
Main results
Thirty‐five studies, including 6785 participants overall (of which 5365 in the arms of interest (antidepressant and benzodiazepines as monotherapy)) were included in this review; however, since studies addressed many different comparisons, only a few trials provided data for primary outcomes. We found low‐quality evidence suggesting no difference between antidepressants and benzodiazepines in terms of response rate (risk ratio (RR) 0.99, 95% confidence interval (CI) 0.67 to 1.47; participants = 215; studies = 2). Very low‐quality evidence suggested a benefit for benzodiazepines compared to antidepressants in terms of dropouts due to any cause, even if confidence interval (CI) ranges from almost no difference to benefit with benzodiazepines (RR 1.64, 95% CI 1.03 to 2.63; participants = 1449; studies = 7). We found some evidence suggesting that serotonin reuptake inhibitors (SSRIs) are better tolerated than TCAs (when looking at the number of patients experiencing adverse effects). We failed to find clinically significant differences between individual benzodiazepines. The majority of studies did not report details on random sequence generation and allocation concealment; similarly, no details were provided about strategies to ensure blinding. The study protocol was not available for almost all studies so it is difficult to make a judgment on the possibility of outcome reporting bias. Information on adverse effects was very limited.
Authors' conclusions
The identified studies are not sufficient to comprehensively address the objectives of the present review. The majority of studies enrolled a small number of participants and did not provide data for all the outcomes specified in the protocol. For these reasons most of the analyses were underpowered and this limits the overall completeness of evidence. In general, based on the results of the current review, the possible role of antidepressants and benzodiazepines should be assessed by the clinician on an individual basis. The choice of which antidepressant and/or benzodiazepine is prescribed can not be made on the basis of this review only, and should be based on evidence of antidepressants and benzodiazepines efficacy and tolerability, including data from placebo‐controlled studies, as a whole. Data on long‐term tolerability issues associated with antidepressants and benzodiazepines exposure should also be carefully considered.
The present review highlights the need for further higher‐quality studies comparing antidepressants with benzodiazepines, which should be conducted with high‐methodological standards and including pragmatic outcome measures to provide clinicians with useful and practical data. Data from the present review will be included in a network meta‐analysis of psychopharmacological treatment in panic disorder, which will hopefully provide further useful information on this issue.
Plain language summary
Antidepressants and benzodiazepines for panic disorder in adults
Why is this review important?
Panic disorder is common in the general population. It is characterised by panic attacks, periods of fear or anxiety with a rapid onset in which other symptoms are experienced (involving bodily feelings and fearful thoughts). The treatment of panic disorder includes talking therapy and medicines, often used in combination. The most commonly prescribed medicines are antidepressants and benzodiazepines. Evidence for their efficacy in comparison is unclear. It is important to find out if antidepressants and benzodiazepines are effective and acceptable in the treatment of panic disorder.
Who will be interested in this review?
Patients and practitioners.
What questions does this review aim to answer?
This review aims to answer the following questions.
What is the efficacy of antidepressants and benzodiazepines compared to other antidepressants and other benzodiazepines?
What is the acceptability of antidepressants and benzodiazepines compared to other antidepressants and other benzodiazepines?
How many adverse effects do antidepressants and benzodiazepines have compared to other antidepressants and other benzodiazepines?
Which studies were included in the review?
We searched electronic databases to find all relevant studies conducted up to September 2015. To be included in the review, studies had to be randomised controlled trials that compared treatments with antidepressants and benzodiazepines in adults with a diagnosis of panic disorder. We included 35 studies involving a total of 5365 participants in the review.
What does the evidence from the review tell us?
We did not find substantial differences between antidepressants and benzodiazepines in terms of efficacy and tolerability. There was not enough information to compare any differences in adverse effects. However, our findings are limited in the following ways: few studies contributed to each analysis, some studies were funded by pharmaceutical companies, and only short‐term outcomes were assessed. The quality of the available evidence was mainly low, meaning that further research would be very likely to have an important impact on these results.
What should happen next?
Studies with larger sample sizes and fewer risks of bias should be carried out, with head‐to‐head comparisons. Longer‐term outcomes need to be addressed to establish whether the effect is transient or durable. Trials should better report any harms experienced by participants during the trial. In addition, a network meta‐analysis of psychopharmacological treatment in panic disorder will likely shed further light on this compelling issue, also being able to provide more information with regard to comparative efficacy.
Summary of findings
Summary of findings for the main comparison. Antidepressants compared to benzodiazepines for adults with panic disorder.
| Antidepressants compared to benzodiazepines for adults with panic disorder | ||||||
| Patient or population: adults with panic disorder Settings: outpatient Intervention: Antidepressants Comparison: benzodiazepines | ||||||
| Outcomes | Illustrative comparative risks* (95% CI) | Relative effect (95% CI) | No of Participants (studies) | Quality of the evidence (GRADE) | Comments | |
| Assumed risk | Corresponding risk | |||||
| Benzodiazepines | Antidepressants | |||||
| failure to respond Follow‐up: 8‐10 weeks | 314 per 1000 | 310 per 1000 (210 to 461) | RR 0.99 (0.67 to 1.47) | 215 (2 studies) | ⊕⊕⊝⊝ low1,2 | |
| total number of dropouts Follow‐up: 8‐24 weeks | 213 per 1000 | 350 per 1000 (220 to 561) | RR 1.64 (1.03 to 2.63) | 1449 (7 studies) | ⊕⊝⊝⊝ very low1,3,4 | |
| failure to remit Follow‐up: 8‐10 weeks | 360 per 1000 | 425 per 1000 (364 to 493) | RR 1.18 (1.01 to 1.37) | 1002 (3 studies) | ⊕⊕⊕⊝ moderate1 | |
| panic symptoms ‐ endpoint score Follow‐up: 8‐24 weeks | The mean panic symptoms ‐ endpoint score in the intervention groups was 0.13 lower (0.72 to 0.47 lower) | 1144 (3 studies) | ⊕⊝⊝⊝ very low1,5 | |||
|
panic symptoms ‐mean change Follow‐up: 8 weeks |
The mean panic symptoms ‐ mean change in the intervention groups was 0.40 higher (0.83 lower to 1.63 higher) | 44 (1 study) | ⊕⊕⊝⊝ low6 | |||
| number of dropouts due to adverse effects Follow‐up: 8‐10 weeks | 52 per 1000 | 89 per 1000 (54 to 149) | RR 1.72 (1.03 to 2.87) | 1002 (3 studies) | ⊕⊕⊝⊝ low1,4 | |
| *The basis for the assumed risk (e.g. the median control group risk across studies) is provided in footnotes. The corresponding risk (and its 95% confidence interval) is based on the assumed risk in the comparison group and the relative effect of the intervention (and its 95% CI). CI: Confidence interval; RR: Risk ratio; | ||||||
| GRADE Working Group grades of evidence High quality: Further research is very unlikely to change our confidence in the estimate of effect. Moderate quality: Further research is likely to have an important impact on our confidence in the estimate of effect and may change the estimate. Low quality: Further research is very likely to have an important impact on our confidence in the estimate of effect and is likely to change the estimate. Very low quality: We are very uncertain about the estimate. | ||||||
1 Downgraded one point due to high dropout rates (30%)
2 Downgraded one point due to imprecision: 95% CI interval ranges from possible benefit with antidepressants to possible benefit with benzodiazepines
3 Downgraded one point due to substantial heterogeneity (I2 = 75%)
4 Downgraded one point due to imprecision: 95% CI interval ranges from no difference to possible benefit associated with benzodiazepines
5 Downgraded two points due to substantial heterogeneity (I2 = 95%) 6 Downgraded two points due to imprecision: number of individuals included in the trial is low (44) and 95% CI ranges from appreciable benefit with TCAs to appreciable benefit with benzodiazepines
Summary of findings 2. TCAs compared to benzodiazepines for adults with panic disorder.
| TCAs compared to benzodiazepines for adults with panic disorder | ||||||
| Patient or population: adults with panic disorder Settings: outpatient Intervention: TCAs Comparison: benzodiazepines | ||||||
| Outcomes | Illustrative comparative risks* (95% CI) | Relative effect (95% CI) | No of Participants (studies) | Quality of the evidence (GRADE) | Comments | |
| Assumed risk | Corresponding risk | |||||
| Benzodiazepines | TCAs | |||||
| failure to respond Follow‐up: 8 weeks | 537 per 1000 | 547 per 1000 (338 to 896) | RR 1.02 (0.63 to 1.67) | 61 (1 study) | ⊕⊝⊝⊝ very low1,2 | |
| total number of dropouts Follow‐up: 8‐24 weeks | 212 per 1000 | 355 per 1000 (197 to 635) | RR 1.67 (0.93 to 2.99) | 1295 (6 studies) | ⊕⊝⊝⊝ very low1,3,4 | |
| failure to remit Follow‐up: 8 weeks | 348 per 1000 | 414 per 1000 (348 to 490) | RR 1.19 (1 to 1.41) | 848 (2 studies) | ⊕⊕⊕⊝ moderate1 | |
| panic symptoms ‐ endpoint score Follow‐up: 8‐24 weeks | The mean panic symptoms ‐ endpoint score in the intervention groups was 0.25 lower (1.72 lower to 1.22 higher) | 998 (2 studies) | ⊕⊝⊝⊝ very low1,5,6 | |||
|
panic symptoms ‐ mean change Follow‐up: 8 weeks |
The mean panic symptoms ‐ mean change in the intervention groups was 0.40 higher (0.83 lower to 1.63 higher) | 44 (1 study) | ⊕⊕⊝⊝ low7 | |||
| number of dropouts due to adverse effects Follow‐up: 8 weeks | 38 per 1000 | 79 per 1000 (43 to 149) | RR 2.10 (1.13 to 3.93) | 848 (2 studies) | ⊕⊕⊝⊝ low1,4 | |
| *The basis for the assumed risk (e.g. the median control group risk across studies) is provided in footnotes. The corresponding risk (and its 95% confidence interval) is based on the assumed risk in the comparison group and the relative effect of the intervention (and its 95% CI). CI: Confidence interval; RR: Risk ratio; | ||||||
| GRADE Working Group grades of evidence High quality: Further research is very unlikely to change our confidence in the estimate of effect. Moderate quality: Further research is likely to have an important impact on our confidence in the estimate of effect and may change the estimate. Low quality: Further research is very likely to have an important impact on our confidence in the estimate of effect and is likely to change the estimate. Very low quality: We are very uncertain about the estimate. | ||||||
1 Downgraded one point due to high dropout rates (around 30%) 2 Downgraded two points due to imprecision: number of individuals included in the trial is low (61) and 95% CI ranges from appreciable benefit with TCAs to appreciable benefit with benzodiazepines
3 Downgraded two points due to substantial heterogeneity (I2 = 79%)
4 Downgraded one point due to imprecision: 95% CI ranges from no difference to appreciable superiority of benzodiazepines in lowering the number of dropouts
5 Downgraded two points due to substantial heterogeneity (I2 = 97%) 6 Downgraded one point due to imprecision: 95% CI is very wide and ranges from benefit with TCAs and benefit with benzodiazepines 7 Downgraded two points due to imprecision: number of individuals included in the trial is low (44) and 95% CI ranges from appreciable benefit with TCAs to appreciable benefit with benzodiazepines
Summary of findings 3. SSRIs compared to benzodiazepines for adults with panic disorder.
| SSRIs compared to benzodiazepines for adults with panic disorder | ||||||
| Patient or population: adults with panic disorder Settings: outpatient Intervention: SSRI Comparison: benzodiazepines | ||||||
| Outcomes | Illustrative comparative risks* (95% CI) | Relative effect (95% CI) | No of Participants (studies) | Quality of the evidence (GRADE) | Comments | |
| Assumed risk | Corresponding risk | |||||
| Benzodiazepines | SSRI | |||||
| failure to respond Follow‐up: 10 weeks | 195 per 1000 | 181 per 1000 (94 to 351) | RR 0.93 (0.48 to 1.80) | 154 (1 study) | ⊕⊝⊝⊝ very low1,2 | |
| total number of dropouts Follow‐up: 10 | 221 per 1000 | 378 per 1000 (227 to 627) | RR 1.71 (1.03 to 2.84) | 154 (1 study) | ⊕⊝⊝⊝ very low1,3 | |
| failure to remit Follow‐up: 10 weeks | 429 per 1000 | 480 per 1000 (339 to 681) | RR 1.12 (0.79 to 1.59) | 154 (1 study) | ⊕⊝⊝⊝ very low1,2 | |
| panic symptoms | The mean panic symptoms in the intervention groups was 0.10 higher (0.34 lower to 0.54 higher) | 146 (1 study) | ⊕⊕⊝⊝ low1,4 | |||
| number of dropouts due to adverse effects Follow‐up: 10 weeks | 130 per 1000 | 156 per 1000 (71 to 339) | RR 1.20 (0.55 to 2.61) | 154 (1 study) | ⊕⊝⊝⊝ very low1,2 | |
| *The basis for the assumed risk (e.g. the median control group risk across studies) is provided in footnotes. The corresponding risk (and its 95% confidence interval) is based on the assumed risk in the comparison group and the relative effect of the intervention (and its 95% CI). CI: Confidence interval; RR: Risk ratio; | ||||||
| GRADE Working Group grades of evidence High quality: Further research is very unlikely to change our confidence in the estimate of effect. Moderate quality: Further research is likely to have an important impact on our confidence in the estimate of effect and may change the estimate. Low quality: Further research is very likely to have an important impact on our confidence in the estimate of effect and is likely to change the estimate. Very low quality: We are very uncertain about the estimate. | ||||||
1 Downgraded one point due to high dropout rates (30%) 2 Downgraded two points due to imprecision: number of individuals included in the trial is low (= 154) and 95% CI is wide, including benefit with SSRIs and benefit with benzodiazepines; only one study provides data 3 Downgraded two points due to imprecision: number of individuals included in the trial is low (= 154) and 95% CI ranges from no difference to appreciable superiority of with benzodiazepines in lowering the number of dropouts; only one study provides data 4 Downgraded one point due to imprecision: number of individuals included in the trial is low
Summary of findings 4. TCAs compared to SSRI for adults with panic disorder.
| TCAs compared to SSRI for adults with panic disorder | ||||||
| Patient or population: adults with panic disorder Settings: outpatient Intervention: TCA Comparison: SSRI | ||||||
| Outcomes | Illustrative comparative risks* (95% CI) | Relative effect (95% CI) | No of Participants (studies) | Quality of the evidence (GRADE) | Comments | |
| Assumed risk | Corresponding risk | |||||
| SSRI | TCA | |||||
| failure to respond Follow‐up: 8‐12 weeks | 378 per 1000 | 409 per 1000 (269 to 628) | RR 1.08 (0.71 to 1.66) | 438 (4 studies) | ⊕⊕⊝⊝ low1,2 | |
| total number of dropouts Follow‐up: 8‐24 weeks | 243 per 1000 | 238 per 1000 (158 to 359) | RR 0.98 (0.65 to 1.48) | 928 (7 studies) | ⊕⊕⊝⊝ low2,3 | |
| failure to remit Follow‐up: 8‐24 weeks | 502 per 1000 | 447 per 1000 (316 to 633) | RR 0.89 (0.63 to 1.26) | 475 (5 studies) | ⊕⊕⊕⊝ moderate4 | |
| panic symptoms Follow‐up: 8‐10 weeks | The mean panic symptoms in the intervention groups was 0.20 lower (0.88 lower to 0.48 higher) | 243 (4 studies) | ⊕⊝⊝⊝ very low5,6,7 | |||
| number of dropouts due to adverse effects Follow‐up: 8‐24 weeks | 104 per 1000 | 148 per 1000 (85 to 257) | RR 1.43 (0.82 to 2.48) | 476 (5 studies) | ⊕⊕⊝⊝ low5,8 | |
| *The basis for the assumed risk (e.g. the median control group risk across studies) is provided in footnotes. The corresponding risk (and its 95% confidence interval) is based on the assumed risk in the comparison group and the relative effect of the intervention (and its 95% CI). CI: Confidence interval; RR: Risk ratio; | ||||||
| GRADE Working Group grades of evidence High quality: Further research is very unlikely to change our confidence in the estimate of effect. Moderate quality: Further research is likely to have an important impact on our confidence in the estimate of effect and may change the estimate. Low quality: Further research is very likely to have an important impact on our confidence in the estimate of effect and is likely to change the estimate. Very low quality: We are very uncertain about the estimate. | ||||||
1 Downgraded one point due to moderate heterogeneity (I squared = 61%) 2 Downgraded one point due to imprecision: 95% CI ranges from appreciable benefit with TCAs to appreciable benefit with SSRIs 3 Downgraded one point due to moderate heterogeneity (I squared = 47%) 4 Downgraded one point due to moderate heterogeneity (I squared = 58%) 5 Downgraded one point due to imprecision: dropout rate in one of the included studies (Nair 1996) is 48% 6 Downgraded one point due to moderate heterogeneity (I squared = 46%) 7 Downgraded one point due to imprecision: 95% CI ranges from appreciable benefit with TCAs to no difference 8 Downgraded one point due to imprecision: 95% CI ranges from no difference to appreciable superiority of SSRIs in lowering the number of dropouts
Summary of findings 5. TCA compared to MAOI for adults with panic disorder.
| TCA compared to MAOI for adults with panic disorder | ||||||
| Patient or population: adults with panic disorder Settings: outpatient Intervention: TCA Comparison: MAOI | ||||||
| Outcomes | Illustrative comparative risks* (95% CI) | Relative effect (95% CI) | No of Participants (studies) | Quality of the evidence (GRADE) | Comments | |
| Assumed risk | Corresponding risk | |||||
| MAOI | TCA | |||||
| failure to respond Follow‐up: 8 weeks | 224 per 1000 | 132 per 1000 (63 to 282) | RR 0.59 (0.28 to 1.26) | 135 (1 study) | ⊕⊕⊝⊝ low1 | |
| total number of dropouts | 386 per 1000 | 324 per 1000 (235 to 452) | RR 0.84 (0.61 to 1.17) | 228 (2 studies) | ⊕⊕⊕⊝ moderate2 | |
| failure to remit | See comment | See comment | Not estimable | 0 (0) | See comment | No studies provided data for this outcome |
| panic symptoms Follow‐up: 8 weeks | The mean panic symptoms in the intervention groups was 0.20 lower (0.75 lower to 0.35 higher) | 135 (1 study) | ⊕⊕⊝⊝ low3 | |||
| number of dropouts due to adverse events Follow‐up: 8 weeks | 104 per 1000 | 133 per 1000 (52 to 335) | RR 1.27 (0.5 to 3.21) | 135 (1 study) | ⊕⊕⊝⊝ low4 | |
| *The basis for the assumed risk (e.g. the median control group risk across studies) is provided in footnotes. The corresponding risk (and its 95% confidence interval) is based on the assumed risk in the comparison group and the relative effect of the intervention (and its 95% CI). CI: Confidence interval; RR: Risk ratio; | ||||||
| GRADE Working Group grades of evidence High quality: Further research is very unlikely to change our confidence in the estimate of effect. Moderate quality: Further research is likely to have an important impact on our confidence in the estimate of effect and may change the estimate. Low quality: Further research is very likely to have an important impact on our confidence in the estimate of effect and is likely to change the estimate. Very low quality: We are very uncertain about the estimate. | ||||||
1 Downgraded two points due to imprecision: number of individuals included in the study is low (= 135) and 95% CI ranges from appreciable benefit with TCAs to no difference; only one study provides data 2 Downgraded one point due high dropout rates 3 Downgraded two points due to imprecision: number of individuals included in the study is low (= 135) and 95% CI ranges from appreciable benefit with TCAs to no difference; only one study provides data. 4 Downgrded two points due to imprecision: number of individuals included in the study is low (= 135) and 95% CI ranges from appreciable benefit with TCAs to appreciable benefit with MAOIs; only one study provides data.
Summary of findings 6. SSRIs compared to MAOIs for adults with panic disorder.
| SSRIs compared to MAOIs for adults with panic disorder | ||||||
| Patient or population: adults with panic disorder Settings: outpatient Intervention: SSRI Comparison: MAOI | ||||||
| Outcomes | Illustrative comparative risks* (95% CI) | Relative effect (95% CI) | No of Participants (studies) | Quality of the evidence (GRADE) | Comments | |
| Assumed risk | Corresponding risk | |||||
| MAOI | SSRI | |||||
| failure to respond Follow‐up: 8‐12 weeks | 264 per 1000 | 296 per 1000 (219 to 401) | RR 1.12 (0.83 to 1.52) | 396 (2 studies) | ⊕⊕⊕⊝ moderate1 | |
| total number of dropouts Follow‐up: 12 weeks | 67 per 1000 | 67 per 1000 (5 to 970) | RR 1.00 (0.07 to 14.55) | 30 (1 study) | ⊕⊕⊝⊝ low2 | |
| failure to remit Follow‐up: 8 weeks | 467 per 1000 | 434 per 1000 (346 to 546) | RR 0.93 (0.74 to 1.17) | 366 (1 study) | ⊕⊕⊕⊝ moderate3 | |
| panic symptoms | See comment | See comment | Not estimable | 0 (0) | See comment | No studies provided data for this outcome |
| number of dropouts due to adverse events Follow‐up: 8 weeks | 60 per 1000 | 76 per 1000 (36 to 163) | RR 1.26 (0.59 to 2.70) | 366 (1 study) | ⊕⊕⊝⊝ low4 | |
| *The basis for the assumed risk (e.g. the median control group risk across studies) is provided in footnotes. The corresponding risk (and its 95% confidence interval) is based on the assumed risk in the comparison group and the relative effect of the intervention (and its 95% CI). CI: Confidence interval; RR: Risk ratio; | ||||||
| GRADE Working Group grades of evidence High quality: Further research is very unlikely to change our confidence in the estimate of effect. Moderate quality: Further research is likely to have an important impact on our confidence in the estimate of effect and may change the estimate. Low quality: Further research is very likely to have an important impact on our confidence in the estimate of effect and is likely to change the estimate. Very low quality: We are very uncertain about the estimate. | ||||||
1 Downgraded one point due to imprecision: 95% CI ranges from no difference to appreciable benefit with MAOIs 2 Downgraded two points due to imprecision: number of individuals included in the trial is very low (= 30) and 95% CI is very wide, ranging from appreciable benefit with SSRIs to appreciable benefit with MAOIs; only one study provides data 3 Downgraded one point due to imprecision: even though the number of individuals included in the analysis is not low, only one study provides data 4 Downgrded two points due to imprecision: 95% CI ranges from appreciable benefit with SSRIs to appreciable benefit with MAOIs; only one study provides data.
Summary of findings 7. SSRIs compared to SNRIs for adults with panic disorder.
| SSRIs compared to SNRIs for adults with panic disorder | ||||||
| Patient or population: adults with panic disorder Settings: outpatient Intervention: SSRI Comparison: SNRI | ||||||
| Outcomes | Illustrative comparative risks* (95% CI) | Relative effect (95% CI) | No of Participants (studies) | Quality of the evidence (GRADE) | Comments | |
| Assumed risk | Corresponding risk | |||||
| SNRI | SSRI | |||||
| failure to respond Follow‐up: 12 weeks | 232 per 1000 | 223 per 1000 (174 to 285) | RR 0.96 (0.75 to 1.23) | 991 (2 studies) | ⊕⊕⊕⊕ high | |
| total number of dropouts Follow‐up: 2 weeks | 181 per 1000 | 201 per 1000 (134 to 298) | RR 1.11 (0.74 to 1.65) | 991 (2 studies) | ⊕⊕⊝⊝ low1,2 | |
| failure to remit Follow‐up: 12 weeks | 577 per 1000 | 606 per 1000 (525 to 698) | RR 1.05 (0.91 to 1.21) | 991 (2 studies) | ⊕⊕⊕⊕ high | |
| panic symptoms Follow‐up: 12 weeks | The mean panic symptoms in the intervention groups was 0.12 lower (0.33 lower to 0.10 higher) | 945 (2 studies) | ⊕⊕⊕⊕ high | |||
| number of dropouts due to adverse effects | 56 per 1000 | 104 per 1000 (27 to 393) | RR 1.86 (0.49 to 7.05) | 991 (2 studies) | ⊕⊕⊝⊝ low3,4 | |
| *The basis for the assumed risk (e.g. the median control group risk across studies) is provided in footnotes. The corresponding risk (and its 95% confidence interval) is based on the assumed risk in the comparison group and the relative effect of the intervention (and its 95% CI). CI: Confidence interval; RR: Risk ratio; | ||||||
| GRADE Working Group grades of evidence High quality: Further research is very unlikely to change our confidence in the estimate of effect. Moderate quality: Further research is likely to have an important impact on our confidence in the estimate of effect and may change the estimate. Low quality: Further research is very likely to have an important impact on our confidence in the estimate of effect and is likely to change the estimate. Very low quality: We are very uncertain about the estimate. | ||||||
1 Downgraded one point due to moderate heterogeneity (I2 = 53%) 2 Downgraded one point due to imprecision: 95% CI ranges from appreciable benefit with SSRIs to appreciable benefit with SNRIs 3 Downgraded one point due to substantial heterogeneity (I2 = 76%) 4 Downgraded one point due to serious imprecision: 95% CI ranges from no difference to benefit with SNRIs
Summary of findings 8. SSRIs compared to NaSSAs for adults with panic disorder.
| SSRIs compared to NaSSAs for adults with panic disorder | ||||||
| Patient or population: adults with panic disorder Settings: outpatient Intervention: SSRI Comparison: NaSSA | ||||||
| Outcomes | Illustrative comparative risks* (95% CI) | Relative effect (95% CI) | No of Participants (studies) | Quality of the evidence (GRADE) | Comments | |
| Assumed risk | Corresponding risk | |||||
| NaSSA | SSRI | |||||
| failure to respond | See comment | See comment | Not estimable | 0 (0) | See comment | |
| total number of dropouts Follow‐up: 8 weeks | 133 per 1000 | 200 per 1000 (39 to 1000) | RR 1.50 (0.29 to 7.73) | 30 (1 study) | ⊕⊕⊝⊝ low1 | |
| failure to remit | See comment | See comment | Not estimable | 0 (0) | See comment | No studies provided data for this outcome |
| panic symptoms Follow‐up: 8 weeks | The mean panic symptoms in the intervention groups was 0.30 higher (0.49 lower to 1.09 higher) | 22 (1 study) | ⊕⊕⊝⊝ low2 | |||
| number of dropouts due to adverse events Follow‐up: 8 weeks | 133 per 1000 | 200 per 1000 (39 to 1000) | RR 1.50 (0.29 to 7.73) | 30 (1 study) | ⊕⊕⊝⊝ low1 | |
| *The basis for the assumed risk (e.g. the median control group risk across studies) is provided in footnotes. The corresponding risk (and its 95% confidence interval) is based on the assumed risk in the comparison group and the relative effect of the intervention (and its 95% CI). CI: Confidence interval; RR: Risk ratio; | ||||||
| GRADE Working Group grades of evidence High quality: Further research is very unlikely to change our confidence in the estimate of effect. Moderate quality: Further research is likely to have an important impact on our confidence in the estimate of effect and may change the estimate. Low quality: Further research is very likely to have an important impact on our confidence in the estimate of effect and is likely to change the estimate. Very low quality: We are very uncertain about the estimate. | ||||||
1 Downgraded two points due to imprecision: number of individuals included in the trial is very low (= 30) and 95% CI is very wide, ranging from appreciable benefit with SSRIs to appreciable benefit with NaSSAs; only one study provides data 2 Downgraded two points due to imprecision: number of individuals included in the trial is very low (= 22) and 95% CI is very wide, ranging from appreciable benefit with SSRIs to appreciable benefit with NaSSAs; only one study provides data
Background
Description of the condition
A panic attack is a discrete period of fear or anxiety that has a rapid onset, reaches a peak within 10 minutes and in which at least four of 13 characteristic symptoms are experienced. Many of these symptoms involve bodily systems, such as racing heart, chest pain, sweating, shaking, dizziness, flushing, stomach churning, faintness and breathlessness. Further recognised panic attack symptoms involve fearful cognitions, such as the fear of collapse, going mad or dying, and derealisation (APA 1994).
Panic disorder first entered diagnostic classification systems in 1980 with the publication of the Diagnostic and Statistical Manual of Mental Disorders, Third Edition (DSM‐III) (APA 1980), following observations that patients with panic attacks responded to treatment with the tricyclic antidepressant (TCA), imipramine (Klein 1964). To diagnose panic disorder, further conditions must be met relating to the frequency of attacks, the need for some panic attacks to come on ‘out of the blue’ rather than in a predictable, externally‐triggered situation, and exclusions where attacks are attributable solely to medical causes or panic‐inducing substances, notably caffeine. The Diagnostic and Statistical Manual of Mental Disorders, Fourth Edition (DSM‐IV) also requires that at least one panic attack has been followed by one of the following:
persistent concern about having additional attacks;
worry about the implications of the attack or its consequences;
a significant change in behaviour related to the attacks (APA 1994).
The core features of panic attacks remained unchanged in the Diagnostic and Statistical Manual of Mental Disorders, Fifth Edition (DSM‐5) (APA 2013a), but in DSM‐5 panic disorder and agoraphobia are no longer linked and are now coded in two diagnoses (APA 2013b).
Panic disorder is common in the general population with a lifetime prevalence of 1% to 4% (Bijl 1998; Eaton 1994). In primary care settings, panic syndromes have been reported to have a prevalence of around 10% (King 2008). Its aetiology is not fully understood and is probably heterogeneous. Biological theories incorporate the faulty triggering of an inbuilt anxiety response. Evidence for this comes from biological challenge tests (lactate and carbon dioxide trigger panic in those with the disorder) and from animal experiments and neuroimaging studies in humans that show activation of fear circuits, such as those involving the periaqueductal grey matter (Gorman 2000).
Agoraphobia is anxiety about being in places or situations from which escape might be difficult or embarrassing, or in which help may not be available in the event of having a panic attack (APA 1994) . About one‐fourth of people suffering from panic disorder also have agoraphobia (Kessler 2006). The presence of agoraphobia is associated with increased severity and worse outcome (Kessler 2006). There are several risk factors that predict the development of agoraphobia in people suffering from panic disorder: female gender, more severe dizziness during panic attacks, cognitive factors, dependent personality traits and social anxiety disorder (Starcevic 2009).
Panic disorder, with or without agoraphobia, is highly co‐morbid with other psychiatric disorders, such as drug dependence, major depression, bipolar I disorder, social phobia, specific phobia, and generalised anxiety disorder (Grant 2006). It is estimated that generalised anxiety disorder co‐occurs in 68% of people with panic disorder, whilst major depression has a prevalence of 24% to 88% among people with panic disorder (Starcevic 2009).
Description of the intervention
The treatment of panic disorder includes psychological and pharmacological interventions, often used in combination (Furukawa 2007). Historically, pharmacological interventions for panic disorder have been based on the use of monoamine oxidase inhibitors (MAOIs) and TCAs (Bruce 2003). However, MAOIs and TCAs are associated with severe adverse effects, such as the risk of hypertensive crisis for MAOIs, and anticholinergic, arrhythmogenic and overall poor tolerability for TCAs (Wade 1999). Recent guidelines by the American Psychiatric Association (APA 2009), British Association for Psychopharmacology (BAP 2005), and National Institute for Health and Care Excellence (NICE) (NICE 2011) recommend antidepressants, mainly selective serotonin reuptake inhibitors (SSRIs), as the first‐line treatment for panic disorder, due to their more favourable adverse effect profile over MAOIs and TCAs. A meta‐analysis of 43 studies (randomised and non randomised) comparing SSRIs and TCAs in panic disorder showed that SSRIs were as effective as TCAs, and were better tolerated (Bakker 2002), although other studies showed a possible overestimation of the efficacy of SSRIs over older antidepressants in panic disorder, finding no difference in their efficacy (Otto 2001, effect‐size analysis of 12 placebo‐controlled, efficacy trials of SSRIs for panic disorder). It appears that TCAs can still have a role in the treatment of panic disorder.
Benzodiazepines, particularly high‐potency ones, have also been used in panic disorder (Stein 2010). Benzodiazepines have a higher incidence of dependence and withdrawal reaction when compared to antidepressants (Wade 1999). Moreover, benzodiazepines alone may not be effective in treating panic disorder co‐morbid with depression (Ballenger 1998), and have less favourable long‐term outcomes (NICE 2011). In spite of these caveats, it appears that benzodiazepines continue to be widely prescribed for the treatment of panic disorder (Bruce 2003).
How the intervention might work
The main classes with evidence of efficacy in panic disorder are antidepressant drugs that augment the function of the monoamines serotonin and/or noradrenaline. With regard to the serotonergic antidepressants (SSRIs such as fluoxetine, paroxetine, sertraline and citalopram), these drugs promote the transmission of the neurotransmitter serotonin across brain synapses; most notably in the dorsal raphe nucleus (Briley 1993). They prevent reuptake of serotonin into nerve terminals by inhibiting serotonin transporters, thus allowing more to be available for neurotransmission. In panic disorder, imaging studies have showed reduced expression of the 5H1A receptor (Nash 2008), which has an inhibitory function, so the increased serotonin throughput may in part serve to overcome this deficit of inhibition. Noradrenergic antidepressants can similarly increase transmission of the catecholamine noradrenaline. Some antidepressants such as the serotonin‐norepinephrine reuptake inhibitors (SNRIs) (e.g. venlafaxine, duloxetine) and TCAs can enhance both serotonin and noradrenaline transmission by inhibiting both transporters.
Benzodiazepines moderate the gamma‐aminobutyric acid (GABA) neurotransmitter system, which is the brain's main inhibitory neurotransmitter. They act as agonists at the GABA‐A benzodiazepines receptor. This complex contains a chloride channel which can be opened by agonists and ultimately produces an anxiolytic effect and sedation. It is known through imaging studies that the inhibitory GABA system is deficient in panic disorder (Malizia 1998; Cameron 2007), and thus the ability of benzodiazepines to act as agonists at the GABA‐A benzodiazepine receptor can counteract this. It is likely that both monoamine‐based systems and GABA‐based systems converge allowing both antidepressants and benzodiazepines to have efficacy in panic disorder despite their differing actions on neurotransmitter systems. One possibility is via serotonergic neurons that modulate GABA input to the periaqueductal grey matter.
Why it is important to do this review
Antidepressants and benzodiazepines are widely used in panic disorder. Published randomised controlled trials (RCTs) have shown some evidence of efficacy. However, no systematic review that includes comparisons between antidepressants and benzodiazepines in panic disorder has been conducted recently, to our knowledge. A meta‐analysis published in 2007 focused on combined psychotherapy and antidepressants in panic disorder (Furukawa 2007), and a more recent systematic review focused on psychological treatments only (Sanchez‐Meca 2010). One meta‐analysis of interventions for panic disorder has been published in recent years, focusing on combined psychotherapy and benzodiazepines in panic disorder (Watanabe 2009). Furukawa 2007 concluded that either combined psychotherapy or psychotherapy alone may be chosen as first‐line treatment for panic disorder. Sanchez‐Meca 2010 reported that exposure, relaxation training and breathing retraining have the most robust evidence. A network meta‐analysis was also performed to compare different psychological therapies for panic disorder (Pompoli 2016). To our knowledge, the most recent meta‐analysis specifically focused on antidepressants in panic disorder was published in 2002 (Bakker 2002), and included 43 studies comparing SSRIs and TCAs. The authors concluded that SSRIs and TCAs were of equal efficacy in the treatment of panic disorder, with a better tolerability profile for SSRIs. Benzodiazepines are widely used in panic disorder. Available RCTs have shown some evidence of efficacy (Batelaan 2012). The last meta‐analysis specifically focused on benzodiazepines in panic disorder was published in 1991 (Wilkinson 1991), and included 19 double‐blind, placebo‐controlled trials. This meta‐analysis compared antidepressants and benzodiazepines with placebo. The authors concluded that active treatment had a 25% greater success rate than placebo over 14 weeks. Another meta‐analysis has been recently published (Offidani 2013), including 22 studies comparing benzodiazepines and antidepressants in various anxiety disorders including panic disorder. The authors found that benzodiazepines were more effective in reducing the number of panic attacks, than TCAs. Additionally, benzodiazepines were better tolerated than TCAs and they were as effective as the newer antidepressants. The authors concluded that the role of benzodiazepines should be reappraised. The review mostly focused on tricyclic antidepressants and did not include studies comparing benzodiazepines with SSRIs.
An up‐to‐date systematic review is needed to help practitioners identify the relative efficacy of antidepressants and benzodiazepines, compared to each other, in order to be better guided in the choice of the pharmacological agent.
Two other Cochrane reviews in patients with panic disorder, one on antidepressants versus placebo and one on benzodiazepines versus placebo, respectively, are in progress, which will be of further help to identify effective treatments in panic disorder (Guaiana 2013a; Guaiana 2013b). A Cochrane network meta‐analysis of psychopharmacological treatment in panic disorder is in progress (Guaiana 2014).
This review followed the methods set out in the protocol (Guaiana 2015)
Objectives
To assess the effects of antidepressants or benzodiazepines for panic disorder in adults, specifically:
to determine the efficacy of antidepressants and benzodiazepines in alleviating symptoms of panic disorder, with or without agoraphobia, in comparison to other antidepressants and other benzodiazepines;
to review the acceptability of antidepressants and benzodiazepines in panic disorder, with or without agoraphobia, in comparison to other antidepressants and other benzodiazepines; and
to investigate the adverse effects of antidepressants and benzodiazepines in panic disorder, with or without agoraphobia, including the general prevalence of adverse effects, compared to other antidepressants and other benzodiazepines.
Methods
Criteria for considering studies for this review
Types of studies
Double‐blind randomised controlled trials (RCTs) using a parallel‐group design that compare antidepressants as monotherapy with benzodiazepines as monotherapy, antidepressants with antidepressants and benzodiazepines with benzodiazepines. We included one cross‐over trial, and RCTs with more than two arms. Cluster‐RCTs were eligible for inclusion but none were identified.
We excluded quasi‐randomised trials, such as those allocated by using alternate days of the week.
Types of participants
Participants
Participants aged 18 years or older.
Diagnosis
Patient with primary diagnosis of panic disorder, with or without agoraphobia, diagnosed according to any of the following criteria: Feighner criteria, Research Diagnostic Criteria, Diagnostic and Statistical Manual of Mental Disorders (DSM‐III, DSM‐III‐R, DSM‐IV, DSM‐V) or International Statistical Classification of Diseases and Related Health Problems, 10th revision (ICD‐10). In cases where study eligibility focused on agoraphobia, rather than panic disorder, we included studies if operationally diagnosed according to the above‐named criteria and when it was possible to safely assume that some of the participants were suffering from panic disorder as defined by the above criteria. In other words, we excluded studies that focused on agoraphobia without panic disorder. There is evidence that over 95% of patients with agoraphobia seen clinically suffer from panic disorder as well (Goisman 1995). However, we planned to further examine the effects of the inclusion of these studies (i.e. studies in which some, but possibly not all, of the patients had panic disorder) in a sensitivity analysis (Sensitivity analysis).
Co‐morbidities
We excluded participants with serious co‐morbid physical disorders (e.g. myocardial infarction, chronic obstructive pulmonary disorder, uncontrolled diabetes, electrolyte disturbances) as they may confound treatment effectiveness and tolerability. Studies where panic is induced were excluded. We included participants with co‐morbid mental disorders, but the effect of including these participants was examined in sensitivity analyses (Sensitivity analysis).
Settings
We included all types of settings (inpatient, outpatient, primary care). We included only studies recruiting patients acutely ill. Long‐term, relapse prevention studies were therefore excluded.
Types of interventions
Trials comparing antidepressants as monotherapy with benzodiazepines as monotherapy, antidepressants with antidepressants, and benzodiazepines with benzodiazepines in the treatment of panic disorder, with or without agoraphobia.
We included only acute treatment studies treating participants for less than six months. If a study treated participants for more than six months but reported outcome data within six months, we included the data.
We included the following antidepressants as classified by the World Health Organization (WHO) Anatomical, Therapeutic and Chemical (ATC) classification system and the Defined Daily Dose (DDD) (WHO ATC/DDD) system (WHO 2003).
Tricyclic antidepressants (TCAs): amitriptyline, amoxapine, clomipramine, desipramine, dosulepin/dothiepin, doxepin, imipramine, iofepramine, maprotiline, nortriptyline, protriptyline , trimipramine, any other agent.
Selective serotonin reuptake inhibitors (SSRIs): fluoxetine, fluvoxamine, sertraline, citalopram, paroxetine, escitalopram, any other agent.
Monomine oxidase inhibitors (MAOIs: phenelzine, isocarboxazide, tranylcypromine, moclobemide, brofaromine, any other agent.
Serotonin‐noradrenaline reuptake Inhibitors (SNRIs): venlafaxine, desvenlafaxine, duloxetine, milnacipran, any other agent.
Noradrenergic and specific serotonergic antidepressants (NaSSAs): mirtazapine, any other agent
Noradrenergic and dopaminergic reuptake inhibitors: bupropion, any other agent.
Noradrenergic reuptake inhibitors: reboxetine, any other agent.
Others: agomelatine, trazodone, nefazodone, mianserin, maprotiline, any other agent classified as antidepressants according to the WHO ATC/DDD system of non‐conventional herbal products (e.g. Hypericum).
We included the following benzodiazepines: alprazolam, bretazenil, bromazepam, chlordiazepoxide, cinolazepam, clonazepam, cloxazolam, clorazepate, diazepam, estazolam, fludiazepam, flunitrazepam, flurazepam, flutoprazepam, halazepam, ketazolam, loprazolam, lorazepam, medazepam, nimatazepam, nitrazepam, nodazepam, oxazepam, phenazepam, pinazepam, prazepam, premazepam, quazepam, temazepam, tetrazepam, triazolam.
We excluded studies in which regular use of benzodiazepines was allowed in addition to the study medications; studies where irregular use of benzodiazepines was allowed were included, but the effect of including these participants was examined in sensitivity analyses (Sensitivity analysis). We applied no restrictions on dose, frequency, intensity or duration.
We also excluded studies administering psychosocial therapies targeted at panic disorder delivered concurrently with medication.
Types of outcome measures
Primary outcomes
Failure to respond, i.e. lacking of substantial improvement from baseline as defined by the original investigators. Examples of improvement would be “very much or much improved” according to the Clinical Global Impressions Scale, more than 40% reduction in the Panic Disorder Severity Scale score (which is considered as equivalent to "very much or much improved" on the Clinical Global Impression of Improvement Scale (Furukawa 2009), and more than 50% reduction in the Fear Questionnaire Agoraphobia Subscale (which is considered as an appropriate rate of response according to Bandelow 2006). For this outcome we calculated the number of patients who fail to meet these improvement criteria.
Total number of dropouts for any reason as a proxy measure of treatment acceptability.
Secondary outcomes
Failure to remit, i.e. lacking of satisfactory end‐state as defined by global judgment of the original investigators. Examples of satisfactory end‐state would be "panic free" and "no or minimal symptoms" according to the Clinical Global Impression Severity Scale. For this outcome, we calculated the number of patients who failed to meet these remission criteria.
Panic symptom scales and global judgment on a continuous scale. Examples include Panic Disorder Severity Scale (PDSS) total score (0 to 28), Clinical Global Impression Severity Scale (CGI‐S) (1 to 7), and Clinical Global Impression Change Scale (1 to 7). When multiple measures are used, preference was given in the order as above, with preference given to panic symptom scales. The actual measure entered into meta‐analyses will be indicated at the top of the listings in the 'Characteristics of included studies' section
Frequency of panic attacks, as recorded, for example, by a panic diary
Agoraphobia, as measured, for example, by the Fear Questionnaire (FQ), Mobility Inventory, or behavioural avoidance test
General anxiety, as measured, for example, by the Hamilton Rating Scale for Anxiety (HAMA), Beck Anxiety Inventory, State‐Trait Anxiety Index, Sheehan Patient‐Rated Anxiety Scale, or Anxiety Subscale of Symptom Checklist‐90‐Revised (SCL‐90‐R)
Depression, as measured, for example, by the Hamilton Rating Scale for Depression (HRSD), Beck Depression Inventory (BDI), or Depression Subscale of SCL‐90‐R
Social functioning, as measured, for example, by the Sheehan Disability Scale (SDS), Global Assessment Scale, or Social Adjustment Scale‐Self Report
Quality of life, as measured for example by the 36‐Item Short Form Health Survey (SF‐36) or the 12‐Item Short Form Health Survey (SF‐12)
Patient satisfaction with treatment
Economic costs
Number of dropouts due to adverse effects
Number of patients experiencing at least one adverse effect
Timing of outcome assessment
All outcomes are short‐term outcomes, which we defined as acute phase treatment which normally would last two to six months.
When studies reported outcome data at different time points within two to six months, the time point closest to 12 weeks was given preference.
Hierarchy of outcome measures
When multiple measures were used, preference was given in the order listed above for each outcome.
Search methods for identification of studies
The Cochrane Common Mental Disorders Group maintains a specialised register of randomised controlled trials, the CCMDCTR. This register contains over 40,000 reference records (reports of RCTs) for anxiety disorders, depression, bipolar disorder, eating disorders, self‐harm and other mental disorders within the scope of this Group. The CCMDCTR is a partially studies based register with >50% of reference records tagged to c12,500 individually PICO coded study records. Reports of trials for inclusion in the register are collated from (weekly) generic searches of MEDLINE (1950‐), Embase (1974‐) and PsycINFO (1967‐), quarterly searches of the Cochrane Central Register of Controlled Trials (CENTRAL) and review specific searches of additional databases. Reports of trials are also sourced from international trial registries, drug companies, the hand‐searching of key journals, conference proceedings and other (non‐Cochrane) systematic reviews and meta‐analyses. Details of CCMD's core search strategies (used to identify RCTs) can be found on the Group's web site with an example of the core MEDLINE search displayed in Appendix 1.
Electronic searches
Cochrane Common Mental Disorders Group's specialised register (CCMDCTR)
The Group's Information Specialist searched the CCMDCTR (Studies and References) register to 11 September 2015, using the following search strategy:
CCDANCTR‐Studies Diagnosis = panic
Records were screened for randomised‐controlled trials comparing antidepressants with benzodiazepines, antidepressants with antidepressants or benzodiazepine with benzodiazepine in this population.
CCDANCTR‐References A search of the references register (to identify additional untagged, uncoded reports of RCTs) included a comprehensive list of terms for panic, anxiety disorders not otherwise specified (ADNOS), antidepressants and benzodiazepines, (Appendix 2).
We screened all abstracts for 'antidepressants' as classified by the WHO ATC/DDD system as well as relevant benzodiazepine trials. We obtained full‐text articles, where necessary.
National and international trials registers
We conducted complementary searches on the WHO International Clinical Trials Registry Platform (ICTRP) and ClinicalTrials.gov
Searching other resources
We checked the reference lists of all included studies, non‐Cochrane systematic reviews and major textbooks of affective disorders (written in English), for published reports and citations of unpublished research. We also pursued a citation search via Web of Science (included studies only) to identify additional works. We also contacted experts in the field.
Data collection and analysis
Selection of studies
Two review authors (IB (clinical expertise), CT (methodological expertise)) independently selected studies for inclusion in this systematic review.
Review authors IB and CT inspected the search results by reading the titles and abstracts to see if they met the inclusion criteria. Disagreement was resolved by consultation with the other co‐authors. We obtained full‐text articles for the potentially relevant studies located in the search and both review authors independently assessed them for inclusion and, in the case of discordance, resolution was sought by discussion between all review authors. Where it was not be possible to evaluate the study because of language problems or missing information, we categorised the study as 'study awaiting classification' until a translation or further information could be obtained. We reported the reasons for the exclusion of trials in the Characteristics of excluded studies table.
We documented and presented all decisions made during the selection process, with numbers of studies and references, in a Preferred Reporting Items for Systematic Reviews and Meta‐Analyses (PRISMA) flow diagram (Moher 2009) (Figure 1).
1.
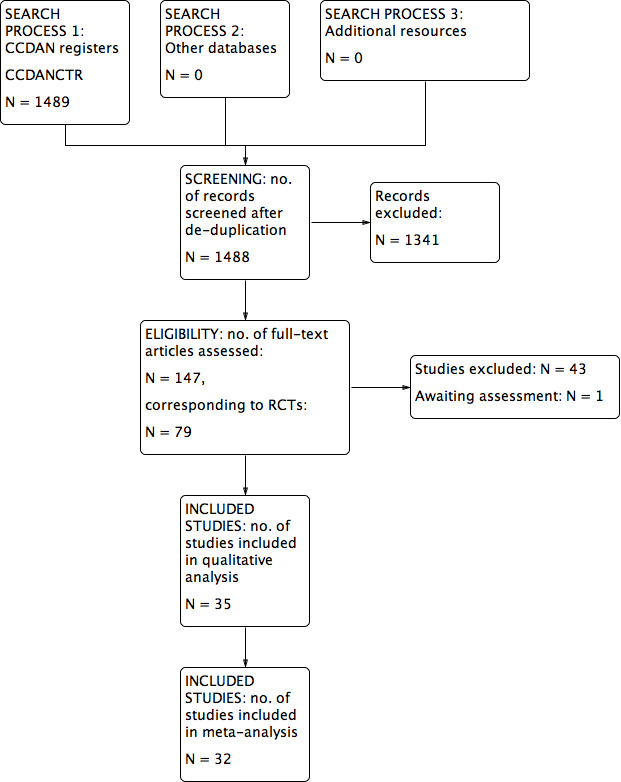
Study flow diagram.
Data extraction and management
Two review authors (IB and CT) used a standardised data extraction form to independently extract data from included studies concerning participant characteristics (age, sex, study setting), intervention details (dosage, duration of study, sponsorship), study characteristics (blinding, allocation etc) and outcome measures of interest. We first piloted this data extraction sheet on a sample of 10% of the included studies. Again, any disagreement was resolved by consensus or by consulting a third review author (CB). If necessary, we contacted authors of studies to obtain clarification.
Our comparisons were as follows (Types of interventions):
A. antidepressants versus benzodiazepines;
B. antidepressants versus antidepressants;
C. individual benzodiazepines versus another benzodiazepine.
We stratified comparison A by class of antidepressant, as per the categories provided in Types of interventions. We also included comparisons of antidepressant classes versus benzodiazepines, to allow the presentation of data about individual antidepressants of each class versus benzodiazepines. For the second comparison, we made the decision to conduct separate comparisons for each class of antidepressant rather than stratify an overall comparison of antidepressant versus antidepressant according to class of drug. For the second comparison we also included individual antidepressants versus another antidepressant of the same class (see Differences between protocol and review.)
Assessment of risk of bias in included studies
Two review authors (IB and CT) independently assessed the risk of bias in included studies using the Cochrane Collaboration's tool for assessing risk of bias as described in the Cochrane Handbook for Systematic Reviews of Interventions (Higgins 2011). This tool encourages consideration of the following domains:
random sequence generation and allocation concealment (selection bias);
blinding of participants and personnel (performance bias);
blinding of outcome assessors (detection bias);
incomplete outcome data reporting (attrition bias);
selective reporting (reporting bias);
other bias (within this domain we will consider things like sponsorship bias).
We assessed and categorised risk of bias, in each domain and overall, as follows:
low risk of bias, plausible bias unlikely to seriously alter the results;
high risk of bias, plausible bias that seriously weakens confidence in the results;
unclear risk of bias, plausible bias that raises some doubt about the results.
In case of disagreement, the final rating was made by consensus, if needed with the involvement of a third author (CB). Where inadequate details of randomisation and other characteristics of trials were provided, we contacted authors of the studies in order to obtain further information. Non‐concurrence in assessment of bias was also reported.
Measures of treatment effect
Our main outcome measure is reduction of severity of panic and agoraphobia symptoms. Symptomatic improvement was usually presented as a change in a panic disorder scale(s) (mean and standard deviation) or as a dichotomous outcome (responder or non‐responder, remitted or not‐remitted), or both.
Dichotomous data
For binary or dichotomous outcomes, we calculated a standard estimation of the risk ratios (RRs) and the corresponding 95% confidence intervals (CIs) using a random‐effects model. It has been shown that a random‐effects model has a good generalisability (Furukawa 2002), and that RRs are easier to understand than odds ratios (ORs) (Boissel 1999). Furthermore, ORs tend to be interpreted as RRs by clinicians (Deeks 2002). This may lead to an overestimation of the impression of the effect (Higgins 2011). For all primary outcomes, we calculated the number needed to treat for an additional beneficial outcome (NNTB) or number needed to treat for an additional harmful outcome (NNTH) and their 95% CIs using Visual Rx (www.nntonline.net/), taking account of the event rate in the control group.
Continuous data
Summary statistics
We assumed a priori that the included studies used varied rating scales; therefore we used standardised mean differences (SMDs). If all included studies used the same measuring instrument, we used mean differences (MDs). We also calculated 95% CIs for each continuous measure.
Endpoint versus change data
Trials usually report results either using endpoint means and standard deviation of scales or using change in mean values from baseline of assessment rating scales. We prefer to use scale endpoint data, which typically cannot have negative values and are easier to interpret from a clinical point of view. If endpoint data were unavailable, we used the change data in separate analyses. In the case we used MDs, we pooled results based on change data and endpoint data in the same analysis.
Unit of analysis issues
Cross‐over trials
Cross‐over trials are trials in which all participants receive both the control and intervention treatment but in a different order. The major problem is a carry‐over effect from the first phase to the second phase of the study, especially if the condition of interest is unstable (Elbourne 2002). As this is the case with panic disorder, we planned to include cross‐over studies, but to use only data up to the point of first cross‐over phase.
Studies with multiple treatment groups
Where a study involved more than two treatment arms, when there were two appropriate dose groups of the same drug, we pooled different dose arms and considered them as one. If the arms involved one or more benzodiazepine arms and/or two or more arms of different classes of antidepressants, we planned to compare each arm separately. To avoid the of unit‐of‐analysis error by double counting the patients of the shared group (Higgins 2011), we planned to divide the shared group evenly among the treatment arms. In accordance to the recommendations in the Cochrane Handbook for Systematic Reviews of Interventions (Higgins 2011), we divided events and number of patients for dichotomous outcomes, while only divided the number of patients for continuous outcomes.
Cluster‐randomised trials
In cluster‐randomised trials, groups of individuals rather than individuals are randomised to different interventions. Had we identified cluster‐RCTs, we planned to use the generic inverse variance technique. We would have checked if such trials have been appropriately analysed taking into account intraclass correlation coefficients to adjust for cluster effects. If trialists have not adjusted for the effects of clustering, we would have attempted to do this by obtaining an intracluster correlation coefficient and then following the guidance given in the Cochrane Handbook for Systematic Reviews of Interventions (Higgins 2011).
Dealing with missing data
We tried to contact the study authors for all relevant missing data.
Dichotomous outcomes
We calculated response, or remission on treatment, using an intention‐to‐treat analysis. We followed the principle of 'once randomised always analysed'. Where participants left the study before the intended endpoint, it was assumed that they would have experienced the negative outcome. The validity of the above assumption was planned to be tested by sensitivity analysis, applying worst and best case scenarios. When dichotomous outcomes were not reported, but the baseline mean and standard deviation on a panic disorder scale were reported, we calculated the number of responding or remitted participants according to a validated imputation method (Furukawa 2005). We analysed the validity of the above approach by sensitivity analysis (Sensitivity analysis). If necessary, we contacted authors of studies to obtain data and/or clarification.
Continuous outcomes
Concerning continuous data, the Cochrane Handbook for Systematic Reviews of Interventions recommends avoiding imputation of continuous data and suggests using the data as presented by the original authors (Higgins 2011). Where intention‐to‐treat data were available, they have been preferred to 'per‐protocol analysis'. If necessary, we contacted authors of studies to obtain data and/or clarification.
Skewed or qualitative data
We planned to present skewed and qualitative data descriptively. We considered several strategies for skewed data. If papers reported a mean and standard deviation and there was also an absolute minimum possible value for the outcome, we planned to divide the mean by the standard deviation. If this was less than two then we concluded that there was some indication of skewness. If it was less than one (that is the standard deviation was bigger than the mean), then there was almost certainly skewness. If papers had not reported the skewness and simply reported means, standard deviations and sample sizes, these numbers were used. Because there was a possibility that these data might not have been properly analysed, and could also be misleading, they were descriptively reported in the results. If the data had been log‐transformed for analysis, and the geometric means were reported, skewness was reduced. This is the recommended method of analysis of skewed data (Higgins 2011). If studies used non‐parametric tests and described averages using medians, they could not be formally pooled in the analysis. We followed the recommendation made in the Cochrane Handbook for Systematic Reviews of Interventions that results of these studies should be reported in a table in our review, along with all other papers. This means that the data were not lost from the review and the results could be considered when drawing conclusions, even if they could not be formally pooled in the analyses.
Missing statistics
When only P or standard error values were reported, we calculated standard deviations (Altman 1996). In the absence of supplementary data after requests to the authors, we calculated the standard deviations according to a validated imputation method (Furukawa 2006). We examined the validity of these imputations in the sensitivity analyses.
Assessment of heterogeneity
We quantified heterogeneity using the I² statistic as per the guidance by the Cochrane Handbook for Systematic Reviews of Interventions (Higgins 2011). We interpreted the I² as follows:
0% to 40%: might not be important;
30% to 60%: may represent moderate heterogeneity;
50% to 90%: may represent substantial heterogeneity;
75% to 100%: considerable heterogeneity.
We also used the Chi² test and its P value to determine the direction and magnitude of the treatment effects. In a meta‐analysis of few trials, Chi² will be underpowered to detect heterogeneity, if it exists. A P value of <0.10 was used as a threshold of statistical significance for the ChI²² test. We also visually assessed the forest plots for evidence of heterogeneity.
Assessment of reporting biases
Reporting biases arise when the dissemination of research findings is influenced by the nature and direction of results (Higgins 2011). A funnel plot is usually used to investigate publication bias. However, it has a limited role when there are only few studies of similar size. Secondly, asymmetry of a funnel plot does not always reflect publication bias. We visually inspected funnel plots to assess publication bias as well as performed statistical test for funnel plot asymmetry as proposed by the Cochrane Handbook for Systematic Reviews of Interventions (Higgins 2011). We did not use funnel plots for outcomes if there were 10 or fewer studies included in the meta‐analysis in question, or if all studies were of similar size.
Data synthesis
We used a random‐effects model to calculate the treatment effects. We preferred the random‐effects model as it takes into account differences between studies even when there is no evidence of statistical heterogeneity It gives a more conservative estimate than the fixed‐effect model. We noted that the random‐effects model gives added weight to small studies, which can either increase or decrease the effect size. We applied a fixed‐effect model, on primary outcomes only, to see whether it markedly changed the effect size.
Subgroup analysis and investigation of heterogeneity
Subgroup analyses are often exploratory in nature and should be interpreted cautiously: firstly, because they often involve multiple analyses leading to false positive results; and secondly, these analyses lack power and are more likely to result in false positive results. Keeping in mind these reservations, and also taking into account the number of available studies, we planned to perform the following subgroup analyses:
participants with agoraphobia versus participants without agoraphobia (because the same treatment may have differential effectiveness with regard to panic and agoraphobia);
acute phase treatment studies that lasted for less than four months versus those that lasted for four months or more.
Sensitivity analysis
We planned to conduct the following sensitivity analyses for the primary outcomes only in order to examine if the results changed and check for the robustness of the observed findings.
Excluding trials with high risk of bias (i.e. trials with inadequate allocation concealment and blinding, with incomplete data reporting and/or with high probability of selective reporting).
Excluding trials with dropout rates greater than 20%.
Excluding studies funded by the pharmaceutical company marketing each antidepressant or benzodiazepine (This sensitivity analysis is particularly important in view of the repeated findings that funding strongly affects outcomes of research studies (Als‐Nielsen 2003; Lexchin 2003; Bhandari 2004), and because industry sponsorship and authorship of clinical trial reports have increased over the last 20 years (Buchkowsky 2004)).
Excluding studies whose participants clearly have significant psychiatric co‐morbidities including primary or secondary depressive disorders.
Excluding studies mostly focused on agoraphobia.
Applying best and worst case scenarios to studies where participants left the study before the endpoint.
Excluding studies where responding or remitted participants are calculated according to an imputation method.
Excluding studies where irregular benzodiazepine use was allowed after the first 15 days after random allocation.
Summary of findings
We summarised the findings using a 'Summary of findings' table, applying the Grading of Recommendations Assessment, Development and Evaluation (GRADE) approach (Higgins 2011).
We included the following outcomes in the 'Summary of findings' tables:
response;
total number of dropouts;
remission;
panic symptom scales and global judgment on a continuous scale;
number of dropouts due to adverse effects.
Results
Description of studies
Results of the search
The number of references identified by the searches (last update September 2015) was 1489, of which 1488 remained after de‐duplication. We excluded 1341 references after assessment of titles and abstracts. We retrieved 147 full‐text articles for full inspection, describing 79 randomised controlled trials (RCTs). Of these, 43 studies were excluded, and one study was placed in the awaiting assessment group. Finally, 35 studies including 6785 participants, 5365 for the arms of interest (described in 84 reports) were included in the review. In case of missing information, we contacted authors of the included studies for additional information, and three of them responded (Drs. Bandelow, Lavori, and Stahl). See Figure 1 for a PRISMA flow diagram (Moher 2009) depicting the study selection process.
Included studies
Thirty‐five studies were included in this review, with characteristics as follows (see also Characteristics of included studies).
Design
Thirty‐four of the 35 included studies were parallel‐group, individually‐randomised controlled trials. One study (Sasson 1999) with a cross‐over design reported only aggregated results on the two active treatment phases (before and after cross‐over); therefore these data could not be included in the meta‐analysis.
Sample sizes
The sample sizes ranged between seven (Sheikh 1999) and 391 (CNCPS 1992) participants in each arm. Fifteen studies included overall sample sizes over 100: Bandelow 2004 (n = 225), CNCPS 1992 (n = 1168), GSK‐29060/1 (n = 226), Holland 1999 (n = 315), Krueger 1999 (n = 135), Lecrubier 1997 (n = 368), Nair 1996 (n = 148), Noyes 1996 (n = 238), Pfizer 2008 (n = 319), Pollack 2007a (n = 653), Pollack 2007b (n = 663), Schweizer 1993 (n = 106); Stahl 2003 (n = 380), Tiller 1999 (n = 366), Wade 1997 (n = 379).
Setting
A total of 19 trials enrolled only outpatients, one trial enrolled only inpatients, and both inpatients and outpatients were enrolled in three trials. For the remaining 12 trials the setting was unclear. Nine trials were conducted in the USA, four in the Netherlands, three in Italy, two in Canada, two in Brazil, two in China, one in UK, one in Finland, one in Japan, and one in Israel; seven trials were multinational, and two did not provide information about the country.
Participants
The proportion of women ranged from 36% to 92%. Mean age ranged from 30.5 to 61.6 years.
Interventions
Eighteen studies included two arms, while the remaining studies had three or more arms. Nine trials included a comparison between antidepressants and benzodiazepines, 22 between individual antidepressants (including four comparisons between antidepressants of the same class), and four trials between individual benzodiazepines. Fifteen studies had a placebo arm.
Duration of the intervention ranged from three to 24 weeks.
Outcomes
Seventeen studies reported data on response rates, while the number of dropout for any reason was reported in 28 studies. Fourteen studies reported on remission rates. Sixteen studies reported data on panic symptoms (using Panic and Anticipatory Anxiety Scale (PAAS), Panic Disorder Severity Scale (PDSS), Clinical Global Impression Severity of Illness Score (CGI‐S)), 15 on frequency of panic attacks, 10 on agoraphobia (using Fear Questionnaire (FQ) and Marks‐Sheehan Phobia Scale), 26 on general anxiety (using Hamilton Anxiety Rating Scale (HAS) and Hamilton Rating Scale for Anxiety (HAMA)), 17 on depression (using Hamilton Rating Scale for Depression (HRSD), Beck Depression Inventory (BDI), Montgomery–Åsberg Depression Rating Scale (MADRS)). SIx studies reported data on social functioning (using Sheehan Disability Scale (SDS)), three on quality of life. None of the studies reported on patient satisfaction and economic costs. Twenty‐one studies had data on dropouts due to adverse effects, and 11 on the number of patients experiencing at least one adverse effect.
Excluded studies
See: Characteristics of excluded studies.
Sixty‐seven articles, initially selected (corresponding to 43 studies), did not meet our inclusion criteria and were excluded, for the following reasons: 19 had a wrong study design; four trials included patients who were not primarily diagnosed with panic disorder; five studies included participants with anxiety disorders in general, but the randomisation was not stratified by the presence of panic disorder; 15 studies had a wrong comparison group.
Ongoing studies
See: Characteristics of ongoing studies.
Our search identified no ongoing studies.
Studies awaiting classification
See Characteristics of studies awaiting classification.
Only one study (Minutentag 2001) was classified as "awaiting classification".
Risk of bias in included studies
For details of the 'Risk of bias' judgements for each study, see Characteristics of included studies. Graphical representations of the overall risk of bias in included studies are presented in Figure 2 and Figure 3.
2.
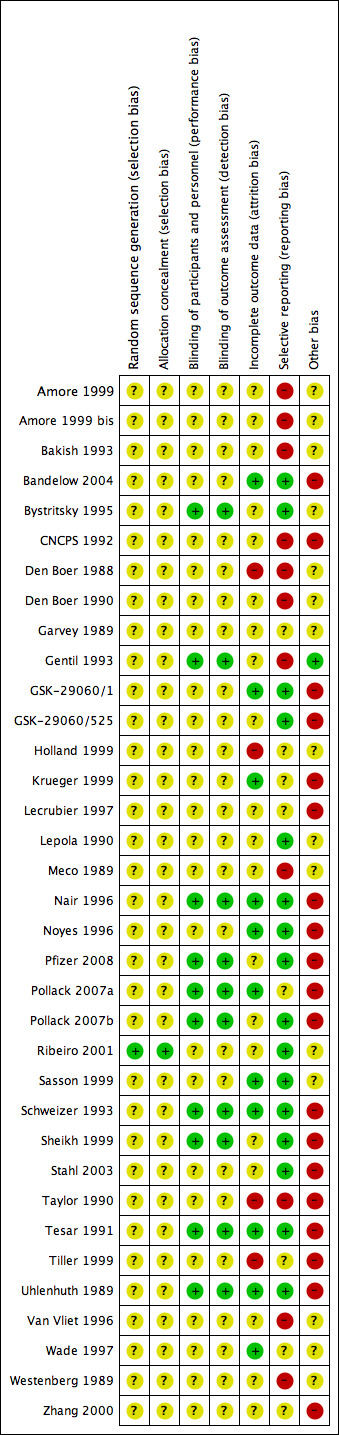
'Risk of bias' summary: review authors' judgements about each risk of bias item for each included study.
3.
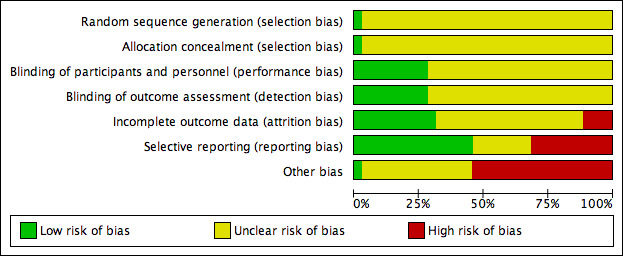
'Risk of bias' graph: review authors' judgements about each risk of bias item presented as percentages across all included studies.
Allocation
Random sequence generation
Thirty‐four of the studies did not report the methods of random sequence generation; only one study (Ribeiro 2001) specified this information, and it was classified as "low risk".
Allocation concealment
Only one study (Ribeiro 2001) reported details on allocation concealment and was classified as "low risk".
Blinding
Twenty‐five RCTs were reported to be double‐blind, without providing any further detail; 10 RCTs reported details on strategies to ensure blinding of participants and key study personnel, and were classified as "low risk".
Incomplete outcome data
Eleven trials were rated as adequate in terms of addressing incomplete outcome data, while 20 studies were classified as "unclear risk" and four as "high risk".
Selective reporting
The study protocol was not available for almost all studies so it is difficult to make a judgment on the possibility of outcome reporting bias. However, in 16 studies results were consistent with the outcomes pre‐specified in the methods section, and they were evaluated as "low risk"; using the same criterion, 11 studies were judged to be at "high risk".
Other potential sources of bias
Nineteen of the included studies were funded by the pharmaceutical industry, and they did not report details on the role of the funder in planning, conducting and writing the study; for this reason they were rated as "high risk". Fifteen did not specify the source of funding. One study (Gentil 1993) was classified as "low risk".
Effects of interventions
See: Table 1; Table 2; Table 3; Table 4; Table 5; Table 6; Table 7; Table 8
A: Antidepressants versus benzodiazepines
We found data only for the comparisons reported below.
Comparison 1: Antidepressants versus benzodiazepines
Eight studies including 2055 participants (CNCPS 1992; GSK‐29060/1; Holland 1999; Lepola 1990; Schweizer 1993; Sheikh 1999; Taylor 1990; Uhlenhuth 1989) provided data for at least one outcome for this comparison. See also: Table 1; Table 2; Table 3.
Primary outcomes
1.1 Failure to respond
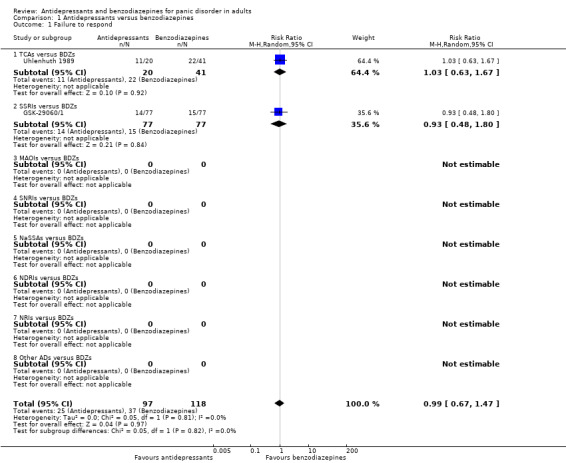
We found low‐quality evidence that cannot inform us as to whether there is a difference between antidepressants and benzodiazepines in terms of response rate. Confidence interval ranges from appreciable benefit with antidepressants to appreciable benefit with benzodiazepines (risk ratio (RR) 0.99, 95% confidence interval (CI) 0.67 to 1.47; participants = 215; studies = 2; I2 = 0%) (Analysis 1.1). There was consistency between study results. Risk of bias was considered unclear for this outcome. Additionally, the comparisons of tricyclic antidepressants (TCAs) versus benzodiazepines (RR 1.02, 95% CI 0.63 to 1.67; participants = 61; studies = 1; very low‐quality evidence) and selective serotonin reuptake inhibitors (SSRIs) versus benzodiazepines (RR 0.93, 95% CI 0.48 to 1.80; participants = 154; studies = 1; very low‐quality evidence) did not show any difference (Figure 4).
1.1. Analysis.
Comparison 1 Antidepressants versus benzodiazepines, Outcome 1 Failure to respond.
4.

Forest plot of comparison: 1 Antidepressants versus benzodiazepines, outcome: 1.1 Failure to respond.
1.2 Total number of dropouts
In terms of participants who dropped out due to any cause, very low‐quality evidence suggested a benefit of benzodiazepines compared to antidepressants. However, the wide confidence interval ranges from almost no difference to benefit with benzodiazepines (RR 1.64, 95% CI 1.03 to 2.63; participants = 1449; studies = 7), and the degree of heterogeneity in the studies considered was considerable (I2 = 75%) (Analysis 1.2). In comparison with benzodiazepines, more participants receiving the SSRIs dropped out due to any cause (RR 1.71, 95% CI 1.03 to 2.84; participants = 154; studies = 1; very low‐quality evidence) (the magnitude of effect corresponds to a NNTH of 7, 95% CI 152 to 3), while no difference was detected between TCAs and benzodiazepines (RR 1.67, 95% CI 0.93 to 2.99; participants = 1295; studies = 6; very low‐quality evidence), with a considerable heterogeneity (I² = 79%), (Analysis 1.2). Risk of bias was considered unclear for this outcome, but the majority of the studies were rated as high risk for "other bias" because they were funded by pharmaceutical companies (Figure 5).
1.2. Analysis.
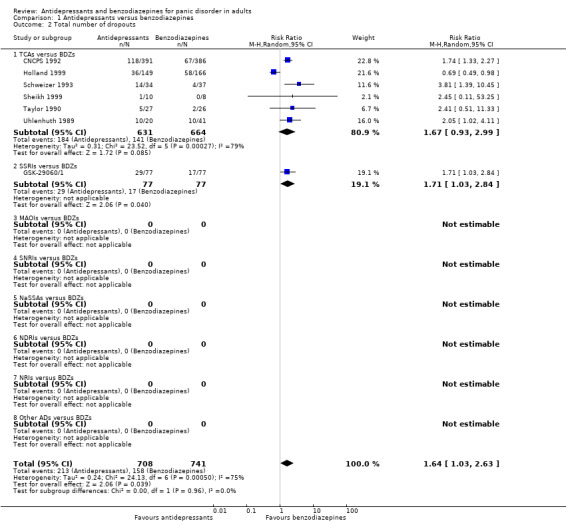
Comparison 1 Antidepressants versus benzodiazepines, Outcome 2 Total number of dropouts.
5.
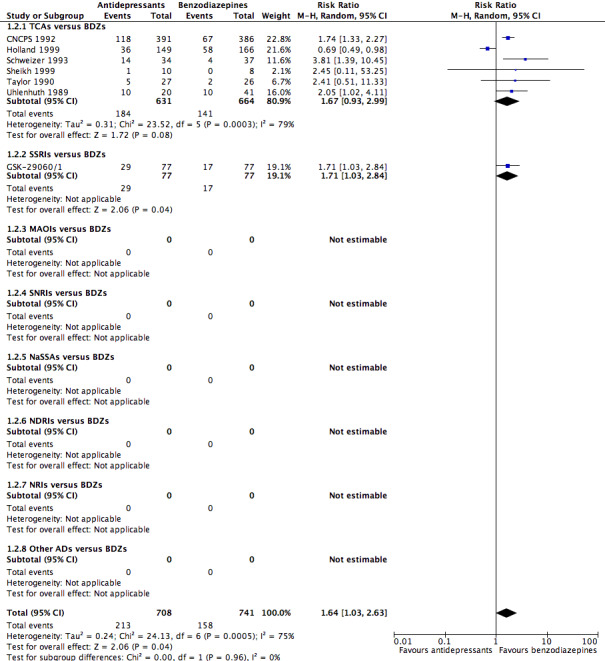
Forest plot of comparison: 1 Antidepressants versus benzodiazepines, outcome: 1.2 Total number of dropouts.
Secondary outcomes
1.3 Failure to remit
We found moderate‐quality evidence suggesting no difference in terms of remission rate between antidepressants and benzodiazepines (RR 1.18, 95% CI 1.01 to 1.37; participants = 1002; studies = 3), TCAs and benzodiazepines (RR 1.19, 95% CI 1.00 to 1.41; participants = 848; studies = 2 moderate‐quality evidence) and SSRIs versus benzodiazepines (RR 1.12, 95% CI 0.79 to 1.59; participants = 154; studies = 1; I² = 0%, very low‐quality evidence) (Analysis 1.3). Risk of bias was considered unclear for this outcome, but the majority of the studies were rated as high risk for "other bias" because they were funded by pharmaceutical companies.
1.3. Analysis.

Comparison 1 Antidepressants versus benzodiazepines, Outcome 3 Failure to remit.
1.4 Panic symptoms ‐ endpoint score
We found very low‐quality evidence suggesting no difference between antidepressants and benzodiazepines (mean difference (MD) ‐0.13, 95% CI ‐1.06 to 0.80; participants = 1144; studies = 3), with a substantial degree of heterogeneity (I² = 95%), no difference between TCAs and benzodiazepines (mean difference (MD) ‐0.25, 95% CI ‐1.72 to 1.22; participants = 998; studies = 2; I2 = 97%, low‐quality evidence) and between SSRIs and benzodiazepines (mean difference (MD) 0.10, 95% CI ‐0.34 to 0.54; participants = 146; studies = 1, low‐quality evidence) (Analysis 1.4). Risk of bias was considered between unclear and high for this outcome, with two studies rated as high risk for "other bias" because they were funded by pharmaceutical companies. For one study included in the analysis there was some indication of skewness (Holland 1999).
1.4. Analysis.
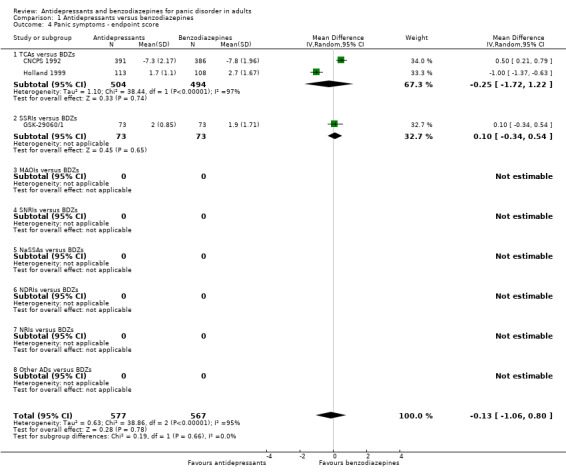
Comparison 1 Antidepressants versus benzodiazepines, Outcome 4 Panic symptoms ‐ endpoint score.
1.5 Panic symptoms ‐ mean change
We found low‐quality evidence showing a benefit for benzodiazepines over placebo in reducing panic symptoms measured as change from baseline on a continuous measure (MD 0.40, 95% CI ‐0.83 to 1.63; participants = 44; studies = 1) (Analysis 1.5). The only study contributing to this analysis was about TCAs.
1.5. Analysis.

Comparison 1 Antidepressants versus benzodiazepines, Outcome 5 Panic symptoms ‐ mean change.
1.6 Frequency of panic attacks
We did not find any difference between antidepressants and benzodiazepines (MD 0.33, 95% CI ‐0.72 to 1.38; participants = 595; studies = 7) , with a substantial heterogeneity (I² = 65%), TCAs and benzodiazepines (MD 0.30, 95% CI ‐0.81 to 1.41; participants = 458; studies = 6) , also with substantial heterogeneity (I² = 71%), SSRIs and benzodiazepines (MD 1.20, 95% CI ‐3.31 to 5.71; participants = 137; studies = 1) in terms of frequency of panic attacks (Analysis 1.6). Risk of bias was considered unclear for this outcome, but the majority of the studies were rated as high risk for "other bias" because they were funded by pharmaceutical companies. For some studies included in the analysis there was some indication of skewness (Holland 1999; Lepola 1990; Schweizer 1993; Sheikh 1999; Uhlenhuth 1989).
1.6. Analysis.
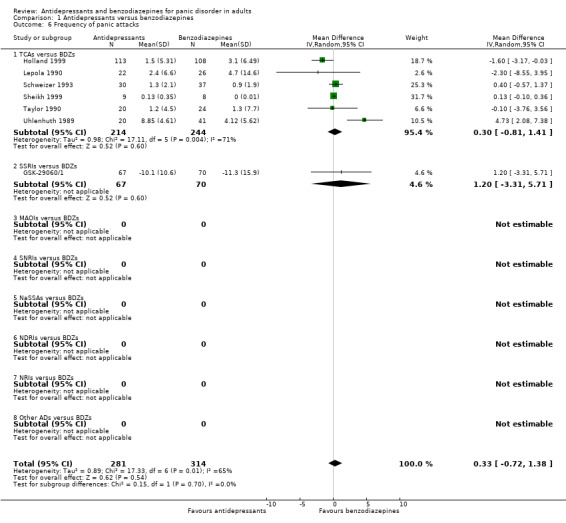
Comparison 1 Antidepressants versus benzodiazepines, Outcome 6 Frequency of panic attacks.
1.7 Agoraphobia
For this outcome, we observed no difference between antidepressants and benzodiazepines (SMD 0.04, 95% CI ‐0.08 to 0.16; participants = 1061; studies = 5; I2 = 0%) (Analysis 1.7). Risk of bias was considered unclear for this outcome, but all the studies were rated as high risk for "other bias" because they were funded by pharmaceutical companies.
1.7. Analysis.
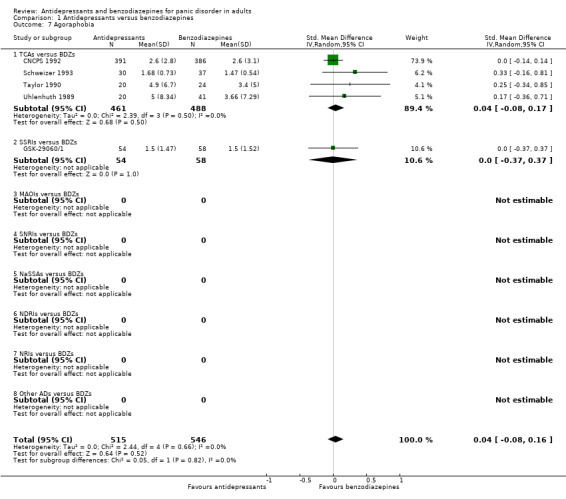
Comparison 1 Antidepressants versus benzodiazepines, Outcome 7 Agoraphobia.
1.8 General anxiety
We found no difference between antidepressants and benzodiazepines (SMD 0.06, 95% CI ‐0.25 to 0.37; participants = 1365; studies = 8), TCAs and benzodiazepines (SMD 0.08, 95% CI ‐0.28 to 0.45; participants = 1238; studies = 7), SSRIs and benzodiazepines (SMD ‐0.08, 95% CI ‐0.42 to 0.27; participants = 127; studies = 1) on general anxiety (Analysis 1.8). Heterogeneity for antidepressants compared to benzodiazepines and TCAs compared to benzodiazepines was considerable (I² = 81% and I² = 83%). Risk of bias was considered unclear for this outcome, but the majority of the studies were rated as high risk for "other bias" because they were funded by pharmaceutical companies. For some studies included in the analysis, there was some indication of skewness (CNCPS 1992; GSK‐29060/1; Holland 1999; Lepola 1990; Schweizer 1993; Uhlenhuth 1989).
1.8. Analysis.

Comparison 1 Antidepressants versus benzodiazepines, Outcome 8 General anxiety.
1.9 Depression
The analyses did not show a difference in favour of antidepressants over benzodiazepines (SMD ‐0.14, 95% CI ‐0.29 to 0.02; participants = 892; studies = 6; I2 = 7%). . The SSRIs were more effective than benzodiazepines (SMD ‐0.46, 95% CI ‐0.81 to ‐0.11; participants = 127; studies = 1) in terms of depressive measures, while the TCAs were not different from benzodiazepines (SMD ‐0.08, 95% CI ‐0.22 to 0.06; participants = 765; studies = 5; I² = 0%) (Analysis 1.9). Risk of bias was considered unclear for this outcome, but the majority of the studies were rated as high risk for "other bias" because they were funded by pharmaceutical companies. For some studies included in the analysis there was some indication of skewness (CNCPS 1992; GSK‐29060/1; Lepola 1990; Sheikh 1999; Uhlenhuth 1989). This analysis found a substantial subgroup difference (I² = 73.7%, P = 0.05) between TCAs and SSRIs.
1.9. Analysis.

Comparison 1 Antidepressants versus benzodiazepines, Outcome 9 Depression.
1.10 Social functioning
We found no difference between antidepressants and benzodiazepines in this outcome, with a moderate heterogeneity (I² = 57%) (SMD 0.16, 95% CI ‐0.12 to 0.44; participants = 1007; studies = 4). In terms of drug classes, benzodiazepines were more effective than TCAs (SMD 0.23, 95% CI 0.03 to 0.42; participants = 882; studies = 3; I2 = 14%), while SSRIs were not different from benzodiazepines (SMD ‐0.22, 95% CI ‐0.57 to 0.13; participants = 125; studies = 1) (Analysis 1.10). Risk of bias was considered unclear for this outcome, but all the studies were rated as high risk for "other bias" because they were funded by pharmaceutical companies. This analysis found a substantial subgroup difference (I² = 73.4%, P = 0.05) between TCAs and SSRIs.
1.10. Analysis.
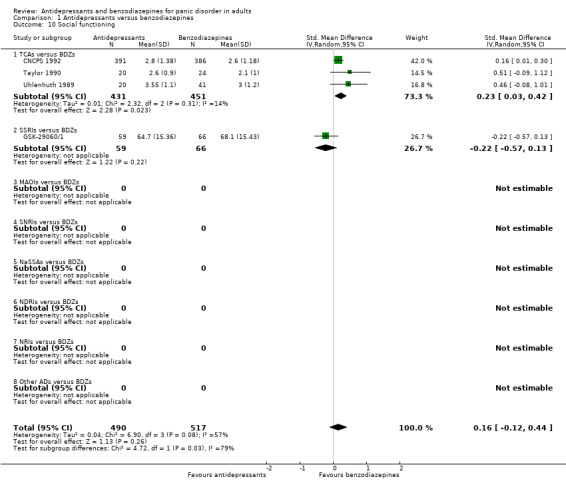
Comparison 1 Antidepressants versus benzodiazepines, Outcome 10 Social functioning.
1.11 Quality of life
No studies provided data for this outcome.
1.12 Patient satisfaction
No studies provided data for this outcome.
1.13 Economic costs
No studies provided data for this outcome.
1.14 Number of dropouts due to adverse effects
In terms of dropouts due to adverse effects, we found low‐quality evidence that benzodiazepines were better tolerated than antidepressants as a whole (RR 1.72, 95% CI 1.03 to 2.87; participants = 1002; studies = 3; I² = 13%). The magnitude of effect corresponds to a NNTH of 27 (95% CI 642 to 11). In addition, low‐quality evidence suggested that the TCAs were better tolerated than benzodiazepines (RR 2.10, 95% CI 1.13 to 3.93; participants = 848; studies = 2; I² = 8%), with a magnitude of effect of NNTH = 24 (95% CI 203 to 9), while the SSRIs were similarly tolerated in comparison with benzodiazepines (RR 1.20, 95% CI 0.55 to 2.61; participants = 154; studies = 1; I² = 0%, very low‐quality evidence) (Analysis 1.14). Risk of bias was considered unclear for this outcome, but all the studies were rated as high risk for "other bias" because they were funded by pharmaceutical companies.
1.14. Analysis.
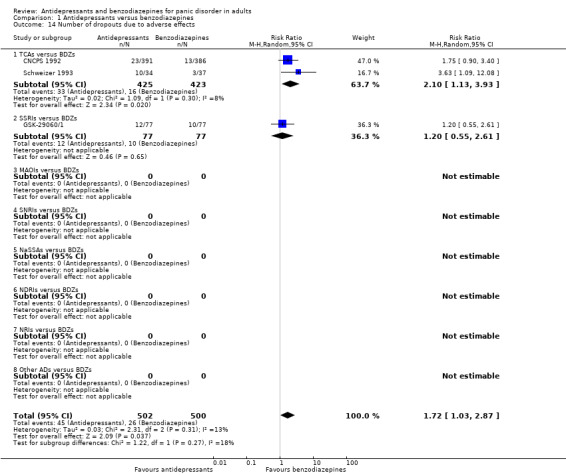
Comparison 1 Antidepressants versus benzodiazepines, Outcome 14 Number of dropouts due to adverse effects.
1.15 Number of patients experiencing at least one adverse effect
Only one study provided data for this outcome, showing no difference between antidepressants (SSRIs) and benzodiazepines (RR 1.03, 95% CI 0.92 to 1.15; participants = 154; studies = 1) (Analysis 1.15). Risk of bias was considered unclear for this outcome, but the study was rated as high risk for "other bias" because it was funded by a pharmaceutical company.
1.15. Analysis.
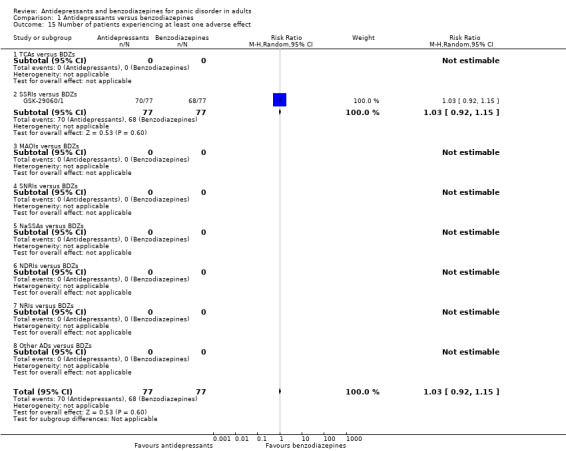
Comparison 1 Antidepressants versus benzodiazepines, Outcome 15 Number of patients experiencing at least one adverse effect.
Comparison 2: TCAs versus benzodiazepines
Seven studies including 1829 participants provided data for this comparison. Six studies compared imipramine with alprazolam (CNCPS 1992; Lepola 1990; Schweizer 1993; Sheikh 1999; Taylor 1990; Uhlenhuth 1989), and one study compared clomipramine with adinazolam (Holland 1999). See also: Table 2.
Primary outcomes
2.1 Failure to respond
The comparison between imipramine and benzodiazepines did not show a difference in terms of response rate (RR 1.02, 95% CI 0.63 to 1.67; participants = 61; studies = 1) (Analysis 2.1). Risk of bias was considered unclear for this outcome, but the study was rated as high risk for "other bias" because it was funded by a pharmaceutical company.
2.1. Analysis.
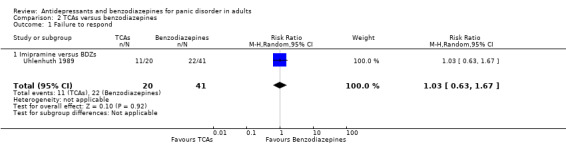
Comparison 2 TCAs versus benzodiazepines, Outcome 1 Failure to respond.
2.2 Total number of dropouts
Imipramine was less well tolerated than benzodiazepines (RR 1.87, 95% CI 1.47 to 2.37; participants = 980; studies = 5; I² = 0%) (NNTH = 7, 95% CI 13 to 5), while there was a difference favouring clomipramine over benzodiazepines for this outcome (RR 0.69, 95% CI 0.49 to 0.98; participants = 315; studies = 1; I² = 0%) (NNTH = 10, 95% CI 6 to 143) (Analysis 2.2). Risk of bias was considered unclear for this outcome, but the majority of the studies were rated as high risk for "other bias" because of funding by pharmaceutical companies.
2.2. Analysis.
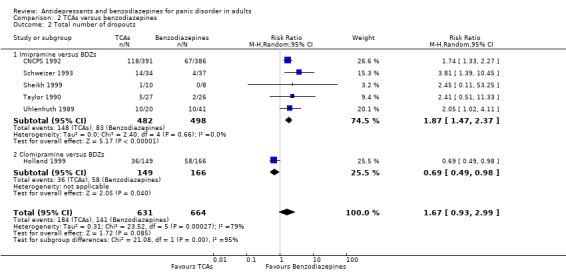
Comparison 2 TCAs versus benzodiazepines, Outcome 2 Total number of dropouts.
Secondary outcomes
2.3 Failure to remit
The analysis failed to detect a difference between imipramine and benzodiazepines on remission rates (RR 1.19, 95% CI 1.00 to 1.41; participants = 848; studies = 2; I² = 0%). Risk of bias was considered unclear for this outcome, but the studies were rated as high risk for "other bias" because they were funded by pharmaceutical companies.
2.4 Panic symptoms ‐ endpoint score
One study showed a benefit for benzodiazepines over imipramine in reducing panic symptoms measured as endpoint scores (MD 0.50, 95% CI 0.21 to 0.79; participants = 777), whereas one study showed a benefit for clomipramine over benzodiazepines (MD ‐1.00, 95% CI ‐1.37 to ‐0.63; participants = 221) (Analysis 2.4). Risk of bias was considered unclear for this outcome.
2.4. Analysis.

Comparison 2 TCAs versus benzodiazepines, Outcome 4 Panic symptoms ‐ endpoint score.
2.5 Panic symptoms ‐ mean change
Measuring mean change in panic symptoms, we found no difference between imipramine and benzodiazepines (MD 0.40, 95% CI ‐0.83 to 1.63; participants = 44; studies = 1) (Analysis 2.5). Risk of bias was considered high for this outcome, and the study was rated as high risk for "other bias" because of funding from a pharmaceutical company.
2.5. Analysis.
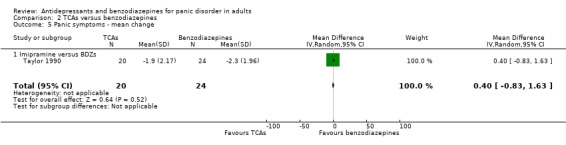
Comparison 2 TCAs versus benzodiazepines, Outcome 5 Panic symptoms ‐ mean change.
2.6 Frequency of panic attacks
We found no difference in this outcome for the comparisons between imipramine and benzodiazepines, with a substantial heterogeneity (I² = 67%) (MD 0.75, 95% CI ‐0.44 to 1.94; participants = 237; studies = 5), while clomipramine was more effective than benzodiazepines for this outcome (MD ‐1.60, 95% CI ‐3.17 to ‐0.03; participants = 221; studies = 1) (Analysis 2.6). Risk of bias was considered unclear for this outcome, but the majority of the studies were rated as high risk for "other bias" because of funding by pharmaceutical companies.
2.6. Analysis.

Comparison 2 TCAs versus benzodiazepines, Outcome 6 Frequency of panic attacks.
2.7 Agoraphobia
In terms of agoraphobia, we found no difference between imipramine and benzodiazepines (SMD 0.04, 95% CI ‐0.08 to 0.17; participants = 949; studies = 4; I² = 0%) (Analysis 2.7). Risk of bias was considered unclear for this outcome, but all the studies were rated as high risk for "other bias" because they were funded by pharmaceutical companies.
2.7. Analysis.

Comparison 2 TCAs versus benzodiazepines, Outcome 7 Agoraphobia.
2.8 General anxiety
For this outcome, we found a difference in favour of benzodiazepines over imipramine (SMD 0.22, 95% CI 0.10 to 0.35; participants = 1017; studies = 6; I² = 0%), and in favour of clomipramine over benzodiazepines (SMD ‐0.67, 95% CI ‐0.94 to ‐0.40; participants = 221; studies = 1) (Analysis 2.8). Risk of bias was considered unclear for this outcome, but the majority of the studies were rated as high risk for "other bias" because they were funded by pharmaceutical companies.
2.8. Analysis.

Comparison 2 TCAs versus benzodiazepines, Outcome 8 General anxiety.
2.9 Depression
We did not find any difference between imipramine and benzodiazepines in this outcome (SMD ‐0.08, 95% CI ‐0.22 to 0.06; participants = 765; studies = 5; I² = 0%) (Analysis 2.9). Risk of bias was considered unclear for this outcome, but the majority of the studies were rated as high risk for "other bias" because they were funded by pharmaceutical companies.
2.9. Analysis.

Comparison 2 TCAs versus benzodiazepines, Outcome 9 Depression.
2.10 Social functioning
We found a difference in favour of benzodiazepines over imipramine for this outcome (MD 0.25, 95% CI 0.09 to 0.42; participants = 882; studies = 3; I² = 0%) (Analysis 2.10). Risk of bias was considered between unclear and high for this outcome, and the studies were rated as high risk for "other bias" because they were funded by pharmaceutical companies.
2.10. Analysis.
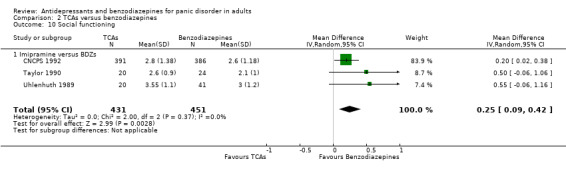
Comparison 2 TCAs versus benzodiazepines, Outcome 10 Social functioning.
2.11 Quality of life
No studies provided data for this outcome.
2.12 Patient satisfaction
No studies provided data for this outcome.
2.13 Economic costs
No studies provided data for this outcome.
2.14 Number of dropouts due to adverse effects
We found that benzodiazepines were better tolerated than imipramine (RR 2.10, 95% CI 1.13 to 3.93; participants = 848; studies = 2; I² = 8%) (Analysis 2.14). Risk of bias was considered unclear for this outcome, but all the studies were rated as high risk for "other bias" because they were funded by pharmaceutical companies.
2.14. Analysis.

Comparison 2 TCAs versus benzodiazepines, Outcome 14 Number of dropouts due to adverse effects.
2.15 Number of patients experiencing at least one adverse effect
No studies provided data for this outcome.
Comparison 3: SSRIs versus benzodiazepines
One study including 226 participants (GSK‐29060/1) provided data for this comparison. The trial compared paroxetine versus alprazolam. See also: Table 3.
Primary outcomes
3.1 Failure to respond
This comparison did not show any difference in terms of response rate (RR 0.93, 95% CI 0.48 to 1.80; participants = 154; studies = 1) (Analysis 3.1). Risk of bias was considered unclear for this outcome, but the study was rated as high risk for "other bias" because it was funded by a pharmaceutical company.
3.1. Analysis.
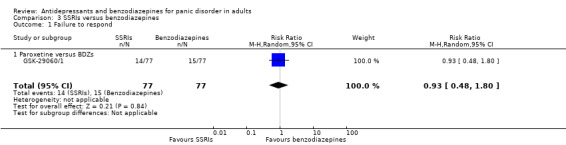
Comparison 3 SSRIs versus benzodiazepines, Outcome 1 Failure to respond.
3.2 Total number of dropouts
There was evidence that paroxetine is less well tolerated than benzodiazepines (RR 1.71, 95% CI 1.03 to 2.84; participants = 154; studies = 1) (Analysis 3.2). Risk of bias was considered unclear for this outcome, but the study was rated as high risk for "other bias" because it was funded by a pharmaceutical company.
3.2. Analysis.
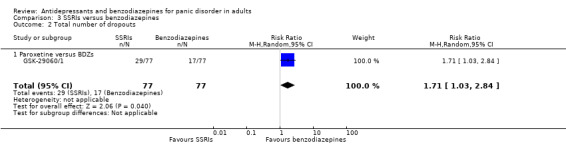
Comparison 3 SSRIs versus benzodiazepines, Outcome 2 Total number of dropouts.
Secondary outcomes
3.3 Failure to remit
We did not find any difference in terms of remission rate between paroxetine and benzodiazepines (RR 1.12, 95% CI 0.79 to 1.59; participants = 154; studies = 1) (Analysis 3.3). Risk of bias was considered unclear for this outcome, but the study was rated as high risk for "other bias" because it was funded by a pharmaceutical company.
3.3. Analysis.

Comparison 3 SSRIs versus benzodiazepines, Outcome 3 Failure to remit.
3.4 Panic symptoms
We did not find any difference in terms of panic symptoms between paroxetine and benzodiazepines (MD 0.10, 95% CI ‐0.34 to 0.54; participants = 146; studies = 1) (Analysis 3.4). Risk of bias was considered unclear for this outcome, but the study was rated as high risk for "other bias" because it was funded by a pharmaceutical company.
3.4. Analysis.
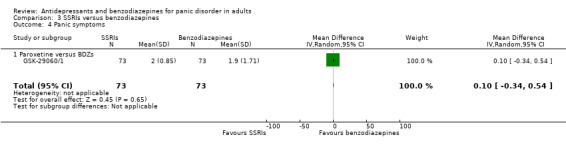
Comparison 3 SSRIs versus benzodiazepines, Outcome 4 Panic symptoms.
3.5 Frequency of panic attacks
We did not find any difference in this outcome between paroxetine and benzodiazepines (MD 1.20, 95% CI ‐3.31 to 5.71; participants = 137; studies = 1) (Analysis 3.5). Risk of bias was considered unclear for this outcome, but the study was rated as high risk for "other bias" because it was funded by a pharmaceutical company.
3.5. Analysis.

Comparison 3 SSRIs versus benzodiazepines, Outcome 5 Frequency of panic attacks.
3.6 Agoraphobia
We did not find any difference in this outcome between paroxetine and benzodiazepines (SMD 0.00, 95% CI ‐0.37 to 0.37; participants = 112; studies = 1) (Analysis 3.6). Risk of bias was considered unclear for this outcome, but the study was rated as high risk for "other bias" because it was funded by a pharmaceutical company.
3.6. Analysis.
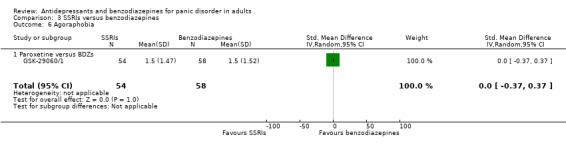
Comparison 3 SSRIs versus benzodiazepines, Outcome 6 Agoraphobia.
3.7 General anxiety
We did not find any difference in terms of general anxiety between paroxetine and benzodiazepines (MD ‐0.60, 95% CI ‐3.35 to 2.15; participants = 127; studies = 1) (Analysis 3.7). Risk of bias was considered unclear for this outcome, but the study was rated as high risk for "other bias" because it was funded by a pharmaceutical company.
3.7. Analysis.
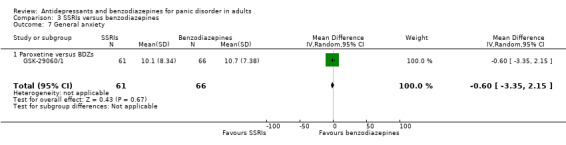
Comparison 3 SSRIs versus benzodiazepines, Outcome 7 General anxiety.
3.8 Depression
We found a difference favouring paroxetine over benzodiazepines in terms of depression (MD ‐3.60, 95% CI ‐6.36 to ‐0.84; participants = 127; studies = 1) (Analysis 3.8). Risk of bias was considered unclear for this outcome, but the study was rated as high risk for "other bias" because it was funded by a pharmaceutical company.
3.8. Analysis.

Comparison 3 SSRIs versus benzodiazepines, Outcome 8 Depression.
3.9 Social functioning
We did not find any difference in this outcome between paroxetine and benzodiazepines (MD ‐3.40, 95% CI ‐8.81 to 2.01; participants = 125; studies = 1) (Analysis 3.9). Risk of bias was considered unclear for this outcome, but the study was rated as high risk for "other bias" because it was funded by a pharmaceutical company.
3.9. Analysis.
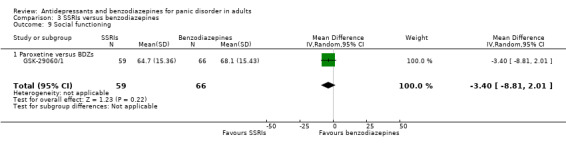
Comparison 3 SSRIs versus benzodiazepines, Outcome 9 Social functioning.
3.10 Quality of life
The study did not provide data for this outcome.
3.11 Patient satisfaction
The study did not provide data for this outcome.
3.12 Economic costs
The study did not provide data for this outcome.
3.13 Number of dropouts due to adverse effects
We did not find any difference in terms of dropouts due to adverse effects between paroxetine and benzodiazepines (RR 1.20, 95% CI 0.55 to 2.61; participants = 154; studies = 1) (Analysis 3.13). Risk of bias was considered unclear for this outcome, but the study was rated as high risk for "other bias" because it was funded by a pharmaceutical company.
3.13. Analysis.

Comparison 3 SSRIs versus benzodiazepines, Outcome 13 Number of dropouts due to adverse effects.
3.14 Number of patients experiencing at least one adverse effect
We did not find any difference in this outcome between paroxetine and benzodiazepines (RR 1.03, 95% CI 0.92 to 1.15; participants = 154; studies = 1) (Analysis 3.14). Risk of bias was considered unclear for this outcome, but the study was rated as high risk for "other bias" because it was funded by a pharmaceutical company.
3.14. Analysis.

Comparison 3 SSRIs versus benzodiazepines, Outcome 14 Number of patients experiencing at least one adverse effect.
B: Antidepressants versus antidepressants
We found data only for the comparisons reported below.
Comparison 4: TCAs versus SSRIs
Nine studies including 1290 participants (Amore 1999; Bystritsky 1995; Den Boer 1988; GSK‐29060/525; Lecrubier 1997; Nair 1996; Wade 1997; Westenberg 1989; Zhang 2000) provided data for this comparison. See also: Table 4.
Primary outcomes
4.1 Failure to respond
There was low‐quality evidence suggesting no difference between TCAs and SSRIs on response rate, with moderate heterogeneity (I² = 61%) (RR 1.08, 95% CI 0.71 to 1.66; participants = 438; studies = 4) (Analysis 4.1). Risk of bias was considered unclear for this outcome, but the majority of studies were rated as high risk for "other bias" because they were funded by pharmaceutical companies.
4.1. Analysis.
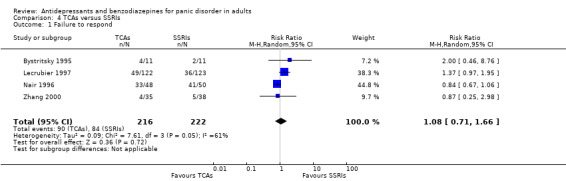
Comparison 4 TCAs versus SSRIs, Outcome 1 Failure to respond.
4.2 Total number of dropouts
We found low‐quality evidence suggesting no difference in terms of dropouts between TCAs and SSRIs, with moderate heterogeneity (I² = 47%) (RR 0.98, 95% CI 0.65 to 1.48; participants = 928; studies = 7) (Analysis 4.2). Risk of bias was considered unclear for this outcome, but the majority of studies were rated as high risk for "other bias" because they were funded by pharmaceutical companies.
4.2. Analysis.

Comparison 4 TCAs versus SSRIs, Outcome 2 Total number of dropouts.
Secondary outcomes
4.3 Failure to remit
We found moderate‐quality evidence suggesting no difference in terms of remission rate between TCAs and SSRIs, with moderate heterogeneity (I² = 58%) (RR 0.89, 95% CI 0.63 to 1.26; participants = 475; studies = 5) (Analysis 4.3). Risk of bias was considered unclear for this outcome, but many studies were rated as high risk for "other bias" because of funding by pharmaceutical companies.
4.3. Analysis.
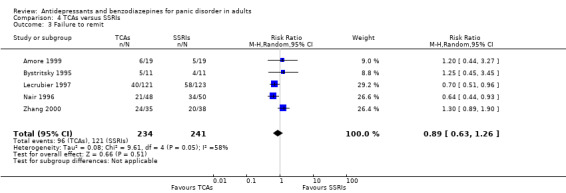
Comparison 4 TCAs versus SSRIs, Outcome 3 Failure to remit.
4.4 Panic symptoms
There was very low‐quality evidence suggesting no difference between TCAs and SSRIs on this outcome, with moderate heterogeneity (I² = 50%) (MD ‐0.20, 95% CI ‐0.88 to 0.48; participants = 243; studies = 4) (Analysis 4.4). Risk of bias was considered unclear for this outcome, but the majority of studies were rated as high risk for "other bias" because they were funded by pharmaceutical companies.
4.4. Analysis.
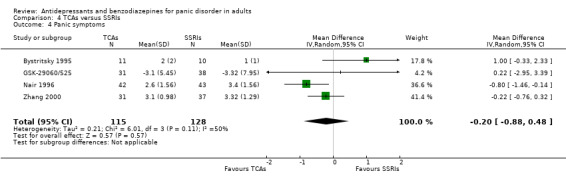
Comparison 4 TCAs versus SSRIs, Outcome 4 Panic symptoms.
4.5 Frequency of panic attacks
No difference was found between SSRIs and TCAs in terms of frequency of panic attacks, with moderate heterogeneity (I² = 66%) (MD 2.30, 95% CI ‐0.11 to 4.71; participants = 329; studies = 3) (Analysis 4.5). Risk of bias was considered between unclear and high for this outcome, and the majority of studies were rated as high risk for "other bias" because of funding by pharmaceutical companies.
4.5. Analysis.

Comparison 4 TCAs versus SSRIs, Outcome 5 Frequency of panic attacks.
4.6 Agoraphobia
One study with 226 patients found no difference in this outcome between TCAs and SSRIs (MD 0.10, 95% CI ‐0.68 to 0.88) (Analysis 4.6). Risk of bias was considered unclear for this outcome, but the study was rated as high risk for "other bias" because it was funded by a pharmaceutical company.
4.6. Analysis.
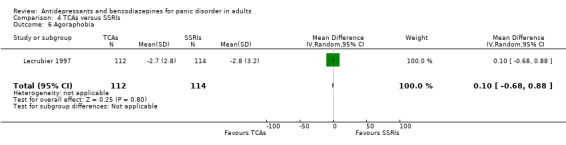
Comparison 4 TCAs versus SSRIs, Outcome 6 Agoraphobia.
4.7 General anxiety ‐ endpoint score
We did not find any difference between TCAs and SSRIs on efficacy measured as endpoint scores (SMD 0.09, 95% CI ‐0.27 to 0.45; participants = 668; studies = 7). The degree of heterogeneity was substantial (I² = 71%) (Analysis 4.7). Risk of bias was considered unclear for this outcome, and some studies were rated as high risk for "other bias" because they were funded by pharmaceutical companies.
4.7. Analysis.
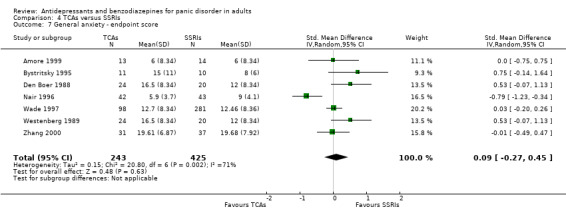
Comparison 4 TCAs versus SSRIs, Outcome 7 General anxiety ‐ endpoint score.
4.8 General anxiety ‐ mean change
We did not find any difference between TCAs and SSRIs on efficacy measured as mean change scores (MD 0.99, 95% CI ‐1.39 to 3.36; participants = 309; studies = 2; I² = 0%) (Analysis 4.8). Risk of bias was considered unclear for this outcome, but all the studies were rated as high risk for "other bias" because they were funded by pharmaceutical companies.
4.8. Analysis.
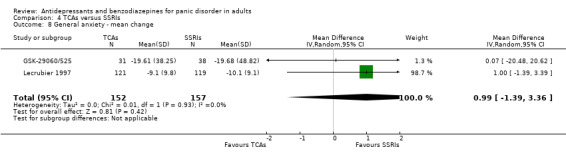
Comparison 4 TCAs versus SSRIs, Outcome 8 General anxiety ‐ mean change.
4.9 Depression ‐ endpoint score
We did not find any difference between TCAs and SSRIs on efficacy measured as endpoint scores (SMD ‐0.04, 95% CI ‐0.26 to 0.17; participants = 597; studies = 5; I² = 20%) (Analysis 4.9). Risk of bias was considered unclear for this outcome, but some studies were rated as high risk for "other bias" because of funding by pharmaceutical companies.
4.9. Analysis.

Comparison 4 TCAs versus SSRIs, Outcome 9 Depression ‐ endpoint score.
4.10 Depression ‐ mean change
We did not find any difference between TCAs and SSRIs on efficacy measured as mean change scores (SMD ‐0.04, 95% CI ‐0.31 to 0.23; participants = 212; studies = 1; I² = 0%) (Analysis 4.10). Risk of bias was considered between unclear and high for this outcome, and the study was rated as high risk for "other bias" because it was funded by a pharmaceutical company.
4.10. Analysis.

Comparison 4 TCAs versus SSRIs, Outcome 10 Depression ‐ mean change.
4.11 Social functioning
No studies provided data for this outcome.
4.12 Quality of life
No studies provided data for this outcome.
4.13 Patient satisfaction
No studies provided data for this outcome.
4.14 Economic costs
No studies provided data for this outcome.
4.15 Number of dropouts due to adverse effects
There was low‐quality evidence suggesting no difference between TCAs and SSRIs on dropouts due to adverse effects (RR 1.43, 95% CI 0.82 to 2.48; participants = 476; studies = 5; I² = 11%) (Analysis 4.15). Risk of bias was considered unclear for this outcome, but the majority of studies were rated as high risk for "other bias" because they were funded by pharmaceutical companies.
4.15. Analysis.

Comparison 4 TCAs versus SSRIs, Outcome 15 Number of dropouts due to adverse effects.
4.16 Number of patients experiencing at least one adverse effect
Considering tolerability as the number of patients who experienced at least one adverse effect, we found a difference in favour of SSRIs compared to TCAs (RR 1.29, 95% CI 1.02 to 1.65; participants = 489; studies = 4) (NNTH = 6, 95% CI 84 to 3), with a substantial degree of heterogeneity between the studies included in the analysis (I² = 78%) (Analysis 4.16). Risk of bias was considered unclear for this outcome, but all the studies were rated as high risk for "other bias" because they were funded by pharmaceutical companies.
4.16. Analysis.
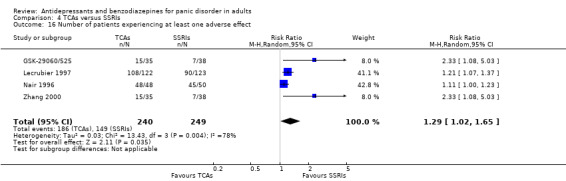
Comparison 4 TCAs versus SSRIs, Outcome 16 Number of patients experiencing at least one adverse effect.
Comparison 5: TCAs versus MAOIs
Two studies including 228 participants provided data for this comparison. One compared brofaromine with clomipramine (Bakish 1993), and one compared moclobemide with clomipramine (Krueger 1999). See also: Table 5.
Primary outcomes
5.1 Failure to respond
The comparison between TCAs and MAOIs did not find any difference in response rate (RR 0.59, 95% CI 0.28 to 1.26; participants = 135; studies = 1; low‐quality evidence) (Analysis 5.1). Risk of bias was considered unclear for this outcome, but the study was rated as high risk for "other bias" because it was funded by a pharmaceutical company.
5.1. Analysis.
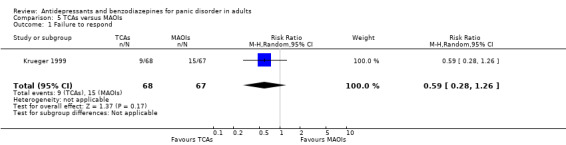
Comparison 5 TCAs versus MAOIs, Outcome 1 Failure to respond.
5.2 Total number of dropouts
We found moderate‐quality evidence suggesting no difference between TCAs and MAOIs in terms of number of dropouts (RR 0.84, 95% CI 0.61 to 1.17; participants = 228; studies = 2; I² = 0%) (Analysis 5.2). Risk of bias was considered between unclear and high for this outcome, with one study rated as high risk for "other bias" because it was funded by a pharmaceutical company.
5.2. Analysis.
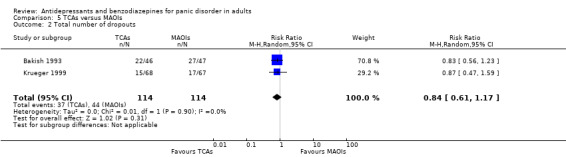
Comparison 5 TCAs versus MAOIs, Outcome 2 Total number of dropouts.
Secondary outcomes
5.3 Failure to remit
Neither study provided data for this outcome.
5.4 Panic symptoms
We found low‐quality evidence suggesting no difference between TCAs and MAOIs on this outcome (MD ‐0.20, 95% CI ‐0.75 to 0.35; participants = 135; studies = 1) (Analysis 5.4). Risk of bias was considered unclear for this outcome, but the study was rated as high risk for "other bias" because it was funded by a pharmaceutical company.
5.4. Analysis.

Comparison 5 TCAs versus MAOIs, Outcome 4 Panic symptoms.
5.5 Frequency of panic attacks
We found no difference between TCAs and MAOIs for this outcome (MD ‐0.30, 95% CI ‐3.35 to 2.75; participants = 135; studies = 1) (Analysis 5.5). Risk of bias was considered unclear for this outcome, but the study was rated as high risk for "other bias" because it was funded by a pharmaceutical company.
5.5. Analysis.

Comparison 5 TCAs versus MAOIs, Outcome 5 Frequency of panic attacks.
5.6 Agoraphobia
Neither study provided data for this outcome.
5.7 General anxiety
The comparison between TCAs and MAOIs did not find any difference in general anxiety (MD 0.30, 95% CI ‐3.03 to 3.63; participants = 135; studies = 1) (Analysis 5.7). Risk of bias was considered unclear for this outcome, but the study was rated as high risk for "other bias" because it was funded by a pharmaceutical company.
5.7. Analysis.

Comparison 5 TCAs versus MAOIs, Outcome 7 General anxiety.
5.8 Depression
We found a difference in favour of TCAs over MAOIs for depression measured on a continuous scale (MD ‐4.10, 95% CI ‐8.14 to ‐0.06; participants = 135; studies = 1) (Analysis 5.8). Risk of bias was considered unclear for this outcome, but the study was rated as high risk for "other bias" because it was funded by a pharmaceutical company.
5.8. Analysis.
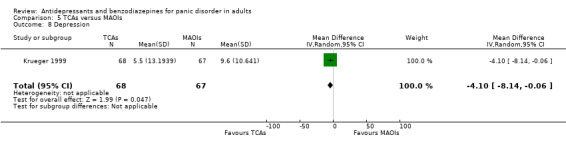
Comparison 5 TCAs versus MAOIs, Outcome 8 Depression.
5.9 Social functioning
Neither study provided data for this outcome.
5.10 Quality of life
Neither study provided data for this outcome.
5.11 Patient satisfaction
Neither study provided data for this outcome.
5.12 Economic costs
Neither study provided data for this outcome.
5.13 Number of dropouts due to adverse effects
The comparison between TCAs and MAOIs did not show any difference in terms of dropouts due to adverse effects (RR 1.27, 95% CI 0.50 to 3.21; participants = 135; studies = 1; low‐quality evidence) (Analysis 5.13). Risk of bias was considered unclear for this outcome, but the study was rated as high risk for "other bias" because it was funded by a pharmaceutical company.
5.13. Analysis.

Comparison 5 TCAs versus MAOIs, Outcome 13 Number of dropouts due to adverse effects.
5.14 Number of patients experiencing at least one adverse effect
We found a difference in favour of MAOIs over TCAs in tolerability in terms of number of patients who experienced at least one adverse effect (RR 1.24, 95% CI 1.06 to 1.45; participants = 135; studies = 1) (Analysis 5.14). Risk of bias was considered unclear for this outcome, but the study was rated as high risk for "other bias" because it was funded by a pharmaceutical company.
5.14. Analysis.
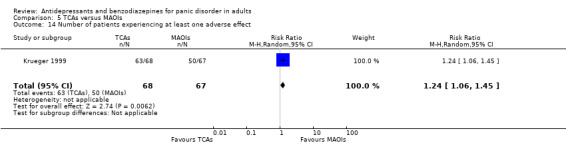
Comparison 5 TCAs versus MAOIs, Outcome 14 Number of patients experiencing at least one adverse effect.
Comparison 6: SSRIs versus MAOIs
Two studies including 396 participants; provided data for this comparison. One study compared moclobemide with fluoxetine (Tiller 1999), and the other compared brofaromine with fluvoxamine (Van Vliet 1996). See also: Table 6.
Primary outcomes
6.1 Failure to respond
We found moderate‐quality evidence suggesting no difference in terms of response rate between SSRIs and MAOIs (RR 1.12, 95% CI 0.83 to 1.52; participants = 396; studies = 2; I² = 0%) (Analysis 6.1). Risk of bias was considered between unclear and high for this outcome, with one study rated as high risk for "other bias" because it was funded by a pharmaceutical company.
6.1. Analysis.
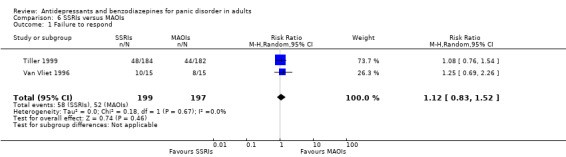
Comparison 6 SSRIs versus MAOIs, Outcome 1 Failure to respond.
6.2 Total number of dropouts
We found low‐quality evidence suggesting no difference between SSRIs and MAOIs in terms of the number of dropouts (RR 1.00, 95% CI 0.07 to 14.55; participants = 30; studies = 1) (Analysis 6.2). Risk of bias was considered between unclear and high for this outcome.
6.2. Analysis.

Comparison 6 SSRIs versus MAOIs, Outcome 2 Total number of dropouts.
Secondary outcomes
6.3 Failure to remit
We found moderate‐quality evidence suggesting no difference between SSRIs and MAOIs for this outcome (RR 0.93, 95% CI 0.74 to 1.17; participants = 366; studies = 1) (Analysis 6.3). Risk of bias was considered between unclear and high for this outcome, as the study was rated as high risk for "other bias" because it was funded by a pharmaceutical company.
6.3. Analysis.
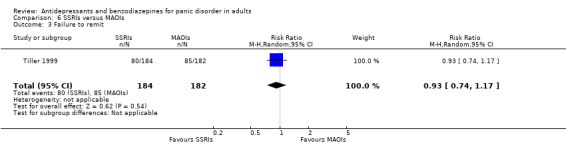
Comparison 6 SSRIs versus MAOIs, Outcome 3 Failure to remit.
6.4 Panic symptoms
Neither study provided data for this outcome.
6.5 Frequency of panic attacks
Neither study provided data for this outcome.
6.6 Agoraphobia
There was no evidence of a difference between SSRIs and MAOIs in this outcome (MD 1.50, 95% CI ‐4.47 to 7.47; participants = 30; studies = 1) (Analysis 6.6). Risk of bias was considered between unclear and high for this outcome.
6.6. Analysis.
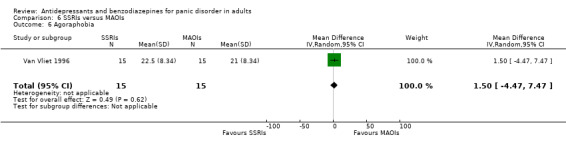
Comparison 6 SSRIs versus MAOIs, Outcome 6 Agoraphobia.
6.7 General anxiety
We found a difference in favour of SSRIs over MAOIs in terms of efficacy on general anxiety (MD ‐0.60, 95% CI ‐1.10 to ‐0.10; participants = 30; studies = 1) (Analysis 6.7). Risk of bias was considered between unclear and high for this outcome.
6.7. Analysis.

Comparison 6 SSRIs versus MAOIs, Outcome 7 General anxiety.
6.8 Depression
Neither study provided data for this outcome.
6.9 Social functioning
Neither study provided data for this outcome.
6.10 Quality of life
Neither study provided data for this outcome.
6.11 Patient satisfaction
Neither study provided data for this outcome.
6.12 Economic costs
Neither study provided data for this outcome.
6.13 Number of dropouts due to adverse effects
The comparison between SSRIs and MAOIs did not find any difference in terms of dropouts due to adverse effects (RR 1.26, 95% CI 0.59 to 2.70; participants = 366; studies = 1, low‐quality evidence) (Analysis 6.13). Risk of bias was considered between unclear and high for this outcome, with the study rated as high risk for "other bias" because it was funded by a pharmaceutical company.
6.13. Analysis.

Comparison 6 SSRIs versus MAOIs, Outcome 13 Number of dropouts due to adverse effects.
6.14 Number of patients experiencing at least one adverse effect
We found no difference between SSRIs and MAOIs for this outcome (RR 1.09, 95% CI 0.94 to 1.27; participants = 366; studies = 1) (Analysis 6.14). Risk of bias was considered between unclear and high for this outcome, with the study rated as high risk for "other bias" because it was funded by a pharmaceutical company.
6.14. Analysis.

Comparison 6 SSRIs versus MAOIs, Outcome 14 Number of patients experiencing at least one adverse effect.
Comparison 7: SSRIs versus SNRIs
Two studies including 1316 participants (Pollack 2007a; Pollack 2007b) provided data for this comparison. Both studies compared venlafaxine and paroxetine. See also: Table 7.
Primary outcomes
7.1 Failure to respond
We found high‐quality evidence suggesting no difference between SSRIs and serotonin‐norepinephrine reuptake inhibitors (SNRIs) in terms of response rate (RR 0.96, 95% CI 0.75 to 1.23; participants = 991; studies = 2; I² = 1%) (Analysis 7.1). Risk of bias was considered unclear for this outcome, but both studies were rated as high risk for "other bias" because they were funded by a pharmaceutical company.
7.1. Analysis.

Comparison 7 SSRIs versus SNRIs, Outcome 1 Failure to respond.
7.2 Total number of dropouts
We found low‐quality evidence suggesting no difference between SSRIs and SNRIs in terms of total number of dropouts (RR 1.11, 95% CI 0.74 to 1.65; participants = 991; studies = 2), with moderate heterogeneity (I² = 53%) (Analysis 7.2). Risk of bias was considered unclear for this outcome, but both studies were rated as high risk for "other bias" because they were funded by a pharmaceutical company.
7.2. Analysis.

Comparison 7 SSRIs versus SNRIs, Outcome 2 Total number of dropouts.
Secondary outcomes
7.3 Failure to remit
We found high‐quality evidence suggesting no difference between SSRIs and SNRIs in terms of remission rate (RR 1.05, 95% CI 0.91 to 1.21; participants = 991; studies = 2; I2 = 42%) (Analysis 7.3). Risk of bias was considered unclear for this outcome, but both studies were rated as high risk for "other bias" because they were funded by a pharmaceutical company.
7.3. Analysis.

Comparison 7 SSRIs versus SNRIs, Outcome 3 Failure to remit.
7.4 Panic symptoms
We found no difference between SSRIs and SNRIs in terms of panic symptoms (MD ‐0.12, 95% CI ‐0.33 to 0.10; participants = 945; studies = 2; I² = 0%, high‐quality evidence) (Analysis 7.4). Risk of bias was considered unclear for this outcome, but both studies were rated as high risk for "other bias" because they were funded by a pharmaceutical company.
7.4. Analysis.
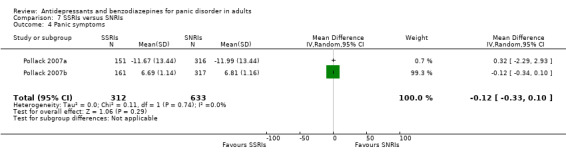
Comparison 7 SSRIs versus SNRIs, Outcome 4 Panic symptoms.
7.5 Frequency of panic attacks
Neither study provided data for this outcome.
7.6 Agoraphobia
One study showed no difference between SSRIs and SNRIs on agoraphobia (SMD 0.00, 95% CI ‐0.19 to 0.19; participants = 478; studies = 1) (Analysis 7.6). Risk of bias was considered unclear for this outcome, but the study was rated as high risk for "other bias" because funded by pharmaceutical companies.
7.6. Analysis.

Comparison 7 SSRIs versus SNRIs, Outcome 6 Agoraphobia.
7.7 General anxiety
No difference was found between SSRIs and SNRIs for this outcome (MD ‐0.25, 95% CI ‐1.83 to 1.33; participants = 478; studies = 1) (Analysis 7.7). Risk of bias was considered unclear for this outcome, but the study was rated as high risk for "other bias" because it was funded by a pharmaceutical company.
7.7. Analysis.

Comparison 7 SSRIs versus SNRIs, Outcome 7 General anxiety.
7.8 Depression
Neither study provided data for this outcome.
7.9 Social functioning
One study showed no difference between SSRIs and SNRIs for this outcome (MD 0.15, 95% CI ‐0.71 to 1.01; participants = 478; studies = 1) (Analysis 7.9). Risk of bias was considered unclear for this outcome, but the study was rated as high risk for "other bias" because it was funded by a pharmaceutical company.
7.9. Analysis.

Comparison 7 SSRIs versus SNRIs, Outcome 9 Social functioning.
7.10 Quality of life
One study showed no difference between SSRIs and SNRIs for this outcome (MD 0.06, 95% CI ‐2.11 to 2.23; participants = 478; studies = 1) (Analysis 7.10). Risk of bias was considered unclear for this outcome, but the study was rated as high risk for "other bias" because it was funded by pharmaceutical company.
7.10. Analysis.
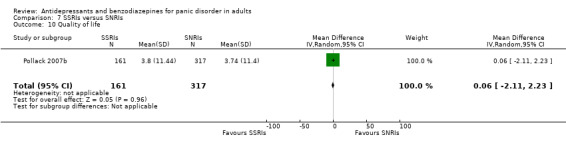
Comparison 7 SSRIs versus SNRIs, Outcome 10 Quality of life.
7.11 Patient satisfaction
Neither study provided data for this outcome.
7.12 Economic costs
Neither study provided data for this outcome.
7.13 Number of dropouts due to adverse effects
We found low‐quality evidence that failed to reveal a difference between SSRIs and SNRIs in this outcome (RR 1.86, 95% CI 0.49 to 7.05; participants = 991; studies = 2; I2 = 76%) (Analysis 7.13). Risk of bias was considered unclear for this outcome, but both studies were rated as high risk for "other bias" because they were funded by a pharmaceutical company.
7.13. Analysis.
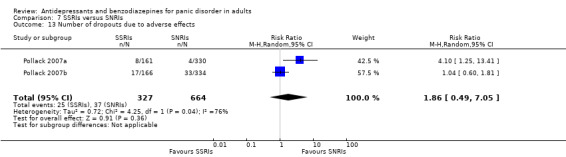
Comparison 7 SSRIs versus SNRIs, Outcome 13 Number of dropouts due to adverse effects.
7.14 Number of patients experiencing at least one adverse effect
We found no difference between SSRIs and SNRIs in this outcome (RR 0.97, 95% CI 0.88 to 1.08; participants = 991; studies = 2) with moderate heterogeneity (I² = 51%) (Analysis 7.14). Risk of bias was considered unclear for this outcome, but both studies were rated as high risk for "other bias" because of funding by a pharmaceutical company.
7.14. Analysis.

Comparison 7 SSRIs versus SNRIs, Outcome 14 Number of patients experiencing at least one adverse effect.
Comparison 8: SSRIs versus NaSSAs
One study including 30 participants (Ribeiro 2001) provided data for this comparison, comparing mirtazapine and fluoxetine. See also: Table 8.
Primary outcomes
8.1 Failure to respond
The study did not provide data for this outcome.
8.2 Total number of dropouts
We found low‐quality evidence suggesting no difference between SSRIs and noradrenergic and specific serotonergic antidepressant (NaSSAs) in terms of dropouts due to any cause (RR 1.50, 95% CI 0.29 to 7.73; participants = 30; studies = 1; I² = 0%) (Analysis 8.2). Risk of bias was considered between low and unclear for this outcome.
8.2. Analysis.
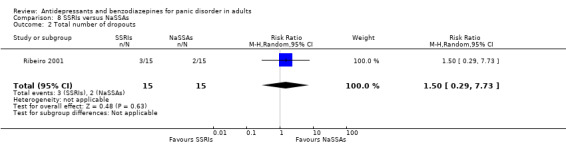
Comparison 8 SSRIs versus NaSSAs, Outcome 2 Total number of dropouts.
Secondary outcomes
8.3 Failure to remit
The study did not provide data for this outcome.
8.4 Panic symptoms
We found low‐quality evidence suggesting no difference between SSRIs and NaSSAs for this outcome (MD 0.30, 95% CI ‐0.49 to 1.09; participants = 22; studies = 1) (Analysis 8.4). Risk of bias was considered between low and unclear for this outcome.
8.4. Analysis.
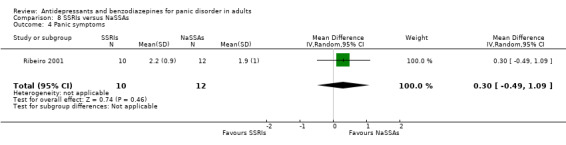
Comparison 8 SSRIs versus NaSSAs, Outcome 4 Panic symptoms.
8.5 Frequency of panic attacks
The study did not provide data for this outcome.
8.6 Agoraphobia
The study did not provide data for this outcome.
8.7 General anxiety
No difference was found between SSRIs and NaSSAs on this outcome (MD 1.10, 95% CI ‐6.04 to 8.24; participants = 27; studies = 1) (Analysis 8.7). Risk of bias was considered between low and unclear for this outcome.
8.7. Analysis.

Comparison 8 SSRIs versus NaSSAs, Outcome 7 General anxiety.
8.8 Depression
The study did not provide data for this outcome.
8.9 Social functioning
The study did not provide data for this outcome.
8.10 Quality of life
The study did not provide data for this outcome.
8.11 Patient satisfaction
The study did not provide data for this outcome.
8.12 Economic costs
The study did not provide data for this outcome.
8.13 Number of dropouts due to adverse effects
We found low‐quality evidence suggesting no difference between SSRIs and NaSSAs in terms of dropouts due to adverse effects (RR 1.50, 95% CI 0.29 to 7.73; participants = 30; studies = 1) (Analysis 8.13). Risk of bias was considered between low and unclear for this outcome.
8.13. Analysis.

Comparison 8 SSRIs versus NaSSAs, Outcome 13 Number of dropouts due to adverse effects.
8.14 Number of patients experiencing at least one adverse effect
The study did not provide data for this outcome.
Comparison 9: SSRIs versus Other Antidepressants
One study including 59 participants (Den Boer 1990) provided data for this comparison, comparing fluvoxamine and ritanserin.
Primary outcomes
9.1 Failure to respond
We found a difference favouring SSRIs over other antidepressants in terms of response rates (RR 0.28, 95% CI 0.13 to 0.60; participants = 40; studies = 1) (Analysis 9.1). Risk of bias was considered between unclear for this outcome.
9.1. Analysis.

Comparison 9 SSRIs versus Other Antidepressants, Outcome 1 Failure to respond.
9.2 Total number of dropouts
The study reports that no patients left the study early in both groups, therefore it was not possible to calculate a RR (dropouts were n = 0 in 20 patients in both the fluvoxamine and ritanserin group).
Secondary outcomes
9.3 Failure to remit
The study did not provide data for this outcome.
9.4 Panic symptoms
The study did not provide data for this outcome.
9.5 Frequency of panic attacks
The study did not provide data for this outcome.
9.6 Agoraphobia
We found a difference in favour of SSRIs over other antidepressants (ritanserin) in terms of efficacy on agoraphobia (MD ‐7.35, 95% CI ‐13.73 to ‐0.97; participants = 40; studies = 1) (Analysis 9.6). Risk of bias was considered unclear for this outcome.
9.6. Analysis.
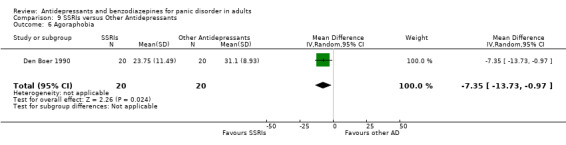
Comparison 9 SSRIs versus Other Antidepressants, Outcome 6 Agoraphobia.
9.7 General anxiety
We found a difference in favour of SSRIs over other antidepressants (ritanserin) in terms of efficacy on general anxiety (MD ‐3.55, 95% CI ‐5.07 to ‐2.03; participants = 40; studies = 1) (Analysis 9.7). Risk of bias was considered unclear for this outcome.
9.7. Analysis.

Comparison 9 SSRIs versus Other Antidepressants, Outcome 7 General anxiety.
9.8 Depression
We found a difference in favour of SSRIs over other antidepressant (ritanserin) (MD ‐5.38, 95% CI ‐7.90 to ‐2.86; participants = 40; studies = 1) (Analysis 9.8). Risk of bias was considered unclear for this outcome.
9.8. Analysis.
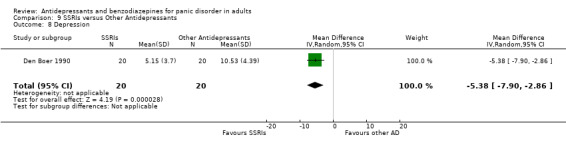
Comparison 9 SSRIs versus Other Antidepressants, Outcome 8 Depression.
9.9 Social functioning
The study did not provide data for this outcome.
9.10 Quality of life
The study did not provide data for this outcome.
9.11 Patient satisfaction
The study did not provide data for this outcome.
9.12 Economic costs
The study did not provide data for this outcome.
9.13 Number of dropouts due to adverse effects
The study reports that no patients left the study early in both groups, therefore it was not possible to calculate a RR (dropouts were n= 0 in patients in both the fluvoxamine and ritanserin group).
9.14 Number of patients experiencing at least one adverse effect
The study did not provide data for this outcome.
Comparison 10: Individual antidepressants versus another antidepressant within the same class
Five studies including 1026 participants (Amore 1999 bis; Bandelow 2004; Gentil 1993; Pfizer 2008; Stahl 2003) provided data for this comparison.
Primary outcomes
10.1 Failure to respond
We found no difference between escitalopram and citalopram in terms of response rate (RR 0.92, 95% CI 0.79 to 1.06; participants = 255; studies = 1). The comparison between fluoxetine and citalopram (RR 0.57, 95% CI 0.20 to 1.66; participants = 42; studies = 1), as well as the one between sertraline and paroxetine (RR 0.97, 95% CI 0.80 to 1.17; participants = 546; studies = 2; I² = 0%) did not show any difference (Analysis 10.1). Risk of bias was considered unclear for this outcome, but the majority of studies were rated as high risk for "other bias" because they were funded by pharmaceutical companies.
10.1. Analysis.
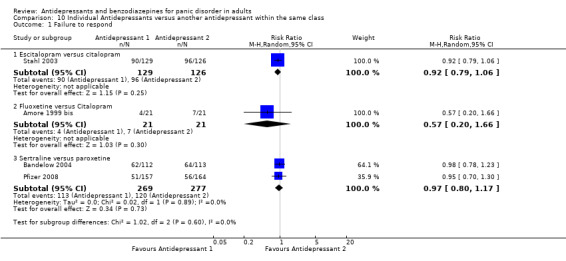
Comparison 10 Individual Antidepressants versus another antidepressant within the same class, Outcome 1 Failure to respond.
10.2 Total number of dropouts
We found a difference in favour of sertraline over paroxetine in terms of dropouts due to any cause (RR 0.74, 95% CI 0.55 to 0.99; participants = 546; studies = 2; I² = 2%) (NNTH = 14, 95% CI 8 to 351), while there was no difference for the other comparisons (Analysis 10.2). Risk of bias was considered unclear for this outcome, but the majority of studies were rated as high risk for "other bias" because of funding by pharmaceutical companies.
10.2. Analysis.
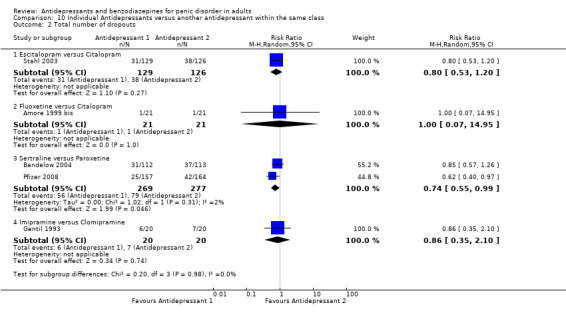
Comparison 10 Individual Antidepressants versus another antidepressant within the same class, Outcome 2 Total number of dropouts.
Secondary outcomes
10.3 Failure to remit
We found no difference between escitalopram and citalopram in terms of remission rates (RR 0.90, 95% CI 0.71 to 1.15; participants = 255; studies = 1) (Analysis 10.3). Risk of bias was considered unclear for this outcome, but the study was rated as high risk for "other bias" because it was funded by a pharmaceutical company.
10.3. Analysis.
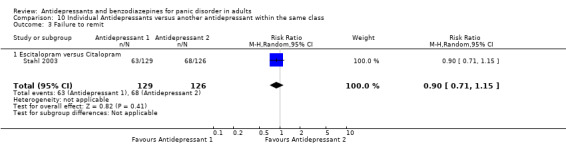
Comparison 10 Individual Antidepressants versus another antidepressant within the same class, Outcome 3 Failure to remit.
10.4 Panic symptoms
No difference was found between escitalopram and citalopram for this outcome (SMD ‐0.09, 95% CI ‐0.35 to 0.16; participants = 237; studies = 1), as well as between sertraline and paroxetine (SMD ‐0.05, 95% CI ‐0.23 to 0.13; participants = 473; studies = 2; I² = 0%) (Analysis 10.4). Risk of bias was considered unclear for this outcome, but all the studies were rated as high risk for "other bias" because they were funded by pharmaceutical companies.
10.4. Analysis.
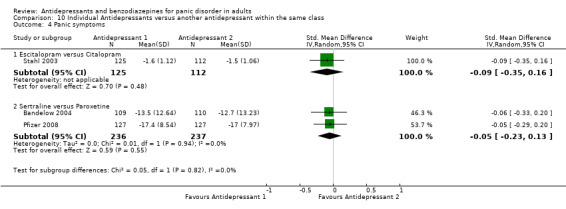
Comparison 10 Individual Antidepressants versus another antidepressant within the same class, Outcome 4 Panic symptoms.
10.5 Frequency of panic attacks
We found no difference between sertraline and paroxetine for this outcome (MD 0.48, 95% CI ‐1.02 to 1.98; participants = 461; studies = 2; I² = 0%) (Analysis 10.5). Risk of bias was considered unclear for this outcome, but both studies were rated as high risk for "other bias" because they were funded by pharmaceutical companies.
10.5. Analysis.

Comparison 10 Individual Antidepressants versus another antidepressant within the same class, Outcome 5 Frequency of panic attacks.
10.6 Agoraphobia
In terms of agoraphobia, we found no difference between escitalopram and citalopram (MD ‐1.10, 95% CI ‐3.46 to 1.26; participants = 237; studies = 1) (Analysis 10.6). Risk of bias was considered unclear for this outcome, but the study was rated as high risk for "other bias" because it was funded by a pharmaceutical company.
10.6. Analysis.
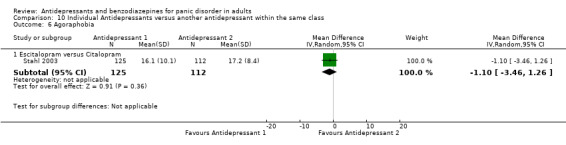
Comparison 10 Individual Antidepressants versus another antidepressant within the same class, Outcome 6 Agoraphobia.
10.7 General anxiety
In terms of general anxiety, the comparison between escitalopram and citalopram did not show any difference (MD ‐1.20, 95% CI ‐3.14 to 0.74; participants = 237; studies = 1), as well as between sertraline and paroxetine (MD ‐0.72, 95% CI ‐2.42 to 0.99; participants = 454; studies = 2; I² = 0%) (Analysis 10.7). Risk of bias was considered unclear for this outcome, but all the studies were rated as high risk for "other bias" because of funding by pharmaceutical companies.
10.7. Analysis.
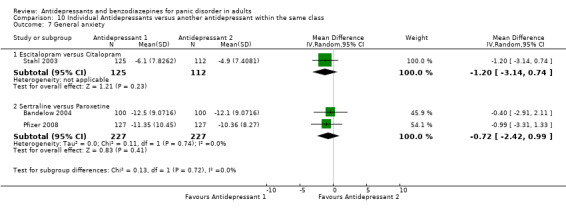
Comparison 10 Individual Antidepressants versus another antidepressant within the same class, Outcome 7 General anxiety.
10.8 Depression
We found no difference between escitalopram and citalopram for this outcome (SMD ‐0.11, 95% CI ‐0.36 to 0.15; participants = 237; studies = 1), and between sertraline and paroxetine (SMD 0.00, 95% CI ‐0.28 to 0.29; participants = 189; studies = 1) (Analysis 10.8). Risk of bias was considered unclear for this outcome, but both studies were rated as high risk for "other bias" because they were funded by pharmaceutical companies.
10.8. Analysis.

Comparison 10 Individual Antidepressants versus another antidepressant within the same class, Outcome 8 Depression.
10.9 Social functioning
No studies provided data for this outcome.
10.10 Quality of life
We found no difference between escitalopram and citalopram for this outcome (MD 1.40, 95% CI ‐1.51 to 4.31; participants = 237; studies = 1) (Analysis 10.10). Risk of bias was considered unclear for this outcome, but the study was rated as high risk for "other bias" because it was funded by a pharmaceutical company.
10.10. Analysis.
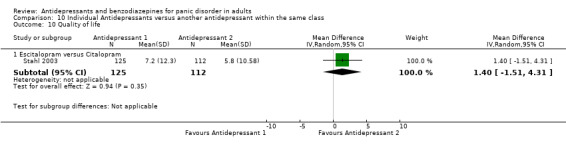
Comparison 10 Individual Antidepressants versus another antidepressant within the same class, Outcome 10 Quality of life.
10.11 Patient satisfaction
No studies provided data for this outcome.
10.12 Economic costs
No studies provided data for this outcome.
10.13 Number of dropouts due to adverse effects
In terms of dropouts due to adverse effects there was no difference between sertraline and paroxetine (RR 0.66, 95% CI 0.42 to 1.04; participants = 546; studies = 2; I² = 0%). We found no difference between escitalopram and citalopram (RR 0.78, 95% CI 0.32 to 1.92; participants = 255; studies = 1), as well as between fluoxetine and citalopram (RR 1.00, 95% CI 0.07 to 14.95; participants = 42; studies = 1) and imipramine versus clomipramine (RR 0.33, 95% CI 0.08 to 1.46; participants = 40; studies = 1) (Analysis 10.13). Risk of bias was considered unclear for this outcome, but the majority of studies were rated as high risk for "other bias" because they were funded by pharmaceutical companies.
10.13. Analysis.
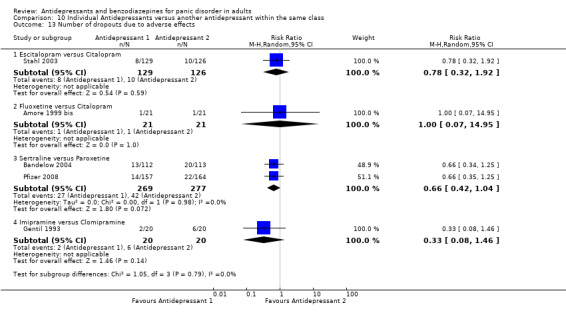
Comparison 10 Individual Antidepressants versus another antidepressant within the same class, Outcome 13 Number of dropouts due to adverse effects.
10.14 Number of patients experiencing at least one adverse effect
We found no difference between escitalopram and citalopram (RR 0.95, 95% CI 0.85 to 1.06; participants = 255; studies = 1), as well as between sertraline and paroxetine (RR 0.99, 95% CI 0.89 to 1.10; participants = 321; studies = 1) (Analysis 10.14). Risk of bias was considered unclear for this outcome, but both studies were rated as high risk for "other bias" because of funding by pharmaceutical companies.
10.14. Analysis.

Comparison 10 Individual Antidepressants versus another antidepressant within the same class, Outcome 14 Number of patients experiencing at least one adverse effect.
C: Individual benzodiazepines versus another benzodiazepine
Comparison 11: Individual benzodiazepines versus another benzodiazepine
Two studies including 310 participants provided data for this comparison, one comparing diazepam with alprazolam (Noyes 1996) and one comparing alprazolam with clonazepam (Tesar 1991).
Primary outcomes
11.1 Failure to respond
The comparison between alprazolam and diazepam did not show any difference in terms of response rate (RR 0.94, 95% CI 0.63 to 1.40; participants = 159; studies = 1) (Analysis 11.1). Risk of bias was considered unclear for this outcome, but the study was rated as high risk for "other bias" because it was funded by a pharmaceutical company.
11.1. Analysis.
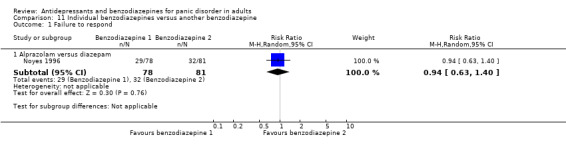
Comparison 11 Individual benzodiazepines versus another benzodiazepine, Outcome 1 Failure to respond.
11.2 Total number of dropouts
We found no difference between alprazolam and diazepam (RR 0.84, 95% CI 0.44 to 1.64; participants = 159; studies = 1), alprazolam and clonazepam (RR 2.17, 95% CI 0.44 to 10.78; participants = 50; studies = 1). The comparison between alprazolam and other benzodiazepines together did not show a difference (RR 1.01, 95% CI 0.49 to 2.08; participants = 209; studies = 2; I² = 12%) (Analysis 11.2). Risk of bias was considered unclear for this outcome, but both studies were rated as high risk for "other bias" because they were funded by a pharmaceutical company.
11.2. Analysis.

Comparison 11 Individual benzodiazepines versus another benzodiazepine, Outcome 2 Total number of dropouts.
Secondary outcome
11.3 Failure to remit
We found no difference between alprazolam and diazepam (RR 0.76, 95% CI 0.48 to 1.20; participants = 159; studies = 1), alprazolam and clonazepam (RR 1.26, 95% CI 0.73 to 2.17; participants = 50; studies = 1). The comparison between alprazolam and other benzodiazepines together did not show a difference (RR 0.96, 95% CI 0.58 to 1.57; participants = 209; studies = 2; I2 = 49%) (Analysis 11.3). Risk of bias was considered unclear for this outcome, but both studies were rated as high risk for "other bias" because they were funded by a pharmaceutical company.
11.3. Analysis.
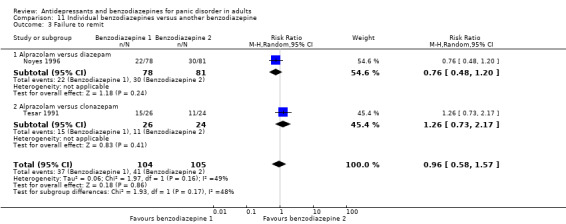
Comparison 11 Individual benzodiazepines versus another benzodiazepine, Outcome 3 Failure to remit.
11.4 Panic symptoms
No difference was found between alprazolam and diazepam (MD ‐0.20, 95% CI ‐0.70 to 0.30; participants = 159; studies = 1), and alprazolam and clonazepam (MD 0.60, 95% CI ‐0.12 to 1.32; participants = 50; studies = 1). The comparison between alprazolam and other benzodiazepines together did not show a difference (MD 0.16, 95% CI ‐0.62 to 0.93; participants = 209; studies = 2; I2 = 69%) (Analysis 11.4). Risk of bias was considered unclear for this outcome, but both studies were rated as high risk for "other bias" because they were funded by a pharmaceutical company.
11.4. Analysis.

Comparison 11 Individual benzodiazepines versus another benzodiazepine, Outcome 4 Panic symptoms.
11.5 Frequency of panic attacks
We found no difference in terms of frequency of panic attacks between alprazolam and diazepam (MD 0.40, 95% CI ‐1.34 to 2.14; participants = 159; studies = 1), alprazolam and clonazepam (MD 0.30, 95% CI ‐6.75 to 7.35; participants = 50; studies = 1) and between alprazolam and other benzodiazepines (MD 0.39, 95% CI ‐1.29 to 2.08; participants = 209; studies = 2; I² = 0%) (Analysis 11.5). Risk of bias was considered unclear for this outcome, but both studies were rated as high risk for "other bias" because they were funded by a pharmaceutical company.
11.5. Analysis.

Comparison 11 Individual benzodiazepines versus another benzodiazepine, Outcome 5 Frequency of panic attacks.
11.6 Agoraphobia
Neither study provided data for this outcome.
11.7 General anxiety
We found no difference between alprazolam and diazepam for this outcome (MD 0.20, 95% CI ‐2.28 to 2.68; participants = 159; studies = 1) (Analysis 11.7). Risk of bias was considered unclear for this outcome, but the study was rated as high risk for "other bias" because it was funded by a pharmaceutical company.
11.7. Analysis.
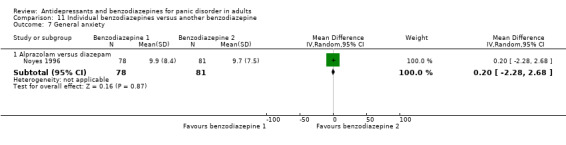
Comparison 11 Individual benzodiazepines versus another benzodiazepine, Outcome 7 General anxiety.
11.8 Depression
We found no difference between alprazolam and clonazepam for this outcome (MD 2.30, 95% CI ‐2.83 to 7.43; participants = 44; studies = 1) (Analysis 11.8). Risk of bias was considered unclear for this outcome, but the study was rated as high risk for "other bias" because it was funded by a pharmaceutical company.
11.8. Analysis.

Comparison 11 Individual benzodiazepines versus another benzodiazepine, Outcome 8 Depression.
11.9 Social functioning
There was no difference between alprazolam and diazepam in terms of social functioning (MD ‐0.10, 95% CI ‐0.47 to 0.27; participants = 159; studies = 1) (Analysis 11.9). Risk of bias was considered unclear for this outcome, but the study was rated as high risk for "other bias" because it was funded by a pharmaceutical company.
11.9. Analysis.

Comparison 11 Individual benzodiazepines versus another benzodiazepine, Outcome 9 Social functioning.
11.10 Quality of life
We found no difference between alprazolam and clonazepam for this outcome (MD ‐0.30, 95% CI ‐1.07 to 0.47; participants = 44; studies = 1) (Analysis 11.10). Risk of bias was considered unclear for this outcome, but the study was rated as high risk for "other bias" because it was funded by a pharmaceutical company.
11.10. Analysis.

Comparison 11 Individual benzodiazepines versus another benzodiazepine, Outcome 10 Quality of life.
11.11 Patient satisfaction
Neither study provided data for this outcome.
11.12 Economic costs
Neither study provided data for this outcome.
11.13 Number of dropouts due to adverse effects
There was no difference between alprazolam and diazepam (RR 1.04, 95% CI 0.15 to 7.19; participants = 159; studies = 1), alprazolam and clonazepam (RR 5.40, 95% CI 0.27 to 107.09; participants = 50; studies = 1) and alprazolam versus benzodiazepines as a group (RR 1.69, 95% CI 0.33 to 8.58; participants = 209; studies = 2; I² = 0%) (Analysis 11.13). Risk of bias was considered unclear for this outcome, but the studies were rated as high risk for "other bias" because of funding by a pharmaceutical company.
11.13. Analysis.

Comparison 11 Individual benzodiazepines versus another benzodiazepine, Outcome 13 Number of dropouts due to adverse effects.
11.14 Number of patients experiencing at least one adverse effect
Neither study provided data for this outcome.
Subgroup analyses
We could not conduct any of the preplanned subgroup analyses, as no relevant data were available: all studies included both participants with and without agoraphobia, so it was not possible to conduct subgroup analysis 1; no study reported acute data at more than four months, so it was not possible to perform subgroup analysis 2.
Sensitivity analyses
Excluding trials with high risk of bias (comparisons 12‐16)
Antidepressants versus benzodiazepines
Failure to respond
No studies were excluded, so the results did not change.
Total number of dropouts
Excluding two studies at high risk of bias (CNCPS 1992; Taylor 1990) did not substantially change the results (RR 1.63, 95% CI 0.82 to 3.23; participants = 619; studies = 5); heterogeneity was substantial (I² = 79%) (Analysis 12.1).
12.1. Analysis.

Comparison 12 High risk of bias excluded ‐ Antidepressants versus benzodiazepines, Outcome 1 Total number of dropouts.
TCAs versus benzodiazepines
Failure to respond
No studies were excluded, so the results did not change (Analysis 2.1).
Total number of dropouts
Excluding two studies at high risk of bias (CNCPS 1992; Taylor 1990) did not substantially change the results from the original analysis (RR 1.67, 95% CI 0.64 to 4.36; participants = 465; studies = 4); heterogeneity was substantial (I² = 81%) (Analysis 13.1).
13.1. Analysis.
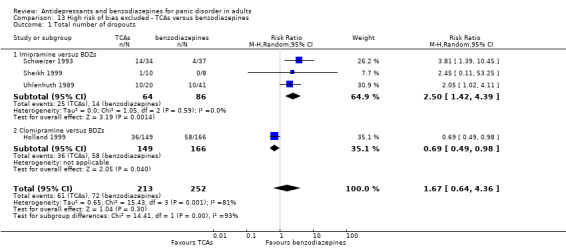
Comparison 13 High risk of bias excluded ‐ TCAs versus benzodiazepines, Outcome 1 Total number of dropouts.
SSRIs versus benzodiazepines
No studies were excluded, so the results did not change (Analysis 3.1; Analysis 3.2).
TCAs versus SSRIs
Failure to respond
No studies were excluded, so the results did not change (Analysis 4.1).
Total number of dropouts
Excluding one study at high risk of bias (Amore 1999) the results did not substantially change from the original analysis, with a moderate heterogeneity (I² = 54%) (RR 0.97, 95% CI 0.62 to 1.50; participants = 890; studies = 6) (Analysis 14.1).
14.1. Analysis.
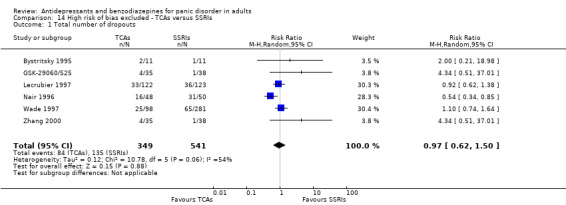
Comparison 14 High risk of bias excluded ‐ TCAs versus SSRIs, Outcome 1 Total number of dropouts.
TCAs versus MAOIs
Failure to respond
No studies were excluded from this outcome for high risk of bias, so the results did not change (Analysis 5.1).
Total number of dropouts
Excluding one study at high risk of bias (Bakish 1993) did not substantially change the results from the original analysis (RR 0.87, 95% CI 0.47 to 1.59; participants = 135; studies = 1) (Analysis 15.1).
15.1. Analysis.
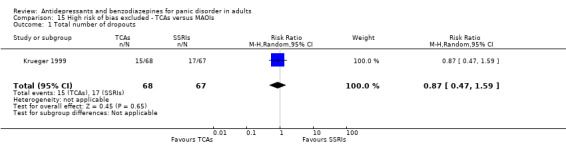
Comparison 15 High risk of bias excluded ‐ TCAs versus MAOIs, Outcome 1 Total number of dropouts.
SSRIs versus MAOIs
Failure to respond
Excluding one study at high risk of bias (Van Vliet 1996) did not substantially change the results from the original analysis (RR 1.08, 95% CI 0.76 to 1.54; participants = 366; studies = 1) (Analysis 16.1).
16.1. Analysis.
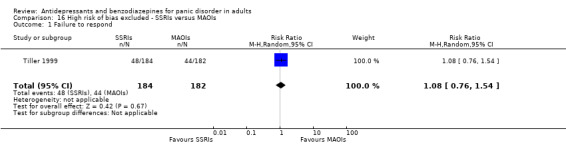
Comparison 16 High risk of bias excluded ‐ SSRIs versus MAOIs, Outcome 1 Failure to respond.
Total number of dropouts
Excluding studies at high risk of bias, no trials provided data for this analysis.
SSRIs versus SNRIs
No studies were excluded, so the results did not change (Analysis 7.1; Analysis 7.2).
SSRIs versus NaSSAs
Failure to respond
No data were available for this outcome.
Total number of dropouts
No studies were excluded, so the results did not change (Analysis 8.2).
Individual antidepressants versus individual antidepressants
Failure to respond
Excluding one study at high risk of bias (Amore 1999 bis) there were no data for fluoxetine versus citalopram (Analysis 17.1). No studies were excluded for the comparisons between escitalopram versus citalopram and sertraline versus paroxetine, thus the results remained unchanged (Analysis 10.1).
Total number of dropouts
Excluding one study at high risk of bias (Amore 1999 bis) no trials provided data for fluoxetine versus citalopram . No studies were excluded for the comparisons between escitalopram versus citalopram and sertraline versus paroxetine, thus the results remained unchanged (Analysis 10.2).
Individual benzodiazepines versus individual benzodiazepines
No studies were excluded, so the results did not change (Analysis 11.1; Analysis 11.2).
Excluding trials with dropout rates greater than 20% (comparisons 17‐19)
Antidepressants versus benzodiazepines
Failure to respond
Excluding studies for high dropout rates, no trials provided data for this outcome.
Total number of dropouts
Excluding five studies for high dropout rates (CNCPS 1992; GSK‐29060/1; Holland 1999; Schweizer 1993; Uhlenhuth 1989), no difference was found between antidepressants and benzodiazepines (RR 2.42, 95% CI 0.61 to 9.64; participants = 71; studies = 2; I2 = 0%) (Analysis 17.1).
17.1. Analysis.
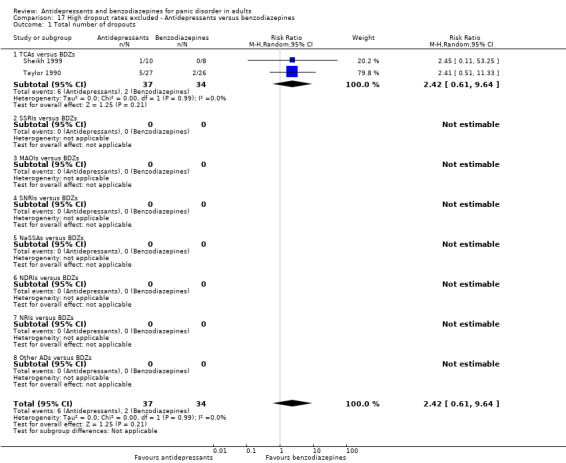
Comparison 17 High dropout rates excluded ‐ Antidepressants versus benzodiazepines, Outcome 1 Total number of dropouts.
TCAs versus benzodiazepines
Failure to respond
Excluding studies for high dropout rates, no trials provided data for this analysis.
Total number of dropouts
Excluding four studies for high dropout rates (CNCPS 1992; Holland 1999; Schweizer 1993; Uhlenhuth 1989), the results did not substantially change from the original analysis (RR 2.42, 95% CI 0.61 to 9.64; participants = 71; studies = 2; I2 = 0%) (Analysis 18.1).
18.1. Analysis.
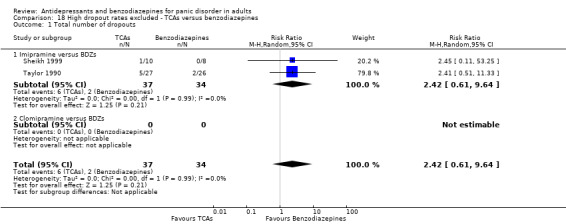
Comparison 18 High dropout rates excluded ‐ TCAs versus benzodiazepines, Outcome 1 Total number of dropouts.
SSRIs versus benzodiazepines
Excluding studies for high dropout rates, no trials provided data for this analysis.
TCAs versus SSRIs
Failure to respond
Excluding two studies for high dropout rates (Lecrubier 1997; Nair 1996), the results did not substantially change from the original analysis (RR 1.22, 95% CI 0.47 to 3.15; participants = 95; studies = 2; I² = 0%) (Analysis 19.1).
19.1. Analysis.
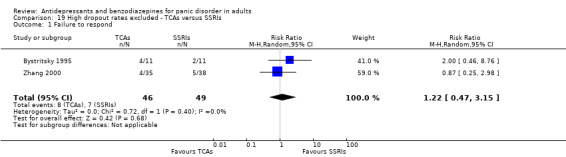
Comparison 19 High dropout rates excluded ‐ TCAs versus SSRIs, Outcome 1 Failure to respond.
Total number of dropouts
Excluding three studies for high dropout rates (Lecrubier 1997; Nair 1996; Wade 1997), the results did not substantially change (RR 3.02, 95% CI 1.00 to 9.11; participants = 206; studies = 4; I² = 0%) (Analysis 19.2).
19.2. Analysis.

Comparison 19 High dropout rates excluded ‐ TCAs versus SSRIs, Outcome 2 Total number of dropouts.
TCAs versus MAOIs
Excluding studies for high dropout rates, no trials provided data for this comparison.
SSRIs versus MAOIs
No studies were excluded, so the results did not change (Analysis 6.1; Analysis 6.2).
SSRIs versus SNRIs
No studies were excluded, so the results did not change (Analysis 7.1; Analysis 7.2).
SSRIs versus NaSSAs
Failure to respond
No data were available for this outcome.
Total number of dropouts
No studies were excluded, so the results did not change (Analysis 8.2).
Individual antidepressants versus individual antidepressants
Failure to respond
Excluding three studies for high dropout rates (Bandelow 2004; Pfizer 2008; Stahl 2003), the only data available were for fluoxetine versus citalopram. The results of this sensitivity analysis did not change when compared with the primary analysis (Analysis 10.1).
Total number of dropouts
Excluding four studies for high dropout rates (Bandelow 2004; Gentil 1993; Pfizer 2008; Stahl 2003), the only data available were for fluoxetine versus citalopram. The results of this sensitivity analysis did not change when compared with the primary analysis (Analysis 10.2).
Individual benzodiazepines versus individual benzodiazepines
No studies were excluded, so the results did not change (Analysis 11.1; Analysis 11.2).
Excluding studies funded by the pharmaceutical company marketing each antidepressant or benzodiazepine (comparisons 20‐23)
Antidepressants versus benzodiazepines
Failure to respond
Excluding studies funded by the pharmaceutical company, no trials provided data for this analysis.
Total number of dropouts
Excluding five studies funded by the pharmaceutical company marketing the drug (CNCPS 1992; Schweizer 1993; Sheikh 1999; Taylor 1990; Uhlenhuth 1989), no difference between antidepressants and benzodiazepines was found (RR 1.07, 95% CI 0.44 to 2.58; participants = 469; studies = 2), but with considerable heterogeneity (I² = 88%) (Analysis 20.1).
20.1. Analysis.
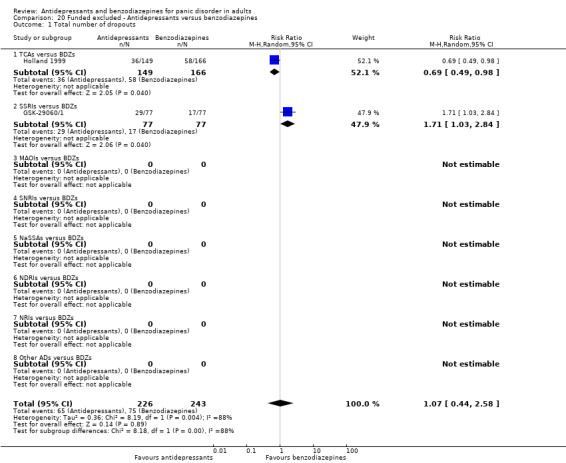
Comparison 20 Funded excluded ‐ Antidepressants versus benzodiazepines, Outcome 1 Total number of dropouts.
TCAs versus benzodiazepines
Failure to respond
Excluding studies funded by the pharmaceutical company, no trials provided data for this analysis.
Total number of dropouts
Excluding five studies funded by the pharmaceutical company marketing the drug, comparing imipramine with benzodiazepines (CNCPS 1992; Schweizer 1993; Sheikh 1999; Taylor 1990, Uhlenhuth 1989), only one study on clomipramine provided data for this comparison, showing a more favourable profile of TCAs over benzodiazepines (RR 0.69, 95% CI 0.49 to 0.98; participants = 315; studies = 1; I² = 0%) (Analysis 21.1).
21.1. Analysis.
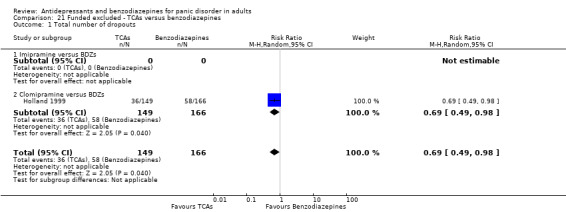
Comparison 21 Funded excluded ‐ TCAs versus benzodiazepines, Outcome 1 Total number of dropouts.
SSRIs versus benzodiazepines
Excluding studies funded by the pharmaceutical company, no trials provided data for this analysis.
TCAs versus SSRIs
Failure to respond
Excluding three studies funded by the pharmaceutical company marketing the drug (Lecrubier 1997; Nair 1996; Zhang 2000), did not substantially change the results (RR 2.00, 95% CI 0.46 to 8.76; participants = 22; studies = 1) (Analysis 22.1).
22.1. Analysis.
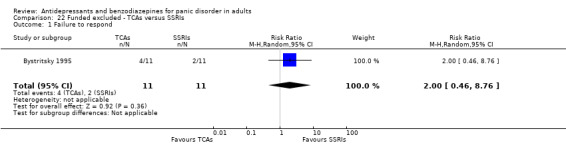
Comparison 22 Funded excluded ‐ TCAs versus SSRIs, Outcome 1 Failure to respond.
Total number of dropouts
Excluding four studies funded by the pharmaceutical company marketing the drug (GSK‐29060/525; Lecrubier 1997; Nair 1996; Zhang 2000), the results did not substantially change (RR 1.14, 95% CI 0.77 to 1.68; participants = 439; studies = 3; I² = 0%) (Analysis 22.2).
22.2. Analysis.

Comparison 22 Funded excluded ‐ TCAs versus SSRIs, Outcome 2 Total number of dropouts.
TCAs versus MAOIs
No studies were excluded, so the results did not change (Analysis 5.1; Analysis 5.2).
SSRIs versus MAOIs
Failure to respond
Excluding one study funded by the pharmaceutical company marketing the drug (Tiller 1999), the results did not substantially change (RR 1.25, 95% CI 0.69 to 2.26; participants = 30; studies = 1) (Analysis 23.1).
23.1. Analysis.
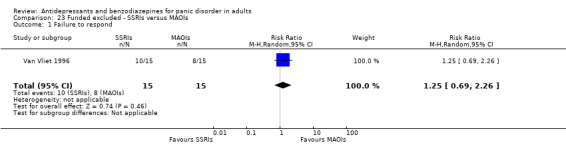
Comparison 23 Funded excluded ‐ SSRIs versus MAOIs, Outcome 1 Failure to respond.
Total number of dropouts
No studies were excluded, so the results did not change (Analysis 6.1; Analysis 6.2).
SSRIs versus SNRIs
Excluding studies funded by the pharmaceutical company, no trials provided data for this analysis.
SSRIs versus NaSSAs
Failure to respond
No data were available for this analysis.
Total number of dropouts
No studies were excluded, so the results did not change (Analysis 8.2).
Individual antidepressants versus individual antidepressants
Failure to respond
Excluding three studies funded by the pharmaceutical company marketing the drug (Bandelow 2004; Pfizer 2008; Stahl 2003), the only data available were for fluoxetine versus citalopram. The results of this sensitivity analysis did not change when compared with the primary analysis (Analysis 10.1).
Total number of dropouts
Excluding three studies funded by the pharmaceutical company marketing the drug (Bandelow 2004; Pfizer 2008; Stahl 2003), the only data available were for fluoxetine versus citalopram and imipramine versus clomipramine. The results of these sensitivity analyses did not change when compared with the primary analyses (Analysis 10.2).
Individual benzodiazepines versus individual benzodiazepines
Excluding studies funded by the pharmaceutical company, no trials provided data for this analysis.
Excluding studies whose participants clearly have significant psychiatric co‐morbidities including primary or secondary depressive disorders (comparisons 24‐28)
Antidepressants versus benzodiazepines
Failure to respond
Excluding one study that included participants with psychiatric co‐morbidities (GSK‐29060/1) did not substantially change the results (RR 1.02, 95% CI 0.63 to 1.67; participants = 61; studies = 1) (Analysis 24.1).
24.1. Analysis.
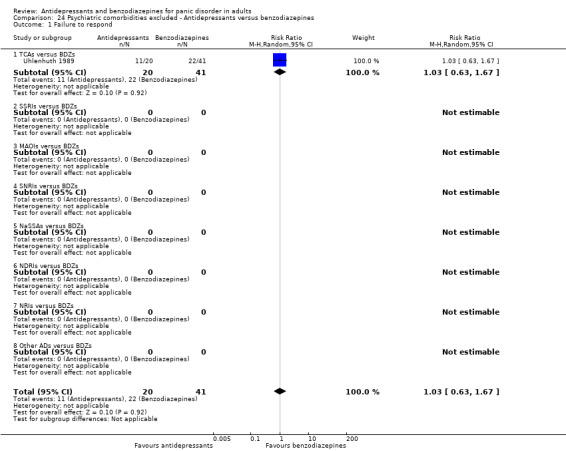
Comparison 24 Psychiatric comorbidities excluded ‐ Antidepressants versus benzodiazepines, Outcome 1 Failure to respond.
Total number of dropouts
Excluding three studies that included participants with psychiatric co‐morbidities (CNCPS 1992, GSK‐29060/1, Taylor 1990), no difference between antidepressants and benzodiazepines was found (RR 1.67, 95% CI 0.64 to 4.36; participants = 465; studies = 4), with a substantial heterogeneity (I² = 81%) (Analysis 24.2).
24.2. Analysis.

Comparison 24 Psychiatric comorbidities excluded ‐ Antidepressants versus benzodiazepines, Outcome 2 Total number of dropouts.
TCAs versus benzodiazepines
Failure to respond
No studies were excluded, so the results did not change (Analysis 2.1).
Total number of dropouts
Excluding two studies that included participants with psychiatric co‐morbidities (CNCPS 1992; Taylor 1990) did not substantially change the results (RR 1.67, 95% CI 0.64 to 4.36; participants = 465; studies = 4), with a substantial heterogeneity (I² = 81%) (Analysis 25.1).
25.1. Analysis.

Comparison 25 Psychiatric comorbidities excluded ‐ TCAs versus benzodiazepines, Outcome 1 Total number of dropouts.
SSRIs versus benzodiazepines
Excluding studies that included participants with psychiatric co‐morbidities, no trials provided data for this analysis.
TCAs versus SSRIs
Failure to respond
Excluding one study that included participants with psychiatric co‐morbidities (Bystritsky 1995) did not change the results (RR 1.03, 95% CI 0.66 to 1.61; participants = 416; studies = 3). The heterogeneity was moderate (I² = 69%) (Analysis 26.1).
26.1. Analysis.
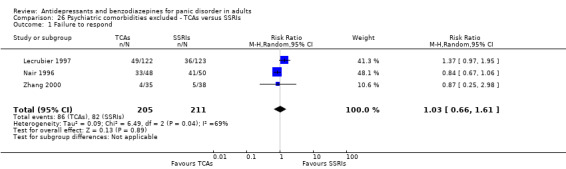
Comparison 26 Psychiatric comorbidities excluded ‐ TCAs versus SSRIs, Outcome 1 Failure to respond.
Total number of dropouts
Excluding one study that included participants with psychiatric co‐morbidities (Bystritsky 1995) did not change the results (RR 0.96, 95% CI 0.62 to 1.49; participants = 906; studies = 6). The heterogeneity was moderate (I² = 54%) (Analysis 26.2).
26.2. Analysis.
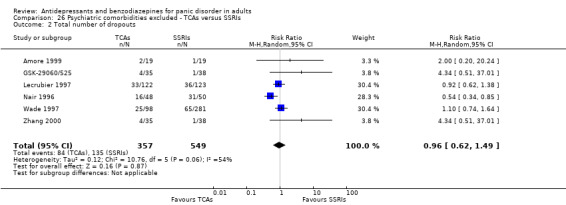
Comparison 26 Psychiatric comorbidities excluded ‐ TCAs versus SSRIs, Outcome 2 Total number of dropouts.
TCAs versus MAOIs
No studies were excluded, so the results did not change (Analysis 5.1; Analysis 5.2).
SSRIs versus MAOIs
No studies were excluded, so the results did not change (Analysis 6.1; Analysis 6.2).
SSRIs versus SNRIs
No studies were excluded, so the results did not change (Analysis 7.1; Analysis 7.2).
SSRIs versus NaSSAs
Failure to respond
No data were available for this analysis.
Total number of dropouts
No studies were excluded, so the results did not change (Analysis 8.2).
Individual antidepressants versus individual antidepressants
Failure to respond
Excluding one study that included participants with psychiatric co‐morbidities (Pfizer 2008) did not change the results on sertraline versus paroxetine (RR 0.98, 95% CI 0.78 to 1.23; participants = 225; studies = 1) (Analysis 27.1).
27.1. Analysis.
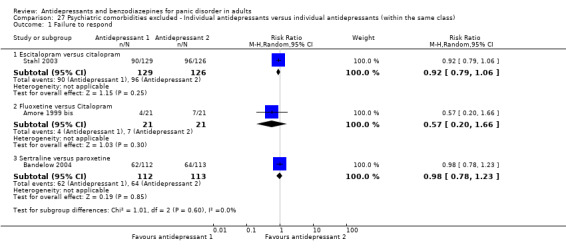
Comparison 27 Psychiatric comorbidities excluded ‐ Individual antidepressants versus individual antidepressants (within the same class), Outcome 1 Failure to respond.
Total number of dropouts
Excluding two studies which included participants with psychiatric co‐morbidities (Gentil 1993; Pfizer 2008), the conclusion changed from the main analysis, showing no difference between sertraline and paroxetine (RR 0.85, 95% CI 0.57 to 1.26; participants = 225; studies = 1) (Analysis 27.2).
27.2. Analysis.

Comparison 27 Psychiatric comorbidities excluded ‐ Individual antidepressants versus individual antidepressants (within the same class), Outcome 2 Total number of dropouts.
Individual benzodiazepines versus individual benzodiazepines
Failure to respond
No studies were excluded, so the results did not change (Analysis 11.1).
Total number of dropouts
Excluding one study that included participants with psychiatric co‐morbidities (Tesar 1991) the results did not change (RR 0.84, 95% CI 0.44 to 1.64; participants = 159; studies = 1) (Analysis 28.1).
28.1. Analysis.
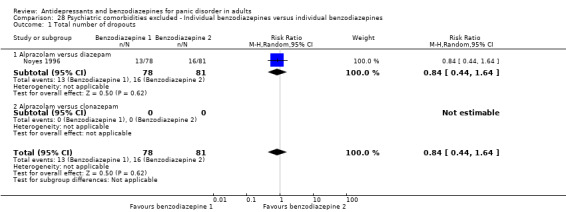
Comparison 28 Psychiatric comorbidities excluded ‐ Individual benzodiazepines versus individual benzodiazepines, Outcome 1 Total number of dropouts.
Excluding studies mostly focused on agoraphobia
This sensitivity analysis was not carried out as no studies were "mostly focused on agoraphobia".
Applying best and worst case scenarios to studies where participants left the study before the endpoint
The main analyses, according to the study protocol, considered participants who discontinued early as treatment failures (worst‐case scenario) as this approach was considered more conservative. A sensitivity analysis based on a best‐case scenario, which considers all dropouts as responders or remitters, was not feasible as the vast majority of studies carried forward, and included in the analyses, some observations on dropouts. This did not allow us to make the assumptions that all dropouts were responders.
Excluding studies where responding participants are calculated according to an imputation method (comparisons 29‐30)
Antidepressants versus benzodiazepines
No studies were excluded, so the results did not change (Analysis 1.1; Analysis 1.2).
TCAs versus benzodiazepines
No studies were excluded, so the results did not change (Analysis 2.1; Analysis 2.2).
SSRIs versus benzodiazepines
No studies were excluded, so the results did not change (Analysis 3.1; Analysis 3.2).
TCAs versus SSRIs
Failure to respond
Excluding two studies where imputation methods were used (Bystritsky 1995; Nair 1996)did not substantially change the results (RR 1.33, 95% CI 0.95 to 1.86; participants = 318; studies = 2; I² = 0%) (Analysis 29.1).
29.1. Analysis.
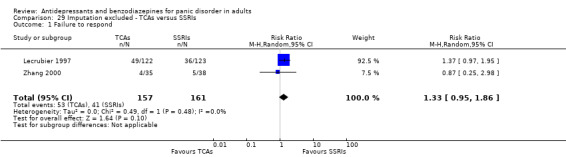
Comparison 29 Imputation excluded ‐ TCAs versus SSRIs, Outcome 1 Failure to respond.
Total number of dropouts
Excluding two studies where imputation methods were used (Bystritsky 1995; Nair 1996)did not substantially change the results (RR 1.08, 95% CI 0.80 to 1.45; participants = 808; studies = 5; I² = 4%) (Analysis 29.2).
29.2. Analysis.

Comparison 29 Imputation excluded ‐ TCAs versus SSRIs, Outcome 2 Total number of dropouts.
TCAs versus MAOIs
No studies were excluded, so the results did not change (Analysis 5.1; Analysis 5.2).
SSRIs versus MAOIs
No studies were excluded, so the results did not change (Analysis 6.1; Analysis 6.2).
SSRIs versus SNRIs
No studies were excluded, so the results did not change (Analysis 7.1; Analysis 7.2).
SSRIs versus NaSSAs
Failure to respond
No data were available for this analysis.
Total number of dropouts
No studies were excluded, so the results did not change (Analysis 8.2).
Individual antidepressants versus individual antidepressants
Failure to respond
Excluding two studies where imputation methods were used (Bandelow 2004; Stahl 2003), the results on sertraline versus paroxetine did not change (RR 0.95, 95% CI 0.70 to 1.30; participants = 321; studies = 1) (Analysis 30.1).
30.1. Analysis.
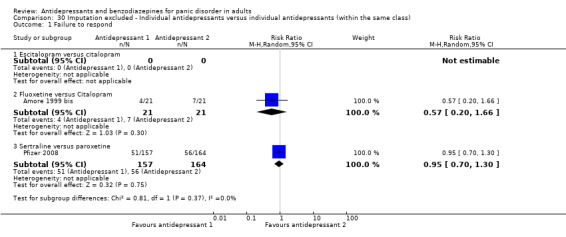
Comparison 30 Imputation excluded ‐ Individual antidepressants versus individual antidepressants (within the same class), Outcome 1 Failure to respond.
Total number of dropouts
Excluding two studies where imputation methods were used (Bandelow 2004; Stahl 2003), the results on sertraline versus paroxetine did not change (RR 0.62, 95% CI 0.40 to 0.97; participants = 321; studies = 1; I² = 0%) (Analysis 30.2).
30.2. Analysis.

Comparison 30 Imputation excluded ‐ Individual antidepressants versus individual antidepressants (within the same class), Outcome 2 Total number of dropouts.
Individual benzodiazepines versus individual benzodiazepines
No studies were excluded, so the results did not change (Analysis 11.1; Analysis 11.2).
Excluding studies where irregular benzodiazepine use was allowed after the first 15 days after random allocation (comparisons 31‐33)
Antidepressants versus benzodiazepines
No studies were excluded, so the results did not change (Analysis 1.1; Analysis 1.2).
TCAs versus benzodiazepines
No studies were excluded from this comparison because of the irregular use of benzodiazepines, so the results did not change (Analysis 2.1; Analysis 2.2).
SSRIs versus benzodiazepines
No studies were excluded, so the results did not change (Analysis 3.1; Analysis 3.2).
TCAs versus SSRIs
Failure to respond
Excluding two studies in which irregular use of benzodiazepines was allowed (Lecrubier 1997; Nair 1996) did not change the results (RR 1.22, 95% CI 0.47 to 3.15; participants = 95; studies = 2; I² = 0%) (Analysis 31.1).
31.1. Analysis.

Comparison 31 Irregular benzodiazepines use excluded ‐ TCAs versus SSRIs, Outcome 1 Failure to respond.
Total number of dropouts
Excluding two studies in which irregular use of benzodiazepines was allowed (Lecrubier 1997; Nair 1996) did not change the results (RR 1.24, 95% CI 0.85 to 1.81; participants = 585; studies = 5; I² = 0%) (Analysis 31.2).
31.2. Analysis.
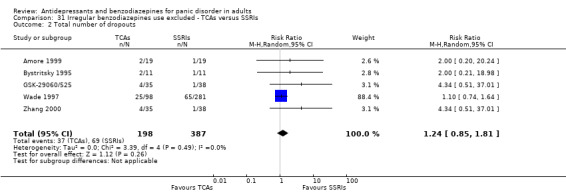
Comparison 31 Irregular benzodiazepines use excluded ‐ TCAs versus SSRIs, Outcome 2 Total number of dropouts.
TCAs versus MAOIs
Excluding studies in which irregular use of benzodiazepines was allowed, no trials provided data for this analysis.
SSRIs versus MAOIs
Failure to respond
Excluding one study in which irregular use of benzodiazepines was allowed (Van Vliet 1996) did not change the results (RR 1.08, 95% CI 0.76 to 1.54; participants = 366; studies = 1; I² = 0%) (Analysis 32.1).
32.1. Analysis.
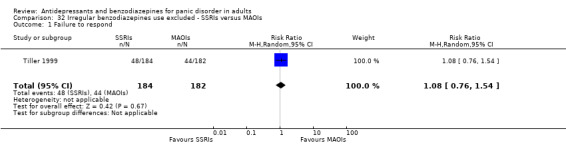
Comparison 32 Irregular benzodiazepines use excluded ‐ SSRIs versus MAOIs, Outcome 1 Failure to respond.
Total number of dropouts
Excluding studies in which irregular use of benzodiazepines was allowed, no trials provided data for this analysis.
SSRIs versus SNRIs
No studies were excluded, so the results did not change (Analysis 7.1; Analysis 7.2).
SSRIs versus NaSSAs
Failure to respond
No data were available for this analysis.
Total number of dropouts
No studies were excluded, so the results did not change (Analysis 8.2).
Individual antidepressants versus individual antidepressants
Failure to respond
Excluding two studies in which irregular use of benzodiazepines was allowed (Bandelow 2004; Stahl 2003) did not change the results for sertraline versus paroxetine (RR 0.95, 95% CI 0.70 to 1.30; participants = 321; studies = 1; I² = 0%) (Analysis 33.1).
33.1. Analysis.
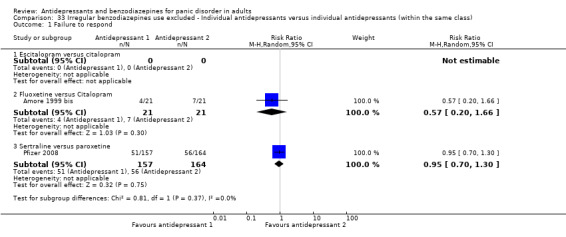
Comparison 33 Irregular benzodiazepines use excluded ‐ Individual antidepressants versus individual antidepressants (within the same class), Outcome 1 Failure to respond.
Total number of dropouts
Excluding two studies in which irregular use of benzodiazepines was allowed (Bandelow 2004; Stahl 2003) did not change the results for sertraline versus paroxetine (RR 0.62, 95% CI 0.40 to 0.97; participants = 321; studies = 1; I² = 0%) (Analysis 33.2).
33.2. Analysis.
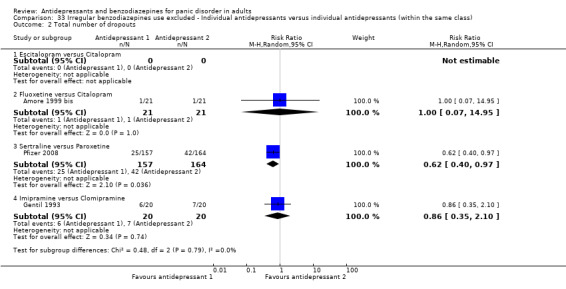
Comparison 33 Irregular benzodiazepines use excluded ‐ Individual antidepressants versus individual antidepressants (within the same class), Outcome 2 Total number of dropouts.
Individual benzodiazepines versus individual benzodiazepines
No studies were excluded, so the results did not change (Analysis 11.1; Analysis 11.2).
Reporting Bias
We did not visually inspect funnel plots to assess publication bias as no comparison included at least 10 studies.
Discussion
Summary of main results
By systematically reviewing the comparative efficacy and tolerability of antidepressants and benzodiazepines for panic disorder in adults (see also Table 1; Table 2; Table 3; Table 4; Table 5; Table 6; Table 7; Table 8) we were able to include 35 studies with 6785 participants, 5365 of which in the arms of interest. However, considering the high number of individual medicines included, very few studies and participants contributed to individual comparisons. Even when antidepressants and benzodiazepines were considered as homogeneous groups, limited data were identified.
We found low‐quality evidence that failed to find a difference between antidepressants and benzodiazepines in terms of efficacy measured as response rate. The same finding was observed when serotonin reuptake inhibitors (SSRIs) and tricyclic antidepressants (TCAs) were compared with benzodiazepines. However, only two studies with 215 participants contributed to this analysis, so it is not possible to determine whether there is a clinically important difference between antidepressants and benzodiazepines.
Analysis of remission rates showed a benefit for benzodiazepines compared to antidepressants, even if the effect was very small and close to no difference.
There was no difference between antidepressants and benzodiazepines in terms of efficacy on panic symptoms, frequency of panic attacks, agoraphobia and general anxiety.
We observed a difference in favour of antidepressants over benzodiazepines in terms of depressive symptoms (standardised mean difference (SMD) ‐0.14, 95% confidence interval (CI) ‐0.29 to 0.02; participants = 892; studies = 6; I2 = 7%), although the confidence interval was of borderline statistical significance and the magnitude of effect of uncertain clinical meaning. This difference was still present when the SSRIs were compared with benzodiazepines, but not when TCAs were compared with benzodiazepines.
In terms of tolerability, we found evidence suggesting a benefit for benzodiazepines compared to antidepressants when looking at number of dropouts due to any cause (risk ratio (RR) 1.64, 95% CI 1.03 to 2.63; participants = 1449; studies = 7), even if the degree of heterogeneity between studies was substantial (I2 = 75%) and the wide confidence interval close to no difference. In terms of dropout due to adverse effects, a meta‐analysis of three studies showed that benzodiazepines were better tolerated in comparison with antidepressants as a whole (RR 1.72, 95% CI 1.03 to 2.87; participants = 1002) and with TCAs (RR 2.10, 95% CI 1.13 to 3.93; participants = 848; two studies), but not in comparison with the SSRIs. For the SSRIs, in terms of participants who dropped out due to any cause, we found a difference in favour of benzodiazepines, although only one study contributed to this analysis (RR 1.71, 95% CI 1.03 to 2.84; participants = 154). Only one study provided information on the number of patients experiencing adverse effect, showing no difference between antidepressants and benzodiazepines.
When looking at the comparisons between antidepressants, a meta‐analysis of four studies confirmed a benefit for SSRIs compared to TCAs in terms of number of patients experiencing adverse effects (RR 1.29, 95% CI 1.02 to 1.65; participants = 489; studies = 4; I2 = 78%), although the magnitude of effect is small. Low‐quality evidence suggests that there is no significant difference between the class of TCAs and the class of SSRIs in terms of response rate (four studies, 438 participants) and dropout due to any reason (seven studies, 928 participants).
When looking at the comparison between individual benzodiazepines, the available evidence, focused on a small number of medicines (alprazolam, clonazepam and diazepam), suggests that there is no significant difference between individual benzodiazepines in terms of response rate and dropout due to any reason.
Overall completeness and applicability of evidence
The identified studies are not sufficient to comprehensively address the objectives of the present review. The majority of studies enrolled a very small number of participants and did not provide data for all the outcomes specified in the protocol. For these reasons, most of the analyses were underpowered and this relevantly limits the overall completeness of evidence. For the primary efficacy outcome, pooling of results was possible in two studies, and for many secondary outcomes data were too sparse to allow reasonable conclusions to be drawn. For most comparisons, confidence intervals were very wide and could not rule out the possibility of clinically relevant differences. Therefore, the main question of whether there are differences between antidepressants and benzodiazepines, and between individual antidepressants and individual benzodiazepines, remains unanswered. This situation will unlikely change in the future as recent studies no longer focus on the efficacy of benzodiazepines.
Only short‐term data on acceptability and adverse effects of antidepressants and benzodiazepines were available. Clinically, this is a major limitation as long‐term use of benzodiazepines is controversial due to concerns about adverse psychological and physical effects, physical dependence and withdrawal. Similar concerns have been raised for long‐term exposure to antidepressants, in particular the SSRIs.
In terms of applicability, considering the very low number of participants, it is difficult to assume that this population could reflect the complexity of people with panic disorder from a 'real world' setting.
Quality of the evidence
The overall methodological quality of the included studies was poor. No study showed an overall low risk of bias. The majority of studies showed mixed features, with a large prevalence of an unclear risk of bias in different domains, which seems to reflect the lack of exhaustive reporting rather than a clear evidence of bias. This is consistent with the finding of a general sub‐optimal reporting of randomised controlled trials (RCTs) in medical journals, despite the large diffusion of instruments designed to help transparent reporting, such as the CONSORT (Consolidated Standards of Reporting Trials) statement.
The GRADE (Grading of Recommendations, Assessment, Development and Evaluations) methodology allows the provision of outcome‐specific information concerning the overall quality of evidence. In general, the confidence in the estimate of effect appeared to be from 'very low' to 'moderate' for most of the outcomes assessed. This judgement is primarily due to limitations in the included studies (high dropout rates), imprecision (wide confidence intervals) and inconsistency (heterogeneity between studies results). In accordance with that, any estimate of effect should be considered very uncertain, and further research is very likely to change the estimate of effect and thus the degree of confidence for its applicability in routine clinical practice.
Potential biases in the review process
Several possible limitations of this review should be highlighted. Some limitations are intrinsically related to the actual process of retrieving, collecting, selecting and extracting data. In order to reduce the potential bias of this complex process two authors independently worked on each of these steps. It has been highlighted that two independent extractors are overall more reliable than the extraction performed by a single author followed by verification by a second author (Buscemi 2006). We applied the same process for the 'Risk of bias' assessment. Furthermore, disagreements were discussed with a third author, who also checked the data extracted from RCTs when the analysis was performed. Another relevant problem concerns the 'systematic' nature of the search. We chose to include only randomised trials as they provide the strongest level of evidence available. In this type of review there is some risk of publication bias, which means that negative studies may not have been published. Although the search was thorough, it is possible that unpublished studies have not been identified, considering that there are no shared procedures to perform this kind of search. The impact of unpublished literature on the results of this review is uncertain, however it is expected that the analysis of only published literature would lead to overestimation of the efficacy of a given intervention. We did not check this formally with a funnel plot analysis, as less than 10 studies contributed to any analyses, thus making the funnel plot methodology less informative.
It is important to bear in mind that some of the included studies were funded by the pharmaceutical industry, and this may again introduce an overestimation of the efficacy of interventions.
Agreements and disagreements with other studies or reviews
The results of this systematic review are not completely in line with respect to previous reviews and meta‐analyses. Offidani and colleagues, who compared benzodiazepines and antidepressants in panic disorder, found that benzodiazepines were more effective than TCAs in terms of response to treatment (Offidani 2013). However, the Offidani review included a single‐blind study, three reports that are part of the same multicentre trial (CNCPS 1992), and studies with participants with a primary diagnosis other than panic disorder. Further, different definitions of response rate were applied.
Based on data from our review, the only evidence in terms of efficacy that favours benzodiazepines is about remission rates. We may argue that this outcome is usually measured in a more standard way than response rates, looking at patients who are free from panic attacks. In these terms, benzodiazepines may have the edge over antidepressants.
Further, we found that benzodiazepines are better tolerated than antidepressants; for example, in terms of participants who dropped out due to any cause, we found a difference in favour of benzodiazepines over antidepressants, and this difference is more significant in the comparison with SSRIs (that were not included in the previous review by Offidani). However, it should be recognised that short‐term randomised studies can not provide a comprehensive assessment of the harmful consequences associated with drug treatment, including long‐term exposure. This holds particularly true for benzodiazepines, as most concerns refer to long‐term exposure to these agents. The role of benzodiazepines is still controversial; according to NICE guidelines benzodiazepines are not recommended for panic disorder, precisely because of less favourable long‐term outcomes (NICE 2011). However, some authors claim for a reconsideration of the role of benzodiazepines, suggesting that they can be effective and safe in the long‐term use for anxiety disorders, including panic disorder (Starcevic 2014).
Bakker and colleagues, who carried out a systematic review comparing TCAs and SSRIs in people with panic disorder, concluded that TCAs and SSRI were equally effective (Bakker 2002). Similarly to Bakker and colleagues, we did not find any difference between TCAs and SSRI in terms of efficacy, but we note that a power problem might limit the interpretation of this finding. For all efficacy outcomes, the confidence intervals were wide and could not exclude the possibility of a type‐II error, namely not detecting a difference which might be real because too few participants contributed to the analysis. However, we agree with Bakker and colleagues in noting that there are no strong pre‐defined reasons to hypothesise that these two classes of antidepressants should differ in terms of efficacy in panic disorder. We argue that only adding the result of this systematic review to the other ongoing Cochrane reviews in patients with panic disorder will help rank treatments in terms of efficacy, possibly increasing statistical power by means of indirect comparisons.
Authors' conclusions
Implications for practice.
The identified studies are not sufficient to comprehensively address the objectives of the present review; the majority of studies enrolled a small number of participants and did not provide data for all the outcomes specified in the protocol. For these reasons most of the analyses were underpowered and this limits the overall completeness of evidence.
The findings of this review have few implications for people with panic disorder. Choice of treatment should be guided by patient's preference, if clinically appropriate; patients and their families should continue to reflect with clinicians about the basis of their care and the reasoning behind using a specific antidepressant or benzodiazepine, also taking into account possible psychiatric or medical co‐morbidities.
In general, based on the results of the current review, the possible role of antidepressants and benzodiazepines should be assessed each time by the clinician on an individual basis. The choice of which antidepressant and/or benzodiazepine should be prescribed can hardly be made on the basis of this review only, and rather it may be based on whole amount of evidence on antidepressant and benzodiazepine efficacy and tolerability, including data from placebo‐controlled studies. Data on long‐term tolerability issues associated with antidepressant and benzodiazepine exposure should also be carefully considered.
Implications for research.
The results described in this systematic review come from evidence of low to very low quality according to the GRADE methodology. Moreover, in many cases, studies were financially supported by pharmaceutical industries. Consequently, there is a high risk that these studies do not provide sufficient and adequate information for clinicians in real‐world settings.The present review highlights the strong need for further higher‐quality studies comparing benzodiazepines with antidepressants, which should be conducted with high‐methodological standards and with the primary intent of providing clinicians with useful practical data on the effectiveness of antidepressant drugs and benzodiazepines, in head‐to‐head comparisons with sufficient statistical power to detect clinically meaningful differences. Alongside rating scales, pragmatic outcome measures, such as quality of life and social functioning, should also be considered.
In the meantime, it seems reasonable to make the best use of available evidence. The results of this systematic review will contribute to a Cochrane network meta‐analysis of drug treatments for patients with panic disorder which is in progress, aiming to rank available drug treatments for efficacy and tolerability.
Notes
This review is one of a number of separate reviews examining the efficacy and tolerability of pharmacological and non‐pharmacological treatments for panic disorders. These individual reviews will then be combined in a multiple‐treatment meta‐analysis using multiple‐treatments model methodology (protocol published in the Cochrane Database of Systematic Reviews). Please note that the majority of the text in the Methods sections for these protocols is identical since the full reviews will be following the same methodology.
Acknowledgements
We would like to thank the CCMD Editorial Team for their support, information and advice.
We would like to thank all authors who answered our requests for additional data, and especially Drs. Bandelow, Lavori, and Stahl.
We also thank Dr. Peiyao Chen for the help provided with Chinese papers.
CRG funding
The National Institute for Health Research (NIHR) is the largest single funder of the Cochrane Common Mental Disorders Review Group.
Disclaimer
The views and opinions expressed herein are those of the authors and do not necessarily reflect those of the NIHR, NHS or the Department of Health.
Appendices
Appendix 1. Cochrane Specialised Register ‐ core MEDLINE search strategy
Core search strategy used to inform the Cochrane Common Mental Disorders Group's specialised register: OVID MEDLINE A weekly search alert based on condition + RCT filter only 1. [MeSH Headings]: eating disorders/ or anorexia nervosa/ or binge‐eating disorder/ or bulimia nervosa/ or female athlete triad syndrome/ or pica/ or hyperphagia/ or bulimia/ or self‐injurious behavior/ or self mutilation/ or suicide/ or suicidal ideation/ or suicide, attempted/ or mood disorders/ or affective disorders, psychotic/ or bipolar disorder/ or cyclothymic disorder/ or depressive disorder/ or depression, postpartum/ or depressive disorder, major/ or depressive disorder, treatment‐resistant/ or dysthymic disorder/ or seasonal affective disorder/ or neurotic disorders/ or depression/ or adjustment disorders/ or exp antidepressive agents/ or anxiety disorders/ or agoraphobia/ or neurocirculatory asthenia/ or obsessive‐compulsive disorder/ or obsessive hoarding/ or panic disorder/ or phobic disorders/ or stress disorders, traumatic/ or combat disorders/ or stress disorders, post‐traumatic/ or stress disorders, traumatic, acute/ or anxiety/ or anxiety, castration/ or koro/ or anxiety, separation/ or panic/ or exp anti‐anxiety agents/ or somatoform disorders/ or body dysmorphic disorders/ or conversion disorder/ or hypochondriasis/ or neurasthenia/ or hysteria/ or munchausen syndrome by proxy/ or munchausen syndrome/ or fatigue syndrome, chronic/ or obsessive behavior/ or compulsive behavior/ or behavior, addictive/ or impulse control disorders/ or firesetting behavior/ or gambling/ or trichotillomania/ or stress, psychological/ or burnout, professional/ or sexual dysfunctions, psychological/ or vaginismus/ or Anhedonia/ or Affective Symptoms/ or *Mental Disorders/
2. [Title/ Author Keywords]: (eating disorder* or anorexia nervosa or bulimi* or binge eat* or (self adj (injur* or mutilat*)) or suicide* or suicidal or parasuicid* or mood disorder* or affective disorder* or bipolar i or bipolar ii or (bipolar and (affective or disorder*)) or mania or manic or cyclothymic* or depression or depressive or dysthymi* or neurotic or neurosis or adjustment disorder* or antidepress* or anxiety disorder* or agoraphobia or obsess* or compulsi* or panic or phobi* or ptsd or posttrauma* or post trauma* or combat or somatoform or somati#ation or medical* unexplained or body dysmorphi* or conversion disorder or hypochondria* or neurastheni* or hysteria or munchausen or chronic fatigue* or gambling or trichotillomania or vaginismus or anhedoni* or affective symptoms or mental disorder* or mental health).ti,kf.
3. [RCT filter]: (controlled clinical trial.pt. or randomized controlled trial.pt. or (randomi#ed or randomi#ation).ab,ti. or randomly.ab. or (random* adj3 (administ* or allocat* or assign* or class* or control* or determine* or divide* or distribut* or expose* or fashion or number* or place* or recruit* or subsitut* or treat*)).ab. or placebo*.ab,ti. or drug therapy.fs. or trial.ab,ti. or groups.ab. or (control* adj3 (trial* or study or studies)).ab,ti. or ((singl* or doubl* or tripl* or trebl*) adj3 (blind* or mask* or dummy*)).mp. or clinical trial, phase ii/ or clinical trial, phase iii/ or clinical trial, phase iv/ or randomized controlled trial/ or pragmatic clinical trial/ or (quasi adj (experimental or random*)).ti,ab. or ((waitlist* or wait* list* or treatment as usual or TAU) adj3 (control or group)).ab.)
4. (1 and 2 and 3)
Records are screened for reports of RCTs within the scope of the Cochrane Common Mental Disorders Group. Secondary reports of RCTs are tagged to the appropriate study record. Similar weekly search alerts are also conducted on OVID Embase and PsycINFO, using relevant subject headings (controlled vocabularies) and search syntax, appropriate to each resource.
Appendix 2. Review search: CCDANCTR‐References Register
#1 panic #2 (antidepress* or anti‐depress* or "anti depress*" or MAOI* or RIMA* or “monoamine oxidase inhibit*” or ((serotonin or norepinephrine or noradrenaline or neurotransmitter* or dopamin*) NEAR (uptake or reuptake or re‐uptake or "re uptake")) or SSRI* or SNRI* or NARI* or SARI* or NDRI* or TCA* or tricyclic* or tetracyclic*) #3 (Agomelatine or Alaproclate or Amoxapine or Amineptine or Amitriptylin* or Amitriptylinoxide or Atomoxetine or Befloxatone or Benactyzine or Binospirone or Brofaromine or (Buproprion or Amfebutamone) or Butriptyline or Caroxazone or Cianopramine or Cilobamine or Cimoxatone or Citalopram or (Chlorimipramin* or Clomipramin* or Chlomipramin* or Clomipramine) or Clorgyline or Clovoxamine or (CX157 or Tyrima) or Demexiptiline or Deprenyl or (Desipramine* or Pertofrane) or Desvenlafaxine or Dibenzepin or Diclofensine or Dimetacrin* or Dosulepin or Dothiepin or Doxepin or Duloxetine or Desvenlafaxine or DVS‐233) #4 (Escitalopram or Etoperidone or Femoxetine or Fluotracen or Fluoxetine or Fluvoxamine or (Hyperforin or Hypericum or “St John*”) or Imipramin* or Iprindole or Iproniazid* or Ipsapirone or Isocarboxazid* or Levomilnacipran or Lofepramine* or (“Lu AA21004” or Vortioxetine) or "Lu AA24530" or (LY2216684 or Edivoxetine) or Maprotiline or Melitracen or Metapramine or Mianserin or Milnacipran or Minaprine or Mirtazapine or Moclobemide or Nefazodone or Nialamide or Nitroxazepine or Nomifensine or Norfenfluramine or Nortriptylin* or Noxiptilin*) #5 (Opipramol or Oxaflozane or Paroxetine or Phenelzine or Pheniprazine or Pipofezine or Pirlindole or Pivagabine or Pizotyline or Propizepine or Protriptylin* or Quinupramine or Reboxetine or Rolipram or Scopolamine or Selegiline or Sertraline or Setiptiline or Teciptiline or Thozalinone or Tianeptin* or Toloxatone or Tranylcypromin* or Trazodone or Trimipramine or Venlafaxine or Viloxazine or Vilazodone or Viqualine or Zalospirone) #6 (#2 or #3 or #4 or #5) #7 (Benzodiazepin* or BZD or Abecarnil or Adinazolam or Alprazolam or Arfendazam or Bentazepam or Bretazenil or Bromazepam or Brotizolam or Camazepam or Chlordiazepoxide or Chlordesmethyldiazepam or Cinolazepam or Clobazam or Clonazepam or Clorazepate or Chlorazepate or Clotiazepam or Cloxazolam or Delorazepam or Demoxepam or Desmethyldiazepam or Desoxydemoxepam or Devazepide or Diazepam or Doxefazepam or Estazolam or “ethyl loflazepate” or “CM 6912” or CM‐6912 or Etizolam or Fludiazepam or Flunitrazepam or Flurazepam or dealkylflurazepam or Flutoprazepam or Fosazepam or Gidazepam or Girisopam or Halazepam or Haloxazolam or Ketazolam or Loflazepate or Loprazolam or Lorazepam or Lormetazepam or Meclonazepam or Medazepam or Metaclazepam or Mexazolam or Midazolam or Nerisopam or Nimetazepam or Nitrazepam or Norchlordiazepoxide or Norclobazam or Nordazepam or Norfludiazepam or Norflunitrazepam or Oxazepam or “WY 3498” or WY‐3498 or Oxazolam or Phenazepam or Pinazepam or Prazepam or Premazepam or Propazepam or Quazepam or Ripazepam or Serazepine or Sograzepide or Talampanel or Tarazepide or Temazepam or Tetrazepam or Tofisopam or Triazolam or (Zolazepam or Zaleplon or Zolpidem or Zopiclone or Eszopiclone or Z‐Drugs or “Z Drugs”)) #8 (#1 and (#6 or #7)) #9 (“anxiety disorder*” and not (agoraphobi* or panic or (social and (anxi* or phobi*)) or generalised or generalized or obsessive or compulsive or OCD or PTSD or post‐trauma* or “post trauma*” or posttrauma* )):ti,ab,kw,ky,emt,mh,mc #10 (#9 and (#6 or #7)) #11 (#8 or #10)
Data and analyses
Comparison 1. Antidepressants versus benzodiazepines.
| Outcome or subgroup title | No. of studies | No. of participants | Statistical method | Effect size |
|---|---|---|---|---|
| 1 Failure to respond | 2 | 215 | Risk Ratio (M‐H, Random, 95% CI) | 0.99 [0.67, 1.47] |
| 1.1 TCAs versus BDZs | 1 | 61 | Risk Ratio (M‐H, Random, 95% CI) | 1.03 [0.63, 1.67] |
| 1.2 SSRIs versus BDZs | 1 | 154 | Risk Ratio (M‐H, Random, 95% CI) | 0.93 [0.48, 1.80] |
| 1.3 MAOIs versus BDZs | 0 | 0 | Risk Ratio (M‐H, Random, 95% CI) | 0.0 [0.0, 0.0] |
| 1.4 SNRIs versus BDZs | 0 | 0 | Risk Ratio (M‐H, Random, 95% CI) | 0.0 [0.0, 0.0] |
| 1.5 NaSSAs versus BDZs | 0 | 0 | Risk Ratio (M‐H, Random, 95% CI) | 0.0 [0.0, 0.0] |
| 1.6 NDRIs versus BDZs | 0 | 0 | Risk Ratio (M‐H, Random, 95% CI) | 0.0 [0.0, 0.0] |
| 1.7 NRIs versus BDZs | 0 | 0 | Risk Ratio (M‐H, Random, 95% CI) | 0.0 [0.0, 0.0] |
| 1.8 Other ADs versus BDZs | 0 | 0 | Risk Ratio (M‐H, Random, 95% CI) | 0.0 [0.0, 0.0] |
| 2 Total number of dropouts | 7 | 1449 | Risk Ratio (M‐H, Random, 95% CI) | 1.64 [1.03, 2.63] |
| 2.1 TCAs versus BDZs | 6 | 1295 | Risk Ratio (M‐H, Random, 95% CI) | 1.67 [0.93, 2.99] |
| 2.2 SSRIs versus BDZs | 1 | 154 | Risk Ratio (M‐H, Random, 95% CI) | 1.71 [1.03, 2.84] |
| 2.3 MAOIs versus BDZs | 0 | 0 | Risk Ratio (M‐H, Random, 95% CI) | 0.0 [0.0, 0.0] |
| 2.4 SNRIs versus BDZs | 0 | 0 | Risk Ratio (M‐H, Random, 95% CI) | 0.0 [0.0, 0.0] |
| 2.5 NaSSAs versus BDZs | 0 | 0 | Risk Ratio (M‐H, Random, 95% CI) | 0.0 [0.0, 0.0] |
| 2.6 NDRIs versus BDZs | 0 | 0 | Risk Ratio (M‐H, Random, 95% CI) | 0.0 [0.0, 0.0] |
| 2.7 NRIs versus BDZs | 0 | 0 | Risk Ratio (M‐H, Random, 95% CI) | 0.0 [0.0, 0.0] |
| 2.8 Other ADs versus BDZs | 0 | 0 | Risk Ratio (M‐H, Random, 95% CI) | 0.0 [0.0, 0.0] |
| 3 Failure to remit | 3 | 1002 | Risk Ratio (M‐H, Random, 95% CI) | 1.18 [1.01, 1.37] |
| 3.1 TCAs versus BDZs | 2 | 848 | Risk Ratio (M‐H, Random, 95% CI) | 1.19 [1.00, 1.41] |
| 3.2 SSRIs versus BDZs | 1 | 154 | Risk Ratio (M‐H, Random, 95% CI) | 1.12 [0.79, 1.59] |
| 3.3 MAOIs versus BDZs | 0 | 0 | Risk Ratio (M‐H, Random, 95% CI) | 0.0 [0.0, 0.0] |
| 3.4 SNRIs versus BDZs | 0 | 0 | Risk Ratio (M‐H, Random, 95% CI) | 0.0 [0.0, 0.0] |
| 3.5 NaSSAs versus BDZs | 0 | 0 | Risk Ratio (M‐H, Random, 95% CI) | 0.0 [0.0, 0.0] |
| 3.6 NDRIs versus BDZs | 0 | 0 | Risk Ratio (M‐H, Random, 95% CI) | 0.0 [0.0, 0.0] |
| 3.7 NRIs versus BDZs | 0 | 0 | Risk Ratio (M‐H, Random, 95% CI) | 0.0 [0.0, 0.0] |
| 3.8 Other ADs versus BDZs | 0 | 0 | Risk Ratio (M‐H, Random, 95% CI) | 0.0 [0.0, 0.0] |
| 4 Panic symptoms ‐ endpoint score | 3 | 1144 | Mean Difference (IV, Random, 95% CI) | ‐0.13 [‐1.06, 0.80] |
| 4.1 TCAs versus BDZs | 2 | 998 | Mean Difference (IV, Random, 95% CI) | ‐0.25 [‐1.72, 1.22] |
| 4.2 SSRIs versus BDZs | 1 | 146 | Mean Difference (IV, Random, 95% CI) | 0.10 [‐0.34, 0.54] |
| 4.3 MAOIs versus BDZs | 0 | 0 | Mean Difference (IV, Random, 95% CI) | 0.0 [0.0, 0.0] |
| 4.4 SNRIs versus BDZs | 0 | 0 | Mean Difference (IV, Random, 95% CI) | 0.0 [0.0, 0.0] |
| 4.5 NaSSAs versus BDZs | 0 | 0 | Mean Difference (IV, Random, 95% CI) | 0.0 [0.0, 0.0] |
| 4.6 NDRIs versus BDZs | 0 | 0 | Mean Difference (IV, Random, 95% CI) | 0.0 [0.0, 0.0] |
| 4.7 NRIs versus BDZs | 0 | 0 | Mean Difference (IV, Random, 95% CI) | 0.0 [0.0, 0.0] |
| 4.8 Other ADs versus BDZs | 0 | 0 | Mean Difference (IV, Random, 95% CI) | 0.0 [0.0, 0.0] |
| 5 Panic symptoms ‐ mean change | 1 | 44 | Mean Difference (IV, Random, 95% CI) | 0.40 [‐0.83, 1.63] |
| 5.1 TCAs versus BDZs | 1 | 44 | Mean Difference (IV, Random, 95% CI) | 0.40 [‐0.83, 1.63] |
| 5.2 SSRIs versus BDZs | 0 | 0 | Mean Difference (IV, Random, 95% CI) | 0.0 [0.0, 0.0] |
| 5.3 MAOIs versus BDZs | 0 | 0 | Mean Difference (IV, Random, 95% CI) | 0.0 [0.0, 0.0] |
| 5.4 SNRIs versus BDZs | 0 | 0 | Mean Difference (IV, Random, 95% CI) | 0.0 [0.0, 0.0] |
| 5.5 NaSSAs versus BDZs | 0 | 0 | Mean Difference (IV, Random, 95% CI) | 0.0 [0.0, 0.0] |
| 5.6 NDRIs versus BDZs | 0 | 0 | Mean Difference (IV, Random, 95% CI) | 0.0 [0.0, 0.0] |
| 5.7 NRIs versus BDZs | 0 | 0 | Mean Difference (IV, Random, 95% CI) | 0.0 [0.0, 0.0] |
| 5.8 Other ADs versus BDZs | 0 | 0 | Mean Difference (IV, Random, 95% CI) | 0.0 [0.0, 0.0] |
| 6 Frequency of panic attacks | 7 | 595 | Mean Difference (IV, Random, 95% CI) | 0.33 [‐0.72, 1.38] |
| 6.1 TCAs versus BDZs | 6 | 458 | Mean Difference (IV, Random, 95% CI) | 0.30 [‐0.81, 1.41] |
| 6.2 SSRIs versus BDZs | 1 | 137 | Mean Difference (IV, Random, 95% CI) | 1.20 [‐3.31, 5.71] |
| 6.3 MAOIs versus BDZs | 0 | 0 | Mean Difference (IV, Random, 95% CI) | 0.0 [0.0, 0.0] |
| 6.4 SNRIs versus BDZs | 0 | 0 | Mean Difference (IV, Random, 95% CI) | 0.0 [0.0, 0.0] |
| 6.5 NaSSAs versus BDZs | 0 | 0 | Mean Difference (IV, Random, 95% CI) | 0.0 [0.0, 0.0] |
| 6.6 NDRIs versus BDZs | 0 | 0 | Mean Difference (IV, Random, 95% CI) | 0.0 [0.0, 0.0] |
| 6.7 NRIs versus BDZs | 0 | 0 | Mean Difference (IV, Random, 95% CI) | 0.0 [0.0, 0.0] |
| 6.8 Other ADs versus BDZs | 0 | 0 | Mean Difference (IV, Random, 95% CI) | 0.0 [0.0, 0.0] |
| 7 Agoraphobia | 5 | 1061 | Std. Mean Difference (IV, Random, 95% CI) | 0.04 [‐0.08, 0.16] |
| 7.1 TCAs versus BDZs | 4 | 949 | Std. Mean Difference (IV, Random, 95% CI) | 0.04 [‐0.08, 0.17] |
| 7.2 SSRIs versus BDZs | 1 | 112 | Std. Mean Difference (IV, Random, 95% CI) | 0.0 [‐0.37, 0.37] |
| 7.3 MAOIs versus BDZs | 0 | 0 | Std. Mean Difference (IV, Random, 95% CI) | 0.0 [0.0, 0.0] |
| 7.4 SNRIs versus BDZs | 0 | 0 | Std. Mean Difference (IV, Random, 95% CI) | 0.0 [0.0, 0.0] |
| 7.5 NaSSAs versus BDZs | 0 | 0 | Std. Mean Difference (IV, Random, 95% CI) | 0.0 [0.0, 0.0] |
| 7.6 NDRIs versus BDZs | 0 | 0 | Std. Mean Difference (IV, Random, 95% CI) | 0.0 [0.0, 0.0] |
| 7.7 NRIs versus BDZs | 0 | 0 | Std. Mean Difference (IV, Random, 95% CI) | 0.0 [0.0, 0.0] |
| 7.8 Other ADs versus BDZs | 0 | 0 | Std. Mean Difference (IV, Random, 95% CI) | 0.0 [0.0, 0.0] |
| 8 General anxiety | 8 | 1365 | Std. Mean Difference (IV, Random, 95% CI) | 0.06 [‐0.25, 0.37] |
| 8.1 TCAs versus BDZs | 7 | 1238 | Std. Mean Difference (IV, Random, 95% CI) | 0.08 [‐0.28, 0.45] |
| 8.2 SSRIs versus BDZs | 1 | 127 | Std. Mean Difference (IV, Random, 95% CI) | ‐0.08 [‐0.42, 0.27] |
| 8.3 MAOIs versus BDZs | 0 | 0 | Std. Mean Difference (IV, Random, 95% CI) | 0.0 [0.0, 0.0] |
| 8.4 SNRIs versus BDZs | 0 | 0 | Std. Mean Difference (IV, Random, 95% CI) | 0.0 [0.0, 0.0] |
| 8.5 NaSSAs versus BDZs | 0 | 0 | Std. Mean Difference (IV, Random, 95% CI) | 0.0 [0.0, 0.0] |
| 8.6 NDRIs versus BDZs | 0 | 0 | Std. Mean Difference (IV, Random, 95% CI) | 0.0 [0.0, 0.0] |
| 8.7 NRIs versus BDZs | 0 | 0 | Std. Mean Difference (IV, Random, 95% CI) | 0.0 [0.0, 0.0] |
| 8.8 Other ADs versus BDZs | 0 | 0 | Std. Mean Difference (IV, Random, 95% CI) | 0.0 [0.0, 0.0] |
| 9 Depression | 6 | 892 | Std. Mean Difference (IV, Random, 95% CI) | ‐0.14 [‐0.29, 0.02] |
| 9.1 TCAs versus BDZs | 5 | 765 | Std. Mean Difference (IV, Random, 95% CI) | ‐0.08 [‐0.22, 0.06] |
| 9.2 SSRIs versus BDZs | 1 | 127 | Std. Mean Difference (IV, Random, 95% CI) | ‐0.46 [‐0.81, ‐0.11] |
| 9.3 MAOIs versus BDZs | 0 | 0 | Std. Mean Difference (IV, Random, 95% CI) | 0.0 [0.0, 0.0] |
| 9.4 SNRIs versus BDZs | 0 | 0 | Std. Mean Difference (IV, Random, 95% CI) | 0.0 [0.0, 0.0] |
| 9.5 NaSSAs versus BDZs | 0 | 0 | Std. Mean Difference (IV, Random, 95% CI) | 0.0 [0.0, 0.0] |
| 9.6 NDRIs versus BDZs | 0 | 0 | Std. Mean Difference (IV, Random, 95% CI) | 0.0 [0.0, 0.0] |
| 9.7 NRIs versus BDZs | 0 | 0 | Std. Mean Difference (IV, Random, 95% CI) | 0.0 [0.0, 0.0] |
| 9.8 Other ADs versus BDZs | 0 | 0 | Std. Mean Difference (IV, Random, 95% CI) | 0.0 [0.0, 0.0] |
| 10 Social functioning | 4 | 1007 | Std. Mean Difference (IV, Random, 95% CI) | 0.16 [‐0.12, 0.44] |
| 10.1 TCAs versus BDZs | 3 | 882 | Std. Mean Difference (IV, Random, 95% CI) | 0.23 [0.03, 0.42] |
| 10.2 SSRIs versus BDZs | 1 | 125 | Std. Mean Difference (IV, Random, 95% CI) | ‐0.22 [‐0.57, 0.13] |
| 10.3 MAOIs versus BDZs | 0 | 0 | Std. Mean Difference (IV, Random, 95% CI) | 0.0 [0.0, 0.0] |
| 10.4 SNRIs versus BDZs | 0 | 0 | Std. Mean Difference (IV, Random, 95% CI) | 0.0 [0.0, 0.0] |
| 10.5 NaSSAs versus BDZs | 0 | 0 | Std. Mean Difference (IV, Random, 95% CI) | 0.0 [0.0, 0.0] |
| 10.6 NDRIs versus BDZs | 0 | 0 | Std. Mean Difference (IV, Random, 95% CI) | 0.0 [0.0, 0.0] |
| 10.7 NRIs versus BDZs | 0 | 0 | Std. Mean Difference (IV, Random, 95% CI) | 0.0 [0.0, 0.0] |
| 10.8 Other ADs versus BDZs | 0 | 0 | Std. Mean Difference (IV, Random, 95% CI) | 0.0 [0.0, 0.0] |
| 11 Quality of life | 0 | 0 | Std. Mean Difference (IV, Random, 95% CI) | 0.0 [0.0, 0.0] |
| 11.1 TCAs versus BDZs | 0 | 0 | Std. Mean Difference (IV, Random, 95% CI) | 0.0 [0.0, 0.0] |
| 11.2 SSRIs versus BDZs | 0 | 0 | Std. Mean Difference (IV, Random, 95% CI) | 0.0 [0.0, 0.0] |
| 11.3 MAOIs versus BDZs | 0 | 0 | Std. Mean Difference (IV, Random, 95% CI) | 0.0 [0.0, 0.0] |
| 11.4 SNRIs versus BDZs | 0 | 0 | Std. Mean Difference (IV, Random, 95% CI) | 0.0 [0.0, 0.0] |
| 11.5 NaSSAs versus BDZs | 0 | 0 | Std. Mean Difference (IV, Random, 95% CI) | 0.0 [0.0, 0.0] |
| 11.6 NDRIs versus BDZs | 0 | 0 | Std. Mean Difference (IV, Random, 95% CI) | 0.0 [0.0, 0.0] |
| 11.7 NRIs versus BDZs | 0 | 0 | Std. Mean Difference (IV, Random, 95% CI) | 0.0 [0.0, 0.0] |
| 11.8 Other ADs versus BDZs | 0 | 0 | Std. Mean Difference (IV, Random, 95% CI) | 0.0 [0.0, 0.0] |
| 12 Patient satisfaction | 0 | 0 | Std. Mean Difference (IV, Random, 95% CI) | 0.0 [0.0, 0.0] |
| 12.1 TCAs versus BDZs | 0 | 0 | Std. Mean Difference (IV, Random, 95% CI) | 0.0 [0.0, 0.0] |
| 12.2 SSRIs versus BDZs | 0 | 0 | Std. Mean Difference (IV, Random, 95% CI) | 0.0 [0.0, 0.0] |
| 12.3 MAOIs versus BDZs | 0 | 0 | Std. Mean Difference (IV, Random, 95% CI) | 0.0 [0.0, 0.0] |
| 12.4 SNRIs versus BDZs | 0 | 0 | Std. Mean Difference (IV, Random, 95% CI) | 0.0 [0.0, 0.0] |
| 12.5 NaSSAs versus BDZs | 0 | 0 | Std. Mean Difference (IV, Random, 95% CI) | 0.0 [0.0, 0.0] |
| 12.6 NDRIs versus BDZs | 0 | 0 | Std. Mean Difference (IV, Random, 95% CI) | 0.0 [0.0, 0.0] |
| 12.7 NRIs versus BDZs | 0 | 0 | Std. Mean Difference (IV, Random, 95% CI) | 0.0 [0.0, 0.0] |
| 12.8 Other ADs versus BDZs | 0 | 0 | Std. Mean Difference (IV, Random, 95% CI) | 0.0 [0.0, 0.0] |
| 13 Economic costs | 0 | 0 | Std. Mean Difference (IV, Random, 95% CI) | 0.0 [0.0, 0.0] |
| 13.1 TCAs versus BDZs | 0 | 0 | Std. Mean Difference (IV, Random, 95% CI) | 0.0 [0.0, 0.0] |
| 13.2 SSRIs versus BDZs | 0 | 0 | Std. Mean Difference (IV, Random, 95% CI) | 0.0 [0.0, 0.0] |
| 13.3 MAOIs versus BDZs | 0 | 0 | Std. Mean Difference (IV, Random, 95% CI) | 0.0 [0.0, 0.0] |
| 13.4 SNRIs versus BDZs | 0 | 0 | Std. Mean Difference (IV, Random, 95% CI) | 0.0 [0.0, 0.0] |
| 13.5 NaSSAs versus BDZs | 0 | 0 | Std. Mean Difference (IV, Random, 95% CI) | 0.0 [0.0, 0.0] |
| 13.6 NDRIs versus BDZs | 0 | 0 | Std. Mean Difference (IV, Random, 95% CI) | 0.0 [0.0, 0.0] |
| 13.7 NRIs versus BDZs | 0 | 0 | Std. Mean Difference (IV, Random, 95% CI) | 0.0 [0.0, 0.0] |
| 13.8 Other ADs versus BDZs | 0 | 0 | Std. Mean Difference (IV, Random, 95% CI) | 0.0 [0.0, 0.0] |
| 14 Number of dropouts due to adverse effects | 3 | 1002 | Risk Ratio (M‐H, Random, 95% CI) | 1.72 [1.03, 2.87] |
| 14.1 TCAs versus BDZs | 2 | 848 | Risk Ratio (M‐H, Random, 95% CI) | 2.10 [1.13, 3.93] |
| 14.2 SSRIs versus BDZs | 1 | 154 | Risk Ratio (M‐H, Random, 95% CI) | 1.2 [0.55, 2.61] |
| 14.3 MAOIs versus BDZs | 0 | 0 | Risk Ratio (M‐H, Random, 95% CI) | 0.0 [0.0, 0.0] |
| 14.4 SNRIs versus BDZs | 0 | 0 | Risk Ratio (M‐H, Random, 95% CI) | 0.0 [0.0, 0.0] |
| 14.5 NaSSAs versus BDZs | 0 | 0 | Risk Ratio (M‐H, Random, 95% CI) | 0.0 [0.0, 0.0] |
| 14.6 NDRIs versus BDZs | 0 | 0 | Risk Ratio (M‐H, Random, 95% CI) | 0.0 [0.0, 0.0] |
| 14.7 NRIs versus BDZs | 0 | 0 | Risk Ratio (M‐H, Random, 95% CI) | 0.0 [0.0, 0.0] |
| 14.8 Other ADs versus BDZs | 0 | 0 | Risk Ratio (M‐H, Random, 95% CI) | 0.0 [0.0, 0.0] |
| 15 Number of patients experiencing at least one adverse effect | 1 | 154 | Risk Ratio (M‐H, Random, 95% CI) | 1.03 [0.92, 1.15] |
| 15.1 TCAs versus BDZs | 0 | 0 | Risk Ratio (M‐H, Random, 95% CI) | 0.0 [0.0, 0.0] |
| 15.2 SSRIs versus BDZs | 1 | 154 | Risk Ratio (M‐H, Random, 95% CI) | 1.03 [0.92, 1.15] |
| 15.3 MAOIs versus BDZs | 0 | 0 | Risk Ratio (M‐H, Random, 95% CI) | 0.0 [0.0, 0.0] |
| 15.4 SNRIs versus BDZs | 0 | 0 | Risk Ratio (M‐H, Random, 95% CI) | 0.0 [0.0, 0.0] |
| 15.5 NaSSAs versus BDZs | 0 | 0 | Risk Ratio (M‐H, Random, 95% CI) | 0.0 [0.0, 0.0] |
| 15.6 NDRIs versus BDZs | 0 | 0 | Risk Ratio (M‐H, Random, 95% CI) | 0.0 [0.0, 0.0] |
| 15.7 NRIs versus BDZs | 0 | 0 | Risk Ratio (M‐H, Random, 95% CI) | 0.0 [0.0, 0.0] |
| 15.8 Other ADs versus BDZs | 0 | 0 | Risk Ratio (M‐H, Random, 95% CI) | 0.0 [0.0, 0.0] |
Comparison 2. TCAs versus benzodiazepines.
| Outcome or subgroup title | No. of studies | No. of participants | Statistical method | Effect size |
|---|---|---|---|---|
| 1 Failure to respond | 1 | 61 | Risk Ratio (M‐H, Random, 95% CI) | 1.03 [0.63, 1.67] |
| 1.1 Imipramine versus BDZs | 1 | 61 | Risk Ratio (M‐H, Random, 95% CI) | 1.03 [0.63, 1.67] |
| 2 Total number of dropouts | 6 | 1295 | Risk Ratio (M‐H, Random, 95% CI) | 1.67 [0.93, 2.99] |
| 2.1 Imipramine versus BDZs | 5 | 980 | Risk Ratio (M‐H, Random, 95% CI) | 1.87 [1.47, 2.37] |
| 2.2 Clomipramine versus BDZs | 1 | 315 | Risk Ratio (M‐H, Random, 95% CI) | 0.69 [0.49, 0.98] |
| 3 Failure to remit | 2 | 848 | Risk Ratio (M‐H, Random, 95% CI) | 1.19 [1.00, 1.41] |
| 3.1 Imipramine versus BDZs | 2 | 848 | Risk Ratio (M‐H, Random, 95% CI) | 1.19 [1.00, 1.41] |
| 4 Panic symptoms ‐ endpoint score | 2 | 998 | Mean Difference (IV, Random, 95% CI) | ‐0.25 [‐1.72, 1.22] |
| 4.1 Imipramine versus BDZs | 1 | 777 | Mean Difference (IV, Random, 95% CI) | 0.5 [0.21, 0.79] |
| 4.2 Clomipramine versus BDZs | 1 | 221 | Mean Difference (IV, Random, 95% CI) | ‐1.00 [‐1.37, ‐0.63] |
| 5 Panic symptoms ‐ mean change | 1 | 44 | Mean Difference (IV, Random, 95% CI) | 0.40 [‐0.83, 1.63] |
| 5.1 Imipramine versus BDZs | 1 | 44 | Mean Difference (IV, Random, 95% CI) | 0.40 [‐0.83, 1.63] |
| 6 Frequency of panic attacks | 6 | 458 | Mean Difference (IV, Random, 95% CI) | 0.30 [‐0.81, 1.41] |
| 6.1 Imipramine versus BDZs | 5 | 237 | Mean Difference (IV, Random, 95% CI) | 0.75 [‐0.44, 1.94] |
| 6.2 Clomipramine versus BDZs | 1 | 221 | Mean Difference (IV, Random, 95% CI) | ‐1.6 [‐3.17, ‐0.03] |
| 7 Agoraphobia | 4 | 949 | Std. Mean Difference (IV, Random, 95% CI) | 0.04 [‐0.08, 0.17] |
| 7.1 Imipramine versus BDZs | 4 | 949 | Std. Mean Difference (IV, Random, 95% CI) | 0.04 [‐0.08, 0.17] |
| 8 General anxiety | 7 | 1238 | Std. Mean Difference (IV, Random, 95% CI) | 0.08 [‐0.28, 0.45] |
| 8.1 Imipramine versus BDZs | 6 | 1017 | Std. Mean Difference (IV, Random, 95% CI) | 0.22 [0.10, 0.35] |
| 8.2 Clomipramine versus BDZs | 1 | 221 | Std. Mean Difference (IV, Random, 95% CI) | ‐0.67 [‐0.94, ‐0.40] |
| 9 Depression | 5 | 765 | Std. Mean Difference (IV, Random, 95% CI) | ‐0.08 [‐0.22, 0.06] |
| 9.1 Imipramine versus BDZs | 5 | 765 | Std. Mean Difference (IV, Random, 95% CI) | ‐0.08 [‐0.22, 0.06] |
| 10 Social functioning | 3 | 882 | Mean Difference (IV, Random, 95% CI) | 0.25 [0.09, 0.42] |
| 10.1 Imipramine versus BDZs | 3 | 882 | Mean Difference (IV, Random, 95% CI) | 0.25 [0.09, 0.42] |
| 11 Quality of life | 0 | 0 | Std. Mean Difference (IV, Random, 95% CI) | 0.0 [0.0, 0.0] |
| 12 Patient satisfaction | 0 | 0 | Std. Mean Difference (IV, Random, 95% CI) | 0.0 [0.0, 0.0] |
| 13 Economic costs | 0 | 0 | Std. Mean Difference (IV, Random, 95% CI) | 0.0 [0.0, 0.0] |
| 14 Number of dropouts due to adverse effects | 2 | 848 | Risk Ratio (M‐H, Random, 95% CI) | 2.10 [1.13, 3.93] |
| 14.1 Imipramine versus BDZs | 2 | 848 | Risk Ratio (M‐H, Random, 95% CI) | 2.10 [1.13, 3.93] |
| 15 Number of patients experiencing at least one adverse effect | 0 | 0 | Risk Ratio (M‐H, Random, 95% CI) | 0.0 [0.0, 0.0] |
2.3. Analysis.

Comparison 2 TCAs versus benzodiazepines, Outcome 3 Failure to remit.
Comparison 3. SSRIs versus benzodiazepines.
| Outcome or subgroup title | No. of studies | No. of participants | Statistical method | Effect size |
|---|---|---|---|---|
| 1 Failure to respond | 1 | 154 | Risk Ratio (M‐H, Random, 95% CI) | 0.93 [0.48, 1.80] |
| 1.1 Paroxetine versus BDZs | 1 | 154 | Risk Ratio (M‐H, Random, 95% CI) | 0.93 [0.48, 1.80] |
| 2 Total number of dropouts | 1 | 154 | Risk Ratio (M‐H, Random, 95% CI) | 1.71 [1.03, 2.84] |
| 2.1 Paroxetine versus BDZs | 1 | 154 | Risk Ratio (M‐H, Random, 95% CI) | 1.71 [1.03, 2.84] |
| 3 Failure to remit | 1 | 154 | Risk Ratio (M‐H, Random, 95% CI) | 1.12 [0.79, 1.59] |
| 3.1 Paroxetine versus BDZs | 1 | 154 | Risk Ratio (M‐H, Random, 95% CI) | 1.12 [0.79, 1.59] |
| 4 Panic symptoms | 1 | 146 | Mean Difference (IV, Random, 95% CI) | 0.10 [‐0.34, 0.54] |
| 4.1 Paroxetine versus BDZs | 1 | 146 | Mean Difference (IV, Random, 95% CI) | 0.10 [‐0.34, 0.54] |
| 5 Frequency of panic attacks | 1 | 137 | Mean Difference (IV, Random, 95% CI) | 1.20 [‐3.31, 5.71] |
| 5.1 Paroxetine versus BDZs | 1 | 137 | Mean Difference (IV, Random, 95% CI) | 1.20 [‐3.31, 5.71] |
| 6 Agoraphobia | 1 | 112 | Std. Mean Difference (IV, Random, 95% CI) | 0.0 [‐0.37, 0.37] |
| 6.1 Paroxetine versus BDZs | 1 | 112 | Std. Mean Difference (IV, Random, 95% CI) | 0.0 [‐0.37, 0.37] |
| 7 General anxiety | 1 | 127 | Mean Difference (IV, Random, 95% CI) | ‐0.60 [‐3.35, 2.15] |
| 7.1 Paroxetine versus BDZs | 1 | 127 | Mean Difference (IV, Random, 95% CI) | ‐0.60 [‐3.35, 2.15] |
| 8 Depression | 1 | 127 | Mean Difference (IV, Random, 95% CI) | ‐3.60 [‐6.36, ‐0.84] |
| 8.1 Paroxetine versus BDZs | 1 | 127 | Mean Difference (IV, Random, 95% CI) | ‐3.60 [‐6.36, ‐0.84] |
| 9 Social functioning | 1 | 125 | Mean Difference (IV, Random, 95% CI) | ‐3.40 [‐8.81, 2.01] |
| 9.1 Paroxetine versus BDZs | 1 | 125 | Mean Difference (IV, Random, 95% CI) | ‐3.40 [‐8.81, 2.01] |
| 10 Quality of life | 0 | 0 | Std. Mean Difference (IV, Random, 95% CI) | 0.0 [0.0, 0.0] |
| 11 Patient satisfaction | 0 | 0 | Std. Mean Difference (IV, Random, 95% CI) | 0.0 [0.0, 0.0] |
| 12 Economic costs | 0 | 0 | Std. Mean Difference (IV, Random, 95% CI) | 0.0 [0.0, 0.0] |
| 13 Number of dropouts due to adverse effects | 1 | 154 | Risk Ratio (M‐H, Random, 95% CI) | 1.2 [0.55, 2.61] |
| 13.1 Paroxetine versus BDZs | 1 | 154 | Risk Ratio (M‐H, Random, 95% CI) | 1.2 [0.55, 2.61] |
| 14 Number of patients experiencing at least one adverse effect | 1 | 154 | Risk Ratio (M‐H, Random, 95% CI) | 1.03 [0.92, 1.15] |
| 14.1 Paroxetine versus BDZs | 1 | 154 | Risk Ratio (M‐H, Random, 95% CI) | 1.03 [0.92, 1.15] |
Comparison 4. TCAs versus SSRIs.
| Outcome or subgroup title | No. of studies | No. of participants | Statistical method | Effect size |
|---|---|---|---|---|
| 1 Failure to respond | 4 | 438 | Risk Ratio (M‐H, Random, 95% CI) | 1.08 [0.71, 1.66] |
| 2 Total number of dropouts | 7 | 928 | Risk Ratio (M‐H, Random, 95% CI) | 0.98 [0.65, 1.48] |
| 3 Failure to remit | 5 | 475 | Risk Ratio (M‐H, Random, 95% CI) | 0.89 [0.63, 1.26] |
| 4 Panic symptoms | 4 | 243 | Mean Difference (IV, Random, 95% CI) | ‐0.20 [‐0.88, 0.48] |
| 5 Frequency of panic attacks | 3 | 329 | Mean Difference (IV, Random, 95% CI) | 2.30 [‐0.11, 4.71] |
| 6 Agoraphobia | 1 | 226 | Mean Difference (IV, Random, 95% CI) | 0.10 [‐0.68, 0.88] |
| 7 General anxiety ‐ endpoint score | 7 | 668 | Std. Mean Difference (IV, Random, 95% CI) | 0.09 [‐0.27, 0.45] |
| 8 General anxiety ‐ mean change | 2 | 309 | Mean Difference (IV, Random, 95% CI) | 0.99 [‐1.39, 3.36] |
| 9 Depression ‐ endpoint score | 5 | 597 | Std. Mean Difference (IV, Random, 95% CI) | ‐0.04 [‐0.26, 0.17] |
| 10 Depression ‐ mean change | 1 | 212 | Std. Mean Difference (IV, Random, 95% CI) | ‐0.04 [‐0.31, 0.23] |
| 11 Social functioning | 0 | 0 | Std. Mean Difference (IV, Random, 95% CI) | 0.0 [0.0, 0.0] |
| 12 Quality of life | 0 | 0 | Std. Mean Difference (IV, Random, 95% CI) | 0.0 [0.0, 0.0] |
| 13 Patient satisfaction | 0 | 0 | Std. Mean Difference (IV, Random, 95% CI) | 0.0 [0.0, 0.0] |
| 14 Economic costs | 0 | 0 | Std. Mean Difference (IV, Random, 95% CI) | 0.0 [0.0, 0.0] |
| 15 Number of dropouts due to adverse effects | 5 | 476 | Risk Ratio (M‐H, Random, 95% CI) | 1.43 [0.82, 2.48] |
| 16 Number of patients experiencing at least one adverse effect | 4 | 489 | Risk Ratio (M‐H, Random, 95% CI) | 1.29 [1.02, 1.65] |
Comparison 5. TCAs versus MAOIs.
| Outcome or subgroup title | No. of studies | No. of participants | Statistical method | Effect size |
|---|---|---|---|---|
| 1 Failure to respond | 1 | 135 | Risk Ratio (M‐H, Random, 95% CI) | 0.59 [0.28, 1.26] |
| 2 Total number of dropouts | 2 | 228 | Risk Ratio (M‐H, Random, 95% CI) | 0.84 [0.61, 1.17] |
| 3 Failure to remit | 0 | 0 | Risk Ratio (M‐H, Random, 95% CI) | 0.0 [0.0, 0.0] |
| 4 Panic symptoms | 1 | 135 | Mean Difference (IV, Random, 95% CI) | ‐0.20 [‐0.75, 0.35] |
| 5 Frequency of panic attacks | 1 | 135 | Mean Difference (IV, Random, 95% CI) | ‐0.30 [‐3.35, 2.75] |
| 6 Agoraphobia | 0 | 0 | Std. Mean Difference (IV, Random, 95% CI) | 0.0 [0.0, 0.0] |
| 7 General anxiety | 1 | 135 | Mean Difference (IV, Random, 95% CI) | 0.30 [‐3.03, 3.63] |
| 8 Depression | 1 | 135 | Mean Difference (IV, Random, 95% CI) | ‐4.1 [‐8.14, ‐0.06] |
| 9 Social functioning | 0 | 0 | Std. Mean Difference (IV, Random, 95% CI) | 0.0 [0.0, 0.0] |
| 10 Quality of life | 0 | 0 | Std. Mean Difference (IV, Random, 95% CI) | 0.0 [0.0, 0.0] |
| 11 Patient satisfaction | 0 | 0 | Std. Mean Difference (IV, Random, 95% CI) | 0.0 [0.0, 0.0] |
| 12 Economic costs | 0 | 0 | Std. Mean Difference (IV, Random, 95% CI) | 0.0 [0.0, 0.0] |
| 13 Number of dropouts due to adverse effects | 1 | 135 | Risk Ratio (M‐H, Random, 95% CI) | 1.27 [0.50, 3.21] |
| 14 Number of patients experiencing at least one adverse effect | 1 | 135 | Risk Ratio (M‐H, Random, 95% CI) | 1.24 [1.06, 1.45] |
Comparison 6. SSRIs versus MAOIs.
| Outcome or subgroup title | No. of studies | No. of participants | Statistical method | Effect size |
|---|---|---|---|---|
| 1 Failure to respond | 2 | 396 | Risk Ratio (M‐H, Random, 95% CI) | 1.12 [0.83, 1.52] |
| 2 Total number of dropouts | 1 | 30 | Risk Ratio (M‐H, Random, 95% CI) | 1.0 [0.07, 14.55] |
| 3 Failure to remit | 1 | 366 | Risk Ratio (M‐H, Random, 95% CI) | 0.93 [0.74, 1.17] |
| 4 Panic symptoms | 0 | 0 | Std. Mean Difference (IV, Random, 95% CI) | 0.0 [0.0, 0.0] |
| 5 Frequency of panic attacks | 0 | 0 | Std. Mean Difference (IV, Random, 95% CI) | 0.0 [0.0, 0.0] |
| 6 Agoraphobia | 1 | 30 | Mean Difference (IV, Random, 95% CI) | 1.5 [‐4.47, 7.47] |
| 7 General anxiety | 1 | 30 | Mean Difference (IV, Random, 95% CI) | ‐0.60 [‐1.10, ‐0.10] |
| 8 Depression | 0 | 0 | Std. Mean Difference (IV, Random, 95% CI) | 0.0 [0.0, 0.0] |
| 9 Social functioning | 0 | 0 | Std. Mean Difference (IV, Random, 95% CI) | 0.0 [0.0, 0.0] |
| 10 Quality of life | 0 | 0 | Std. Mean Difference (IV, Random, 95% CI) | 0.0 [0.0, 0.0] |
| 11 Patient satisfaction | 0 | 0 | Std. Mean Difference (IV, Random, 95% CI) | 0.0 [0.0, 0.0] |
| 12 Economic costs | 0 | 0 | Std. Mean Difference (IV, Random, 95% CI) | 0.0 [0.0, 0.0] |
| 13 Number of dropouts due to adverse effects | 1 | 366 | Risk Ratio (M‐H, Random, 95% CI) | 1.26 [0.59, 2.70] |
| 14 Number of patients experiencing at least one adverse effect | 1 | 366 | Risk Ratio (M‐H, Random, 95% CI) | 1.09 [0.94, 1.27] |
Comparison 7. SSRIs versus SNRIs.
| Outcome or subgroup title | No. of studies | No. of participants | Statistical method | Effect size |
|---|---|---|---|---|
| 1 Failure to respond | 2 | 991 | Risk Ratio (M‐H, Random, 95% CI) | 0.96 [0.75, 1.23] |
| 2 Total number of dropouts | 2 | 991 | Risk Ratio (M‐H, Random, 95% CI) | 1.11 [0.74, 1.65] |
| 3 Failure to remit | 2 | 991 | Risk Ratio (M‐H, Random, 95% CI) | 1.05 [0.91, 1.21] |
| 4 Panic symptoms | 2 | 945 | Mean Difference (IV, Random, 95% CI) | ‐0.12 [‐0.33, 0.10] |
| 5 Frequency of panic attacks | 0 | 0 | Std. Mean Difference (IV, Random, 95% CI) | 0.0 [0.0, 0.0] |
| 6 Agoraphobia | 1 | 478 | Std. Mean Difference (IV, Random, 95% CI) | 0.00 [‐0.19, 0.19] |
| 7 General anxiety | 1 | 478 | Mean Difference (IV, Random, 95% CI) | ‐0.25 [‐1.83, 1.33] |
| 8 Depression | 0 | 0 | Std. Mean Difference (IV, Random, 95% CI) | 0.0 [0.0, 0.0] |
| 9 Social functioning | 1 | 478 | Mean Difference (IV, Random, 95% CI) | 0.15 [‐0.71, 1.01] |
| 10 Quality of life | 1 | 478 | Mean Difference (IV, Random, 95% CI) | 0.06 [‐2.11, 2.23] |
| 11 Patient satisfaction | 0 | 0 | Std. Mean Difference (IV, Random, 95% CI) | 0.0 [0.0, 0.0] |
| 12 Economic costs | 0 | 0 | Std. Mean Difference (IV, Random, 95% CI) | 0.0 [0.0, 0.0] |
| 13 Number of dropouts due to adverse effects | 2 | 991 | Risk Ratio (M‐H, Random, 95% CI) | 1.86 [0.49, 7.05] |
| 14 Number of patients experiencing at least one adverse effect | 2 | 991 | Risk Ratio (M‐H, Random, 95% CI) | 0.97 [0.88, 1.08] |
Comparison 8. SSRIs versus NaSSAs.
| Outcome or subgroup title | No. of studies | No. of participants | Statistical method | Effect size |
|---|---|---|---|---|
| 1 Failure to respond | 0 | 0 | Risk Ratio (M‐H, Random, 95% CI) | 0.0 [0.0, 0.0] |
| 2 Total number of dropouts | 1 | 30 | Risk Ratio (M‐H, Random, 95% CI) | 1.5 [0.29, 7.73] |
| 3 Failure to remit | 0 | 0 | Risk Ratio (M‐H, Random, 95% CI) | 0.0 [0.0, 0.0] |
| 4 Panic symptoms | 1 | 22 | Mean Difference (IV, Random, 95% CI) | 0.30 [‐0.49, 1.09] |
| 5 Frequency of panic attacks | 0 | 0 | Std. Mean Difference (IV, Random, 95% CI) | 0.0 [0.0, 0.0] |
| 6 Agoraphobia | 0 | 0 | Std. Mean Difference (IV, Random, 95% CI) | 0.0 [0.0, 0.0] |
| 7 General anxiety | 1 | 27 | Mean Difference (IV, Random, 95% CI) | 1.10 [‐6.04, 8.24] |
| 8 Depression | 0 | 0 | Std. Mean Difference (IV, Random, 95% CI) | 0.0 [0.0, 0.0] |
| 9 Social functioning | 0 | 0 | Std. Mean Difference (IV, Random, 95% CI) | 0.0 [0.0, 0.0] |
| 10 Quality of life | 0 | 0 | Std. Mean Difference (IV, Random, 95% CI) | 0.0 [0.0, 0.0] |
| 11 Patient satisfaction | 0 | 0 | Std. Mean Difference (IV, Random, 95% CI) | 0.0 [0.0, 0.0] |
| 12 Economic costs | 0 | 0 | Std. Mean Difference (IV, Random, 95% CI) | 0.0 [0.0, 0.0] |
| 13 Number of dropouts due to adverse effects | 1 | 30 | Risk Ratio (M‐H, Random, 95% CI) | 1.5 [0.29, 7.73] |
| 14 Number of patients experiencing at least one adverse effect | 0 | 0 | Risk Ratio (M‐H, Random, 95% CI) | 0.0 [0.0, 0.0] |
Comparison 9. SSRIs versus Other Antidepressants.
| Outcome or subgroup title | No. of studies | No. of participants | Statistical method | Effect size |
|---|---|---|---|---|
| 1 Failure to respond | 1 | 40 | Risk Ratio (M‐H, Random, 95% CI) | 0.28 [0.13, 0.60] |
| 2 Total number of dropouts | 1 | 40 | Risk Ratio (M‐H, Random, 95% CI) | 0.0 [0.0, 0.0] |
| 3 Failure to remit | 0 | 0 | Risk Ratio (M‐H, Random, 95% CI) | 0.0 [0.0, 0.0] |
| 4 Panic symptoms | 0 | 0 | Std. Mean Difference (IV, Random, 95% CI) | 0.0 [0.0, 0.0] |
| 5 Frequency of panic attacks | 0 | 0 | Std. Mean Difference (IV, Random, 95% CI) | 0.0 [0.0, 0.0] |
| 6 Agoraphobia | 1 | 40 | Mean Difference (IV, Random, 95% CI) | ‐7.35 [‐13.73, ‐0.97] |
| 7 General anxiety | 1 | 40 | Mean Difference (IV, Random, 95% CI) | ‐3.55 [‐5.07, ‐2.03] |
| 8 Depression | 1 | 40 | Mean Difference (IV, Random, 95% CI) | ‐5.38 [‐7.90, ‐2.86] |
| 9 Social functioning | 0 | 0 | Std. Mean Difference (IV, Random, 95% CI) | 0.0 [0.0, 0.0] |
| 10 Quality of life | 0 | 0 | Std. Mean Difference (IV, Random, 95% CI) | 0.0 [0.0, 0.0] |
| 11 Patient satisfaction | 0 | 0 | Std. Mean Difference (IV, Random, 95% CI) | 0.0 [0.0, 0.0] |
| 12 Economic costs | 0 | 0 | Std. Mean Difference (IV, Random, 95% CI) | 0.0 [0.0, 0.0] |
| 13 Number of dropouts due to adverse effects | 1 | 40 | Risk Ratio (M‐H, Random, 95% CI) | 0.0 [0.0, 0.0] |
| 14 Number of patients experiencing at least one adverse effect | 0 | 0 | Risk Ratio (M‐H, Random, 95% CI) | 0.0 [0.0, 0.0] |
9.2. Analysis.
Comparison 9 SSRIs versus Other Antidepressants, Outcome 2 Total number of dropouts.
9.13. Analysis.

Comparison 9 SSRIs versus Other Antidepressants, Outcome 13 Number of dropouts due to adverse effects.
Comparison 10. Individual Antidepressants versus another antidepressant within the same class.
| Outcome or subgroup title | No. of studies | No. of participants | Statistical method | Effect size |
|---|---|---|---|---|
| 1 Failure to respond | 4 | Risk Ratio (M‐H, Random, 95% CI) | Subtotals only | |
| 1.1 Escitalopram versus citalopram | 1 | 255 | Risk Ratio (M‐H, Random, 95% CI) | 0.92 [0.79, 1.06] |
| 1.2 Fluoxetine versus Citalopram | 1 | 42 | Risk Ratio (M‐H, Random, 95% CI) | 0.57 [0.20, 1.66] |
| 1.3 Sertraline versus paroxetine | 2 | 546 | Risk Ratio (M‐H, Random, 95% CI) | 0.97 [0.80, 1.17] |
| 2 Total number of dropouts | 5 | Risk Ratio (M‐H, Random, 95% CI) | Subtotals only | |
| 2.1 Escitalopram versus Citalopram | 1 | 255 | Risk Ratio (M‐H, Random, 95% CI) | 0.80 [0.53, 1.20] |
| 2.2 Fluoxetine versus Citalopram | 1 | 42 | Risk Ratio (M‐H, Random, 95% CI) | 1.0 [0.07, 14.95] |
| 2.3 Sertraline versus Paroxetine | 2 | 546 | Risk Ratio (M‐H, Random, 95% CI) | 0.74 [0.55, 0.99] |
| 2.4 Imipramine versus Clomipramine | 1 | 40 | Risk Ratio (M‐H, Random, 95% CI) | 0.86 [0.35, 2.10] |
| 3 Failure to remit | 1 | 255 | Risk Ratio (M‐H, Random, 95% CI) | 0.90 [0.71, 1.15] |
| 3.1 Escitalopram versus Citalopram | 1 | 255 | Risk Ratio (M‐H, Random, 95% CI) | 0.90 [0.71, 1.15] |
| 4 Panic symptoms | 3 | Std. Mean Difference (IV, Random, 95% CI) | Subtotals only | |
| 4.1 Escitalopram versus Citalopram | 1 | 237 | Std. Mean Difference (IV, Random, 95% CI) | ‐0.09 [‐0.35, 0.16] |
| 4.2 Sertraline versus Paroxetine | 2 | 473 | Std. Mean Difference (IV, Random, 95% CI) | ‐0.05 [‐0.23, 0.13] |
| 5 Frequency of panic attacks | 2 | Mean Difference (IV, Random, 95% CI) | Subtotals only | |
| 5.1 Sertraline versus Paroxetine | 2 | 461 | Mean Difference (IV, Random, 95% CI) | 0.48 [‐1.02, 1.98] |
| 6 Agoraphobia | 1 | Mean Difference (IV, Random, 95% CI) | Subtotals only | |
| 6.1 Escitalopram versus Citalopram | 1 | 237 | Mean Difference (IV, Random, 95% CI) | ‐1.10 [‐3.46, 1.26] |
| 7 General anxiety | 3 | Mean Difference (IV, Random, 95% CI) | Subtotals only | |
| 7.1 Escitalopram versus Citalopram | 1 | 237 | Mean Difference (IV, Random, 95% CI) | ‐1.20 [‐3.14, 0.74] |
| 7.2 Sertraline versus Paroxetine | 2 | 454 | Mean Difference (IV, Random, 95% CI) | ‐0.72 [‐2.42, 0.99] |
| 8 Depression | 2 | Std. Mean Difference (IV, Random, 95% CI) | Subtotals only | |
| 8.1 Escitalopram versus Citalopram | 1 | 237 | Std. Mean Difference (IV, Random, 95% CI) | ‐0.11 [‐0.36, 0.15] |
| 8.2 Sertraline versus Paroxetine | 1 | 189 | Std. Mean Difference (IV, Random, 95% CI) | 0.00 [‐0.28, 0.29] |
| 9 Social functioning | 0 | 0 | Std. Mean Difference (IV, Random, 95% CI) | 0.0 [0.0, 0.0] |
| 10 Quality of life | 1 | Mean Difference (IV, Random, 95% CI) | Subtotals only | |
| 10.1 Escitalopram versus Citalopram | 1 | 237 | Mean Difference (IV, Random, 95% CI) | 1.40 [‐1.51, 4.31] |
| 11 Patient satisfaction | 0 | 0 | Std. Mean Difference (IV, Random, 95% CI) | 0.0 [0.0, 0.0] |
| 12 Economic costs | 0 | 0 | Std. Mean Difference (IV, Random, 95% CI) | 0.0 [0.0, 0.0] |
| 13 Number of dropouts due to adverse effects | 5 | Risk Ratio (M‐H, Random, 95% CI) | Subtotals only | |
| 13.1 Escitalopram versus Citalopram | 1 | 255 | Risk Ratio (M‐H, Random, 95% CI) | 0.78 [0.32, 1.92] |
| 13.2 Fluoxetine versus Citalopram | 1 | 42 | Risk Ratio (M‐H, Random, 95% CI) | 1.0 [0.07, 14.95] |
| 13.3 Sertraline versus Paroxetine | 2 | 546 | Risk Ratio (M‐H, Random, 95% CI) | 0.66 [0.42, 1.04] |
| 13.4 Imipramine versus Clomipramine | 1 | 40 | Risk Ratio (M‐H, Random, 95% CI) | 0.33 [0.08, 1.46] |
| 14 Number of patients experiencing at least one adverse effect | 2 | Risk Ratio (M‐H, Random, 95% CI) | Subtotals only | |
| 14.1 Escitalopram versus Citalopram | 1 | 255 | Risk Ratio (M‐H, Random, 95% CI) | 0.95 [0.85, 1.06] |
| 14.2 Sertraline versus Paroxetine | 1 | 321 | Risk Ratio (M‐H, Random, 95% CI) | 0.99 [0.89, 1.10] |
Comparison 11. Individual benzodiazepines versus another benzodiazepine.
| Outcome or subgroup title | No. of studies | No. of participants | Statistical method | Effect size |
|---|---|---|---|---|
| 1 Failure to respond | 1 | Risk Ratio (M‐H, Random, 95% CI) | Subtotals only | |
| 1.1 Alprazolam versus diazepam | 1 | 159 | Risk Ratio (M‐H, Random, 95% CI) | 0.94 [0.63, 1.40] |
| 2 Total number of dropouts | 2 | 209 | Risk Ratio (M‐H, Random, 95% CI) | 1.01 [0.49, 2.08] |
| 2.1 Alprazolam versus diazepam | 1 | 159 | Risk Ratio (M‐H, Random, 95% CI) | 0.84 [0.44, 1.64] |
| 2.2 Alprazolam versus clonazepam | 1 | 50 | Risk Ratio (M‐H, Random, 95% CI) | 2.17 [0.44, 10.78] |
| 3 Failure to remit | 2 | 209 | Risk Ratio (M‐H, Random, 95% CI) | 0.96 [0.58, 1.57] |
| 3.1 Alprazolam versus diazepam | 1 | 159 | Risk Ratio (M‐H, Random, 95% CI) | 0.76 [0.48, 1.20] |
| 3.2 Alprazolam versus clonazepam | 1 | 50 | Risk Ratio (M‐H, Random, 95% CI) | 1.26 [0.73, 2.17] |
| 4 Panic symptoms | 2 | 209 | Mean Difference (IV, Random, 95% CI) | 0.16 [‐0.62, 0.93] |
| 4.1 Alprazolam versus diazepam | 1 | 159 | Mean Difference (IV, Random, 95% CI) | ‐0.20 [‐0.70, 0.30] |
| 4.2 Alprazolam versus clonazepam | 1 | 50 | Mean Difference (IV, Random, 95% CI) | 0.60 [‐0.12, 1.32] |
| 5 Frequency of panic attacks | 2 | 209 | Mean Difference (IV, Random, 95% CI) | 0.39 [‐1.29, 2.08] |
| 5.1 Alprazolam versus diazepam | 1 | 159 | Mean Difference (IV, Random, 95% CI) | 0.40 [‐1.34, 2.14] |
| 5.2 Alprazolam versus clonazepam | 1 | 50 | Mean Difference (IV, Random, 95% CI) | 0.30 [‐6.75, 7.35] |
| 6 Agoraphobia | 0 | 0 | Std. Mean Difference (IV, Random, 95% CI) | 0.0 [0.0, 0.0] |
| 7 General anxiety | 1 | Mean Difference (IV, Random, 95% CI) | Subtotals only | |
| 7.1 Alprazolam versus diazepam | 1 | 159 | Mean Difference (IV, Random, 95% CI) | 0.20 [‐2.28, 2.68] |
| 8 Depression | 1 | Mean Difference (IV, Random, 95% CI) | Subtotals only | |
| 8.1 Alprazolam versus clonazepam | 1 | 44 | Mean Difference (IV, Random, 95% CI) | 2.3 [‐2.83, 7.43] |
| 9 Social functioning | 1 | Mean Difference (IV, Random, 95% CI) | Subtotals only | |
| 9.1 Alprazolam versus diazepam | 1 | 159 | Mean Difference (IV, Random, 95% CI) | ‐0.10 [‐0.47, 0.27] |
| 10 Quality of life | 1 | Mean Difference (IV, Random, 95% CI) | Subtotals only | |
| 10.1 Alprazolam versus clonazepam | 1 | 44 | Mean Difference (IV, Random, 95% CI) | ‐0.30 [‐1.07, 0.47] |
| 11 Patient satisfaction | 0 | 0 | Std. Mean Difference (IV, Random, 95% CI) | 0.0 [0.0, 0.0] |
| 12 Economic costs | 0 | 0 | Std. Mean Difference (IV, Random, 95% CI) | 0.0 [0.0, 0.0] |
| 13 Number of dropouts due to adverse effects | 2 | 209 | Risk Ratio (M‐H, Random, 95% CI) | 1.69 [0.33, 8.58] |
| 13.1 Alprazolam versus diazepam | 1 | 159 | Risk Ratio (M‐H, Random, 95% CI) | 1.04 [0.15, 7.19] |
| 13.2 Alprazolam versus clonazepam | 1 | 50 | Risk Ratio (M‐H, Random, 95% CI) | 5.4 [0.27, 107.09] |
| 14 Number of patients experiencing at least one adverse effect | 0 | 0 | Risk Ratio (M‐H, Random, 95% CI) | 0.0 [0.0, 0.0] |
Comparison 12. High risk of bias excluded ‐ Antidepressants versus benzodiazepines.
| Outcome or subgroup title | No. of studies | No. of participants | Statistical method | Effect size |
|---|---|---|---|---|
| 1 Total number of dropouts | 5 | 619 | Risk Ratio (M‐H, Random, 95% CI) | 1.63 [0.82, 3.23] |
| 1.1 TCAs versus BDZs | 4 | 465 | Risk Ratio (M‐H, Random, 95% CI) | 1.67 [0.64, 4.36] |
| 1.2 SSRIs versus BDZs | 1 | 154 | Risk Ratio (M‐H, Random, 95% CI) | 1.71 [1.03, 2.84] |
| 1.3 MAOIs versus BDZs | 0 | 0 | Risk Ratio (M‐H, Random, 95% CI) | 0.0 [0.0, 0.0] |
| 1.4 SNRIs versus BDZs | 0 | 0 | Risk Ratio (M‐H, Random, 95% CI) | 0.0 [0.0, 0.0] |
| 1.5 NaSSAs versus BDZs | 0 | 0 | Risk Ratio (M‐H, Random, 95% CI) | 0.0 [0.0, 0.0] |
| 1.6 NDRIs versus BDZs | 0 | 0 | Risk Ratio (M‐H, Random, 95% CI) | 0.0 [0.0, 0.0] |
| 1.7 NRIs versus BDZs | 0 | 0 | Risk Ratio (M‐H, Random, 95% CI) | 0.0 [0.0, 0.0] |
| 1.8 Other ADs versus BDZs | 0 | 0 | Risk Ratio (M‐H, Random, 95% CI) | 0.0 [0.0, 0.0] |
Comparison 13. High risk of bias excluded ‐ TCAs versus benzodiazepines.
| Outcome or subgroup title | No. of studies | No. of participants | Statistical method | Effect size |
|---|---|---|---|---|
| 1 Total number of dropouts | 4 | 465 | Risk Ratio (M‐H, Random, 95% CI) | 1.67 [0.64, 4.36] |
| 1.1 Imipramine versus BDZs | 3 | 150 | Risk Ratio (M‐H, Random, 95% CI) | 2.50 [1.42, 4.39] |
| 1.2 Clomipramine versus BDZs | 1 | 315 | Risk Ratio (M‐H, Random, 95% CI) | 0.69 [0.49, 0.98] |
Comparison 14. High risk of bias excluded ‐ TCAs versus SSRIs.
| Outcome or subgroup title | No. of studies | No. of participants | Statistical method | Effect size |
|---|---|---|---|---|
| 1 Total number of dropouts | 6 | 890 | Risk Ratio (M‐H, Random, 95% CI) | 0.97 [0.62, 1.50] |
Comparison 15. High risk of bias excluded ‐ TCAs versus MAOIs.
| Outcome or subgroup title | No. of studies | No. of participants | Statistical method | Effect size |
|---|---|---|---|---|
| 1 Total number of dropouts | 1 | 135 | Risk Ratio (M‐H, Random, 95% CI) | 0.87 [0.47, 1.59] |
Comparison 16. High risk of bias excluded ‐ SSRIs versus MAOIs.
| Outcome or subgroup title | No. of studies | No. of participants | Statistical method | Effect size |
|---|---|---|---|---|
| 1 Failure to respond | 1 | 366 | Risk Ratio (M‐H, Random, 95% CI) | 1.08 [0.76, 1.54] |
Comparison 17. High dropout rates excluded ‐ Antidepressants versus benzodiazepines.
| Outcome or subgroup title | No. of studies | No. of participants | Statistical method | Effect size |
|---|---|---|---|---|
| 1 Total number of dropouts | 2 | 71 | Risk Ratio (M‐H, Random, 95% CI) | 2.42 [0.61, 9.64] |
| 1.1 TCAs versus BDZs | 2 | 71 | Risk Ratio (M‐H, Random, 95% CI) | 2.42 [0.61, 9.64] |
| 1.2 SSRIs versus BDZs | 0 | 0 | Risk Ratio (M‐H, Random, 95% CI) | 0.0 [0.0, 0.0] |
| 1.3 MAOIs versus BDZs | 0 | 0 | Risk Ratio (M‐H, Random, 95% CI) | 0.0 [0.0, 0.0] |
| 1.4 SNRIs versus BDZs | 0 | 0 | Risk Ratio (M‐H, Random, 95% CI) | 0.0 [0.0, 0.0] |
| 1.5 NaSSAs versus BDZs | 0 | 0 | Risk Ratio (M‐H, Random, 95% CI) | 0.0 [0.0, 0.0] |
| 1.6 NDRIs versus BDZs | 0 | 0 | Risk Ratio (M‐H, Random, 95% CI) | 0.0 [0.0, 0.0] |
| 1.7 NRIs versus BDZs | 0 | 0 | Risk Ratio (M‐H, Random, 95% CI) | 0.0 [0.0, 0.0] |
| 1.8 Other ADs versus BDZs | 0 | 0 | Risk Ratio (M‐H, Random, 95% CI) | 0.0 [0.0, 0.0] |
Comparison 18. High dropout rates excluded ‐ TCAs versus benzodiazepines.
| Outcome or subgroup title | No. of studies | No. of participants | Statistical method | Effect size |
|---|---|---|---|---|
| 1 Total number of dropouts | 2 | 71 | Risk Ratio (M‐H, Random, 95% CI) | 2.42 [0.61, 9.64] |
| 1.1 Imipramine versus BDZs | 2 | 71 | Risk Ratio (M‐H, Random, 95% CI) | 2.42 [0.61, 9.64] |
| 1.2 Clomipramine versus BDZs | 0 | 0 | Risk Ratio (M‐H, Random, 95% CI) | 0.0 [0.0, 0.0] |
Comparison 19. High dropout rates excluded ‐ TCAs versus SSRIs.
| Outcome or subgroup title | No. of studies | No. of participants | Statistical method | Effect size |
|---|---|---|---|---|
| 1 Failure to respond | 2 | 95 | Risk Ratio (M‐H, Random, 95% CI) | 1.22 [0.47, 3.15] |
| 2 Total number of dropouts | 4 | 206 | Risk Ratio (M‐H, Random, 95% CI) | 3.02 [1.00, 9.11] |
Comparison 20. Funded excluded ‐ Antidepressants versus benzodiazepines.
| Outcome or subgroup title | No. of studies | No. of participants | Statistical method | Effect size |
|---|---|---|---|---|
| 1 Total number of dropouts | 2 | 469 | Risk Ratio (M‐H, Random, 95% CI) | 1.07 [0.44, 2.58] |
| 1.1 TCAs versus BDZs | 1 | 315 | Risk Ratio (M‐H, Random, 95% CI) | 0.69 [0.49, 0.98] |
| 1.2 SSRIs versus BDZs | 1 | 154 | Risk Ratio (M‐H, Random, 95% CI) | 1.71 [1.03, 2.84] |
| 1.3 MAOIs versus BDZs | 0 | 0 | Risk Ratio (M‐H, Random, 95% CI) | 0.0 [0.0, 0.0] |
| 1.4 SNRIs versus BDZs | 0 | 0 | Risk Ratio (M‐H, Random, 95% CI) | 0.0 [0.0, 0.0] |
| 1.5 NaSSAs versus BDZs | 0 | 0 | Risk Ratio (M‐H, Random, 95% CI) | 0.0 [0.0, 0.0] |
| 1.6 NDRIs versus BDZs | 0 | 0 | Risk Ratio (M‐H, Random, 95% CI) | 0.0 [0.0, 0.0] |
| 1.7 NRIs versus BDZs | 0 | 0 | Risk Ratio (M‐H, Random, 95% CI) | 0.0 [0.0, 0.0] |
| 1.8 Other ADs versus BDZs | 0 | 0 | Risk Ratio (M‐H, Random, 95% CI) | 0.0 [0.0, 0.0] |
Comparison 21. Funded excluded ‐ TCAs versus benzodiazepines.
| Outcome or subgroup title | No. of studies | No. of participants | Statistical method | Effect size |
|---|---|---|---|---|
| 1 Total number of dropouts | 1 | 315 | Risk Ratio (M‐H, Random, 95% CI) | 0.69 [0.49, 0.98] |
| 1.1 Imipramine versus BDZs | 0 | 0 | Risk Ratio (M‐H, Random, 95% CI) | 0.0 [0.0, 0.0] |
| 1.2 Clomipramine versus BDZs | 1 | 315 | Risk Ratio (M‐H, Random, 95% CI) | 0.69 [0.49, 0.98] |
Comparison 22. Funded excluded ‐ TCAs versus SSRIs.
| Outcome or subgroup title | No. of studies | No. of participants | Statistical method | Effect size |
|---|---|---|---|---|
| 1 Failure to respond | 1 | 22 | Risk Ratio (M‐H, Random, 95% CI) | 2.0 [0.46, 8.76] |
| 2 Total number of dropouts | 3 | 439 | Risk Ratio (M‐H, Random, 95% CI) | 1.14 [0.77, 1.68] |
Comparison 23. Funded excluded ‐ SSRIs versus MAOIs.
| Outcome or subgroup title | No. of studies | No. of participants | Statistical method | Effect size |
|---|---|---|---|---|
| 1 Failure to respond | 1 | 30 | Risk Ratio (M‐H, Random, 95% CI) | 1.25 [0.69, 2.26] |
Comparison 24. Psychiatric comorbidities excluded ‐ Antidepressants versus benzodiazepines.
| Outcome or subgroup title | No. of studies | No. of participants | Statistical method | Effect size |
|---|---|---|---|---|
| 1 Failure to respond | 1 | 61 | Risk Ratio (M‐H, Random, 95% CI) | 1.03 [0.63, 1.67] |
| 1.1 TCAs versus BDZs | 1 | 61 | Risk Ratio (M‐H, Random, 95% CI) | 1.03 [0.63, 1.67] |
| 1.2 SSRIs versus BDZs | 0 | 0 | Risk Ratio (M‐H, Random, 95% CI) | 0.0 [0.0, 0.0] |
| 1.3 MAOIs versus BDZs | 0 | 0 | Risk Ratio (M‐H, Random, 95% CI) | 0.0 [0.0, 0.0] |
| 1.4 SNRIs versus BDZs | 0 | 0 | Risk Ratio (M‐H, Random, 95% CI) | 0.0 [0.0, 0.0] |
| 1.5 NaSSAs versus BDZs | 0 | 0 | Risk Ratio (M‐H, Random, 95% CI) | 0.0 [0.0, 0.0] |
| 1.6 NDRIs versus BDZs | 0 | 0 | Risk Ratio (M‐H, Random, 95% CI) | 0.0 [0.0, 0.0] |
| 1.7 NRIs versus BDZs | 0 | 0 | Risk Ratio (M‐H, Random, 95% CI) | 0.0 [0.0, 0.0] |
| 1.8 Other ADs versus BDZs | 0 | 0 | Risk Ratio (M‐H, Random, 95% CI) | 0.0 [0.0, 0.0] |
| 2 Total number of dropouts | 4 | 465 | Risk Ratio (M‐H, Random, 95% CI) | 1.67 [0.64, 4.36] |
| 2.1 TCAs versus BDZs | 4 | 465 | Risk Ratio (M‐H, Random, 95% CI) | 1.67 [0.64, 4.36] |
| 2.2 SSRIs versus BDZs | 0 | 0 | Risk Ratio (M‐H, Random, 95% CI) | 0.0 [0.0, 0.0] |
| 2.3 MAOIs versus BDZs | 0 | 0 | Risk Ratio (M‐H, Random, 95% CI) | 0.0 [0.0, 0.0] |
| 2.4 SNRIs versus BDZs | 0 | 0 | Risk Ratio (M‐H, Random, 95% CI) | 0.0 [0.0, 0.0] |
| 2.5 NaSSAs versus BDZs | 0 | 0 | Risk Ratio (M‐H, Random, 95% CI) | 0.0 [0.0, 0.0] |
| 2.6 NDRIs versus BDZs | 0 | 0 | Risk Ratio (M‐H, Random, 95% CI) | 0.0 [0.0, 0.0] |
| 2.7 NRIs versus BDZs | 0 | 0 | Risk Ratio (M‐H, Random, 95% CI) | 0.0 [0.0, 0.0] |
| 2.8 Other ADs versus BDZs | 0 | 0 | Risk Ratio (M‐H, Random, 95% CI) | 0.0 [0.0, 0.0] |
Comparison 25. Psychiatric comorbidities excluded ‐ TCAs versus benzodiazepines.
| Outcome or subgroup title | No. of studies | No. of participants | Statistical method | Effect size |
|---|---|---|---|---|
| 1 Total number of dropouts | 4 | 465 | Risk Ratio (M‐H, Random, 95% CI) | 1.67 [0.64, 4.36] |
| 1.1 Imipramine versus BDZs | 3 | 150 | Risk Ratio (M‐H, Random, 95% CI) | 2.50 [1.42, 4.39] |
| 1.2 Clomipramine versus BDZs | 1 | 315 | Risk Ratio (M‐H, Random, 95% CI) | 0.69 [0.49, 0.98] |
Comparison 26. Psychiatric comorbidities excluded ‐ TCAs versus SSRIs.
| Outcome or subgroup title | No. of studies | No. of participants | Statistical method | Effect size |
|---|---|---|---|---|
| 1 Failure to respond | 3 | 416 | Risk Ratio (M‐H, Random, 95% CI) | 1.03 [0.66, 1.61] |
| 2 Total number of dropouts | 6 | 906 | Risk Ratio (M‐H, Random, 95% CI) | 0.96 [0.62, 1.49] |
Comparison 27. Psychiatric comorbidities excluded ‐ Individual antidepressants versus individual antidepressants (within the same class).
| Outcome or subgroup title | No. of studies | No. of participants | Statistical method | Effect size |
|---|---|---|---|---|
| 1 Failure to respond | 3 | Risk Ratio (M‐H, Random, 95% CI) | Subtotals only | |
| 1.1 Escitalopram versus citalopram | 1 | 255 | Risk Ratio (M‐H, Random, 95% CI) | 0.92 [0.79, 1.06] |
| 1.2 Fluoxetine versus Citalopram | 1 | 42 | Risk Ratio (M‐H, Random, 95% CI) | 0.57 [0.20, 1.66] |
| 1.3 Sertraline versus paroxetine | 1 | 225 | Risk Ratio (M‐H, Random, 95% CI) | 0.98 [0.78, 1.23] |
| 2 Total number of dropouts | 3 | Risk Ratio (M‐H, Random, 95% CI) | Subtotals only | |
| 2.1 Escitalopram versus Citalopram | 1 | 255 | Risk Ratio (M‐H, Random, 95% CI) | 0.80 [0.53, 1.20] |
| 2.2 Fluoxetine versus Citalopram | 1 | 42 | Risk Ratio (M‐H, Random, 95% CI) | 1.0 [0.07, 14.95] |
| 2.3 Sertraline versus Paroxetine | 1 | 225 | Risk Ratio (M‐H, Random, 95% CI) | 0.85 [0.57, 1.26] |
| 2.4 Imipramine versus Clomipramine | 0 | 0 | Risk Ratio (M‐H, Random, 95% CI) | 0.0 [0.0, 0.0] |
Comparison 28. Psychiatric comorbidities excluded ‐ Individual benzodiazepines versus individual benzodiazepines.
| Outcome or subgroup title | No. of studies | No. of participants | Statistical method | Effect size |
|---|---|---|---|---|
| 1 Total number of dropouts | 1 | 159 | Risk Ratio (M‐H, Random, 95% CI) | 0.84 [0.44, 1.64] |
| 1.1 Alprazolam versus diazepam | 1 | 159 | Risk Ratio (M‐H, Random, 95% CI) | 0.84 [0.44, 1.64] |
| 1.2 Alprazolam versus clonazepam | 0 | 0 | Risk Ratio (M‐H, Random, 95% CI) | 0.0 [0.0, 0.0] |
Comparison 29. Imputation excluded ‐ TCAs versus SSRIs.
| Outcome or subgroup title | No. of studies | No. of participants | Statistical method | Effect size |
|---|---|---|---|---|
| 1 Failure to respond | 2 | 318 | Risk Ratio (M‐H, Random, 95% CI) | 1.33 [0.95, 1.86] |
| 2 Total number of dropouts | 5 | 808 | Risk Ratio (M‐H, Random, 95% CI) | 1.08 [0.80, 1.45] |
Comparison 30. Imputation excluded ‐ Individual antidepressants versus individual antidepressants (within the same class).
| Outcome or subgroup title | No. of studies | No. of participants | Statistical method | Effect size |
|---|---|---|---|---|
| 1 Failure to respond | 2 | Risk Ratio (M‐H, Random, 95% CI) | Subtotals only | |
| 1.1 Escitalopram versus citalopram | 0 | 0 | Risk Ratio (M‐H, Random, 95% CI) | 0.0 [0.0, 0.0] |
| 1.2 Fluoxetine versus Citalopram | 1 | 42 | Risk Ratio (M‐H, Random, 95% CI) | 0.57 [0.20, 1.66] |
| 1.3 Sertraline versus paroxetine | 1 | 321 | Risk Ratio (M‐H, Random, 95% CI) | 0.95 [0.70, 1.30] |
| 2 Total number of dropouts | 3 | Risk Ratio (M‐H, Random, 95% CI) | Subtotals only | |
| 2.1 Escitalopram versus Citalopram | 0 | 0 | Risk Ratio (M‐H, Random, 95% CI) | 0.0 [0.0, 0.0] |
| 2.2 Fluoxetine versus Citalopram | 1 | 42 | Risk Ratio (M‐H, Random, 95% CI) | 1.0 [0.07, 14.95] |
| 2.3 Sertraline versus Paroxetine | 1 | 321 | Risk Ratio (M‐H, Random, 95% CI) | 0.62 [0.40, 0.97] |
| 2.4 Imipramine versus Clomipramine | 1 | 40 | Risk Ratio (M‐H, Random, 95% CI) | 0.86 [0.35, 2.10] |
Comparison 31. Irregular benzodiazepines use excluded ‐ TCAs versus SSRIs.
| Outcome or subgroup title | No. of studies | No. of participants | Statistical method | Effect size |
|---|---|---|---|---|
| 1 Failure to respond | 2 | 95 | Risk Ratio (M‐H, Random, 95% CI) | 1.22 [0.47, 3.15] |
| 2 Total number of dropouts | 5 | 585 | Risk Ratio (M‐H, Random, 95% CI) | 1.24 [0.85, 1.81] |
Comparison 32. Irregular benzodiazepines use excluded ‐ SSRIs versus MAOIs.
| Outcome or subgroup title | No. of studies | No. of participants | Statistical method | Effect size |
|---|---|---|---|---|
| 1 Failure to respond | 1 | 366 | Risk Ratio (M‐H, Random, 95% CI) | 1.08 [0.76, 1.54] |
Comparison 33. Irregular benzodiazepines use excluded ‐ Individual antidepressants versus individual antidepressants (within the same class).
| Outcome or subgroup title | No. of studies | No. of participants | Statistical method | Effect size |
|---|---|---|---|---|
| 1 Failure to respond | 2 | Risk Ratio (M‐H, Random, 95% CI) | Subtotals only | |
| 1.1 Escitalopram versus citalopram | 0 | 0 | Risk Ratio (M‐H, Random, 95% CI) | 0.0 [0.0, 0.0] |
| 1.2 Fluoxetine versus Citalopram | 1 | 42 | Risk Ratio (M‐H, Random, 95% CI) | 0.57 [0.20, 1.66] |
| 1.3 Sertraline versus paroxetine | 1 | 321 | Risk Ratio (M‐H, Random, 95% CI) | 0.95 [0.70, 1.30] |
| 2 Total number of dropouts | 3 | Risk Ratio (M‐H, Random, 95% CI) | Subtotals only | |
| 2.1 Escitalopram versus Citalopram | 0 | 0 | Risk Ratio (M‐H, Random, 95% CI) | 0.0 [0.0, 0.0] |
| 2.2 Fluoxetine versus Citalopram | 1 | 42 | Risk Ratio (M‐H, Random, 95% CI) | 1.0 [0.07, 14.95] |
| 2.3 Sertraline versus Paroxetine | 1 | 321 | Risk Ratio (M‐H, Random, 95% CI) | 0.62 [0.40, 0.97] |
| 2.4 Imipramine versus Clomipramine | 1 | 40 | Risk Ratio (M‐H, Random, 95% CI) | 0.86 [0.35, 2.10] |
Characteristics of studies
Characteristics of included studies [ordered by study ID]
Amore 1999.
| Methods | Study design: Randomised controlled trial | |
| Participants |
Diagnosis: DSM‐IV Panic Disorder with or without agoraphobia Method of diagnosis: Not stated Age: for fluoxetine, M = 37.0 (SD = 7.1); for imipramine, M = 37.2 (SD = 8.2) Sex: for fluoxetine, 57.89% women, 42.11% men; for imipramine 36.84% women, 63.16% men Location: Italy; setting unclear. Co‐morbidities: patients with history of psychosis, current major depression, organic brain syndromes or significant neurological disorders, seizures, clinically relevant cardiovascular, hepatic, renal or haematological diseases were excluded Rescue medication: Oxazepam (up to a maximum daily dose of 30 mg) permitted during first four weeks of double‐blind treatment |
|
| Interventions | Participants were randomly assigned to either: (1) fluoxetine arm (n = 19) Duration: 24 weeks of active treatment (acute and continuation phase), 6 months maintenance phase for responders Treatment Protocol: flexible dosage; range = 10 ‐ 50 mg, M = 20 mg/day (SD = 10) (responder group) (2) imipramine arm (n = 19) Duration: 24 weeks of active treatment (acute and continuation phase), 6 months maintenance phase for responders Treatment Protocol: flexible dosage; range = 25 ‐ 250 mg, M = 150 mg/day (SD = 25) (responder group) |
|
| Outcomes |
Time points for assessment: baseline and weekly for 16 weeks, every two weeks between week 17 and 24, later monthly Outcomes: 1. Panic‐Associated Symptoms Scale (PASS) 2. Hamilton Rating Scale for Anxiety (HAMA) 3. Hamilton Rating Scale for Depression (HRSD) 4. Clinical Global Impression (CGI) |
|
| Notes |
Date of study: Not stated Funding source: Not stated Declarations of interest among the primary researchers: Not stated |
|
| Risk of bias | ||
| Bias | Authors' judgement | Support for judgement |
| Random sequence generation (selection bias) | Unclear risk | Quote: "they were randomly assigned to fluoxetine or imipramine treatment". No further details. |
| Allocation concealment (selection bias) | Unclear risk | No information provided. |
| Blinding of participants and personnel (performance bias) All outcomes | Unclear risk | Quote: "double blind". No further details. |
| Blinding of outcome assessment (detection bias) All outcomes | Unclear risk | Quote: "double blind". No further details. |
| Incomplete outcome data (attrition bias) All outcomes | Unclear risk | No clear information on incomplete outcome data management. |
| Selective reporting (reporting bias) | High risk | Data on the scales CGI, PASS and HRSD not reported at endpoint. |
| Other bias | Unclear risk | Sponsorship bias cannot be ruled out. |
Amore 1999 bis.
| Methods | Study design: Randomised controlled trial | |
| Participants |
Diagnosis: DSM‐IV Panic Disorder with or without agoraphobia Method of diagnosis: Not stated Age: for fluoxetine, M = 37.2 (SD = 7.0); for citalopram, M = 36.7 (SD = 7.4) Sex: for fluoxetine, 57.1% women, 42.9% men; for imipramine 61.9% women, 38.1% men Location: Italy; setting unclear Co‐morbidities: patients with history of psychosis, current major depression, organic brain syndromes or significant neurological disorders, seizures, clinically relevant cardiovascular, hepatic, renal or haematological diseases, alcohol or drugs abuse were excluded Rescue medication: Oxazepam (up to a maximum daily dose of 30 mg) permitted |
|
| Interventions | Participants were randomly assigned to either: (1) fluoxetine arm (n = 21) Duration: 24 weeks of active treatment (acute and continuation phase), 6 months maintenance phase for responders Treatment Protocol: flexible dosage; range = 10 ‐ 50 mg, M = 20 mg/day (SD = 10) (2) citalopram arm (n = 21) Duration: 24 weeks of active treatment (acute and continuation phase), 6 months maintenance phase for responders Treatment Protocol: flexible dosage; range = 20 ‐ 60 mg, M = 40 mg/day (SD = 10) |
|
| Outcomes |
Time points for assessment: baseline and weekly for 16 weeks, every two weeks between week 17 and 24, later monthly Outcomes: 1. Panic‐Associated Symptoms Scale (PASS) 2. Hamilton Rating Scale for Anxiety (HAMA) 3. Clinical Global Impression (CGI) 4. Dosage Records and Treatment‐Emergent Symptoms Scale (DOTES) |
|
| Notes |
Date of study: Not stated Funding source: Not stated Declarations of interest among the primary researchers: Not stated |
|
| Risk of bias | ||
| Bias | Authors' judgement | Support for judgement |
| Random sequence generation (selection bias) | Unclear risk | Quote: "they were randomly assigned". No further details. |
| Allocation concealment (selection bias) | Unclear risk | No information provided. |
| Blinding of participants and personnel (performance bias) All outcomes | Unclear risk | Quote: "double blind". No further details. |
| Blinding of outcome assessment (detection bias) All outcomes | Unclear risk | Quote: "double blind". No further details. |
| Incomplete outcome data (attrition bias) All outcomes | Unclear risk | No clear information on incomplete outcome data management. |
| Selective reporting (reporting bias) | High risk | Data on the scales CGI, PASS and HAMA not reported at endpoint. |
| Other bias | Unclear risk | Sponsorship bias cannot be ruled out. |
Bakish 1993.
| Methods | Study design: Randomised controlled trial | |
| Participants |
Diagnosis: DSM‐III panic disorder with or without agoraphobia Method of diagnosis: Not stated Age: No information provided Sex: No information provided Location: Canada; setting: outpatients Co‐morbidities: Not stated Rescue medication: Chloral hydrate, up to 1 g at night |
|
| Interventions | Participants were randomly assigned to either: (1) brofaromine arm (n = 47) Duration: 8 weeks Treatment Protocol: flexible dosage; range = 50 ‐ 150 mg, M and SD not provided (2) clomipramine arm (n = 46) Duration: 8 weeks Treatment Protocol: flexible dosage; range = 25 ‐ 75 mg, M and SD not provided |
|
| Outcomes |
Time points for assessment: baseline, every two weeks Outcomes: 1. number of panic attacks per week 2. Hamilton Rating Scale for Anxiety (HAMA) 3. Hamilton Rating Scales for Depression (HAM‐D) 4. Clinician Rated Impairment and Disability Scale (CRIDS) 5. Clinician Rated Global Change Scale (CRGCS) 6. Patient Rating Impairment Disability Scale (PRIDS) 7. Patient Rated Anxiety Scale (PRAS) 8. Marks Matthews Phobia Scale 9. Patient Rated Global Change Scale (PRGCS) 10. Daily Panic Inventory (DPI) |
|
| Notes |
Date of study: Not stated Funding source: Not stated Declarations of interest among the primary researchers: Not stated |
|
| Risk of bias | ||
| Bias | Authors' judgement | Support for judgement |
| Random sequence generation (selection bias) | Unclear risk | Quote: "randomised". No further details. |
| Allocation concealment (selection bias) | Unclear risk | No information provided. |
| Blinding of participants and personnel (performance bias) All outcomes | Unclear risk | Quote: "double blind". No further details. |
| Blinding of outcome assessment (detection bias) All outcomes | Unclear risk | Quote: "double blind". No further details. |
| Incomplete outcome data (attrition bias) All outcomes | Unclear risk | No clear information on incomplete outcome data management. |
| Selective reporting (reporting bias) | High risk | Data on the scales HAMD, CRIDS, CRGCS, PRIDS, PRAS, PRCGS, DPI not reported at endpoint; data on the scales HAMA and Mark Matthews Phobia Scale are reported only in graphs; number of patients evaluated not specified. |
| Other bias | Unclear risk | Sponsorship bias cannot be ruled out. |
Bandelow 2004.
| Methods | Study design: Randomised controlled trial | |
| Participants |
Diagnosis: DSM‐IV and ICD‐10 diagnosis of panic disorder with or without agoraphobia Method of diagnosis: Not stated Age: for sertraline, M = 39.6 (SD = 11.7); for paroxetine, M = 38.1 (SD = 11.7) Sex: for sertraline, 60% women, 40% men; for paroxetine 66% women, 34% men Location: 5 centres in Denmark, 22 centres in Germany, 2 centres in the Netherlands, 2 centres in Switzerland, 2 centres in Turkey; setting: outpatients Co‐morbidities: patients with clinically significant and unstable medical illness, bipolar disorder, schizophrenic disorder, delusional disorder, epilepsy, major depressive disorder (MDD), obsessive‐compulsive disorder (OCD), social phobia, history of alcoholism or drug abuse were excluded Rescue medication: chloral hydrate, zolpidem or zopiclone allowed if necessary to treat severe insomnia, less than 3 times per week |
|
| Interventions | Participants were randomly assigned to either: (1) sertraline arm (n = 112) Duration: 12 weeks Treatment Protocol: flexible dosage; range = 25 ‐ 150 mg, M = 84.5, SD = 39.1 (2) paroxetine arm (n = 113) Duration: 12 weeks Treatment Protocol: flexible dosage; range = 10 ‐ 60 mg, M = 48.1, SD = 11.2 |
|
| Outcomes |
Time points for assessment: baseline, week 1, 2, 4, 6, 8, 12 and 15 Outcomes: 1. Panic and Agoraphobia Scale (PAS) 2. agoraphobia/avoidance behaviour 3. anticipatory anxiety 4. disability 5. health worries 6. Clinical Global Impression‐Severity of Illness (CGI‐S) 7. Clinical Global Impression‐Improvement (CGI‐I) 8. Hamilton Rating Scale for Anxiety (HAMA) 9. Montgomery–Åsberg Depression Rating Scale (MADRS) 10. Sertraline Quality of Life Battery 11. Digit Symbol Substitution Task 12. Digit Span 13. Patient Global Impression (PGI) |
|
| Notes |
Date of study: data were collected from January 2000 to June 2001 Funding source: Funded by Pfizer Inc, New York Declarations of interest among the primary researchers: Dr Bandelow has received grant/research support from GlaxoSmithKline |
|
| Risk of bias | ||
| Bias | Authors' judgement | Support for judgement |
| Random sequence generation (selection bias) | Unclear risk | Quote: "they were randomly assigned". No further details. |
| Allocation concealment (selection bias) | Unclear risk | No information provided. |
| Blinding of participants and personnel (performance bias) All outcomes | Unclear risk | Quote: "double blind". No further details. |
| Blinding of outcome assessment (detection bias) All outcomes | Unclear risk | Quote: "double blind". No further details. |
| Incomplete outcome data (attrition bias) All outcomes | Low risk | "[...] a secondary analysis was performed on the ITT population, which consisted of all patients who were randomly assigned to study drug and for whom at least one post baseline PAS assessment was available" |
| Selective reporting (reporting bias) | Low risk | All outcomes were reported. |
| Other bias | High risk | Sponsored by Pfizer; the role of the funder in planning, conducting and writing the study is not discussed. |
Bystritsky 1995.
| Methods | Study design: Randomised controlled trial | |
| Participants |
Diagnosis: DSM‐III panic disorder with or without agoraphobia Method of diagnosis: Not stated Age: average age of 37 years, no between‐group differences Sex: 12 males and 9 females, no between‐group differences Location: USA; setting unclear Co‐morbidities: lack of significant drug or alcohol history or significant medical illness; patients that had an additional diagnosis of major depression (MD) or generalised anxiety disorder (GAD) were allowed to participate only if they presented a predominant picture of panic disorder and if panic symptoms preceded the onset of the current episode of MD or GAD Rescue medication: Not stated. |
|
| Interventions | Participants were randomly assigned to either: (1) desipramine arm (n = 11) Duration: 10 weeks Treatment Protocol: flexible dosage; range = 10 ‐ 300 mg, M = 110, SD = 49 (2) fluoxetine arm (n = 11) Duration: 10 weeks Treatment Protocol: flexible dosage; range = 2.5 ‐ 60 mg, M = 19, SD = 10 |
|
| Outcomes |
Time points for assessment: weekly Outcomes: 1. Hamilton Rating Scale for Anxiety (HAMA) 2. Hamilton Rating Scales for Depression (HAM‐D) 3. Four Dimensional Anxiety Scale 4. Clinical Global Impression‐Severity of Illness (CGI‐S) 5. Clinical Global Impression‐Improvement (CGI‐I) |
|
| Notes |
Date of study: Not stated Funding source: this research has been supported in part by NIMH grant MH 45342‐02 and by an NPI Opportunity Grant Declarations of interest among the primary researchers: None. |
|
| Risk of bias | ||
| Bias | Authors' judgement | Support for judgement |
| Random sequence generation (selection bias) | Unclear risk | Quote: "they were assigned randomly". No further details. |
| Allocation concealment (selection bias) | Unclear risk | No information provided. |
| Blinding of participants and personnel (performance bias) All outcomes | Low risk | Quote: "both patients and investigators were blind to the assignment"; "patients were administered identical capsules labeled A, B or C: Capsules A, containing 2,5 mg of fluoxetine or 10 mg of desipramine were administered for one week [...], capsules B (containing) 25 mg of desipramine or 5 mg of fluoxetine, (capsules) C (containing) 50 mg of desipramine or 10 mg of fluoxetine". |
| Blinding of outcome assessment (detection bias) All outcomes | Low risk | Quote: "both patients and investigators were blind to the assignment" |
| Incomplete outcome data (attrition bias) All outcomes | Unclear risk | No clear information on incomplete outcome data management. |
| Selective reporting (reporting bias) | Low risk | All outcomes were reported. |
| Other bias | Unclear risk | Quote: "this research has been supported in part by NIMH grant MH 45342‐02 and by an NPI Opportunity Grant". |
CNCPS 1992.
| Methods | Study design: Randomised controlled trial | |
| Participants |
Diagnosis: DSM‐III panic disorder with limited or extensive phobic avoidance (panic attacks with agoraphobia) Method of diagnosis: "patients were evaluated by Structured Clinical Interview for DSM‐III Diagnosis, Upjohn (SCID‐UP) Age: M = 34, SD not provided Sex: 62 % female, 38 % male Location: 12 centres in USA, Spain, Denmark, Germany, England, Italy, Brazil, Mexico, France, Colombia, Austria, Sweden, Canada, Belgium; setting: inpatients and outpatients Co‐morbidities: patients with psychotic disorders, dementia, bipolar disorder, alcoholism or drug abuse within the last six months or significant medical problems were excluded. Patients with current major depression were excluded unless the depression was judged to be secondary to the anxiety disorder and did not have melancholic or psychotic features. Rescue medication: Quote "patients taking CNS drugs, including benzodiazepines, were excluded from the study. During the washout period, blood was drawn for benzodiazepines screening". |
|
| Interventions |
Participants were randomly assigned to either: (1) imipramine arm (n = 391) Duration: 8 weeks Treatment Protocol: flexible dosage; range = 25 ‐ 250 mg, M = 155, SD not provided (2) alprazolam arm (n = 386) Duration: 8 weeks Treatment Protocol: flexible dosage; range = 1 ‐ 10 mg, M = 5.7, SD not provided (3) placebo arm (n = 391) Duration: 8 weeks |
|
| Outcomes |
Time points for assessment: baseline, weekly, endpoint Outcomes: 1. Physician's and patient's global improvement scales 2. Panic Attack Scale, patient's diary 3. Overall Phobia Scale (Marks & Matthews), Phobic Anxiety Factor of the Symptom Check List (SCL‐90) 4. anticipatory anxiety 5. Hamilton Rating Scale for Anxiety (HAMA) 6. social functioning, five‐point scale 7. Hamilton Rating Scale for Depression (HRSD) 8. Hopkins SCL‐90 patient self‐rating scale for presence and intensity of symptoms |
|
| Notes |
Date of study: Data collection: 1984 ‐ 1987 Funding source: sponsored by Upjohn Company, Kalamazoo, Michigan Declarations of interest among the primary researchers: Not stated. |
|
| Risk of bias | ||
| Bias | Authors' judgement | Support for judgement |
| Random sequence generation (selection bias) | Unclear risk | Quote: "randomly assigned"; "alprazolam, imipramine or placebo were assigned in 12 randomization blocks of the basic three cell random‐assignment, parallel treatment‐design. [...] At each center patients were blindly and randomly assigned to alprazolam, imipramine or placebo treatment, based on a table of random numbers [...]. Patients removed from the protocol before three weeks had to be replaced; after three weeks, non‐completers were not replaced." |
| Allocation concealment (selection bias) | Unclear risk | No information provided. |
| Blinding of participants and personnel (performance bias) All outcomes | Unclear risk | Quote "double‐blind design". No further details. |
| Blinding of outcome assessment (detection bias) All outcomes | Unclear risk | Quote "double‐blind design". No further details. |
| Incomplete outcome data (attrition bias) All outcomes | Unclear risk | Quote: "of 1168 patients randomized, 1122 met criteria for ITT". |
| Selective reporting (reporting bias) | High risk | In the primary publication, data on Panic Attack scale are not reported; data on Physician's global Improvement scale are only partially reported, and without the number of patients evaluated; data on other continuous outcomes (HAMA, HRSD) are reported without number of patients evaluated. Other data are partially reported in secondary publication of this study. |
| Other bias | High risk | Sponsored by Upjohn Company, Kalamazoo, Michigan; the role of the funder in planning, conducting and writing the study is not discussed. |
Den Boer 1988.
| Methods | Study design: Randomised controlled trial | |
| Participants |
Diagnosis: DSM‐III panic disorder without phobic avoidance or panic disorder with severe phobic avoidance behaviour Method of diagnosis: Not stated Age: for maprotiline, M = 35.0 (SD = 7.4); for fluvoxamine, M = 37.3 (SD = 10.6) Sex: for maprotiline, 4 males and 20 females; for fluvoxamine 5 males and 15 females Location: the Netherlands; setting: outpatients Co‐morbidities: patients with major affective disorders, schizophrenia, other psychotic disorder or significant medical problems were excluded Rescue medication: Not stated |
|
| Interventions |
Participants were randomly assigned to either: (1) maprotiline arm ("24 patients were included in the maprotiline group") Duration: 6 weeks Treatment Protocol: flexible dosage; range = 50 ‐ 150 mg, M and SD not provided (2) fluvoxamine arm ("20 patients were included in the fluvoxamine group") Duration: 6 weeks Treatment Protocol: flexible dosage; range = 50 ‐ 150 mg, M and SD not provided |
|
| Outcomes |
Time points for assessment: baseline and weekly Outcomes: 1. SCL‐90 2. State Anxiety Inventory (A‐STATE) 3. Self Rating Depression Scale (SDS) 4. Hamilton Anxiety Scale (HAS) 5. Hamilton Depression Scale (HDS) 6. panic attack inventory 7. side‐effects scale |
|
| Notes |
Date of study: Not stated Funding source: Not stated Declarations of interest among the primary researchers: Not stated. |
|
| Risk of bias | ||
| Bias | Authors' judgement | Support for judgement |
| Random sequence generation (selection bias) | Unclear risk | Quote: "they were randomly allocated". No further details. |
| Allocation concealment (selection bias) | Unclear risk | No information provided. |
| Blinding of participants and personnel (performance bias) All outcomes | Unclear risk | Quote "double‐blind treatment". No further details. |
| Blinding of outcome assessment (detection bias) All outcomes | Unclear risk | Quote "double‐blind treatment". No further details. |
| Incomplete outcome data (attrition bias) All outcomes | High risk | Number of patients randomised per group not reported (number of total randomised patients = 47); only number of patients evaluated per group was available, respectively 24 in maprotiline group and 20 in fluvoxamine. |
| Selective reporting (reporting bias) | High risk | Continuous outcome data are reported only in graphs. |
| Other bias | Unclear risk | Sponsorship bias cannot be ruled out. |
Den Boer 1990.
| Methods | Study design: Randomised controlled trial | |
| Participants |
Diagnosis: DSM‐III‐R Method of diagnosis: not stated Age: for fluvoxamine M = 37, for ritanserin M = 35, for placebo M = 37 Sex: the female to male ratio was almost 3 to 1 in all groups Location: the Netherlands; setting: outpatients Co‐morbidities: patients with a primary diagnosis other than panic disorder were excluded Rescue medication: none |
|
| Interventions |
Participants were randomly assigned to either: (1) fluvoxamine arm Duration: 8 weeks Treatment Protocol: fixed dosage = 150 mg (2) ritanserin arm Duration: 8 weeks Treatment Protocol: fixed dosage = 20 mg (3) placebo arm Duration: 8 weeks Total number of randomised patients = 60. The number of patients randomised for each arm is not provided. |
|
| Outcomes |
Time points for assessment: baseline, weekly Outcomes: 1. SCL‐90 2. Hamilton Rating Scale for Anxiety (HAMA) 3. State‐Trait Anxiety Inventory (STAI) 4. Fear Questionnaire (FQ) 5. panic inventory |
|
| Notes |
Date of study: not stated Funding source: not stated Declarations of interest among the primary researchers: not stated. |
|
| Risk of bias | ||
| Bias | Authors' judgement | Support for judgement |
| Random sequence generation (selection bias) | Unclear risk | Quote: "randomised". |
| Allocation concealment (selection bias) | Unclear risk | No information provided. |
| Blinding of participants and personnel (performance bias) All outcomes | Unclear risk | Quote: "double blind". No further information provided. |
| Blinding of outcome assessment (detection bias) All outcomes | Unclear risk | Quote: "double blind". No further information provided. |
| Incomplete outcome data (attrition bias) All outcomes | Unclear risk | No information provided about management of incomplete outcome data. |
| Selective reporting (reporting bias) | High risk | Data are reported in graphs (HAMA, FQ); other data only partially reported. |
| Other bias | Unclear risk | Sponsorship bias cannot be ruled out. |
Garvey 1989.
| Methods | Study design: Randomised controlled trial | |
| Participants |
Diagnosis: DSM‐III panic disorder with agoraphobia Method of diagnosis: Not stated Age: M = 40.0 (SD = 12) Sex: 61% women Location: USA; setting unclear Co‐morbidities: patients with MDD, alcoholism during the previous six months, current or past mania or psychotic disorder, major medical problems were excluded Rescue medication: Not stated |
|
| Interventions |
Participants were randomly assigned to either: (1) alprazolam arm Duration: 3 weeks Treatment Protocol: dosage gradually increased to a maximum of 6 mg (2) diazepam arm Duration: 3 weeks Treatment Protocol: dosage gradually increased to a maximum of 60 mg (3) placebo arm Duration: 3 weeks Total number of randomised patients = 30; number of patients per arm not provided. |
|
| Outcomes | The study is about urinary MHPG levels in relation to Panic Disorder treatment. Time points for assessment: before the beginning of treatment and after 3 weeks of treatment Outcomes: 1. MHPG urinary levels 2. Hamilton Rating Scale for Anxiety (HAMA) |
|
| Notes |
Date of study: Not stated Funding source: Not stated Declarations of interest among the primary researchers: Not stated. |
|
| Risk of bias | ||
| Bias | Authors' judgement | Support for judgement |
| Random sequence generation (selection bias) | Unclear risk | Quote: "thirty consecutive patients meeting study criteria were randomly assigned" |
| Allocation concealment (selection bias) | Unclear risk | No information provided. |
| Blinding of participants and personnel (performance bias) All outcomes | Unclear risk | Quote "double‐blind treatment". No further details. |
| Blinding of outcome assessment (detection bias) All outcomes | Unclear risk | Quote "double‐blind treatment". No further details. |
| Incomplete outcome data (attrition bias) All outcomes | Unclear risk | No information provided. |
| Selective reporting (reporting bias) | Unclear risk | Study on urinary MHPG levels; HAMA mentioned in methods section, but no results reported. |
| Other bias | Unclear risk | Sponsorship bias cannot be ruled out. |
Gentil 1993.
| Methods | Study design: Randomised controlled trial | |
| Participants |
Diagnosis: DSM‐III‐R panic disorder with or without agoraphobia Method of diagnosis: semi‐structured interview Age: for imipramine, M = 36.35 (SEM = 2.12); for clomipramine, M = 34.1 (SEM = 1.89) Sex: for imipramine, 70% women, 30% men; for clomipramine 50% women, 50% men Location: Brazil; setting: outpatients Co‐morbidities: patients with other medical condition, drug abuse, OCD, primary major depression or psychoses were excluded; major depression without melancholia, secondary to panic disorder, could still be included Rescue medication: Not stated |
|
| Interventions |
Participants were randomly assigned to either: (1) imipramine arm (n = 20) Duration: 8 weeks Treatment Protocol: flexible dosage; range = 25 ‐ 200 mg, M = 113.8, SD = 9.5 (2) clomipramine arm (n = 20) Duration: 8 weeks Treatment Protocol: flexible dosage; range = 10 ‐ 80 mg, M = 50, SD = 4.2 (3) placebo arm (propantheline) (n = 20) Duration: 8 weeks Treatment Protocol: flexible dosage; M = 85.5, SD = 5.7 |
|
| Outcomes |
Time points for assessment: baseline, week 2, 4, 6 and 8 Outcomes: 1. Clinical Global Impression Scale (CGI) 2. Sheehan Anxiety Scales 3. Hamilton Rating Scale for Depression (HRSD) 4. Beck Depression Inventory (BDI) |
|
| Notes |
Date of study: Not stated Funding source: grants from FAPESP and FINEP, donations from Rhodia SA, Metalurgica Matarazzo, Itautec, Soft Consultoria an Industrias Bardella SPA, Fundacao Zerbini and Fundacao Faculdade de Medicina Declarations of interest among the primary researchers: Not stated |
|
| Risk of bias | ||
| Bias | Authors' judgement | Support for judgement |
| Random sequence generation (selection bias) | Unclear risk | Quote: "they were randomly allocated". Dropouts before completing the fourth week of treatment were replaced (therefore we considered only data before replacing: number of dropouts at fourth week). |
| Allocation concealment (selection bias) | Unclear risk | No information provided. |
| Blinding of participants and personnel (performance bias) All outcomes | Low risk | Quote "double‐blind treatment"; "Capsules were in the hospital pharmacy with tablets of the commercially available TCAs or propanteline (placebo) and filled up with lactose. The dose range of propanteline was selected to give mild to moderate peripheral anticholinergic effects". |
| Blinding of outcome assessment (detection bias) All outcomes | Low risk | Quote "double‐blind treatment"; "Capsules were in the hospital pharmacy with tablets of the commercially available TCAs or propanteline (placebo) and filled up with lactose. The dose range of propanteline was selected to give mild to moderate peripheral anticholinergic effects". |
| Incomplete outcome data (attrition bias) All outcomes | Unclear risk | 15 patients left the trial before completing the first four weeks of treatment and were replaced. No information provided on incomplete outcome data management. |
| Selective reporting (reporting bias) | High risk | Data on the scales HAMD and BDI not reported at endpoint. Data on the scales CGI and Sheehan are reported only in graphs; number of patients evaluated not specified. |
| Other bias | Low risk | Quote: "this study was not supported by the manufacturers of the drugs tested". |
GSK‐29060/1.
| Methods | Study design: Randomised controlled trial | |
| Participants |
Diagnosis: Panic disorder according to the DSM ‐ III criteria Method of diagnosis: Structured Clinical Interview (SCID) for DSM ‐ III Age: for paroxetine, M = 39.1 (SD = 11.1); for alprazolam, M = 39.5 (SD = 12.5) Sex: for paroxetine, 49 women, 28 men; for alprazolam 48 women, 28 men Location: USA; setting: outpatients Co‐morbidities: patients with Axis I disorders other than panic disorder, current major depression (unless panic disorder dominated the clinical picture and preceded affective symptoms chronologically), any severe or uncontrolled medical condition were excluded Rescue medication: Not stated |
|
| Interventions |
Participants were randomly assigned to either: (1) paroxetine arm (n = 77) Duration: 10 weeks Treatment Protocol: flexible dosage; range = 10 ‐ 60 mg, M and SD not provided (2) alprazolam arm (n = 77) Duration: 10 weeks Treatment Protocol: flexible dosage; range = 1 ‐ 6 mg, M and SD not provided (3) placebo arm (n = 72) Duration: 10 weeks |
|
| Outcomes |
Time points for assessment: baseline, endpoint (10 weeks) Outcomes: 1. % of patients having zero panic attacks 2. mean change from baseline in the number of panic attacks 3. % of participants with a > 50% reduction from baseline in the number of full panic attacks 4. Clinical Global Impression Severity of Illness Score (CGI‐S) 5. number of full and limited panic attacks 6. intensity of panic attacks 7. anticipatory anxiety 8. Marks Sheehan Phobia Scale 9. Clinical Global Impression Improvement Score (CGI‐I) 10. Hamilton Rating Scale for Anxiety (HAMA) 11. Montgomery–Åsberg Depression Rating Scale (MADRS) 12. Sheehan Disability Scale (SDS) 13. Social Adjustment Self‐Report Questionnaire |
|
| Notes |
Date of study: November 1992 to April 1994 Funding source: GSK Declarations of interest among the primary researchers: Not stated. |
|
| Risk of bias | ||
| Bias | Authors' judgement | Support for judgement |
| Random sequence generation (selection bias) | Unclear risk | Quote: "randomized". |
| Allocation concealment (selection bias) | Unclear risk | No information provided. |
| Blinding of participants and personnel (performance bias) All outcomes | Unclear risk | Quote: "double‐blind". No further details. |
| Blinding of outcome assessment (detection bias) All outcomes | Unclear risk | Quote: "double‐blind". No further details. |
| Incomplete outcome data (attrition bias) All outcomes | Low risk | Quote: "All subjects in the ITT population (which included all subjects who received any double blind medication) for whom at least one valid post efficacy evaluation was available were included in the ITT efficacy analysis. All subjects randomized were included in the safety analysis". |
| Selective reporting (reporting bias) | Low risk | All outcomes were reported. |
| Other bias | High risk | Sponsored by GSK; the role of the funder in planning, conducting and writing the study is not discussed. |
GSK‐29060/525.
| Methods | Study design: Randomised controlled trial | |
| Participants |
Diagnosis: Panic disorder; no further details provided Method of diagnosis: Not stated Age: for paroxetine, M = 37.12 (SD = 9.92); for clomipramine, M = 40.13 (SD = 11.34) Sex: for paroxetine, 14 women, 23 men, 1 unknown; for clomipramine 17 women, 14 men Location: China; setting unclear Co‐morbidities: patients with current major depression were excluded. No other co‐morbidities mentioned Rescue medication: Not stated |
|
| Interventions |
Participants were randomly assigned to either: (1) paroxetine arm (n = 38) Duration: 10 weeks Treatment Protocol: flexible dosage; range = 10 ‐ 50 mg, M and SD not provided (2) clomipramine arm (n = 35) Duration: 10 weeks Treatment Protocol: flexible dosage; range = 50 ‐ 100 mg, M and SD not provided |
|
| Outcomes |
Time points for assessment: baseline, endpoint (10 weeks) Outcomes: 1. mean change from baseline in the number of full panic attacks 2. Hamilton Rating Scale for Anxiety (HAMA) 3. Panic Associated Symptoms Scale 4. Clinical Global Impression Severity of Illness Score (CGI‐S) 5. Patient Global Evaluation (PGE) |
|
| Notes |
Date of study: September 1998 to September 1999 Funding source: GSK Declarations of interest among the primary researchers: Not stated. |
|
| Risk of bias | ||
| Bias | Authors' judgement | Support for judgement |
| Random sequence generation (selection bias) | Unclear risk | Quote: "randomized". |
| Allocation concealment (selection bias) | Unclear risk | No information provided. |
| Blinding of participants and personnel (performance bias) All outcomes | Unclear risk | Quote: "double‐blind". No further details. |
| Blinding of outcome assessment (detection bias) All outcomes | Unclear risk | Quote: "double‐blind". No further details. |
| Incomplete outcome data (attrition bias) All outcomes | Unclear risk | Quote: "ITT population consisted of all subjects who received treatment and have one post treatment evaluation". |
| Selective reporting (reporting bias) | Low risk | All outcomes were reported. |
| Other bias | High risk | Sponsored by GSK; the role of the funder in planning, conducting and writing the study is not discussed. |
Holland 1999.
| Methods | Study design: Randomised controlled trial | |
| Participants |
Diagnosis: DSM ‐ III ‐ R panic disorder with or without agoraphobia Method of diagnosis: Not stated Age: for adinazolam, M = 36.5; for clomipramine, M = 35.8; SD not provided Sex: for adinazolam, 36% male; for clomipramine 38% male Location: UK; setting unclear Co‐morbidities: patients with psychiatric co‐morbidities were excluded Rescue medication: Not stated |
|
| Interventions |
Participants were randomly assigned to either: (1) adinazolam arm (n = 166) Duration: 24 weeks Treatment Protocol: flexible dosage; range = 30 ‐ 90 mg, M and SD not provided (2) clomipramine arm (n = 149) Duration: 24 weeks Treatment Protocol: flexible dosage; range = 50 ‐ 150 mg, M and SD not provided |
|
| Outcomes |
Time points for assessment: weeks 1, 2, 4, 8, 12, 16, 20 and 24 Outcomes: 1. total number of panic attacks (Panic Attack and Anticipatory Anxiety scale) 2. Clinical Global Impression Improvement Score (CGI‐I) 3. SCL ‐ 90, Phobic Anxiety Dimension 4. Sheehan Disability Scale |
|
| Notes |
Date of study: Not stated Funding source: Not stated Declarations of interest among the primary researchers: Not stated. |
|
| Risk of bias | ||
| Bias | Authors' judgement | Support for judgement |
| Random sequence generation (selection bias) | Unclear risk | Quote: "randomized". |
| Allocation concealment (selection bias) | Unclear risk | No information provided. |
| Blinding of participants and personnel (performance bias) All outcomes | Unclear risk | Quote: "double‐blind". No further details. |
| Blinding of outcome assessment (detection bias) All outcomes | Unclear risk | Quote: "double‐blind". No further details. |
| Incomplete outcome data (attrition bias) All outcomes | High risk | LOCF data are reported, but without specifying number of patients evaluated. |
| Selective reporting (reporting bias) | Unclear risk | All outcomes were reported, but without specifying number of patients evaluated. |
| Other bias | Unclear risk | Authors' affiliations refer to pharmaceutical companies. |
Krueger 1999.
| Methods | Study design: Randomised controlled trial | |
| Participants |
Diagnosis: DSM ‐ III ‐ R panic disorder with or without agoraphobia Method of diagnosis: SCID Axis I, Roche edition Age: for moclobemide, M = 35.0 (SD = 8.9); for clomipramine, M = 36.0 (SD = 9.5) Sex: for moclobemide, 41.8% males, 58.2 females; for clomipramine 39.7% males, 60.3% females Location: Norway, Sweden, the Netherlands; setting unclear Co‐morbidities: none, except of generalised anxiety disorders and social phobia of less than moderate severity Rescue medication: chloral hydrate as an occasional night time hypnotic |
|
| Interventions |
Participants were randomly assigned to either: (1) moclobemide arm (n = 67) Duration: 8 weeks Treatment Protocol: fixed‐flexible dosage, range = 300 ‐ 600 mg, M and SD not provided (2) clomipramine arm (n = 68) Duration: 8 weeks Treatment Protocol: fixed‐flexible dosage, range = 100 ‐ 200 mg, M and SD not provided |
|
| Outcomes |
Time points for assessment: week 1, 2, 4, and 8 Outcomes: 1. number of panic attacks 2. Patients' Clinical Global Impression of Change (P‐CGI‐C) 3. Investigators' rating of Clinical Global Impression of the Severity of the patients' panic disorder (I‐CGI‐S) 4. Patients' rating of Clinical Global Impression of Severity (P‐CGI‐S) 6. Sheehan Disability Scale (SDS) 7. Hamilton Rating Scale for Anxiety (HAMA) 8. Montgomery–Åsberg Depression Rating Scale (MADRS) |
|
| Notes |
Date of study: Not stated Funding source: Hoffmann ‐ La Roche Declarations of interest among the primary researchers: Not stated. |
|
| Risk of bias | ||
| Bias | Authors' judgement | Support for judgement |
| Random sequence generation (selection bias) | Unclear risk | Quote: "randomized". |
| Allocation concealment (selection bias) | Unclear risk | No information provided. |
| Blinding of participants and personnel (performance bias) All outcomes | Unclear risk | Quote: "double‐blind". No further details. |
| Blinding of outcome assessment (detection bias) All outcomes | Unclear risk | Quote: "double‐blind". No further details. |
| Incomplete outcome data (attrition bias) All outcomes | Low risk | Quote: "it was estimated that the ITT population with two‐sided significance level of 0.05 and a power of at least 0.8 had to be at least 66 patients in each treatment group"; "the ITT population comprised 135 patients who had received treatment and at least one assessment after baseline". |
| Selective reporting (reporting bias) | Unclear risk | All outcomes were reported. |
| Other bias | High risk | Sponsored by Hoffmann‐La Roche; the role of the funder in planning, conducting and writing the study is not discussed. |
Lecrubier 1997.
| Methods | Study design: Randomised controlled trial | |
| Participants |
Diagnosis: DSM‐III‐R panic disorder with or without agoraphobia Method of diagnosis: not stated Age: for paroxetine, M = 34.7 (SD = 9.3); for clomipramine, M = 35.1 (SD = 9.2) Sex: for paroxetine, 53 males, 70 females; for clomipramine 46 males, 75 females Location: 39 centres in Belgium, Denmark, France, Hungary, Ireland, Israel, Italy, the Netherlands, Norway, Spain, Switzerland, UK, Yugoslavia; setting: outpatients Co‐morbidities: none Rescue medication: chloral hydrate for night time sedation allowed |
|
| Interventions |
Participants were randomly assigned to either: (1) paroxetine arm (n = 123) Duration: 12 weeks Treatment Protocol: flexible dosage, range = 10 ‐ 60 mg, M and SD not provided (2) clomipramine arm (n = 122) Duration: 12 weeks Treatment Protocol: flexible dosage, range = 10 ‐ 150 mg, M and SD not provided (3) placebo arm (n = 123) Duration: 12 weeks |
|
| Outcomes |
Time points for assessment: weeks 3, 6, 9, 12 Outcomes: 1. change in number of panic attacks 2. proportion of subjects with zero panic attacks 3. proportion of subjects with a > 50% reduction in the number of panic attacks 4. change in intensity of panic attacks 5. Hamilton Rating Scale for Anxiety (HAMA) 6. Clinical Global Impression Scale (CGI) 7. Montgomery–Åsberg Depression Rating Scale (MADRS) 8. Mark Sheehan Phobia Scale 9. Patient Global Evaluation (PGE) 10. Sheehan Disability Scale |
|
| Notes |
Date of study: October 1991 ‐ November 1993 Funding source: Sponsored by GSK Declarations of interest among the primary researchers: Department of Clinical Research, Development and Medical Affairs, SmithKline Beecham Pharmaceuticals |
|
| Risk of bias | ||
| Bias | Authors' judgement | Support for judgement |
| Random sequence generation (selection bias) | Unclear risk | Quote: "randomized". |
| Allocation concealment (selection bias) | Unclear risk | No information provided. |
| Blinding of participants and personnel (performance bias) All outcomes | Unclear risk | Quote: "double‐blind". No further details. |
| Blinding of outcome assessment (detection bias) All outcomes | Unclear risk | Quote: "double‐blind". No further details. |
| Incomplete outcome data (attrition bias) All outcomes | Unclear risk | Quote: "the primary and secondary efficacy analysis were performed on the ITT population, which included all subjects who were randomized, who received their randomized treatment and for whom at least one assessment was available after active treatment. Safety assessment were performed on the ITT population. Dropouts rates were around 30% in both treatment arms. |
| Selective reporting (reporting bias) | Unclear risk | All outcomes were reported. |
| Other bias | High risk | Sponsored by GSK; the role of the funder in planning, conducting and writing the study is not discussed. |
Lepola 1990.
| Methods | Study design: Randomised controlled trial | |
| Participants |
Diagnosis: DMS‐III panic disorder with or without agoraphobia Method of diagnosis: Not stated Age: M = 37.4, SD not provided Sex: not stated Location: Finland; setting: inpatients Co‐morbidities: patients with psychiatric co‐morbidities were excluded; medical co‐morbidities are not mentioned; six patients suspected cases of epilepsy Rescue medication: "the patients did not receive any other treatment during the trial period" |
|
| Interventions |
Participants were randomly assigned to either: (1) alprazolam arm (n = 27) Duration: 9 weeks Treatment Protocol: flexible dosage, range = 1.5 ‐ 8 mg, M = 4.9, SD not provided (2) imipramine arm (n = 28) Duration: 9 weeks Treatment Protocol: flexible dosage, range = 30 ‐ 225 mg, M = 130, SD not provided |
|
| Outcomes |
Time points for assessment: baseline, 3 weeks, 9 weeks Outcomes: 1. panic attack frequency 2. Hamilton Rating Scale for Anxiety (HAMA) 3. Montgomery–Åsberg Depression Rating Scale (MADRS) 4. seven‐point evaluation scale of the clinical state (not better specified) |
|
| Notes |
Date of study: Not stated Funding source: Not stated Declarations of interest among the primary researchers: None (but authors' affiliations refer to pharmaceutical companies). |
|
| Risk of bias | ||
| Bias | Authors' judgement | Support for judgement |
| Random sequence generation (selection bias) | Unclear risk | Quote: "randomized". |
| Allocation concealment (selection bias) | Unclear risk | No information provided. |
| Blinding of participants and personnel (performance bias) All outcomes | Unclear risk | Quote: "double‐blind". No further details. |
| Blinding of outcome assessment (detection bias) All outcomes | Unclear risk | Quote: "double‐blind". No further details. |
| Incomplete outcome data (attrition bias) All outcomes | Unclear risk | No information provided about management of incomplete outcome data. |
| Selective reporting (reporting bias) | Low risk | All relevant outcomes were reported. |
| Other bias | Unclear risk | Authors' affiliations refer to pharmaceutical companies. |
Meco 1989.
| Methods | Study design: Randomised controlled trial | |
| Participants |
Diagnosis: DSM III‐R panic disorder with agoraphobia Method of diagnosis: not stated Age: for etizolam, M = 49 (SD = 12.7); for alprazolam, M = 47.8 (SD = 12.5) Sex: for etizolam, 9 females and 6 males; for alprazolam, 8 females and 7 males Location: Italy; setting: outpatients Co‐morbidities: patients with psychotic or epilepsy disorders, organic cerebral disorders, and severe medical diseases were excluded Rescue medication: not stated |
|
| Interventions |
Participants were randomly assigned to either: (1) etizolam arm (n = 15) Duration: 6 weeks Treatment Protocol: fixed dosage; range = 1 ‐ 1.5 mg, M and SD not provided (2) alprazolam arm (n = 15) Duration: 6 weeks Treatment Protocol: fixed dosage; range = 1 ‐ 1.5 mg, M and SD not provided |
|
| Outcomes |
Time points for assessment: 3, 6 weeks Outcomes: 1. Hamilton Anxiety Rating Scale (HARS) 2. number of panic attack 3. Side Effect Check List |
|
| Notes |
Date of study: Not stated Funding source: Not stated Declarations of interest among the primary researchers: None. |
|
| Risk of bias | ||
| Bias | Authors' judgement | Support for judgement |
| Random sequence generation (selection bias) | Unclear risk | Quote: "randomized". |
| Allocation concealment (selection bias) | Unclear risk | No information provided. |
| Blinding of participants and personnel (performance bias) All outcomes | Unclear risk | Quote: "double‐blind". No further details. |
| Blinding of outcome assessment (detection bias) All outcomes | Unclear risk | Quote: "double‐blind". No further details. |
| Incomplete outcome data (attrition bias) All outcomes | Unclear risk | No information provided about management of incomplete outcome data. |
| Selective reporting (reporting bias) | High risk | Data are reported only in graphs; number of patients evaluated not specified; data on HAMA are reported only for each single item. |
| Other bias | Unclear risk | Sponsorship bias cannot be ruled out. |
Nair 1996.
| Methods | Study design: Randomised controlled trial | |
| Participants |
Diagnosis: DSM‐III‐R panic disorder with or without agoraphobia Method of diagnosis: not stated Age: for fluvoxamine, M = 34.5; for imipramine, M = 34.5, SD not provided Sex: for fluvoxamine 56% females 44% males; for imipramine 50% females 50% males Location: Canada; setting: outpatients Co‐morbidities: patients with a history of bipolar disorder, organic brain syndrome, schizophrenia or other psychotic disorders were excluded Rescue medication: oxazepam up to 60 mg daily or chloral hydrate up to 2000 mg daily were permitted during first four weeks of treatment |
|
| Interventions |
Participants were randomly assigned to either: (1) fluvoxamine arm (n = 50) Duration: 8 weeks Treatment Protocol: flexible dosage, range = 50 ‐ 300 mg, M = 171.4, SD not provided (2) imipramine arm (n = 48) Duration: 8 weeks Treatment Protocol: flexible dosage, range = 50 ‐ 300 mg, M = 164.7, SD not provided (3) placebo arm (n = 50) Duration: 8 weeks |
|
| Outcomes |
Time points for assessment: weekly Outcomes: 1. Sheehan Panic and Anticipatory Anxiety Scale 2. Clinical Global Impression Scale (CGI) 3. Montgomery–Åsberg Depression Rating Scale (MADRS) 4. Sheehan Disability Scale (SDS) 5. Sheehan Panic Attack Diary (intensity and number of panic attacks) 6. Sheehan Phobia Scale 7. Hopkins Symptom Checklist |
|
| Notes |
Date of study: Not stated Funding source: Orto McNeil Ltd. Declarations of interest among the primary researchers: Not stated. |
|
| Risk of bias | ||
| Bias | Authors' judgement | Support for judgement |
| Random sequence generation (selection bias) | Unclear risk | Quote: "randomized". |
| Allocation concealment (selection bias) | Unclear risk | No information provided. |
| Blinding of participants and personnel (performance bias) All outcomes | Low risk | Quote: "the study medication was in the form of identically appearing capsules each containing either placebo, 50 mg of fluvoxamine or 50 mg of imipramine". |
| Blinding of outcome assessment (detection bias) All outcomes | Low risk | Quote: "the study medication was in the form of identically appearing capsules each containing either placebo, 50 mg of fluvoxamine or 50 mg of imipramine". |
| Incomplete outcome data (attrition bias) All outcomes | Low risk | Quote: "two patient samples were identified for analysis and reporting purposes prior to unblinding: an all patients analysis and an ITT. The all patients sample was defined as those randomised to double blind treatment and who provided at least some drug safety and tolerance data [...] the main efficacy analysis of the study was based on the LOCF of the ITT sample". |
| Selective reporting (reporting bias) | Low risk | All outcomes were reported. |
| Other bias | High risk | Sponsored by Orto McNeil Ltd; the role of the funder in planning, conducting and writing the study is not discussed. |
Noyes 1996.
| Methods | Study design: Randomised controlled trial | |
| Participants |
Diagnosis: DSM‐III panic disorder or agoraphobia with panic attacks Method of diagnosis: Structured Clinical Interview for DSM‐III, Upjohn Version Age: M = 36.6; SD = 10.5 Sex: women = 157, men = 84 Location: USA, Australia; setting: outpatients Co‐morbidities: patients with major psychiatric co‐morbidities, head trauma or seizures were excluded Rescue medication: none |
|
| Interventions |
Participants were randomly assigned to either: (1) diazepam arm (n = 81) Duration: 8 weeks Treatment Protocol: flexible dosage, range = 10 ‐ 100 mg, M = 43, SD not provided (2) alprazolam arm (n = 78) Duration: 8 weeks Treatment Protocol: flexible dosage, range = 1 ‐ 10 mg, M = 4.9, SD not provided (3) placebo arm (n = 79) Duration: 8 weeks |
|
| Outcomes |
Time points for assessment: baseline, 4 weeks, 8 weeks Outcomes: 1. frequency of panic attacks 2. Sheehan Self Rated Scale for Anxiety 3. Hamilton Rating Scale for Anxiety (HAMA) 4. Marks and Mathews Agoraphobia Scale 5. Profile of Mood States 6. Hamilton Rating Scale for Depression (HRSD) 7. Work and Social Disability Scale 8. Systematic Assessment for Treatment‐Emergent Events |
|
| Notes |
Date of study: not stated Funding source: supported by a grant from the Upjohn Company Declarations of interest among the primary researchers: Not stated. |
|
| Risk of bias | ||
| Bias | Authors' judgement | Support for judgement |
| Random sequence generation (selection bias) | Unclear risk | Quote: "randomized". |
| Allocation concealment (selection bias) | Unclear risk | No information provided. |
| Blinding of participants and personnel (performance bias) All outcomes | Unclear risk | Quote: "double‐blind". No further details. |
| Blinding of outcome assessment (detection bias) All outcomes | Unclear risk | Quote: "double‐blind". No further details. |
| Incomplete outcome data (attrition bias) All outcomes | Low risk | Quote: "to examine differences in treatment groups over time we completed ITT analysis using logistic regression procedures. The results of analysis using the completer sample were very similar to those using the III subjects". |
| Selective reporting (reporting bias) | Low risk | All outcomes were reported. |
| Other bias | High risk | Supported by a grant from the Upjohn Company; the role of the funder in planning, conducting and writing the study is not discussed. |
Pfizer 2008.
| Methods | Study design: Randomised controlled trial | |
| Participants |
Diagnosis: Panic disorder with or without agoraphobia according to DSM IV Method of diagnosis: no information provided Age: range = 18 ‐ 64 years, mean and SD not provided Sex: sertraline: female = 113, male = 44; paroxetine: female = 109, male = 53 Location: Japan; setting unclear Co‐morbidities: "patients with bipolar disorder, schizophrenia, delusional disorder, epilepsy, MDD, OCD, seasonal affective disorder or GAD were excluded; patients who concurrently have depression/depressive state, anxiety disorder and generalized anxiety disorder may be included if the primary diagnosis is identified to be panic disorder" Rescue medication: none |
|
| Interventions |
Participants were randomly assigned to either: (1) sertraline arm (n = 157) Duration: 12 weeks Treatment Protocol: flexible dosage, range = 25 ‐ 100 mg (2) paroxetine arm (n = 164) Duration: 12 weeks Treatment Protocol: flexible dosage, range = 10 ‐ 30 mg |
|
| Outcomes |
Time points for assessment: Outcomes: 1. Panic and Agoraphobia Scale 2. Clinical Global Impression Improvement Score (CGI‐I) 3. frequency of panic attacks 4. Hamilton Rating Scale for Anxiety (HAMA) |
|
| Notes |
Date of study: May 2008 ‐ February 2010 Funding source: Pfizer Declarations of interest among the primary researchers: not stated. |
|
| Risk of bias | ||
| Bias | Authors' judgement | Support for judgement |
| Random sequence generation (selection bias) | Unclear risk | Quote: "Allocation: randomized" |
| Allocation concealment (selection bias) | Unclear risk | No information provided. |
| Blinding of participants and personnel (performance bias) All outcomes | Low risk | Quote: "Masking: double‐blind (subject, investigator)" |
| Blinding of outcome assessment (detection bias) All outcomes | Low risk | Quote: "Masking: double‐blind (subject, investigator)" |
| Incomplete outcome data (attrition bias) All outcomes | Unclear risk | "Last Obsevation Carried Forward" |
| Selective reporting (reporting bias) | Low risk | All outcomes were reported. |
| Other bias | High risk | Sponsored by Pfizer; the role of the funder in planning, conducting and writing the study is not discussed. |
Pollack 2007a.
| Methods | Study design: Randomised controlled trial | |
| Participants |
Diagnosis: DSM‐IV panic disorder with or without agoraphobia Method of diagnosis: Mini‐International Neuropsychiatric Interview Age: for venlafaxine 75 mg, M = 35.8, SD = 9.97; for venlafaxine 225 mg, M = 37.1, SD = 11.8, for paroxetine M = 37.5, SD = 11 Sex: for venlafaxine 75 mg, females = 65%, males = 35%; for venlafaxine 225 mg, females = 68%, males = 33%; for paroxetine females = 68%, males = 32% Location: Argentina, Mexico, Chile, Costa Rica; setting: outpatients Co‐morbidities: patients with other predominant Axis I or II disorders and important medical conditions were excluded Rescue medication: zaleplon or zolpidem permitted up to 3 times per week for the first 2 weeks of randomised treatment |
|
| Interventions |
Participants were randomly assigned to either: (1) venlafaxine 75 mg arm (n = 163) Duration: 12 weeks Treatment Protocol: fixed dosage = 75 mg/day (2) venlafaxine 225 mg arm (n = 167) Duration: 12 weeks Treatment Protocol: fixed dosage = 225 mg/day (3) paroxetine arm (n = 161) Duration: 12 weeks Treatment Protocol: fixed dosage = 40 mg/day (4) placebo arm (n = 162) Duration: 12 weeks |
|
| Outcomes |
Time points for assessment: baseline, weeks 1, 2, 3, 4, 6, 8, 10, 12 Outcomes: 1. patients free of panic attacks at endpoint 2. Panic Disorder Severity Scale (PDSS) 3. panic attacks frequency 4. Clinical Global Impression Improvement Score (CGI‐I) |
|
| Notes |
Date of study: not stated Funding source: Wyeth Research, Collegeville, Pennsylvania Declarations of interest among the primary researchers: members of advisory boards, and research support received by many pharmaceutical companies, including AstraZeneca, GlaxoSmithKline, Eli Lilly, Pfizer, Roche, Wyeth |
|
| Risk of bias | ||
| Bias | Authors' judgement | Support for judgement |
| Random sequence generation (selection bias) | Unclear risk | Quote: "randomized". |
| Allocation concealment (selection bias) | Unclear risk | No information provided. |
| Blinding of participants and personnel (performance bias) All outcomes | Low risk | Quote: "...they were randomly assigned to receive venlafaxine 75 mg/day, venlafaxine 225 mg/day, paroxetine or placebo once daily in identically appearing capsules". |
| Blinding of outcome assessment (detection bias) All outcomes | Low risk | Quote: "...they were randomly assigned to receive venlafaxine 75 mg/day, venlafaxine 225 mg/day, paroxetine or placebo once daily in identically appearing capsules". |
| Incomplete outcome data (attrition bias) All outcomes | Low risk | Quote: "statystical analysis on the primary and secondary outcome measures were performed for an ITT population of patients who had at least one post randomisation visit on therapy using LOCF values". |
| Selective reporting (reporting bias) | Unclear risk | Continuous data at endpoint are reported only in graphs. |
| Other bias | High risk | Sponsored by Wyeth; the role of the funder in planning, conducting and writing the study is not discussed. |
Pollack 2007b.
| Methods | Study design: Randomised controlled trial | |
| Participants |
Diagnosis: DSM‐IV panic disorder with or without agoraphobia Method of diagnosis: Mini‐International Neuropsychiatric Interview Age: for venlafaxine 75 mg, M = 36.2, SD = 10.7; for venlafaxine 150 mg, M = 37.7, SD = 11.5, for paroxetine M = 37.6, SD = 10.5 Sex: for venlafaxine 75 mg, females = 66%, males = 34%; for venlafaxine 150 mg, females = 70%, males = 30%; for paroxetine females = 64%, males = 36% Location: Europe; setting: outpatients Co‐morbidities: patients with other predominant Axis I or II disorders and important medical conditions were excluded Rescue medication: zaleplon or zolpidem permitted up to 3 times per week for the first 2 weeks of randomised treatment |
|
| Interventions |
Participants were randomly assigned to either: (1) venlafaxine 75 mg arm (n = 166) Duration: 12 weeks Treatment Protocol: fixed dosage = 75 mg/day (2) venlafaxine 150 mg arm (n = 168) Duration: 12 weeks Treatment Protocol: fixed dosage = 150 mg/day (3) paroxetine arm (n = 166) Duration: 12 weeks Treatment Protocol: fixed dosage = 40 mg/day (4) placebo arm (n = 163) Duration: 12 weeks |
|
| Outcomes |
Time points for assessment: baseline, weeks 1, 2, 3, 4, 6, 8, 10, 12 Outcomes: 1. frequency of panic attacks from the Panic and Anticipatory Anxiety Scale 2. patients free of panic attacks at endpoint 3. Panic Disorder Severity Scale (PDSS) 4. PDSS: anticipatory anxiety 5. Phobia Scale 6. Hamilton Rating Scale for Anxiety (HAMA) 7. Sheehan Disability Scale (SDS) 8. Quality of Life Enjoyment and Satisfaction Questionnaire 9. Clinical Global Impression Improvement Score (CGI‐I) |
|
| Notes |
Date of study: not stated Funding source: sponsored by Wyeth Research Declarations of interest among the primary researchers: members of advisory boards, and research support received by many pharmaceutical companies, including AstraZeneca, GlaxoSmithKline, Eli Lilly, Pfizer, Roche, Wyeth; some authors' affiliations refer to Wyeth. |
|
| Risk of bias | ||
| Bias | Authors' judgement | Support for judgement |
| Random sequence generation (selection bias) | Unclear risk | Quote: "randomized". |
| Allocation concealment (selection bias) | Unclear risk | No information provided. |
| Blinding of participants and personnel (performance bias) All outcomes | Low risk | Quote: "Study medication was provided as identical appearing capsules and was to be taken once daily with food". |
| Blinding of outcome assessment (detection bias) All outcomes | Low risk | Quote: "Study medication was provided as identical appearing capsules and was to be taken once daily with food". |
| Incomplete outcome data (attrition bias) All outcomes | Unclear risk | Quote: "statystical analysis on the primary and secondary outcome measures were performed for an ITT population of patients who had at least one post randomisation visit on therapy using LOCF values". |
| Selective reporting (reporting bias) | Low risk | All outcomes were reported. |
| Other bias | High risk | Sponsored by Wyeth; the role of the funder in planning, conducting and writing the study is not discussed. |
Ribeiro 2001.
| Methods | Study design: Randomised controlled trial | |
| Participants |
Diagnosis: DSM‐IV panic disorder with or without agoraphobia Method of diagnosis: not stated Age: for mirtazapine, M = 36.1, SD = 10.9; for fluoxetine, M = 36.4, SD = 10.1 Sex: for mirtazapine, 86.7% females, for fluoxetine 66.7% females Location: Brasil; setting: outpatients Co‐morbidities: patients with psychiatric and physical disorders were excluded Rescue medication: none |
|
| Interventions |
Participants were randomly assigned to either: (1) mirtazapine arm (n = 15) Duration: 8 weeks Treatment Protocol: flexible dosage, range = 15 ‐ 30 mg, M = 17.9, SD = 4.3 (2) fluoxetine arm (n = 15) Duration: 8 weeks Treatment Protocol: flexible dosage, range = 10 ‐ 20 mg, M = 13.1, SD = 3.2 |
|
| Outcomes |
Time points for assessment: Baseline, week 1, 2, 4, 6 and 8 Outcomes: 1. Panic Diary 2. Clinical Global Impression Severity of Illness Score (CGI‐S) 3. Clinical Global Impression Improvement Score (CGI‐I) 4. Hamilton Rating Scale for Anxiety (HAMA) 5. Sheehan Phobic Scale |
|
| Notes |
Date of study: November 1998 ‐ March 1999 Funding source: research supported by FIPE‐HCPA (FUNDO DE INCENTIVO À PESQUISA E EVENTOS) Declarations of interest among the primary researchers: Not stated. |
|
| Risk of bias | ||
| Bias | Authors' judgement | Support for judgement |
| Random sequence generation (selection bias) | Low risk | Quote: "patients were randomised to mirtazapine or fluoxetine using a computer program which assigned 15 patients to each group". |
| Allocation concealment (selection bias) | Low risk | Quote: "a person who was not participating in the study labeled flasks containing enough medications for periods between visits". |
| Blinding of participants and personnel (performance bias) All outcomes | Unclear risk | Quote: "double‐blind". No further details. |
| Blinding of outcome assessment (detection bias) All outcomes | Unclear risk | Quote: "double‐blind". No further details. |
| Incomplete outcome data (attrition bias) All outcomes | Unclear risk | Quote: "the analysis included all patients who took at least one dose of medication during the double‐blind phase and who provided any follow‐up data". |
| Selective reporting (reporting bias) | Low risk | All outcomes were reported. |
| Other bias | Unclear risk | Organon Pharmaceutical kindly provided mirtazapine for the trial. |
Sasson 1999.
| Methods | Study design: Randomised cross‐over trial | |
| Participants |
Diagnosis: DSM‐III‐R panic disorder Method of diagnosis: not stated Age: M = 36, SD = 8 Sex: males = 6, females = 11 Location: Israel; setting unclear Co‐morbidities: patients were free of significant medical problems, mental retardation, psychosis, drug abuse, organic lesions and primary mood disorders Rescue medication: not stated |
|
| Interventions |
Participants were randomly assigned to either: (1) clomipramine arm (n = 17) Duration: 6 weeks Treatment Protocol: flexible dosage, range = 75 ‐ 200 mg, M = 140, SD = 52 (2) desipramine arm (n = 17) Duration: 6 weeks Treatment Protocol: flexible dosage, range = 50 ‐ 300 mg, M = 190, SD = 69 According to the cross‐over design, patients received placebo for 2 weeks; active treatment for 6 weeks; placebo for 2 weeks; switch to the other active treatment for 6 weeks. Data on the active treatment phases are provided together. |
|
| Outcomes |
Time points for assessment: baseline, every two weeks Outcomes: 1. Hamilton Rating Scale for Anxiety (HAMA) 2. NIMH Global Scales for anxiety, depression and impairment 3. Zung Anxiety Scale 4. State‐Trait Anxiety Inventory (STAI) 5. number of panic attacks |
|
| Notes |
Date of study: not stated Funding source: not stated Declarations of interest among the primary researchers: not stated. |
|
| Risk of bias | ||
| Bias | Authors' judgement | Support for judgement |
| Random sequence generation (selection bias) | Unclear risk | Quote: "randomized". |
| Allocation concealment (selection bias) | Unclear risk | No information provided. |
| Blinding of participants and personnel (performance bias) All outcomes | Unclear risk | Quote: "double blind". No further information provided. |
| Blinding of outcome assessment (detection bias) All outcomes | Unclear risk | Quote: "double blind". No further information provided. |
| Incomplete outcome data (attrition bias) All outcomes | Low risk | No missing outcome data. |
| Selective reporting (reporting bias) | Low risk | All outcomes were reported. |
| Other bias | Unclear risk | Sponsorship bias cannot be ruled out. |
Schweizer 1993.
| Methods | Study design: Randomised controlled trial | |
| Participants |
Diagnosis: DSM ‐ III panic disorder Method of diagnosis: Structured Clinical Interview for DSM‐III, Upjohn Version Age: M = 33, SD = 7 Sex: female = 75%, male = 25% Location: USA; setting: in and outpatients Co‐morbidities: none Rescue medication: Quote: "no concomitant centrally active medication therapy was permitted during the study" |
|
| Interventions |
Participants were randomly assigned to either: (1) alprazolam arm (n = 37) Duration: 8 weeks short term, 32 weeks long term Treatment Protocol: flexible dosage, range = 2 ‐ 10 mg, M = 5.4, SD = 2.1 (2) imipramine arm (n = 34) Duration: 8 weeks short term, 32 weeks long term Treatment Protocol: flexible dosage, range = 50 ‐ 250 mg, M = 152, SD = 65 (3) placebo arm (n = 35) Duration: 8 weeks short term, 32 weeks long term |
|
| Outcomes |
Time points for assessment: weekly until week 6, week 8, monthly for 6 months Outcomes: 1. panic attack frequency and severity 2. Hamilton Rating Scale for Anxiety (HAMA) 3. phobias 4. disability resulting from the phobic anxiety 5. global assessment of improvement 6. safety questionnaire (SAFTEE) 7. benzodiazepines plasma levels |
|
| Notes |
Date of study: not stated Funding source: sponsored by Upjohn Co. Declarations of interest among the primary researchers: not stated. |
|
| Risk of bias | ||
| Bias | Authors' judgement | Support for judgement |
| Random sequence generation (selection bias) | Unclear risk | Quote: "randomized". |
| Allocation concealment (selection bias) | Unclear risk | No information provided. |
| Blinding of participants and personnel (performance bias) All outcomes | Low risk | Quote: "patients were dispensed identical capsules containing either 1 mg of alprazolam or 25 mg of imipramine". |
| Blinding of outcome assessment (detection bias) All outcomes | Low risk | Quote: "patients were dispensed identical capsules containing either 1 mg of alprazolam or 25 mg of imipramine". |
| Incomplete outcome data (attrition bias) All outcomes | Low risk | Quote: "ITT endpoint analysis, including all patients with at least one week of treatment and 'evaluable patients' or 'decreasing N' analysis, using only those patients available at each visit, were the primary set of analysis conducted. Supplementary completers analysis using only patients who completed either 8 weeks or 32 weeks of treatment were also conducted". "While the high attrition rate in the imipramine and placebo treatment groups posed a problem for the statystical analysis of the various outcome measures, attrition rates themselves constituted an important and independent outcome measures. Survival analysis was performed for on‐study treatment". |
| Selective reporting (reporting bias) | Low risk | All relevant outcomes were reported. |
| Other bias | High risk | Sponsored by Upjohn Co; the role of the funder in planning, conducting and writing the study is not discussed. |
Sheikh 1999.
| Methods | Study design: Randomised controlled trial | |
| Participants |
Diagnosis: DSM‐III‐R panic disorder with or without agoraphobia Method of diagnosis: Structured Clinical Interview for DSM‐III‐R‐Patient Version (SCID‐P), Mini‐Mental State Exam (MMSE) Age: M = 61.64, SD = 5.27 Sex: 23 females, 2 males Location: USA; setting: outpatients Co‐morbidities: patients with bipolar disorder, schizophrenia or psychosis, borderline personality disorder, obsessive‐compulsive disorder alcohol or substance abuse, unstable medical, metabolic or cardiopulmonary condition were excluded Rescue medication: none |
|
| Interventions |
Participants were randomly assigned to either: (1) alprazolam arm (n = 8) Duration: 8 weeks Treatment Protocol: flexible dosage, range = 1 ‐ 6 mg, M = 2.87, SD = 1.66 (2) imipramine arm (n = 10) Duration: 8 weeks Treatment Protocol: flexible dosage, range = 10 ‐ 200 mg, M = 77.5, SD = 59.4 (3) placebo arm (n = 7) Duration: 8 weeks |
|
| Outcomes |
Time points for assessment: weeks 1, 2, 3, 4, 6, 8 Outcomes: 1. panic diary 2. Hamilton Rating Scale for Anxiety (HAMA) 3. Hamilton Rating Scale for Depression (HAM‐D) 4. Physician's Global Impression (PGI) |
|
| Notes |
Date of study: 1988‐1990 Funding source: sponsored by Upjohn Co. Declarations of interest among the primary researchers: not stated. |
|
| Risk of bias | ||
| Bias | Authors' judgement | Support for judgement |
| Random sequence generation (selection bias) | Unclear risk | Quote: "randomized". |
| Allocation concealment (selection bias) | Unclear risk | No information provided. |
| Blinding of participants and personnel (performance bias) All outcomes | Low risk | Quote: "medication for this double blinding protocol were provided by Upjohn Co. in the form of identical looking capsules". |
| Blinding of outcome assessment (detection bias) All outcomes | Low risk | Quote: "medication for this double blinding protocol were provided by Upjohn Co. in the form of identical looking capsules". |
| Incomplete outcome data (attrition bias) All outcomes | Unclear risk | Quote: "this is a pilot study compromised by small sample size and six of seven of the seven subjects in the placebo groups withdrawing early in the treatment course. This limitation prevent statystical analysis between the three groups". |
| Selective reporting (reporting bias) | Low risk | All outcomes were reported. |
| Other bias | High risk | Sponsored by Upjohn Co; the role of the funder in planning, conducting and writing the study is not discussed. |
Stahl 2003.
| Methods | Study design: Randomised controlled trial | |
| Participants |
Diagnosis: DSM ‐ IV panic disorder Method of diagnosis: not stated Age: for escitalopram, M = 37.5, for citalopram M = 37.1 Sex: for escitalopram 57.6 % female, for citalopram 61.6% female Location: USA; setting: outpatients Co‐morbidities: patients with bipolar disorder, schizophrenia, obsessive‐compulsive disorder or other psychotic disorder, psychoactive substance use disorder, clinically significant abnormalities in laboratory evaluations or electrocardiographic readings were excluded Rescue medication: zolpidem |
|
| Interventions |
Participants were randomly assigned to either: (1) escitalopram arm (n = 129) Duration: 10 weeks Treatment Protocol: flexible dosage, range = 5 ‐ 20 mg, M = 10.8 SD not provided (2) citalopram arm (n = 126) Duration: 10 weeks Treatment Protocol: flexible dosage, range = 10 ‐ 40 mg, M = 21.3, SD not provided (3) placebo arm (n = 125) Duration: 10 weeks |
|
| Outcomes |
Time points for assessment: baseline, weeks 1, 2, 4, 6, 8 and 10 Outcomes: 1. Panic and Anticipatory Anxiety Scale (PAAS) 2. panic attack frequency 3. Panic & Agoraphobia Scale 4. Clinical Global Impression Improvement Score (CGI‐I) 5. Clinical Global Impression Severity of Illness Score (CGI‐S) 6. Hamilton Rating Scale for Anxiety (HAMA) 7. Patient Global Evaluation (PGE) 8. Quality of Life Enjoyment and Satisfaction Questionnaire (Q‐LES‐Q) 9. Hamilton Rating Scale for Depression (HAM‐D) |
|
| Notes |
Date of study: 1999 ‐ 2001 Funding source: sponsored by Forest Laboratories Declarations of interest among the primary researchers: one of the authors has received research support from many drug companies; other authors are employees of Forest Laboratories. |
|
| Risk of bias | ||
| Bias | Authors' judgement | Support for judgement |
| Random sequence generation (selection bias) | Unclear risk | Quote: "randomized". |
| Allocation concealment (selection bias) | Unclear risk | No information provided. |
| Blinding of participants and personnel (performance bias) All outcomes | Unclear risk | Quote: "double blind". No further information provided. |
| Blinding of outcome assessment (detection bias) All outcomes | Unclear risk | Quote: "double blind". No further information provided. |
| Incomplete outcome data (attrition bias) All outcomes | Unclear risk | Quote: "The ITT set consisted of 351 patients, 125 treated with escitalopram, 112 with citalopram and 114 with placebo". Dropout rates were different between treatment groups (escitalopram = 24.2%, citalopram = 31.9%). |
| Selective reporting (reporting bias) | Low risk | All outcomes were reported. |
| Other bias | High risk | Sponsored by Forest Laboratories; the role of the funder in planning, conducting and writing the study is not discussed. |
Taylor 1990.
| Methods | Study design: Randomised controlled trial | |
| Participants |
Diagnosis: 79 patients with panic disorder. Method of diagnosis: Structured Clinical Interview for Diagnoses‐Upjohn version (SCID‐UP). Age: Alprazolam: M = 35.0; Imipramine: M=34.1; Placebo: M = 34.9 Sex: Alprazolam: Male = 19%, Imipramine: 30%, Placebo: 31%. Location: USA; setting: outpatients Co‐morbidities: none Rescue medication: none |
|
| Interventions |
Participants were randomly assigned to either: (1) alprazolam (n = 26) Duration: 8 weeks Treatment Protocol: flexible dosage; range = 1 ‐ 8 mg, M = 3.7 (2) imipramine (n=27) Duration: 8 weeks Treatment Protocol: flexible dosage; range = 30 ‐ 270 mg, M = 147 (3) placebo (n = 26) Duration: 8 weeks |
|
| Outcomes |
Time points for assessment: baseline, weeks 1, 4, 8. Outcomes: (1) Frequency/Intensity of panic attacks: panic diary (2) Anxiety: Hamilton Anxiety rating scale (HAMA) (3) Depression: Beck Depression Inventory (BDI) (4) Overall psychiatric symptomatology: Symptom Check List‐ 90 (SCL‐90) (5) Global improvement: 7‐point scale. (6) Work and social disability: 5‐point scale (7) Avoidance: Marks/Mathews Fear Questionnaire (8) Adverse effects: SAFTEE‐UP |
|
| Notes |
Date of study: not stated Funding source: this research was supported in part by NIMH grant 40118 and by a gift from the Upjohn Company. Declarations of interest among the primary researchers: not stated |
|
| Risk of bias | ||
| Bias | Authors' judgement | Support for judgement |
| Random sequence generation (selection bias) | Unclear risk | Quote: "randomized". |
| Allocation concealment (selection bias) | Unclear risk | No information provided. |
| Blinding of participants and personnel (performance bias) All outcomes | Unclear risk | "Double blind": no further information provided. |
| Blinding of outcome assessment (detection bias) All outcomes | Unclear risk | See above. |
| Incomplete outcome data (attrition bias) All outcomes | High risk | Completer analysis only, unequal drop‐out rate (Alprazolam: 8%, Imipramine: 19%) |
| Selective reporting (reporting bias) | High risk | Almost all the efficacy outcome measures described in the methods are reported in the results, but data are incomplete (standard deviations are not always presented). Furthermore, SAFTEE‐UP event form is not reported. |
| Other bias | High risk | This research was supported in part by NIMH grant 40118 and by a gift from the Upjohn Company. The role of the funder in planning, conducting and writing the study is not discussed. |
Tesar 1991.
| Methods | Study design: Randomised controlled trial | |
| Participants |
Diagnosis: DSM‐III panic disorder with or without limited or extensive phobic avoidance Method of diagnosis: Structured Clinical Interview for DSM‐III‐Upjohn version (SCID‐Up) Age: for alprazolam, M = 32.8, SD = 8.9; for clonazepam M = 30.5, SD = 6.5 Sex: for alprazolam 58 female, 42 male; for clonazepam 58 female, 42 male Location: USA; setting unclear Co‐morbidities: patients with bipolar disorder, OCD, psychosis, dementia, substance abuse or major medical disorders were excluded; a concurrent diagnosis of major depression was permissible as long as it was judged to be secondary to panic disorder Rescue medication: not stated |
|
| Interventions |
Participants were randomly assigned to either: (1) alprazolam arm (n = 24) Duration: 6 weeks Treatment Protocol: flexible dosage, range = 1 ‐ 10 mg, M = 5.39 SD = 2.89 (2) clonazepam arm (n = 26) Duration: 6 weeks Treatment Protocol: flexible dosage, range = 0.5 ‐ 5 mg, M = 2.5 SD = 0.94 (3) placebo arm (n = 22) Duration: 6 weeks |
|
| Outcomes |
Time points for assessment: weekly Outcomes: 1. Clinical Global Impression Scale (CGI) 2. Patient Global Assessment (PGI) 3. panic attacks frequency 4. phobias 5. Work and Social Disability Scale 6. Beck Depression Inventory (BDI) |
|
| Notes |
Date of study: not stated Funding source: sponsored by Upjohn Co. Declarations of interest among the primary researchers: none. |
|
| Risk of bias | ||
| Bias | Authors' judgement | Support for judgement |
| Random sequence generation (selection bias) | Unclear risk | Quote: "randomly". |
| Allocation concealment (selection bias) | Unclear risk | No information provided. |
| Blinding of participants and personnel (performance bias) All outcomes | Low risk | Quote: "the study drugs were administered in identical capsules according to a standardised but flexible dosing schedule". |
| Blinding of outcome assessment (detection bias) All outcomes | Low risk | Quote: "the study drugs were administered in identical capsules according to a standardised but flexible dosing schedule". |
| Incomplete outcome data (attrition bias) All outcomes | Low risk | Both endpoint analysis based on LOCF and completers analysis were performed. |
| Selective reporting (reporting bias) | Low risk | All outcomes were reported. |
| Other bias | High risk | Supported in part by a grant from the Upjohn Co.; the role of the funder in planning, conducting and writing the study is not discussed. |
Tiller 1999.
| Methods | Study design: Randomised controlled trial | |
| Participants |
Diagnosis: DSM‐III‐R panic disorder Method of diagnosis: Structured Clinical Interview (SCID) Age: M = 35 Sex: 67% female Location: not stated; setting: unclear Co‐morbidities: not stated Rescue medication: not stated; "there was not extensive co‐prescription of hypnotics, sedatives or beta‐blockers". |
|
| Interventions |
Participants were randomly assigned to either: (1) moclobemide arm (n = 182) Duration: 8 weeks Treatment Protocol: flexible dosage, range = 300 ‐ 600 mg, M = 498, SD = 68 (2) fluoxetine arm (n = 184) Duration: 8 weeks Treatment Protocol: flexible dosage, range = 10 ‐ 30 mg, M = 20.5, SD = 2.7 |
|
| Outcomes |
Time points for assessment: Outcomes: 1. number of adverse events 2. severe adverse events 3. clinical global impression of tolerability 4. panic‐free patients 5. Clinical Global Impression Scale (CGI) |
|
| Notes |
Date of study: not stated Funding source: sponsored by Hoffmann‐La Roche Declarations of interest among the primary researchers: none. |
|
| Risk of bias | ||
| Bias | Authors' judgement | Support for judgement |
| Random sequence generation (selection bias) | Unclear risk | Quote: "randomly allocated" |
| Allocation concealment (selection bias) | Unclear risk | No information provided. |
| Blinding of participants and personnel (performance bias) All outcomes | Unclear risk | Quote: "double blind". No further information provided. |
| Blinding of outcome assessment (detection bias) All outcomes | Unclear risk | Quote: "double blind". No further information provided. |
| Incomplete outcome data (attrition bias) All outcomes | High risk | No information provided about management of incomplete outcome data; number of total dropouts not reported. |
| Selective reporting (reporting bias) | Unclear risk | All relevant outcomes mentioned in the methods section were reported. |
| Other bias | High risk | Sponsored by Hoffmann‐La Roche; the role of the funder in planning, conducting and writing the study is not discussed. |
Uhlenhuth 1989.
| Methods | Study design: Randomised controlled trial | |
| Participants |
Diagnosis: DSM ‐ III panic disorder or agoraphobia with panic attacks Method of diagnosis: SCID‐UP Age: M = 31.54, SD = 7.12 Sex: 58% female Location: USA; setting: outpatients Co‐morbidities: patients with another primary psychiatric disorder or a physical disorder judged likely to interfere with the study were excluded Rescue medication: not stated |
|
| Interventions |
Participants were randomly assigned to either: (1) alprazolam 2 mg arm (n = 20) Duration: 8 weeks Treatment Protocol: fixed dosage 2 mg (2) alprazolam 6 mg arm (n = 21) Duration: 8 weeks Treatment Protocol: fixed dosage 6 mg (3) imipramine arm (n = 20) Duration: 8 weeks Treatment Protocol: fixed dosage 225 mg (4) placebo arm (n = 20) Duration: 8 weeks |
|
| Outcomes |
Time points for assessment: weeks 1, 2, 3, 4, 6, 8 Outcomes: 1. number of panic attacks (major, spontaneous, minor, situational) 2. Marks & Matthews Phobia Scale 3. disability 4. Hamilton Rating Scale for Anxiety (HAMA) 5. Hamilton Rating Scale for Depression (HRSD) 6. SAFTEE‐UP for adverse effects |
|
| Notes |
Date of study: not stated Funding source: sponsored by Upjohn Company Declarations of interest among the primary researchers: not stated. |
|
| Risk of bias | ||
| Bias | Authors' judgement | Support for judgement |
| Random sequence generation (selection bias) | Unclear risk | Quote: "random". |
| Allocation concealment (selection bias) | Unclear risk | No information provided. |
| Blinding of participants and personnel (performance bias) All outcomes | Low risk | Quote: "All patients received two identical appearing capsules four times daily". |
| Blinding of outcome assessment (detection bias) All outcomes | Low risk | Quote: "All patients received two identical appearing capsules four times daily". |
| Incomplete outcome data (attrition bias) All outcomes | Low risk | Quote: "two sets of outcome analysis were employed; one included all 81 patients who entered treatment, and the other included only the 63 patients who completed at least 4 weeks of treatment. Both sets of analysis presented here were based on the final (last available) clinical score for each patient (endpoint analysis). Patterns of dropout by treatment were analysed by survival analysis using the actuarial life table method." |
| Selective reporting (reporting bias) | Low risk | All outcomes were reported. |
| Other bias | High risk | Sponsored by Upjohn Company; the role of the funder in planning, conducting and writing the study is not discussed. |
Van Vliet 1996.
| Methods | Study design: Randomised controlled trial | |
| Participants |
Diagnosis: DSM‐III‐R panic disorder with or without agoraphobia Method of diagnosis: open interview Age: M = 35, SD = 7.46 Sex: 26 women, 6 men Location: the Netherlands; setting: outpatients Co‐morbidities: patients with another anxiety disorder, major affective disorders or psychotic disorder, alcohol or drug abuse and medical problems were excluded Rescue medication: oxazepam maximum 30 mg daily |
|
| Interventions |
Participants were randomly assigned to either: (1) brofaromine arm (n = 15) Duration: 12 weeks Treatment Protocol: fixed dosage 150 mg (2) fluvoxamine arm (n = 15) Duration: 12 weeks Treatment Protocol: fixed dosage 150 mg |
|
| Outcomes |
Time points for assessment: weekly Outcomes: 1. Hamilton Rating Scale for Anxiety (HAMA) 2. Montgomery–Åsberg Depression Rating Scale (MADRS) 3. Fear Questionnaire 4. number of panic attacks 5. Hamilton Rating Scale for Depression (HAM‐D) 6. SCL‐90 |
|
| Notes |
Date of study: not stated Funding source: not stated Declarations of interest among the primary researchers: not stated. |
|
| Risk of bias | ||
| Bias | Authors' judgement | Support for judgement |
| Random sequence generation (selection bias) | Unclear risk | Quote: "randomly". |
| Allocation concealment (selection bias) | Unclear risk | No information provided. |
| Blinding of participants and personnel (performance bias) All outcomes | Unclear risk | Quote: "double blind". No further information provided. |
| Blinding of outcome assessment (detection bias) All outcomes | Unclear risk | Quote: "double blind". No further information provided. |
| Incomplete outcome data (attrition bias) All outcomes | Unclear risk | No information provided about management of incomplete outcome data. |
| Selective reporting (reporting bias) | High risk | Continuous outcomes are reported incompletely (number of evaluated patients is not reported), so that they cannot be entered in a meta‐analysis; Fear Questionnaire data for agoraphobia are only reported in graphs. |
| Other bias | Unclear risk | Sponsorship bias cannot be ruled out. |
Wade 1997.
| Methods | Study design: Randomised controlled trial | |
| Participants |
Diagnosis: DSM‐III‐R panic disorder Method of diagnosis: not stated Age: M = 38, SD not provided Sex: 70% female, 30 % male Location: not stated; setting unclear Co‐morbidities: patients with depression, organic brain damage, drug/alcohol misuse and other severe psychiatric or somatic disorders were excluded Rescue medication: treatment with oxazepam was permitted during weeks 1 and 2 (maximum dose 20 mg daily), discontinued during weeks 3 and 4, and prohibited during weeks 5 to 8. |
|
| Interventions |
Participants were randomly assigned to either: (1) citalopram 10‐15 mg arm (n = 97) Duration: 8 weeks Treatment Protocol: 10 mg, with the option of increasing to 15 mg if efficacy was not seen (2) citalopram 20‐30 mg arm (n = 95) Duration: 8 weeks Treatment Protocol: 20 mg, with the option of increasing to 30 mg if efficacy was not seen (3) citalopram 40‐60 arm (n = 89) Duration: 8 weeks Treatment Protocol: 40 mg, with the option of increasing to 60 mg if efficacy was not seen (4) clomipramine (n = 98) Duration: 8 weeks Treatment Protocol: 60 mg, with the option of increasing to 90 mg if efficacy was not seen (5) placebo (n = 96) |
|
| Outcomes |
Time points for assessment: baseline, last assessment (no further details provided) Outcomes: 1. number of panic attacks ‐ Clinical Anxiety Scale (CAS) 2. general improvement (Physician's Global Improvement Scale, Patient's Global Improvement Scale) 3. Hamilton Anxiety Rating Scale (HAS) 4. Montgomery–Åsberg Depression Rating Scale (MADRS) |
|
| Notes |
Date of study: not stated Funding source: not stated Declarations of interest among the primary researchers: None (but authors' affiliations refer to pharmaceutical companies). |
|
| Risk of bias | ||
| Bias | Authors' judgement | Support for judgement |
| Random sequence generation (selection bias) | Unclear risk | Quote: "randomised". |
| Allocation concealment (selection bias) | Unclear risk | No information provided. |
| Blinding of participants and personnel (performance bias) All outcomes | Unclear risk | Quote: "double blind". No further information provided. |
| Blinding of outcome assessment (detection bias) All outcomes | Unclear risk | Quote: "double blind". No further information provided. |
| Incomplete outcome data (attrition bias) All outcomes | Low risk | Quote: "the primary analysis of efficacy was based upon the relative number of responding patients for the ITT population and by use of the LOCF". |
| Selective reporting (reporting bias) | Unclear risk | All outcomes were reported; data on CAS are reported only in graphs. |
| Other bias | Unclear risk | One of the authors' affiliation refer to Lundbeck. |
Westenberg 1989.
| Methods | Study design: Randomised controlled trial | |
| Participants |
Diagnosis: DSM‐III‐R Method of diagnosis: not stated Age: not stated Sex: 38 females, 9 males Location: the Netherlands; setting: outpatients Co‐morbidities: patients with a primary diagnosis other than panic disorder were excluded Rescue medication: none |
|
| Interventions |
Participants were randomly assigned to either: (1) fluvoxamine arm Duration: 6 weeks Treatment Protocol: dose gradually increased to 150 mg (2) maprotiline arm Duration: 6 weeks Treatment Protocol: dose gradually increased to 150 mg Total number of randomised patients = 47. The number of patients randomised for each arm is not provided. |
|
| Outcomes |
Time points for assessment: baseline, weekly Outcomes: 1. SCL‐90 2. Hamilton Rating Scale for Anxiety (HAMA) 3. State‐Trait Anxiety Inventory (STAI) 4. Self Rating Depression Scale 5. number of panic attacks per week |
|
| Notes |
Date of study: not stated Funding source: not stated Declarations of interest among the primary researchers: not stated. |
|
| Risk of bias | ||
| Bias | Authors' judgement | Support for judgement |
| Random sequence generation (selection bias) | Unclear risk | Quote: "randomised". |
| Allocation concealment (selection bias) | Unclear risk | No information provided. |
| Blinding of participants and personnel (performance bias) All outcomes | Unclear risk | Quote: "double blind". No further information provided. |
| Blinding of outcome assessment (detection bias) All outcomes | Unclear risk | Quote: "double blind". No further information provided. |
| Incomplete outcome data (attrition bias) All outcomes | Unclear risk | No information provided about management of incomplete outcome data. |
| Selective reporting (reporting bias) | High risk | The only available and comparable data are reported in a graph (HAMA). |
| Other bias | Unclear risk | Sponsorship bias cannot be ruled out. |
Zhang 2000.
| Methods | Study design: Randomised controlled trial | |
| Participants |
Diagnosis: DSM III ‐ R Method of diagnosis: no available information Age: no available information Sex: no available information Location: China; setting: in and outpatients Co‐morbidities: none Rescue medication: not stated |
|
| Interventions |
Participants were randomly assigned to either: (1) paroxetine arm (n = 38) Duration: 10 weeks Treatment Protocol: week 1: 20 mg, week 2: 30 mg, week 3: 40 mg, week 4‐10: 40‐50 mg; M = 43.5, SD = 4.8 (2) clomipramine arm (n = 35) Duration: 10 weeks Treatment Protocol: week 1: 50 mg, week 2: 100 mg, week 3: 150 mg, week 4‐10: 150‐200 mg; M = 159.7, SD = 20.1 |
|
| Outcomes |
Time points for assessment: no available information Outcomes: no available information |
|
| Notes |
Date of study: no available information Funding source: sponsored by the drug company marketing the drug Declarations of interest among the primary researchers: no available information. |
|
| Risk of bias | ||
| Bias | Authors' judgement | Support for judgement |
| Random sequence generation (selection bias) | Unclear risk | Insufficient information to assess whether an important risk of bias exists. |
| Allocation concealment (selection bias) | Unclear risk | Insufficient information to assess whether an important risk of bias exists. |
| Blinding of participants and personnel (performance bias) All outcomes | Unclear risk | Insufficient information to assess whether an important risk of bias exists. |
| Blinding of outcome assessment (detection bias) All outcomes | Unclear risk | Insufficient information to assess whether an important risk of bias exists. |
| Incomplete outcome data (attrition bias) All outcomes | Unclear risk | Insufficient information to assess whether an important risk of bias exists. |
| Selective reporting (reporting bias) | Unclear risk | Insufficient information to assess whether an important risk of bias exists. |
| Other bias | High risk | Sponsored by the drug company marketing the drug; the role of the funder in planning, conducting and writing the study is not discussed. |
DSM III/IV: Diagnostic and Statistical Manual of Mental Disorders (third/fourth revision) GAD: generalised anxiety disorder ICD‐10: International Statistical Classification of Diseases and Related Health Problems, 10th revision ITT: intention‐to‐treat LOCF: last observation carried forward M: mean MDD: major depressive disorder MHPG: 3‐methoxy‐4‐hydroxyphenylglycol OCD: obsessive compulsive disorder SCL‐90: Anxiety Subscale of Symptom Checklist‐90‐Revised SD: standard deviation SEM: standard error of the mean TCAs: tricyclic antidepressants
Characteristics of excluded studies [ordered by study ID]
| Study | Reason for exclusion |
|---|---|
| Bakish 1994 | Study design (single case). |
| Baldini Rossi 2000 | Participants were not primarily diagnosed with panic disorder. |
| Balon 1991 | Study design (panicogenic). |
| Balon 1993 | Study design (panicogenic). |
| Bystritsky 1990 | Study design (not double‐blind). |
| Charney 1986 | Study design (not randomised). |
| Davis 1981 | Study design (it is not a study). |
| de Jonghe 1989 | Participants were diagnosed with anxiety disorders including panic disorder, but the randomisation was not stratified by diagnosis; wrong comparison (lorazepam versus suriclone). |
| Dell'Erba 2006 | Study design (not randomised); combined therapy with cognitive behaviour therapy. |
| den Boer 1987 | Participants were diagnosed with anxiety disorders including panic disorder, but the randomisation was not stratified by diagnosis. |
| Dunner 1986 | Participants were diagnosed with anxiety disorders including panic disorder, but the randomisation was not stratified by diagnosis. |
| Dyukova 1992 | Study design (not randomised); participants were not diagnosed with panic disorder. |
| Evans 1986 | Combined therapy with psychotherapy. |
| Fahy 1992 | Combined therapy with psychotherapy. |
| Franulic 1989 | Study design (not randomised). |
| Furukawa 2009 | Study design (it is not a study); combined therapy with cognitive behaviour therapy. |
| Grilo 1998 | Combined therapy with cognitive behaviour therapy. |
| Keller 1993 | Participants were not primarily diagnosed with panic disorder. |
| Lepola 1989 | Study design (not randomised). |
| Mavissakalian 2003 | Study design (long‐term phase of a discontinuation/maintenance open‐label study). |
| McHugh 2007 | Combined therapy with cognitive behaviour therapy. |
| Miretzky 1992 | Combined therapy with cognitive behaviour therapy. |
| Nair 1982 | Participants were diagnosed with anxiety disorders including panic disorder, but the randomisation was not stratified by diagnosis. |
| Nardi 2011 | Study design (not double‐blind). |
| Pareek 2014 | Wrong comparison (clonazepam‐CR versus clonazepam). |
| Pfizer 2002 | Wrong comparison (venlafaxine versus placebo). |
| Pfizer 2005 | Study design (not double‐blind). |
| Pohl 1989 | Combined therapy with psychotherapy. |
| Pollack 2003 | Combined therapy with different drugs. |
| Pyke 1989 | Study design (panicogenic). |
| Raffaele 2002 | Wrong comparison (citalopram versus placebo). |
| Roll 2004 | Combined therapy with cognitive behaviour therapy. |
| Roy‐Byrne 2001 | Wrong comparison (paroxetine versus usual care). |
| Sheehan 1980 | Participants were not diagnosed with panic disorder. |
| Surman 1986 | Study design (not randomised). |
| Svebak 1990 | Study design (not randomised). |
| Tsutsui 2000 | Wrong comparison (paroxetine versus placebo). |
| Tyrer 1988 | Participants with different diagnosis, and randomisation was not stratified according to diagnosis. |
| van Apeldoorn 2008 | Combined therapy with cognitive behaviour therapy. |
| Yang 2005 | Study design (not double‐blind). |
| Yang 2006 | Study design (not double‐blind). |
| Yeragani 1992 | Study design (panicogenic). |
| Zajecka 1996 | Participants were not diagnosed with panic disorder. |
Characteristics of studies awaiting assessment [ordered by study ID]
Minutentag 2001.
| Methods | 18 weeks randomised trial. |
| Participants | 39 patients with panic disorder. |
| Interventions | Imipramine and citalopram. |
| Outcomes | Bandelow Panic and Agoraphobia Scale, CGI‐S. Sheehan Disability Scale. |
| Notes | Waiting for translation from Portuguese to English. |
CGI‐S: Clinical Global Impression Severity of Illness Score
Differences between protocol and review
The intended primary outcome was originally defined 'rate of response' at the protocol stage. However, in order to have consistency in the direction of forest plots, data were extracted as number of patients who failed to meet improvement criteria, as defined by the authors of each study. Therefore, the primary outcome 'rate of response' was renamed 'failure to respond'. This allowed us to present results in such a way that the area to the left of the line of no effect always indicated a favourable outcome for antidepressants. The same reasoning was applied for the outcome 'failure to remit', that was originally defined as 'rates of remission' in the protocol; data on lack of remission were extracted from the studies and presented in forest plots in such a way that the area to the left of the line of no effect always indicated a favourable outcome for antidepressants.
In addition to the planned overall antidepressants versus benzodiazepines comparison (stratified by class), we added separate comparisons of individual classes of antidepressants versus benzodiazepines, in order to present data also about single drugs belonging to each class of antidepressants versus benzodiazepines. This level of information is the most relevant from a clinician's point of view.
For the comparison antidepressants versus antidepressants (comparison B, see Methods), we made the decision to conduct separate comparisons for each class of antidepressant rather than stratify an overall comparison of antidepressants versus antidepressants according to class of drug. We also added individual antidepressants versus another antidepressant of the same class in order to comprehensively address the objectives of the review.
In the protocol we planned to calculate agreement in the selection of studies using Cohen's Kappa (K). However, discordances were much less, and were resolved reaching a consensus through discussion between authors, so we decided not to include a formal measure of agreement.
Contributions of authors
GG devised the idea for the review. GG, IB, and CB worked on the first draft of the protocol. CT, AC, and MK provided suggestions. IB and CT collected the data; IB and CB ran the analyses; MC, AC, TF, FG, GG, MK provided suggestions and input; IB and CB drafted and critically revised the manuscript; all authors reviewed and approved the final version of the review.
Sources of support
Internal sources
None, Not specified.
External sources
None, Not specified.
Declarations of interest
IB: none
CT: none
MC: none
AC is supported by the NIHR Oxford Cognitive Health Clinical Research Facility and was expert witness for Accord Healthcare for a patent issue about quetiapine extended release.
FG: none
TAF has received lecture fees from Eli Lilly, Meiji, Mochida, MSD, Otsuka, Pfizer and Tanabe‐Mitsubishi, and consultancy fees from Sekisui Chemicals and Takeda Science Foundation. He has received royalties from Igaku‐Shoin, Seiwa‐Shoten and Nihon Bunka Kagaku‐sha publishers. He has received grant or research support from the Japanese Ministry of Education, Science, and Technology, the Japanese Ministry of Health, Labour and Welfare, the Japan Society for the Promotion of Science, the Japan Foundation for Neuroscience and Mental Health, Mochida and Tanabe‐Mitsubishi. He is a diplomate of the Academy of Cognitive Therapy.
GG: none
MK: none
CB: none.
New
References
References to studies included in this review
Amore 1999 {published data only}
- Amore M, Magnani K, Cerisoli M, Casagrande C, Ferrari G. Panic disorder. A long‐term treatment study: fluoxetine vs imipramine. Human Psychopharmacology: Clinical and Experimental 1999;14(6):429‐34. [Google Scholar]
Amore 1999 bis {published data only}
- Amore M, Magnani K, Cerisoli M, Ferrari G. Short‐term and long‐term evaluation of selective serotonin reuptake inhibitors in the treatment of panic disorder: fluoxetine vs citalopram. Human Psychopharmacology: Clinical and Experimental 1999;14(6):435‐40. [Google Scholar]
Bakish 1993 {published data only}
- Bakish D, Saxena BM, Bowen R, D'Souza J. Reversible monoamine oxidase‐A inhibitors in panic disorder. Clinical Neuropharmacology 1993;16(Suppl 2):S77‐S82. [PubMed] [Google Scholar]
- Saxena B, Bakish D, Bowen R, D'Souza J. Brofaromine and clomipramine in panic disorder: a double‐blind study. Clinical Neuropharmacology 1992;15(1 Pt B):60. [Google Scholar]
Bandelow 2004 {published data only}
- Bandelow B, Behnke K, Lenoir S, Hendriks GJ, Alkin T, Dombrowski A, et al. Sertraline versus paroxetine in the treatment of panic disorder: a multinational randomized double‐blind 15 week study. European Neuropsychopharmacology 2002;12(Suppl 3):S363. [Google Scholar]
- Bandelow B, Behnke K, Lenoir S, Hendriks GJ, Alkin T, Goebel C, et al. Sertraline versus paroxetine in the treatment of panic disorder: an acute, double‐blind noninferiority comparison. Journal of Clinical Psychiatry 2004;65(3):405‐13. [DOI] [PubMed] [Google Scholar]
Bystritsky 1995 {published data only}
- Bystritsky A, Rosen RM, Murphy KJ, Bohn P, Keys SA, Vapnik T. Double‐blind pilot trial of desipramine versus fluoxetine in panic patients. Anxiety 1994‐1995;1(6):287‐90. [DOI] [PubMed] [Google Scholar]
CNCPS 1992 {published data only}
- Albus M, Lecrubier Y, Maier W, Buller R, Rosenberg R, Hippius H. Drug treatment of panic disorder: early response to treatment as a predictor of final outcome. Acta Psychiatrica Scandinavica 1990;82(5):359‐65. [DOI] [PubMed] [Google Scholar]
- Albus M, Maier W, Shera D, Bech P. Consistencies and discrepancies in self‐ and observer‐rated anxiety scales. A comparison between the self‐ and observer‐rated Marks‐Sheehan scales. European Archives of Psychiatry and Clinical Neuroscience 1990;240(2):96‐102. [DOI] [PubMed] [Google Scholar]
- Andersch S, Hanson L, Hallstrom T. Panic disorder: a five‐year follow‐up study in 52 patients. European Journal of Psychiatry 1997;11(3):145‐55. [Google Scholar]
- Andersch S, Hetta J. A 15‐year follow‐up study of patients with panic disorder. European Psychiatry 2003;18(8):401‐08. [DOI] [PubMed] [Google Scholar]
- Andersch S, Rosenberg NK, Kullingsjö H, Ottosson JO, Bech P, Bruun‐Hansen J, et al. Efficacy and safety of alprazolam, imipramine and placebo in treating panic disorder. A Scandinavian multicenter study. Acta Psychiatrica Scandinavica. Supplementum 1991;365:18‐27. [DOI] [PubMed] [Google Scholar]
- Berlanga C, Canetti A, Chavez E, Fuente R, Carmen Lara M, Leon C, et al. Pharmacologic treatment of panic disorders: Comparative report on the efficacy and safety of alprazolam and imipramine in a controlled study [Tratamiento farmacologico de las crisis de angustia Reporte comparativo de la eficacia y seguridad del alprazolam y la imipramina en un estudio controlado]. Salud Mental 1991;14(1):1‐5. [Google Scholar]
- Buller R, Maier W, Goldenberg IM, Lavori PW, Benkert O. Chronology of panic and avoidance, age of onset in panic disorder, and prediction of treatment response. A report from the Cross‐National Collaborative Panic Study. European Archives of Psychiatry and Clinical Neuroscience 1991;240(3):163‐8. [DOI] [PubMed] [Google Scholar]
- Cassano GB, Toni C, Petracca A, Deltito J, Benkert O, Curtis G, et al. Adverse effects associated with the short‐term treatment of panic disorder with imipramine, alprazolam or placebo. European Neuropsychopharmacology 1994;4(1):47‐53. [DOI] [PubMed] [Google Scholar]
- Cross National Collaborative Panic Study Second Phase Investigators. Drug treatment of panic disorder: Comparative efficacy of alprazolam, imipramine, and placebo. British Journal of Psychiatry 1992;160:191‐202. [DOI] [PubMed] [Google Scholar]
- Curtis GC, Massana J, Udina C, Ayuso JL, Cassano GB, Perugi G. Maintenance drug therapy of panic disorder. Journal of Psychiatry Research 1993;27(Suppl 1):127‐42. [DOI] [PubMed] [Google Scholar]
- Deltito JA, Argyle N, Buller R, Nutzinger D, Ottosson JO, Brandon S, et al. The sequence of improvement of the symptoms encountered in patients with panic disorder. Comprehensive Psychiatry 1991;32(2):120‐9. [DOI] [PubMed] [Google Scholar]
- Deltito JA, Argyle N, Klerman GL. Patients with panic disorder unaccompanied by depression improve with alprazolam and imipramine treatment. Journal of Clinical Psychiatry 1991;52(3):121‐7. [PubMed] [Google Scholar]
- Green MA, Curtis GC. Personality disorders in panic patients: Response to termination of antipanic medication. Journal of Personality Disorders 1988;2(4):303‐14. [Google Scholar]
- Katschnig H, Amering M, Stolk JM, Klerman GL, Ballenger JC, Briggs A, et al. Long‐term follow‐up after a drug trial for panic disorder. British Journal of Psychiatry 1995;167(4):487‐94. [DOI] [PubMed] [Google Scholar]
- Klerman GL. Depression and panic anxiety: the effect of depressive co‐morbidity on response to drug treatment of patients with panic disorder and agoraphobia. Journal of Psychiatric Research 1990;24(Suppl 2):27‐41. [DOI] [PubMed] [Google Scholar]
- Klerman GL, Coleman JH, Purpura RP. The design and conduct of the Upjohn Cross‐National Collaborative Panic Study. Psychopharmacology Bulletin 1986;22(1):59‐64. [PubMed] [Google Scholar]
- Lavori PW, Dawson R, Shera D. A multiple imputation strategy for clinical trials with truncation of patient data. Statistics in Medicine 1995;14(17):1913‐25. [DOI] [PubMed] [Google Scholar]
- León CA, Arango MV, Arevalo W, Calvo A, Montoya A, León A. Comparison of the effect of alprazolam, imipramine and placebo in the treatment of panic disorders in Cali, Colombia [Comparacion del efecto del alprazolam, la imipramina y placebo en el tratamiento del trastorno de panico en Cali, Colombia]. Acta Psiquiatrica y Psicologica de America Latina 1990;36(1‐2):59‐72. [PubMed] [Google Scholar]
- Maier W, Albus M, Buller R, Nutzinger D, Shera D, Bech P. Self‐ and observer assessment in anxiolytic drug trials: a comparison of their validity. European Archives of Psychiatry and Clinical Neuroscience 1990;240(2):103‐8. [DOI] [PubMed] [Google Scholar]
- Maier W, Roth SM, Argyle N, Buller R, Lavori P, Brandon S, et al. Avoidance behaviour: a predictor of the efficacy of pharmacotherapy in panic disorder?. European Archives of Psychiatry and Clinical Neuroscience 1991;241(3):151‐8. [DOI] [PubMed] [Google Scholar]
- Maier WA, Roth M, Buller R, Argyle N, Rosenberg R, Sydney B, et al. Agoraphobia in panic disorder: An indicator of the severity of panic disorder or a distinct diagnostic entity?. Psychiatric Annals 1991;21(6):374‐81. [Google Scholar]
- Rifkin A. The sequence of improvement of the symptoms encountered in patients with panic disorder. Comprehensive Psychiatry 1991;32(6):559‐60. [DOI] [PubMed] [Google Scholar]
- Rosenberg NK, Mellergård M, Rosenberg R, Beck P, Ottosson JO. Characteristics of panic disorder patients responding to placebo. Acta Psychiatrica Scandinavica Supplementum 1991;365:33‐8. [DOI] [PubMed] [Google Scholar]
- Rosenberg R, Bech P, Mellergård M, Ottosson JO. Alprazolam, imipramine and placebo treatment of panic disorder: predicting therapeutic response. Acta Psychiatrica Scandinavica. Supplementum 1991;365:46‐52. [DOI] [PubMed] [Google Scholar]
- Swoboda H, Amering M, Windhaber J, Katschnig H. The long‐term course of panic disorder‐‐an 11 year follow‐up. Journal of Anxiety Disorders 2003;17(2):223‐32. [DOI] [PubMed] [Google Scholar]
Den Boer 1988 {published data only}
- Boer JA, Westenberg HGM. Effect of a serotonin and noradrenaline uptake inhibitor in panic disorder; a double‐blind comparative study with fluvoxamine and maprotiline. International Clinical Psychopharmacology 1988;3(1):59‐74. [DOI] [PubMed] [Google Scholar]
Den Boer 1990 {published data only}
- Boer JA, Westenberg HGM. Serotonin function in panic disorder: a double blind placebo controlled study with fluvoxamine and ritanserin. Psychopharmacology 1990;102:85‐94. [DOI] [PubMed] [Google Scholar]
- Westenberg HG, Boer JA. Selective monoamine uptake inhibitors and a serotonin antagonist in the treatment of panic disorder. Psychopharmacology Bulletin 1989;25(1):119‐23. [PubMed] [Google Scholar]
Garvey 1989 {published data only}
- Garvey M, Noyes R Jr, Cook B, Tollefson G. The relationship of panic disorder and its treatment outcome to 24‐hour urinary MHPG levels. Psychiatry Research 1989;30(1):53‐61. [DOI] [PubMed] [Google Scholar]
Gentil 1993 {published data only}
- Gentil V, Lotufo‐Neto F, Andrade L, Cordás T, Bernik M, Ramos R, et al. Clomipramine, a better reference drug for panic/agoraphobia. I. Effectiveness comparison with imipramine. Journal of Psychopharmacology 1993;7(4):316‐24. [DOI] [PubMed] [Google Scholar]
- Marcourakis T, Gorenstein C, Gentil V. Clomipramine, a better reference drug for panic/agoraphobia. II. Psychomotor and cognitive effects. Journal of Psychopharmacology 1993;7(4):325‐30. [DOI] [PubMed] [Google Scholar]
GSK‐29060/1 {unpublished data only}
- GSK. A double‐blind, multicenter, flexible‐dose study of paroxetine, alprazolam and placebo in the treatment of panic disorder. GSK Clinical Studies Register [http://www.gsk‐clinicalstudyregister.com/].
GSK‐29060/525 {unpublished data only}
- GSK. A double blind, multicenter randomized drug‐controlled study to assess the efficacy and tolerance of paroxetine compared with clomipramine in treatment of panic disorder. GSK Clinical Studies Register [http://www.gsk‐clinicalstudyregister.com/].
Holland 1999 {published data only}
- Holland R, Musch B, Hindmarch I. Specific effects of benzodiazepines and tricyclic antidepressants in panic disorder: comparisons of clomipramine with alprazolam SR and adinazolam SR. Human Psychopharmacology Clinical Experimental 1999;14:119‐24. [Google Scholar]
Krueger 1999 {published data only}
- Krueger MB, Dahl AA. The efficacy and safety of moclobemide compared to clomipramine in the treatment of panic disorder. European Archives of Psychiatry and Clinical Neuroscience 1999;249(Suppl 1):S19‐S24. [DOI] [PubMed] [Google Scholar]
Lecrubier 1997 {published data only}
- GlaxoSmithKline. A double‐blind placebo controlled comparative study of paroxetine and clomipramine in the treatment of panic disorder. GSK‐ClinicalStudy Register (www.gsk‐clinicalstudyregister.com) 1993/11/12.
- Lecrubier Y, Bakker A, Dunbar G, Judge R and the Collaborative Panic Study Investigators. A comparison of paroxetine, clomipramine and placebo in the treatment of panic disorder. Acta Psychiatrica Scandinavica 1997;95:145‐52. [DOI] [PubMed] [Google Scholar]
- Lecrubier Y, Judge R and the Collaborative Paroxetine Panic Study Investigators. Long‐term evaluation of paroxetine, clomipramine and placebo in panic disorder. Acta Psychiatrica Scandinavica 1997;95:153‐60. [DOI] [PubMed] [Google Scholar]
Lepola 1990 {published data only}
- Lepola U, Heikkinen H, Rimon R, Riekkinen P. Clinical evaluation of alprazolam in patients with panic disorder; a double‐blind comparison with imipramine. Human Psychopharmacology 1990;5:159‐63. [Google Scholar]
- Rimon R. Spectral electroencephalogram and clinical follow‐up during alprazolam and imipramine treatment in panic disorder. Nordic Journal of Psychiatry 1998;52(3):245‐9. [Google Scholar]
Meco 1989 {published data only}
- Meco G, Capriani C, Bonifati U. Etizolam: a new therapeutic possibility in the treatment of panic disorder. Advances in Therapy 1989;6(4):196‐206. [Google Scholar]
Nair 1996 {published data only}
- Bakish D, Hooper CL, Filteau MJ, Charbonneau Y, Fraser G, West DL, et al. A double‐blind placebo‐controlled trial comparing fluvoxamine and imipramine in the treatment of panic disorder with or without agoraphobia. Psychopharmacology Bulletin 1996;32(1):135‐41. [PubMed] [Google Scholar]
- Nair NP, Bakish D, Saxena B, Amin M, Schwartz G, West TE. Comparison of fluvoxamine, imipramine, and placebo in the treatment of outpatients with panic disorder. Anxiety 1996;2(4):192‐8. [DOI] [PubMed] [Google Scholar]
Noyes 1996 {published data only}
- Coryell W, Noyes R Jr, Schlechte J. The significance of HPA axis disturbance in panic disorder. Biological Psychiatry 1989;25(8):989‐1002. [DOI] [PubMed] [Google Scholar]
- Lopez AL, Kathol RG, Noyes R Jr. Reduction in urinary free cortisol during benzodiazepine treatment of panic disorder. Psychoneuroendocrinology 1990;15(1):23‐8. [DOI] [PubMed] [Google Scholar]
- Noyes R Jr, Burrows GD, Reich JH, Judd FK, Garvey MJ, Norman TR, et al. Diazepam versus alprazolam for the treatment of panic disorder. Journal of Clinical Psychiatry 1996;57(8):349‐55. [PubMed] [Google Scholar]
- Noyes R Jr, Garvey MJ, Cook B, Suelzer M. Controlled discontinuation of benzodiazepine treatment for patients with panic disorder. American Journal of Psychiatry 1991;148(4):517‐23. [DOI] [PubMed] [Google Scholar]
Pfizer 2008 {unpublished data only}
- Pfizer. A randomized, double‐blind, multicenter study of sertraline compared with paroxetine In the treatment of panic disorder. http://clinicaltrials.gov/show/NCT00677352 2008.
Pollack 2007a {published data only}
- Pollack M, Mangano R, Entsuah R, Tzanis E, Simon NM. A randomized controlled trial of venlafaxine ER and paroxetine in the treatment of outpatients with panic disorder. Psychopharmacology 2007;194:233‐42. [DOI] [PubMed] [Google Scholar]
- Pollack M, Whitaker T, Mangano R, Gao B. A comparison of venlafaxine XR and paroxetine in the treatment of outpatients with panic disorder. ACNP 2004 Annual Meeting S201‐S202.
Pollack 2007b {published data only}
- Pollack MH, Lepola U, Koponen H, Simon NM, Worthington JJ, Emilien G, et al. A double‐blind study of the efficacy of venlafaxine extended‐release, paroxetine and placebo in the treatment of panic disorder. Depression and Anxiety 2007;24:1‐14. [DOI] [PubMed] [Google Scholar]
Ribeiro 2001 {published data only}
- Ribeiro L, Busnello JV, Kauer‐Sant'Anna M, Madruga M, Quevedo J, Busnello EAD, et al. Mirtazapine versus fluoxetine in the treatment of panic disorder. Brazilian Journal of Medical and Biological Research 2001;34:1303‐7. [DOI] [PubMed] [Google Scholar]
Sasson 1999 {published data only}
- Sasson Y, Iancu I, Fux M, Taub M, Dannon P, Zohar J. A double‐blind crossover comparison of clomipramine and desipramine in the treatment of panic disorder. European Neuropsychopharmacology 1999;9:191‐6. [DOI] [PubMed] [Google Scholar]
Schweizer 1993 {published data only}
- Rickels K, Schweizer E. Panic disorder: Long‐term pharmacotherapy and discontinuation. Journal of Clinical Psychopharmacology 1998;18(6 Suppl 2):12‐8. [DOI] [PubMed] [Google Scholar]
- Rickels K, Schweizer E, Weiss S, Zavodnick S. Maintenance drug treatment for panic disorder. II. Short‐ and long‐term outcome after drug taper. Archives of General Psychiatry 1993;50:61‐8. [DOI] [PubMed] [Google Scholar]
- Schweizer E, Rickels K, Weiss S, Zavodnick S. Maintenance drug treatment of panic disorder. I. Results of a prospective, placebo‐controlled comparison of alprazolam and imipramine. Archives of General Psychiatry 1993;50:51‐60. [DOI] [PubMed] [Google Scholar]
Sheikh 1999 {published data only}
- Sheikh JI, Swales PJ. Treatment of panic disorder in older adults: a pilot study comparison of alprazolam, imipramine, and placebo. International Journal of Psychiatry in Medicine 1999;29(1):107‐17. [DOI] [PubMed] [Google Scholar]
Stahl 2003 {published data only}
- Bandelow B, Stein DJ, Dolberg OT, Andersen HF, Baldwin DS. Improvement of quality of life in panic disorder with escitalopram, citalopram, or placebo. Pharmacopsychiatry 2007;40:152‐6. [DOI] [PubMed] [Google Scholar]
- Forest Laboratories. Flexible‐dose comparison of the safety and efficacy of Lu 26‐054 (escitalopram), citalopram and placebo in the treatment of panic disorder. Forest Laboratories Clinical Study Register [www.forestclinicaltrials.com].
- Stahl S, Gergel I, Li D. Escitalopram in the treatment of panic disorder: a randomized, double‐blind, placebo‐controlled trial. Journal of Clinical Psychiatry 2003;64:1322‐7. [DOI] [PubMed] [Google Scholar]
Taylor 1990 {published data only}
- Clark DB, Taylor CB, Roth WT, Hayward C, Ehlers A, Margraf J, et al. Surreptitious drug use by patients in a panic disorder study. American Journal of Psychiatry 1990;147(4):507‐9. [DOI] [PubMed] [Google Scholar]
- Margraf J, Ehlers A, Roth WT, Clark DB, Sheikh J, Agras WS, et al. How "blind" are double‐blind studies?. Journal of Consulting and Clinical Psychology 1991;59(1):184‐7. [DOI] [PubMed] [Google Scholar]
- Taylor CB, Hayward C, King R, Ehlers A, Margraf J, Maddock R, et al. Cardiovascular and symptomatic reduction effects of alprazolam and imipramine in patients with panic disorder: results of a double‐blind, placebo‐controlled trial. Journal of Clinical Psychopharmacology 1990;10(2):112‐8. [DOI] [PubMed] [Google Scholar]
Tesar 1991 {published data only}
- Fava M, Rosenbaum JF, MacLaughlin RA, Tesar GE, Pollack MH, Cohen LS, et al. Dehydroepiandrosterone‐sulfate/cortisol ratio in panic disorder. Psychiatry Research 1989;28(3):345‐50. [DOI] [PubMed] [Google Scholar]
- Labbate LA, Pollack MH, Otto MW, Tesar GM, Rosenbaum JF. The relationship of alprazolam and clonazepam dose to steady‐state concentration in plasma. Journal of Clinical Psychopharmacology 1994;14(4):274‐6. [PubMed] [Google Scholar]
- Pollack MH, Otto MW, Tesar GE, Cohen LS, Meltzer‐Brody S, Rosenbaum JF. Long‐term outcome after acute treatment with alprazolam or clonazepam for panic disorder. Journal of Clinical Psychopharmacology 1993;13(4):257‐63. [PubMed] [Google Scholar]
- Tesar GE, Rosenbaum JF, Pollack MH, Herman JB, Sachs GS, Mahoney EM, et al. Clonazepam versus alprazolam in the treatment of panic disorder: interim analysis of data from a prospective, double‐blind, placebo‐controlled trial. Journal of Clinical Psychiatry 1987;48(Suppl 10):16‐21. [PubMed] [Google Scholar]
- Tesar GE, Rosenbaum JF, Pollack MH, Otto MW, Sachs GS, Herman JB, et al. Double‐blind, placebo‐controlled comparison of clonazepam and alprazolam for panic disorder. Journal of Clinical Psychiatry 1991;52(2):69‐76. [PubMed] [Google Scholar]
Tiller 1999 {published data only}
- Tiller JWG, Bouwer C, Behnke K. Moclobemide and fluoxetine for panic disorder. European Archives of Psychiatry and Clinical Neuroscience 1999;249(Suppl1):S7‐S10. [DOI] [PubMed] [Google Scholar]
Uhlenhuth 1989 {published data only}
- Uhlenhuth EH, Matuzas W, Glass RM, Easton C. Response of panic disorder to fixed doses of alprazolam or imipramine. Journal of Affective Disorders 1989;17(3):261‐70. [DOI] [PubMed] [Google Scholar]
Van Vliet 1996 {published data only}
- Slaap BR, Vliet IM, Westenberg HGM, Boer JA. Phobic symptoms as predictors of nonresponse to drug therapy in panic disorder patients (a preliminary report). Journal of Affective Disorders 1995;33(1):31‐8. [DOI] [PubMed] [Google Scholar]
- Vliet IM, Boer JA, Westenberg HGM, Slaap BR. A double‐blind comparative study of brofaromine and fluvoxamine in outpatients with panic disorder. Journal of Clinical Psychopharmacology 1996;16(4):299‐306. [DOI] [PubMed] [Google Scholar]
Wade 1997 {published data only}
- Leinonen E, Lepola U, Koponen H, Turtonen J, Wade A, Lehto H. Citalopram controls phobic symptoms in patients with panic disorder: randomized controlled trial. Journal of Psychiatry and Neuroscience 2000;25(1):24‐32. [PMC free article] [PubMed] [Google Scholar]
- Lepola U, Wade AG, Leinonen EV, Koponen HJ, Frazer J, Sjoedin I, et al. A controlled, prospective, 1‐year trial of citalopram in the treatment of panic disorder. Journal of Clinical Psychiatry 1998;59:528‐34. [DOI] [PubMed] [Google Scholar]
- Wade A, Overe KF, Lemming O. Weight monitoring during two long‐term trials of citalopram. European Neuropsychopharmacology 1999;9 Suppl 5:S221. [Google Scholar]
- Wade AG, Lepola U, Koponen HJ, Pedersen V, Pedersen T. The effect of citalopram in panic disorder. British Journal of Psychiatry 1997;170:549‐53. [DOI] [PubMed] [Google Scholar]
Westenberg 1989 {published data only}
- Westenberg HG, Boer JA. Selective monoamine uptake inhibitors and a serotonin antagonist in the treatment of panic disorder. Psychopharmacology Bulletin 1989;25(1):119‐23. [PubMed] [Google Scholar]
Zhang 2000 {published data only}
- Zhang HY, Zhao QP, Ma C. Paroxetine versus clomipramine for the treatment of panic disorders: a double‐blind randomised study. Chinese Mental Health Journal 2000;14(6):410‐3. [Google Scholar]
References to studies excluded from this review
Bakish 1994 {published data only}
- Bakish D. The use of the reversible monoamine oxidase‐A inhibitor brofaromine in social phobia complicated by panic disorder with or without agoraphobia. Journal of Clinical Psychopharmacology 1994;14(1):74‐5. [DOI] [PubMed] [Google Scholar]
Baldini Rossi 2000 {published data only}
- Baldini Rossi NA, Cassano PA, Dell'Osso LA, Ciapparelli AA, Bandettini di Poggio AA, Russo AA, et al. Depression comorbid with panic disorder or other anxiety disorders: a 16‐week multicentre randomised parallel‐group trial of moclobemide versus paroxetine. European Neuropsychopharmacology 2000;10(Suppl 2):S52‐S53. [Google Scholar]
Balon 1991 {published data only}
- Balon R, Pohl R, Yeragani VK, Ramesh C, Glitz DA. The changes of thyroid hormone during pharmacological treatment of panic disorder patients. Progress in Neuropsychopharmacology and Biological Psychiatry 1991;15(5):595‐600. [DOI] [PubMed] [Google Scholar]
Balon 1993 {published data only}
- Balon R, Yeragani VK, Pohl R, Merlos B, Sherwood P. Changes in appetite and weight during the pharmacological treatment of patients with panic disorder. Canadian Journal of Psychiatry 1993;38(1):19‐22. [DOI] [PubMed] [Google Scholar]
Bystritsky 1990 {published data only}
- Bystritsky AA, Pasnau RO. Initial reaction and subsequent response to antidepressants in panic patients. American Journal of Psychiatry 1990;147(11):1575. [DOI] [PubMed] [Google Scholar]
Charney 1986 {published data only}
- Charney DS, Woods SW, Goodman WK, Rifkin B, Kinch M, Aiken B, et al. Drug treatment of panic disorder: the comparative efficacy of imipramine, alprazolam, and trazodone. Journal of Clinical Psychiatry 1986;47(12):580‐6. [PubMed] [Google Scholar]
Davis 1981 {published data only}
- Davis JM, Nasr S, Spira N, Vogel C. Anxiety: differential diagnosis and treatment from a biologic perspective. Journal of Clinical Psychiatry 1981;42(11 pt 2):4‐14. [PubMed] [Google Scholar]
de Jonghe 1989 {published data only}
- Jonghe F, Swinkels J, Tuynman‐Qua H, Jonkers F. A comparative study of suriclone, lorazepam and placebo in anxiety disorder. Pharmacopsychiatry 1989;22(6):266‐71. [DOI] [PubMed] [Google Scholar]
Dell'Erba 2006 {published data only}
- Dell'Erba GL, Nuzzo E. Effectiveness treatment for panic and agoraphobia in comparison between drug and specialized psychological treatment [Il trattamento efficace nella pratica del disturbo di panico e agorafobia in una valutazione comparativa tra psicofarmacologia e trattamento psicologico specifico]. Rivista di Psichiatria 2006;41(6):397‐403. [Google Scholar]
den Boer 1987 {published data only}
- Boer JA, Westenberg HG, Kamerbeek WD, Verhoeven WM, Kahn RS. Effect of serotonin uptake inhibitors in anxiety disorders; a double‐blind comparison of clomipramine and fluvoxamine. International Clinical Psychopharmacology 1987;2(1):21‐32. [DOI] [PubMed] [Google Scholar]
Dunner 1986 {published data only}
- Dunner DL, Ishiki D, Avery DH, Wilson LG, Hyde TS. Effect of alprazolam and diazepam on anxiety and panic attacks in panic disorder: a controlled study. Journal of Clinical Psychiatry 1986;47(9):458‐60. [PubMed] [Google Scholar]
Dyukova 1992 {published data only}
- Dyukova GM, Shepeleva IP, Vorob'eva OV. Treatment of negative crises (panic attacks). Neuroscience and Behavioral Physiology 1992;22(4):343‐5. [DOI] [PubMed] [Google Scholar]
Evans 1986 {published data only}
- Evans L, Kenardy J, Schneider P, Hoey H. Effect of a selective serotonin uptake inhibitor in agoraphobia with panic attacks. A double‐blind comparison of zimeldine, imipramine and placebo. Acta Psychiatrica Scandinavica 1986;73(1):49‐53. [DOI] [PubMed] [Google Scholar]
Fahy 1992 {published data only}
- Fahy TJ, O'Rourke D, Brophy J, Schazmann W, Sciascia S. Clomipramine and lofepramine in DSM III‐R panic disorder: a placebo controlled trial. Clinical Neuropharmacology 1992;15(1 pt B):94. [DOI] [PubMed] [Google Scholar]
- Fahy TJ, O'Rourke D, Brophy J, Schazmann W, Sciascia S. The Galway Study of Panic Disorder. I: Clomipramine and lofepramine in DSM III‐R panic disorder: a placebo controlled trial. Journal of Affective Disorders 1992;25(1):63‐75. [DOI] [PubMed] [Google Scholar]
Franulic 1989 {published data only}
- Franulic AM, Sanchez GV, O'Ryan FG, Gladic DM, Barahona MC, Gloger SK. Clomipramine and diazepam plasma levels in panic disorder and agoraphobia. Preliminary findings [Concentraciones plasmaticas de clomipramina y diazepam en Desorden de Panico y Agoraphobia. Un estudio preliminar]. Revista Chilena de Neuro‐Psiquiatria 1989;27:101‐10. [Google Scholar]
Furukawa 2009 {published data only}
- Furukawa TA, Katherine Shear M, Barlow DH, Gorman JM, Woods SW, Money R, et al. Evidence‐based guidelines for interpretation of the Panic Disorder Severity Scale. Depression and Anxiety 2009;26(10):922‐9. [DOI] [PMC free article] [PubMed] [Google Scholar]
Grilo 1998 {published data only}
- Grilo CM, Money R, Barlow DH, Goddard AW, Gorman JM, Hofmann SG, et al. Pretreatment patient factors predicting attrition from a multicenter randomized controlled treatment study for panic disorder. Comprehensive Psychiatry 1998;39(6):323‐32. [DOI] [PubMed] [Google Scholar]
Keller 1993 {published data only}
- Keller MB, Lavori PW, Goldenberg IM, Baker LA, Pollack MH, Sachs GS, et al. Influence of depression on the treatment of panic disorder with imipramine, alprazolam and placebo. Journal of Affective Disorders 1993;28(1):27‐38. [DOI] [PubMed] [Google Scholar]
- Leon AC, Shear MK, Portera L, Klerman GL. Effect size as a measure of symptom‐specific drug change in clinical trials. Psychopharmacology Bulletin. 1993;29(2):163‐7. [PubMed] [Google Scholar]
- Pollack MH, Otto MW, Sachs GS, Leon A, Shear MK, Deltito JA, et al. Anxiety psychopathology predictive of outcome in patients with panic disorder and depression treated with imipramine, alprazolam and placebo. Journal of Affective Disorders 1994;30(4):273‐81. [DOI] [PubMed] [Google Scholar]
- Shear MK, Leon AC, Pollack MH, Rosenbaum JF, Keller MB. Pattern of placebo response in panic disorder. Psychopharmacology Bulletin 1995;31(2):273‐8. [PubMed] [Google Scholar]
Lepola 1989 {published data only}
- Lepola U, Jolkkonen J, Rimón R, Riekkinen P. Long‐term effects of alprazolam and imipramine on cerebrospinal fluid monoamine metabolites and neuropeptides in panic disorder. Neuropsychobiology 1989;21(4):182‐6. [DOI] [PubMed] [Google Scholar]
Mavissakalian 2003 {published data only}
- Mavissakalian MR. Imipramine vs. sertraline in panic disorder: 24‐week treatment completers. Annals of Clinical Psychiatry 2003;15(3):171‐80. [DOI] [PubMed] [Google Scholar]
McHugh 2007 {published data only}
- McHugh RK, Otto MW, Barlow DH, Gorman JM, Shear MK, Woods SW. Cost‐efficacy of individual and combined treatments for panic disorder. Journal of Clinical Psychiatry 2007;68(7):1038‐44. [DOI] [PubMed] [Google Scholar]
Miretzky 1992 {published data only}
- Miretzky A, Horn R, Koehler K, Moeller HJ. Combination of alprazolam, antidepressive drugs and cognitive behavior therapy in the treatment of panic disorder. Clinical Neuropharmacology 1992;15(1 pt B):536. [Google Scholar]
Nair 1982 {published data only}
- Nair NP, Singh AN, Lapierre Y, Saxena BM, Nestoros JN, Schwartz G. Ketazolam in the treatment of anxiety: a standard and placebo controlled study. Current Therapeutic Research, Clinical & Experimental 1982;31(5):679‐91. [Google Scholar]
Nardi 2011 {published data only}
- Nardi AE, Freire RC, Mochcovitch MD, Amrein R, Levitan MN, King AL, et al. A randomized, naturalistic, parallel‐group study for the long‐term treatment of panic disorder with clonazepam or paroxetine. Journal of Clinical Psychopharmacology 2012;32(1):120‐6. [DOI] [PubMed] [Google Scholar]
- Nardi AE, Valença AM, Freire RC, Amrein R, Sardinha A, Levitan MN, et al. Randomized, open naturalistic, acute treatment of panic disorder with clonazepam or paroxetine. Journal of Clinical Psychopharmacology 2011;31(2):259‐61. [DOI] [PubMed] [Google Scholar]
- Nardi AE, Valença AM, Freire RC, Mochcovitch MD, Amrein R, Sardinha A, et al. Psychopharmacotherapy of panic disorder: 8‐week randomized trial with clonazepam and paroxetine. Brazilian Journal of Medical and Biological Research 2011;44(4):366‐73. [DOI] [PubMed] [Google Scholar]
Pareek 2014 {published data only}
- Ipca Laboratories Ltd. Comparative Evaluation of Efficacy and Safety of Clonazepam‐CR and Conventional Clonazepam in Patients with Panic Disorder. http://www.ctri.nic.in.
Pfizer 2002 {unpublished data only}
- Pfizer. A double‐blind, placebo‐controlled, parallel‐group comparison of venlafaxine extended‐release capsules and paroxetine in outpatients with panic disorder. http://clinicaltrials.gov/show/NCT00044772 2002.
Pfizer 2005 {unpublished data only}
- Pfizer. Pilot study of venlafaxine extended release (XR) in the treatment of panic disorder (PD) in comparison to paroxetine. http://clinicaltrials.gov/show/NCT00195598 2005.
Pohl 1989 {published data only}
- Pohl R, Rickels K, Charney D. Clinical results on the use of lorazepam to treat panic attacks [Risultati clinici sull'uso del lorazepam nel disturbo da attacchi di panico]. Rivista di Psichiatria 1989;24(2):99‐100. [Google Scholar]
- Schweizer E, Fox I, Case G, Rickels K. Lorazepam vs. alprazolam in the treatment of panic disorder. Psychopharmacol Bulletin 1988;24(2):224‐7. [PubMed] [Google Scholar]
- Schweizer E, Pohl R, Balon R, Fox I, Rickels K, Yeragani VK. Lorazepam vs. alprazolam in the treatment of panic disorder. Pharmacopsychiatry 1990;23(2):90‐3. [DOI] [PubMed] [Google Scholar]
Pollack 2003 {published data only}
- Pollack MH, Simon NM, Worthington JJ, Doyle AL, Peters P, Toshkov F, et al. Combined paroxetine and clonazepam treatment strategies compared to paroxetine monotherapy for panic disorder. Journal of Psychopharmacology 2003;17(3):276‐82. [DOI] [PubMed] [Google Scholar]
Pyke 1989 {published data only}
- Pyke RE, Greenberg HS. Double‐blind comparison of alprazolam and adinazolam for panic and phobic disorders. Journal of Clinical Psychopharmacology 1989;9(1):15‐21. [PubMed] [Google Scholar]
Raffaele 2002 {published data only}
- Raffaele R, Vecchio I, Malaguarnera M, Rampello L, Ruggieri M, Nicoletti F. Therapy of panic attacks in the elderly. Archives of Gerontology and Geriatrics. Supplement 2002;8:295‐301. [DOI] [PubMed] [Google Scholar]
Roll 2004 {published data only}
- Roll D, Ray SE, Marcus SM, Passarelli V, Money R, Barlow DH, et al. Independent evaluator knowledge of treatment in a multicenter comparative treatment study of panic disorder. Neuropsychopharmacology 2004;29(3):612‐8. [DOI] [PubMed] [Google Scholar]
Roy‐Byrne 2001 {published data only}
- Roy‐Byrne PP, Katon W, Cowley DS, Russo J. A randomized effectiveness trial of collaborative care for patients with panic disorder in primary care. Archives of General Psychiatry 2001;58(9):869‐76. [DOI] [PubMed] [Google Scholar]
Sheehan 1980 {published data only}
- Sheehan DV, Ballenger J, Jacobsen G. Treatment of endogenous anxiety with phobic, hysterical, and hypochondriacal symptoms. Archives of General Psychiatry 1980;37(1):51‐9. [DOI] [PubMed] [Google Scholar]
Surman 1986 {published data only}
- Surman OS, Williams J, Sheehan DV, Strom TB, Jones KJ, Coleman J. Immunological response to stress in agoraphobia and panic attacks. Biological Psychiatry 1986;21(8‐9):768‐74. [DOI] [PubMed] [Google Scholar]
Svebak 1990 {published data only}
- Svebak S, Cameron A, Levander S. Clonazepam and imipramine in the treatment of panic attacks: a double‐blind comparison of efficacy and side effects. Journal of Clinical Psychiatry 1990;51(Suppl 5):14‐17. [PubMed] [Google Scholar]
Tsutsui 2000 {published data only}
- Tsutsui S. Clinical evaluation of paroxetine HCl, a selective serotonin reuptake inhibitor, in the treatment of panic disorder: Phase III double‐blind, parallel group study [選択的セロト.ニン再取り込み阻害薬塩酸パロキセチンのパニック障害 対する臨床評価]. Japanese Pharmacology & Therapeutics 2000;28(Suppl 1):S295‐S314. [Google Scholar]
Tyrer 1988 {published data only}
- Tyrer P, Seivewright N, Ferguson B, Murphy S, Darling C, Brothwell J, et al. The Nottingham Study of Neurotic Disorder: relationship between personality status and symptoms. Psychological Medicine 1990;20(2):423‐31. [DOI] [PubMed] [Google Scholar]
- Tyrer P, Seivewright N, Ferguson B, Murphy S, Johnson AL. The Nottingham study of neurotic disorder. Effect of personality status on response to drug treatment, cognitive therapy and self‐help over two years. British Journal of Psychiatry 1993;162:219‐26. [DOI] [PubMed] [Google Scholar]
- Tyrer P, Seivewright N, Murphy S, Ferguson B, Kingdon D, Barczak P, et al. The Nottingham study of neurotic disorder: comparison of drug and psychological treatments. Lancet 1988;2(8605):235‐40. [DOI] [PubMed] [Google Scholar]
van Apeldoorn 2008 {published data only}
- Apeldoorn FJ, Hout WJ, Mersch PP, Huisman M, Slaap BR, Hale WW 3rd, et al. Is a combined therapy more effective than either CBT or SSRI alone? Results of a multicenter trial on panic disorder with or without agoraphobia. Acta Psychiatrica Scandinavica 2008;117(4):260‐70. [DOI] [PubMed] [Google Scholar]
Yang 2005 {published data only}
- Yang H, Yu C, Gao H. The control study of mirtazapine in treating patients with panic disorder. Medical Journal of Chinese People Health 2005;17(3):133‐5. [Google Scholar]
Yang 2006 {published data only}
- Yang H, Gao H, Yu C. Effect of citalopram in the treatment of panic disorder. Shandong Archives of Psychiatry 2006;19(2):186‐7. [Google Scholar]
Yeragani 1992 {published data only}
- Yeragani VK, Pohl R, Balon R, Ramesh C, Weinberg P. Imipramine‐induced jitteriness and decreased serum iron levels. Neuropsychobiology 1992;25(1):8‐10. [DOI] [PubMed] [Google Scholar]
Zajecka 1996 {published data only}
- Zajecka JM. The effect of nefazodone on comorbid anxiety symptoms associated with depression: experience in family practice and psychiatric outpatient settings. Journal of Clinical Psychiatry 1996;57(Suppl 2):10‐4. [PubMed] [Google Scholar]
References to studies awaiting assessment
Minutentag 2001 {published data only}
- Minutentag NW, Bernik MA. Comparative study of citalopram and imipramine in the treatment of panic disorder [Estudo comparativo entre o citalopram e a imiprimina no tratamento do transtorno de panico]. Revista de Psiquiatria Clinica 2001;28(2):44‐51. [Google Scholar]
Additional references
Als‐Nielsen 2003
- Als‐Nielsen B, Chen W, Gluud C, Kjaergard LL. Association of funding and conclusions in randomized drug trials: a reflection of treatment effect or adverse events?. JAMA 2003;290:921‐8. [DOI] [PubMed] [Google Scholar]
Altman 1996
- Altman DG, Bland MJ. Detecting skewness for summary information. BMJ 1996;313:1200. [DOI] [PMC free article] [PubMed] [Google Scholar]
APA 1980
- American Psychiatric Association. Diagnostic and Statistical Manual of Mental Disorders (DSM‐III). Third Edition. Washington, DC: American Psychiatric Association, 1980. [Google Scholar]
APA 1994
- American Psychiatric Association. Diagnostic and Statistical Manual of Mental Disorders (DSM‐IV). Fourth. Washington, DC: American Psychiatric Association, 1994. [Google Scholar]
APA 2009
- American Psychiatric Association. Practice Guideline for the Treatment of Patients With Panic Disorder. Second Edition. 2009. Available from http://psychiatryonline.org/pb/assets/raw/sitewide/practice_guidelines/guidelines/panicdisorder.pdf.
APA 2013a
- American Psychiatric Association. Diagnostic and Statistical Manual of Mental Disorders (DSM‐5). Fifth. Washington, DC: American Psychiatric Association, 2013. [Google Scholar]
APA 2013b
- American Psychiatric Association. Highlights of Changes from DSM‐IV‐TR to DSM‐5. 2013. Available from http://www.dsm5.org/Documents/changes%20from%20dsm‐iv‐tr%20to%20dsm‐5.pdf.
Bakker 2002
- Bakker A, Balkom AJ, Spinhoven P. SSRIs vs. TCAs in the treatment of panic disorder: a meta‐analysis. Acta Psychiatrica Scandinavica 2002;106:163‐7. [DOI] [PubMed] [Google Scholar]
Ballenger 1998
- Ballenger JC, Davidson JR, Lecrubier Y, Nutt DJ, Baldwin DS, Boer JA, et al. Consensus statement on panic disorder from the International Consensus Group on Depression and Anxiety. Journal of Clinical Psychiatry 1998;59(Suppl 8):47‐54. [PubMed] [Google Scholar]
Bandelow 2006
- Bandelow B, Baldwin DS, Dolberg OT, Andersen HF, Stein DJ. What is the threshold for symptomatic response and remission for major depressive disorder, panic disorder, social anxiety disorder, and generalized anxiety disorder?. Journal of Clinical Psychiatry 2006;67:1428‐34. [DOI] [PubMed] [Google Scholar]
BAP 2005
- Baldwin DS, Anderson IM, Nutt DJ, Bandelow B, Bond A, Davidson JR, et al. Evidence‐based guidelines for the pharmacological treatment of anxiety disorders: recommendations from the British Association for Psychopharmacology. Journal of Psychopharmacology 2005;19:567‐96. [DOI] [PubMed] [Google Scholar]
Batelaan 2012
- Batelaan NM, Balkom AJ, Stein DJ. Evidence‐based pharmacotherapy of panic disorder: an update. International Journal of Neuropsychopharmacology 2012;15(3):403‐15. [DOI] [PubMed] [Google Scholar]
Bhandari 2004
- Bhandari M, Busse JW, Jackowski D, Montori VM, Schünemann H, Sprague S, et al. Association between industry funding and statistically significant pro‐industry findings in medical and surgical randomized trials. Canadian Medical Association Journal 2004;170:477‐80. [PMC free article] [PubMed] [Google Scholar]
Bijl 1998
- Bijl RV, Ravelli A, Zessen G. Prevalence of psychiatric disorder in the general population: results of The Netherlands Mental Health Survey and Incidence Study (NEMESIS). Social Psychiatry and Psychiatric Epidemiology 1998;33:587‐95. [DOI] [PubMed] [Google Scholar]
Boissel 1999
- Boissel JP, Cucherat M, Li W, Chatellier G, Gueyffier F, Buyse M, et al. The problem of therapeutic efficacy indices. Comparison of the indices and their use. Therapie 1999;54:405‐11. [PubMed] [Google Scholar]
Briley 1993
- Briley M, Moret C. Neurobiological mechanisms involved in antidepressant therapies. Clinical Neuropharmacology 1993;16:387‐400. [DOI] [PubMed] [Google Scholar]
Bruce 2003
- Bruce SE, Vasile RG, Goisman RM, Salzman C, Spencer M, Machan JT, et al. Are benzodiazepines still the medication of choice for patients with panic disorder with or without agoraphobia?. American Journal of Psychiatry 2003;160:1432‐8. [DOI] [PubMed] [Google Scholar]
Buchkowsky 2004
- Buchkowsky SS, Jewesson PJ. Industry sponsorship and authorship of clinical trials over 20 years. Annals of Pharmacotherapy 2004;38:579‐85. [DOI] [PubMed] [Google Scholar]
Buscemi 2006
- Buscemi N, Hartling L, Vandermeer B, Tjosvold L, Klassen TP. Single data extraction generated more errors than double data extraction in systematic reviews. Journal of Clinical Epidemiology 2006;59(7):697‐703. [DOI] [PubMed] [Google Scholar]
Cameron 2007
- Cameron OG, Huang GC, Nichols T, Koeppe RA, Minoshima S, Rose D, et al. Reduced gamma‐aminobutyric acid(A)‐benzodiazepine binding sites in insular cortex of individuals with panic disorder. Archives of General Psychiatry 2007;64:793‐800. [DOI] [PubMed] [Google Scholar]
Deeks 2002
- Deeks JJ. Issues in the selection of a summary statistic for meta‐analysis of clinical trials with binary outcomes. Statistics in Medicine 2002;21(11):1575‐600. [DOI] [PubMed] [Google Scholar]
Eaton 1994
- Eaton WW, Kessler RC, Wittchen H‐U, Magee WJ. Panic and panic disorder in the United States. American Journal of Psychiatry 1994;151:413‐20. [DOI] [PubMed] [Google Scholar]
Elbourne 2002
- Elbourne DR, Altman DG, Higgins JP, Curtin F, Worthington HV, Vail A. Meta‐analyses involving cross‐over trials: methodological issues. International Journal of Epidemiology 2002;31:140‐9. [DOI] [PubMed] [Google Scholar]
Furukawa 2002
- Furukawa TA, Guyatt GH, Griffith LE. Can we individualize the 'number needed to treat'? An empirical study of summary effect measures in meta‐analyses. International Journal of Epidemiology 2002;31:72‐6. [DOI] [PubMed] [Google Scholar]
Furukawa 2005
- Furukawa TA, Cipriani A, Barbui C, Brambilla P, Watanabe N. Imputing response rates from means and standard deviations in meta‐analysis. International Clinical Psychopharmacology 2005;20:49‐52. [DOI] [PubMed] [Google Scholar]
Furukawa 2006
- Furukawa TA, Barbui C, Cipriani A, Brambilla P, Watanabe N. Imputing missing standard deviations in meta‐analyses can provide accurate results. Journal of Clinical Epidemiology 2000;59:7‐10. [DOI] [PubMed] [Google Scholar]
Furukawa 2007
- Furukawa TA, Watanabe N, Churchill R. Combined psychotherapy plus antidepressants for panic disorder with or without agoraphobia. Cochrane Database of Systematic Reviews 2007, Issue 1. [DOI: 10.1002/14651858.CD004364.pub2] [DOI] [PMC free article] [PubMed] [Google Scholar]
Goisman 1995
- Goisman RM, Warshaw MG, Steketee GS, Fierman EJ, Rogers MP, Goldenberg I, et al. DSM‐IV and the disappearance of agoraphobia without a history of panic disorder: new data on a controversial diagnosis. American Journal of Psychiatry 1995;152:1438‐43. [DOI] [PubMed] [Google Scholar]
Gorman 2000
- Gorman JM, Kent JM, Sullivan GM, Coplan JD. Neuroanatomical hypothesis of panic disorder, revised. American Journal of Psychiatry 2000;157:493‐505. [DOI] [PubMed] [Google Scholar]
Grant 2006
- Grant BF, Hasin DS, Stinson FS, Dawson DA, Goldstein RB, Smith S, et al. The epidemiology of DSM‐IV panic disorder and agoraphobia in the United States: results from the National Epidemiologic Survey on Alcohol and Related Conditions. Journal of Clinical Psychiatry 2006;67:363‐74. [DOI] [PubMed] [Google Scholar]
Guaiana 2013a
- Guaiana G, Barbui C, Chiodo D, Cipriani A, Davies SJC, Koesters M. Benzodiazepines versus placebo for panic disorder in adults. Cochrane Database of Systematic Reviews 2013, Issue 7. [DOI: 10.1002/14651858.CD010677] [DOI] [PMC free article] [PubMed] [Google Scholar]
Guaiana 2013b
- Guaiana G, Barbui C, Chiodo D, Cipriani A, Davies SJC, Koesters M. Antidepressants versus placebo for panic disorder in adults. Cochrane Database of Systematic Reviews 2013, Issue 7. [DOI: 10.1002/14651858.CD010676] [DOI] [PMC free article] [PubMed] [Google Scholar]
Guaiana 2014
- Guaiana G, Barbui C, Caldwell D, Davies SJC, Furukawa T, Imai H, et al. Antidepressants, benzodiazepines and azapirones for panic disorder in adults: a network meta‐analysis. Cochrane Database of Systematic Reviews 2014 (Data on file).
Higgins 2011
- Higgins JPT, Green S (editors). Cochrane Handbook for Systematic Reviews of Interventions Version 5.1.0 [updated March 2011]. The Cochrane Collaboration, 2011. Available from www.cochrane‐handbook.org.
Kessler 2006
- Kessler RC, Chiu WT, Jin R, Ruscio AM, Shear K, Walters EE. The epidemiology of panic attacks, panic disorder, and agoraphobia in the National Comorbidity Survey Replication. Archives of General Psychiatry 2006;63:415‐24. [DOI] [PMC free article] [PubMed] [Google Scholar]
King 2008
- King M, Nazareth I, Levy G, Walker C, Morris R, Weich S, et al. Prevalence of common mental disorders in general practice attendees across Europe. British Journal of Psychiatry 2008;192:362‐7. [DOI] [PubMed] [Google Scholar]
Klein 1964
- Klein DF. Delineation of two drug‐responsive anxiety syndromes. Psychopharmacologia 1964;5:397‐408. [DOI] [PubMed] [Google Scholar]
Lexchin 2003
- Lexchin J, Bero LA, Djulbegovic B, Clark O. Pharmaceutical industry sponsorship and research outcome and quality: systematic review. BMJ 2003;326:1167‐70. [DOI] [PMC free article] [PubMed] [Google Scholar]
Malizia 1998
- Malizia AL, Cunningham VJ, Bell CJ, Liddle PF, Jones T, Nutt DJ. Decreased brain GABA(A)‐benzodiazepine receptor binding in panic disorder: preliminary results from a quantitative PET study. Archives of General Psychiatry 1998;55:715‐20. [DOI] [PubMed] [Google Scholar]
Moher 2009
- Moher D, Liberati A, Tetzlaff J, Altman DG, The PRISMA group. Preferred Reporting Items for Systematic Reviews and Meta‐Analyses: The PRISMA Statement. PLoS Medicine 2009;6(6):e1000097. [DOI] [PMC free article] [PubMed] [Google Scholar]
Nash 2008
- Nash JR, Sargent PA, Rabiner EA, Hood SD, Argyropoulos SV, Potokar JP, et al. Serotonin 5‐HT1A receptor binding in people with panic disorder: positron emission tomography study. British Journal of Psychiatry 2008;1993:229‐34. [DOI] [PubMed] [Google Scholar]
NICE 2011
- National Institute for Health and Care Excellence. Generalised anxiety disorder and panic disorder (with or without agoraphobia) in adults: Management in primary, secondary and community care. NICE guidelines [CG113]. Published date: January 2011. Available from http://www.nice.org.uk/guidance/cg113/chapter/guidance.
Offidani 2013
- Offidani E, Guidi J, Tomba E, Fava GA. Efficacy and tolerability of benzodiazepines versus antidepressants in anxiety disorders: a systematic review and meta‐analysis. Psychotherapy and Psychosomatics 2013;82:355‐62. [DOI] [PubMed] [Google Scholar]
Otto 2001
- Otto MW, Tuby KS, Gould RA, McLean RY, Pollack MH. An effect‐size analysis of the relative efficacy and tolerability of serotonin selective reuptake inhibitors for panic disorder. American Journal of Psychiatry 2000;158:1989‐92. [DOI] [PubMed] [Google Scholar]
Pompoli 2016
- Pompoli A, Furukawa TA, Imai H, Tajika A, Efthimiou O, Salanti G. Psychological therapies for panic disorder with or without agoraphobia in adults: a network meta‐analysis. Cochrane Database of Systematic Reviews 2016, Issue 4. [DOI: 10.1002/14651858.CD011004.pub2] [DOI] [PMC free article] [PubMed] [Google Scholar]
Sanchez‐Meca 2010
- Sánchez‐Meca J, Rosa‐Alcázar AI, Marín‐Martínez F, Gómez‐Conesa A. Psychological treatment of panic disorder with or without agoraphobia: a meta‐analysis. Clinical Psychology Review 2010;30:37‐50. [DOI] [PubMed] [Google Scholar]
Starcevic 2009
- Starcevic V. Anxiety Disorders in Adults: A Clinical Guide. New York: Oxford University Press, 2009. [Google Scholar]
Starcevic 2014
- Starcevic V. The reappraisal of benzodiazepines in the treatment of anxiety and related disorders. Expert Review of Neurotherapeutics 2014;14(11):1275‐1286. [DOI] [PubMed] [Google Scholar]
Stein 2010
- Stein M, Steckler T, Lightfoot JD, Hay E, Goddard AW. Pharmacologic treatment of panic disorder. Current Topics in Behavioral Neurosciences 2010;2:469‐85. [DOI] [PubMed] [Google Scholar]
Wade 1999
- Wade AG. Antidepressants in panic disorder. International Clinical Psychopharmacology 1999;14(Suppl 2):13‐7. [PubMed] [Google Scholar]
Watanabe 2009
- Watanabe N, Churchill R, Furukawa TA. Combined psychotherapy plus benzodiazepines for panic disorder. Cochrane Database of Systematic Reviews 2009, Issue 1. [DOI: 10.1002/14651858.CD005335.pub2] [DOI] [PMC free article] [PubMed] [Google Scholar]
WHO 2003
- World Health Organization. Introduction to drug utilization research. WHO International Working Group for Drug Statistics Methodology; WHO Collaborating Centre for Drug Statistics Methodology; WHO Collaborating Centre for Drug Utilization Research and Clinical Pharmacological Services. 2003. Available from http://www.who.int/medicines/areas/quality_safety/safety_efficacy/utilization/en/.
Wilkinson 1991
- Wilkinson G, Balestrieri M, Ruggeri M, Bellantuono C. Meta‐analysis of double‐blind placebo‐controlled trials of antidepressants and benzodiazepines for patients with panic disorders. Psychological Medicine 1991;21:991‐8. [DOI] [PubMed] [Google Scholar]
References to other published versions of this review
Guaiana 2015
- Guaiana G, Barbui C, Bighelli I, Trespidi C, Chiodo D, Cipriani A, et al. Antidepressants and benzodiazepines for panic disorder in adults. Cochrane Database of Systematic Reviews 2015, Issue Issue 3. [DOI: 10.1002/14651858.CD011567] [DOI] [PMC free article] [PubMed] [Google Scholar]