Abstract
This paper presents an image morphing algorithm for quantitative evaluation methodology of terahertz (THz) images of excised breast cancer tumors. Most current studies on the assessment of THz imaging rely on qualitative evaluation, and there is no established benchmark or procedure to quantify the THz imaging performance. The proposed morphing algorithm provides a tool to quantitatively align the THz image with the histopathology image. Freshly excised xenograft murine breast cancer tumors are imaged using the pulsed THz imaging and spectroscopy system in the reflection mode. Upon fixing the tumor tissue in formalin and embedding in paraffin, an FFPE tissue block is produced. A thin slice of the block is prepared for the pathology image while another THz reflection image is produced directly from the block. We developed an algorithm of mesh morphing using homography mapping of the histopathology image to adjust the alignment, shape, and resolution to match the external contour of the tissue in the THz image. Unlike conventional image morphing algorithms that rely on internal features of the source and target images, only the external contour of the tissue is used to avoid bias. Unsupervised Bayesian learning algorithm is applied to THz images to classify the tissue regions of cancer, fat, and muscles present in xenograft breast tumors. The results demonstrate that the proposed mesh morphing algorithm can provide more effective and accurate evaluation of THz imaging compared with existing algorithms. The results also showed that while THz images of FFPE tissue are highly in agreement with pathology images, challenges remain in assessing THz imaging of fresh tissue.
Keywords: terahertz, morphing, medical imaging, breast cancer
1. Introduction
Breast cancer remains the most commonly diagnosed type of cancer among women in the United States [1]. When detected early, it is possible to perform a lumpectomy surgery, where a lump of tissue containing the tumor is excised, with minimum removal of normal breast tissue as possible. On the other hand, when the cancer is not detected early, a mastectomy surgery, where the whole breast is removed, becomes necessary. During the lumpectomy operation, it is important to accurately detect the margins of the excised tumor to include adequate amount of healthy tissue. Accurate assessment of the tumor margins saves the patient from having a second surgery to remove the remaining of cancerous cells, which unfortunately happens in almost 20% - 40% of the cases [2]. In recent years, THz imaging has shown a strong potential in differentiating between cancerous and noncancerous breast tissue [3–8], and hence represents a potential candidate technique for tumor margin assessment in the future.
The majority of published work on THz imaging utilized qualitative or manual quantitative methods to validate the images with histopathology (the golden standard technique). Generally speaking, there is a lack of established benchmark or procedure to automatically quantify the performance of THz imaging. While the validation of the actual composition of a tumor can be accurately identified through the high power histopathology analysis, they were qualitatively seen in THz images, in particular in FFPE tissue samples [5–8]. In these works, the THz and pathology images were manually aligned and rescaled for visual evaluation. In [5] and [8], the evaluation was performed as a visual comparison between the THz and pathology images or by superimposing contours of the well analyzed pathology regions on the THz images. Similarly, in [9], certain regions within the pathology image were magnified to validate the imaging of heterogeneous regions with THz.
On the other hand, in [3,4,10], the THz images were quantitatively evaluated using different types of tools. For example, in [3], the imaging results were evaluated by computing the Spearman rank correlation coefficient between the number of cancer pixels on the delineated THz and pathology images. The THz and pathology images were manually aligned using inked margins and photographs as references. In [10], the quantitative evaluation was performed by manually selecting corresponding sections on both THz and pathology images. The sections were then compared to calculate the receiver operating characteristic (ROC) curve. The ROC curves were also generated in [4] by performing a pixel-by-pixel comparison between the THz image and a histology map, which was manually created by overlapping of the pathology results on the THz image with software assistance. All the above quantitative methods required manual generation or adjustment of the pathology image, which are time consuming and prone to human errors and bias.
The current work aims to develop an unbiased evaluation of THz images to automatically assess the THz and pathology images by using image morphing technique. Our first morphing algorithm was based on shape interpolation and has been utilized to classify the tissue regions in freshly excised xenograft murine tumors as reported in [11]. The algorithm in that paper made a direct pixel-by-pixel comparison between the THz and pathology images where the pathology image was stretched or shrunk either horizontally, vertically, or in some cases in both directions to match the contour of the THz image. The interpolation-based morphing has led to good results in majority of cases, but showed some misalignments in some cases [11]. The objective of the current paper is to improve the quantitative evaluation of the THz imaging by using a mesh morphing algorithm based on homography mapping [12]. The mesh morphing algorithm can capture and correct the complex deformation introduced in the histopathology process of the FPFE tissue blocks, such that the pathology image can be accurately and automatically morphed into the same shape and resolution of its THz image counterpart.
Unlike most existing image morphing algorithms that rely on the internal features (such as eyes, nose, mouth, etc.) of both the source and target images [13,14], the proposed mesh morphing algorithm only uses information on the external contour of the THz and pathology images. Avoiding internal features, such as boundary between cancer and fat, in the morphing process can avoid human bias. The proposed algorithm is developed by using Delaunay triangulation to create triangle meshes on the two images [13,15], and homography mapping is then employed to match each triangle on the source image to its counterpart on the target image [16]. The algorithm can adjust the alignment, shape, and resolution of the pathology image to match the external contour of the tissue in the THz image. To the authors’ best knowledge, these techniques have not been previously used for this application. The mesh morphing algorithm enables an automated pixel-by-pixel comparison between THz and pathology images. Following the morphing procedure, the morphed images are used to evaluate the unsupervised Bayesian learning algorithm for THz imaging classification [11,17,18]. The Experimental Results Section will demonstrate that the proposed mesh morphing algorithm can provide more effective and accurate evaluation of THz imaging compared with the interpolation-based morphing.
This paper is organized as follows. Section 2 introduces the pulsed THz imaging and spectroscopy system used to image the excised tumor tissue samples. The problem is formulated in Section 3. Section 4 describes the mesh morphing algorithm that corrects the shape shift and the resolution mismatch between the pathology and THz images. Experiment results are given in Section 5, and Section 6 concludes the paper.
2. Pulsed THz Imaging and Spectroscopy System
The THz system is a TPS Spectra 3000 (TeraView, Ltd.) pulsed terahertz imaging and spectroscopy system at the University of Arkansas [5–8]. A diagram of the system is given in Fig. 1(a). An 800nm Ti:Sapphire laser provides the excitation for a biased GaAs antenna serving as the THz emitter. The emitted THz pulse shown in Fig. 1(b) is then directed by mirrors to reflect off of the sample mounted on the scanning stage. For all imaging in this work, the stage is moved in 200μm steps, and the reflected signal at each stage position is collected at a THz detector with the same structure as the THz emitter [7,19]. The Fourier transform of the incident signal is shown in Fig. 1(c) with a spectrum ranging from 0.1 to 4 THz.
Fig. 1:
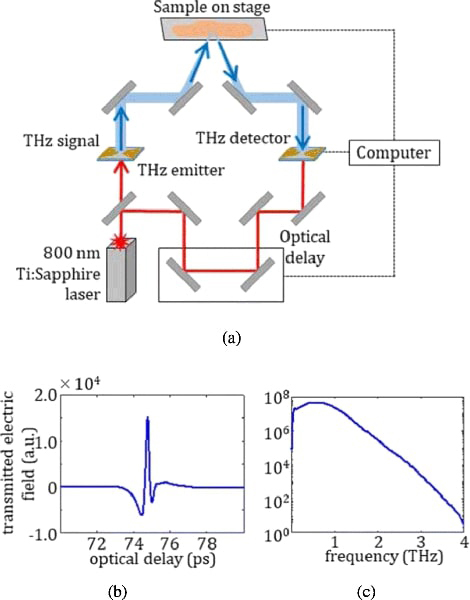
(a) Diagram of Pulsed THz Imaging and Spectroscopy System, with (b) emitted time domain pulse in air purged with Nitrogen gas and (c) frequency domain spectrum obtained using Fourier transform.
Terahertz images of xenograft mouse tumors are obtained for statistical correlation with pathology images in this work. C57BL/6 black laboratory mice are maintained on a high fat diet (D12492 from Research Diets) to generate sufficient fat deposits for injection until they reach a target weight of 35 g [20]. E0771 murine-derived breast adenocarcinoma cells are then injected into fat deposits on the mice flanks [11]. The resulting xenograft tumors are excised when they reach around 1 cm in diameter and immersed for a few minutes in phosphate-buffered saline (PBS) to be transferred to the THz imaging laboratory [11]. Following the imaging of the freshly excised tumors, the samples are immersed in formalin to be shipped overnight to the Oklahoma Animal Disease Diagnostic Laboratory (OADDL) for histopathol- ogy processing. At OADDL, the samples are embedding in paraffin blocks making FFPE tissue block samples. A thin ~ 3 – 4μm slice of the FFPE tissue is taken to be imaged under the microscope to produce the pathology images. The FFPE tissue blocks are also imaged using the THz system to be compared with the pathology and the THz images of the fresh tumors [11]. The imaging procedures of the samples are illustrated in Fig. 2.
Fig. 2:
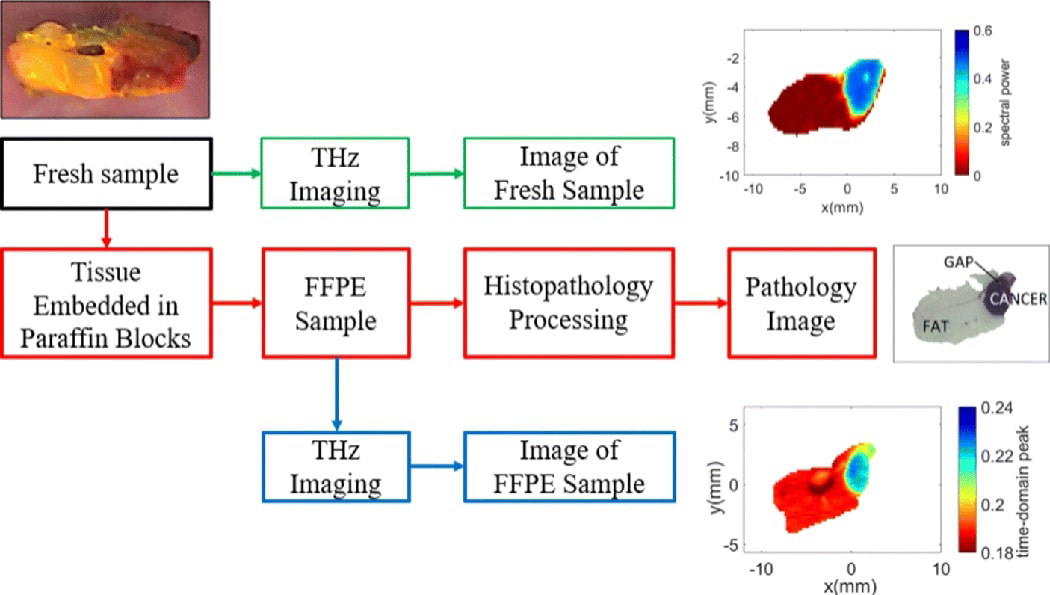
Experimental procedures.
For fresh tissue, samples are mounted on the reflection stage using a sandwich of two polystyrenes plates. THz images are then obtained by normalizing the frequency domain signals at the polystyrene-sample interface by the polystyrene-air reflection and integrating magnitude at each point from 0.5 to 1.0 THz. This provides a multi- spectral response (power spectra) that avoids high and low frequency noise.
For FFPE tissue, the tissue block is mounted in the air for reflection and the reflected signals from the sample are normalized against the peak reflection from a gold calibration mirror. Due to frequency domain oscillations arising from multiple reflections in the FFPE block, just the time domain peak is used to generate the THz image.
We have analyzed 16 xenograft breast cancer samples collected from 13 tumors. Sections collected from the same sample were named A or B [11]. The results obtained from 7 samples (samples 2, 4, 7A, 7B, 8A, 8B, and 9A) were presented in [11] by using an interpolation-based morphing approach. For this study, we selected 3 representative samples (tumor 5 section B with two tissue regions, and tumor 10 section A and tumor 13 section A with three tissue regions) to assess the performance of the proposed mesh morphing algorithm.
All animals received care in compliance with the guidelines outlined in the Guide for the Care and Use of Laboratory Animals. The procedures were approved by the University of Arkansas Institutional Animal Care and Use Committee (IACUC). The tumors used in the experimental results section were grown in xenograft mice and were excised in Dr. N. Rajaram’s lab in the Biomedical Engineering Department at the University of Arkansas [11].
3. Problem Formulation
The pathology image with a resolution of pixels can be represented by using a red-green-blue (RGB) model, where each pixel in the image can be represented as hc(x,y), where c is the index for red, green, or blue, and are the horizontal and vertical coordinates of the pixel, respectively.
As explained in Section 2, the THz data is summarized by using either the maximum value (peak) or the integration (power spectra) of the signal per pixel for block and fresh tissue, respectively. The summarized intensity can be used to form a THz image with resolution pixels. The summarized intensity at each pixel can be represented as t(x, y) with and are the horizontal and vertical coordinates of the pixel, respectively.
Figs. 3(a) and 3(b) show an example of the pathology image and THz image, respectively. The two images are obtained by using the same tissue samples, but under different conditions. The THz image is obtained by performing THz scanning on the freshly exercised tumor tissues. On the other hand, to obtain the pathology image, the tissue sample is first embedded in paraffin blocks, sliced, stained using Haemotoxylin and Eosin (H&E) ink, then evaluated under the microscope. As a result, the pathology and THz images of the same sample could look quite different. A direct pixel-by- pixel comparison between the pathology and THz image is not possible due to the following reasons.
Fig. 3:
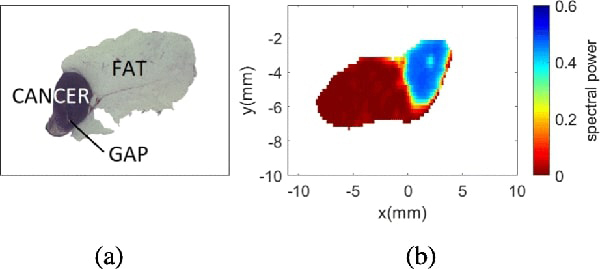
Sample 5B fresh. (a) Pathology image. (b) THz image.
Resolution mismatch: since histopathology results are obtained form a microscopic evaluation of the tissue, its resolution is usually much larger than that of the THz image
Shape deformation: when imaging fresh tissue samples with the THz system, there is considerable shape shifting due to the deformation of the tissue; the shape will further change during transportation, slicing, and paraffin embedding for the preparation of the FFPE sample that is necessary for histopathology evaluation.
Misalignment: the orientation of the two images are not aligned because the THz and pathology images are evaluated at different locations.
To enable a pixel-by-pixel comparison between the two images, we propose to morph the pathology image based on the shape of the THz image, such that the morphed pathology image has the same resolution, orientation, and shape as its THz counterpart. The main distinction between the proposed algorithm with existing morphing algorithms is that the proposed method will only use the information on the external contour of the pathology and THz images, while almost all existing morphing algorithms try to match two images with their corresponding internal features. No internal feature is utilized in this case to avoid unintentional bias in the morphing results. This is especially important for our application, which aims at quantitatively evaluating the performance of cancer detection with THz imaging by comparing it to its pathology counterpart.
4. Image Morphing
This section describes the procedures to morph the pathology mask into the shape of the THz image. Image morphing is an image processing technique that reshapes an image into the shape of another. In this paper, we propose to use mesh warping to achieve shape shifting between the pathology and THz images. The pathology morphing algorithm proposed in this paper consists of five steps: mask creation, mask alignment, mesh creation, image warping, and matrix creation.
1). Mask Creation.
The pathology image is a colored image obtained by using optical microscope. It does not clearly show the classification of the different regions at low magnification, and its accurate interpretation requires high magnification and the expertise of a pathologist. To enable the direct and pixel-by-pixel comparison between the pathology and THz image, it is necessary to convert the colored pathology image into a new one that clearly define the classification of each pixel based on the report from the pathologist [4]. The algorithm uses the gray scale color representation of the pathology image for the classification of the regions in samples with 2 regions and the hue-saturation-value (HSV) color representation in samples with 3 or more regions. For both cases, a threshold is defined in order to classify the intensities for each pixel. In samples with 3 or more regions, the saturation levels are used to identify fat, and the hue levels are used to classify muscle/fibro and cancer. The selection of the thresholds changes from sample to sample because it depends on the contrast and brightness of the pathology image.
2). Mask Alignment.
The objective of mask alignment is to align the orientation of the pathology mask with the THz image based on their external contours. Fig. 4(a) and 4(c) show the THz image and the pathology mask for sample 5B, which clearly shows the misalignment between the two images. Since the alignment is performed by only using the external contours, we first convert the THz image and pathology mask into monochromatic masks. Given that the resolution of the pathology mask is much higher than that of the THz mask, the resolution of the monochromatic pathology mask is reduced by using bicubic interpolation. The algorithm uses Pearson’s correlation coefficient between the two monochromatic masks to find the angle of maximum correlation [21]. Once the angle of alignment is found, the pathology mask of the original resolution is rotated by
Fig. 4:

Image misalignment for sample 5B fresh. (a) THz image. (b) Pathology image. (c) Pathology mask before alignment. (d) Pathology mask after alignment.
3). Mesh Creation.
To create the meshes, it is necessary to define control points between the two images such that the source and target control points match with each other after mesh warping [13]. One prominent distinction of the proposed algorithm with existing algorithms is that no control points inside the tumor should be used. Such a restriction is imposed to avoid the situation that the shapes of two internal regions are artificially matched, which will create bias in the THz image evaluations. In addition, given that the shape mismatch is a consequence of fixing the fresh tissue in paraffin, the stretching and shrinking varies from sample to sample and most areas change unpredictably. As a result, it is not possible to automatically identify the control points due to the lack of common features on the external boundary between the images.
Based on n control points selected by the user, we can create triangular meshes by using Delaunay triangulation [15], which divides the image into a tile of non-overlapping smaller triangles. Each triangle element can be warped separately such that the triangle on the source (rotated pathology mask) matches its counterpart on the target (THz image). To successfully warp the images, the meshes should not present any folding or discontinuities, and should be topologically equivalent [13]. Fig. 5 shows examples of Delaunay mesh created for sample 10A. To ensure complete coverage of the image, in addition to the control points on the image contour, the four corners of the image are also chosen as control points.
Fig. 5:
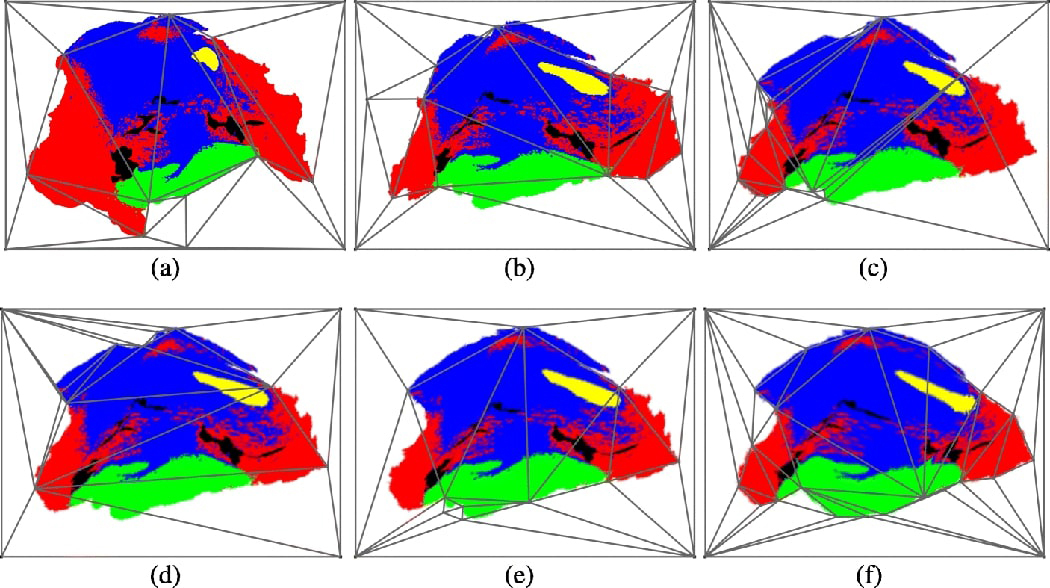
Iterative pathology mask morphing for sample 10A fresh. (a) 1st pathology mask mesh. (b) 2nd pathology mask mesh. (c) 6th pathology mask mesh. (d) 8th pathology mask mesh. (e) 9th pathology mask mesh. (f) 13th pathology mask mesh.
4). Homography Image Warping.
The objective of homography image warping is to map each triangle within the source mesh into the same shape as its counterpart in the target mesh. A homography is an invertible mapping from a two-dimensional plane to itself if and only if the mapped points of three points on the same line are also co-linear [12]. Since there are M triangles in each mesh, different homography mapping matrices should be computed for each triangle in the mesh. The homography mapping matrix of each triangle is calculated by using the coordinates of the 3 vertices of the triangles and its corresponding centroid. The matrix is obtained by using the singular value decomposition method as described in [16].
Even though the application of homography mapping is sufficient to completely morph the image, the requirement of having topologically equivalent meshes in both images remains as a challenge. To solve this problem, we adopt an iterative morphing approach. In each iteration we try to morph a few regions in the source image. The source image in each iteration is the target image from the previous iteration. An example of the iterative morphing process is shown in Fig. 5, where the iterative morphing process ensures the creation of topologically equivalent meshes. The number of iterations and number of regions to morph at each iteration varies depending on the severity of the mismatch between the images.
5). Matrix Creation.
Once the pathology mask has been successfully morphed, we need to convert it into a reference matrix that summarizes the tissue classification of each pixel as presented in the histopathology report (e.g. pixels labeled as 1 represent cancer, 2 represent muscle, etc) [11]. This reference matrix D is created based on the RGB color assigned during the creation of the pathology mask. Since the colors might change slightly due to morphing, each pixel in the pathology mask is classified by minimizing the difference between the assigned color and the color after morphing. The created reference matrix D has the same size as the THz image, thus it is possible to perform a pixel-by-pixel comparison between the two to quantitatively evaluate the results.
5. Experimental Results
This section presents the experimental results acquired from the mesh morphing algorithm described in Section 4. As described in Section 2, we present the results obtained with 3 samples: tumor 5 section B, tumor 10 section A, and tumor 13 section A.
The performance of the proposed mesh morphing algorithm is compared to an interpolation-based algorithm presented in [11, 17]. The interpolation-based algorithm simply stretches or shrinks the pathology mask vertically or horizontally to match the contour of the THz image. The results of the two algorithms are visually compared in Fig. 6 for the three samples, for both fresh tissues and FFPE samples. Compared to the interpolation-based algorithm, there is a better match between the mesh morphed pathology masks with their respective THz counterparts. The main advantage of the mesh morphing algorithm is that it reshapes the pathology image in any direction, yet the interpolation-based algorithm reshapes the image only in the vertical and horizontal directions. Therefore, the mesh morphing algorithm more accurately accounts for the deformation of the sample during the histopathological process.
Fig. 6:
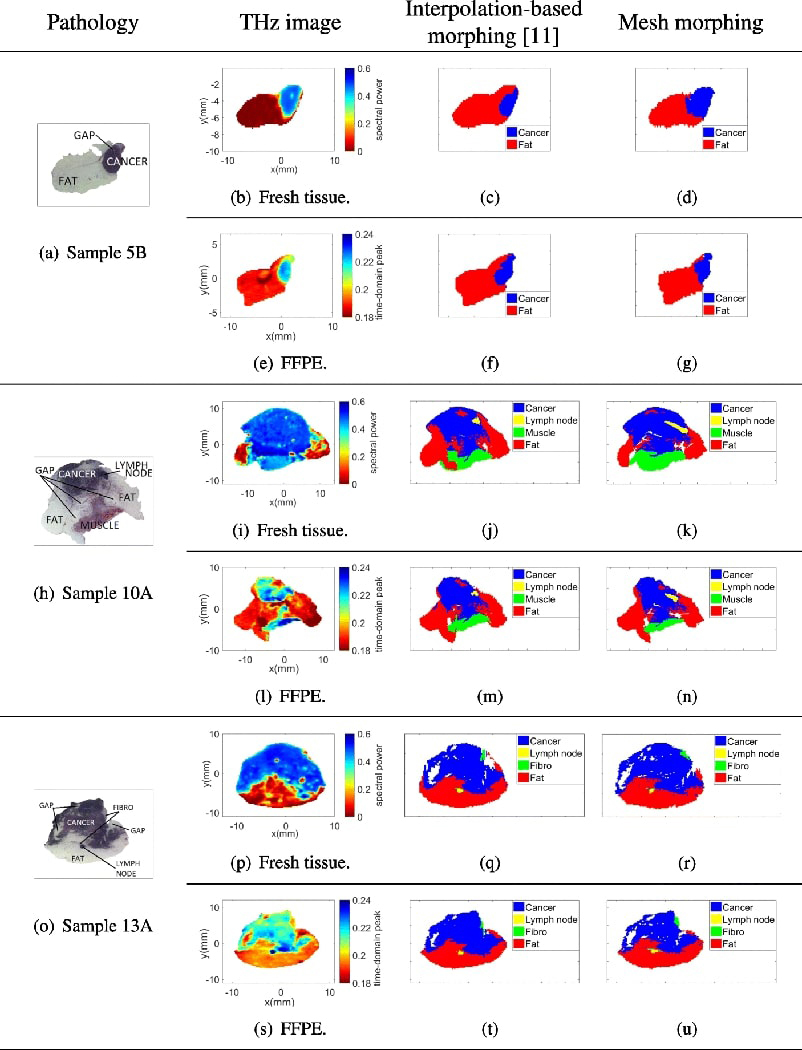
Interpolation-based morphing [11] vs. mesh morphing.
To further evaluate the mesh morphing algorithm, the samples were classified using an unsupervised Bayesian learning algorithm based on Markov chain Monte Carlo (MCMC), as presented in [11]. The Bayesian learning algorithm assumes that the summarized intensities of pixels belonging to different regions follow different probability distribution models. The unsupervised classification method is chosen because a supervised classification method will require a large number of tumor samples for training, while we only have a relatively small number of samples (a total of 16 samples), especially for tumors with 3 or more regions. We will explore supervised classification methods in our future works as we collect more samples.
In this paper, both Gaussian mixture and the t-mixture models were used to estimate the classification of the regions. The classification results were quantitatively evaluated by performing a pixel-by-pixel comparison between the classification results and the reference matrix obtained through the morphing procedure.
5.1. Samples with two regions
Sample 5B contains two regions, cancer and fat. The results for fresh and FFPE samples are shown in Figs. 7 and 8, respectively.
Fig. 7:
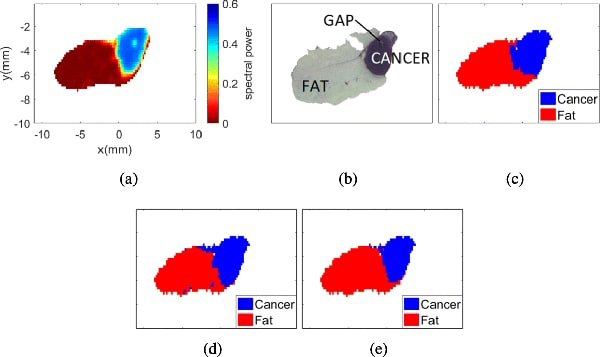
Sample 5B fresh. (a) THz image. (b) Pathology image. (c) Morphed Pathology. (d) Gaussian mixture model. (e) t-mixture model.
Fig. 8:
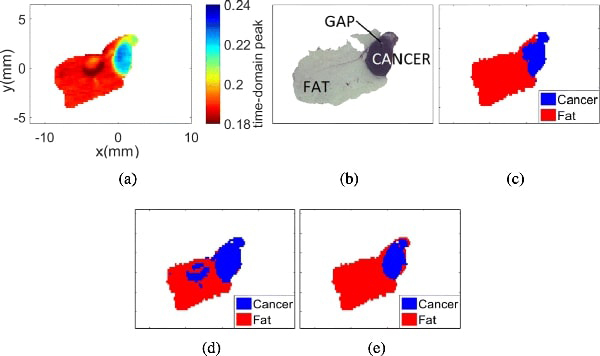
Sample 5B FFPE. (a) THz image. (b) Pathology image. (c) Morphed Pathology. (d) Gaussian mixture model. (e) t-mixture model.
Fig. 7(a) presents the THz image collected from sample 5B while it was still fresh. In this case, the spectral power of the reflected signal per pixel was used to generate the THz image. Fig. 7(b) shows the pathology results obtained after fixing the tissue in paraffin. Fig. 7(c) shows the morphed pathology results, where blue represents cancer and red represents fat. Figs. 7(d) and 7(e) represent the classification results of the THz image with the Gaussian and the t-mixture models, respectively. It is important to highlight that any white region within the samples represents either background or gaps (i.e. air gap that is missing tissues). Although gaps can appear only after fixing the sample in paraffin, the gaps were considered in freshly excised tumors due to their presence in the histopathological results. Therefore, the gap was not considered as part of the region of interest to avoid bias in the analysis.
Even though the THz images of fixed tissue (FFPE) do not present a considerable shape shifting as the fresh tissue, the morphing algorithm should still be performed to correct the resolution and alignment mismatch between the THz and pathology images. Fig. 8(a) presents the THz image collected from the FFPE sample 5B, where the maximum peak of the normalized reflected signal per pixel is used to summarize the pixel intensity. Fig. 8(b) shows the pathology results obtained after fixing the tissue in paraffin. The morphed pathology results, and the classification results of the THz images with Gaussian and t-mixture models are shown in Figs. 8(c), Figs. 8(d), and 8(e), respectively.
The classification results of both fresh and FFPE samples are compared to their respective morphed pathology results for quantitative evaluations. Figs. 9(a) and 9(b) show the ROC curves for sample 5B fresh and FFPE, respectively. From the ROC curves, we can quantitatively evaluate the performance of the cancer and fat detection in terms of its true positive (sensitivity) vs. false positive ratio (1-specificity). The ROC curves show that both cancer and fat can be accurately classified with low false positive ratio. The high accuracy in the classification results also demonstrates the accuracy of the proposed mesh morphing algorithm. These results are corroborated by Figs. 9(c) and 9(d), which show the estimated probability distributions of cancer and fat with the Gaussian mixture model.
Fig. 9:
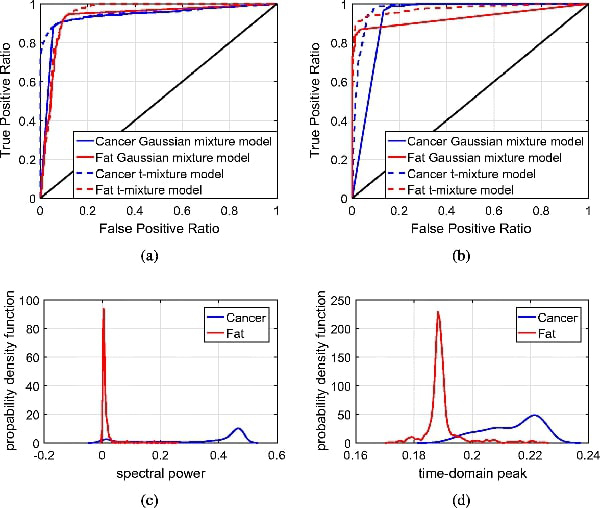
ROC curves and probability distributions for sample 5B fresh and FFPE. (a) ROC curves for sample 5B fresh. (b) ROC curves for sample 5B FFPE. (c) Probability distribution for sample 5B fresh. (d) Probability distribution for sample 5B FFPE.
5.2. Samples with three or more regions
Samples 10A and 13A contains three or more regions, including cancer, lymph node, muscle or fibro, and fat. While this research focuses on the detection of margins for lumpectomy, there are other approaches for breast cancer excision that include sentinel node biopsy. In that procedure, the surgeon excises the lymph node closest to the tumor to verify if the cancer has spread to other parts of the body. Since this sample presented a lymph node close to the tumor that showed signs of cancer spreading, we do not consider the lymph node as a separate region. Hence, the sample was analyzed by considering 3 regions: cancer, muscle, and fat.
Fig. 10(a) presents the THz image collected from sample 10A fresh. Fig. 10(b) shows the pathology results obtained after fixing the tissue in paraffin. Fig. 10(c) shows the morphed pathology mask of this sample, where blue represents cancer, green constitutes muscle, and red represents fat. Figs. 10(d) and 10(e) represent the classification results of the THz image with the Gaussian and the t-mixture models, respectively.
Fig. 10:
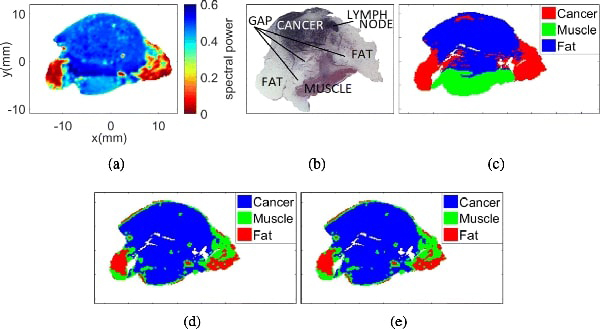
Sample 10A fresh with 3 regions. (a) THz image. (b) Pathology image. (c) Morphed Pathology. (d) Gaussian mixture model. (e) t-mixture model.
Figs. 11(a), 11(b), and 11(c) present the THz image, the pathology image, and the morphed pathology results collected from sample 10A FFPE, respectively. The classification results with Gaussian and t-mixture models are shown in Figs. 11(d) and 11(e), respectively.
Fig. 11:
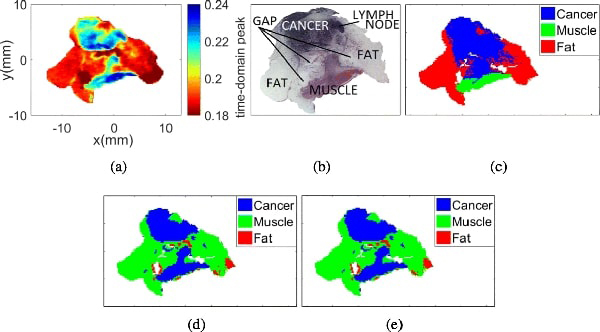
Sample 10A fresh with 3 regions. (a) THz image. (b) Pathology image. (c) Morphed Pathology. (d) Gaussian mixture model. (e) t-mixture model.
The classification results were compared to the morphed pathology results, and the corresponding ROC curves are shown in Fig. 12(a). The curves show that the detection of fat and muscle is compromised when considering 3 regions. This result can be explained from Fig. 12(c), which shows an overlapping of the probability distributions of muscle and cancer. While Figs. 10(a) and 10(c) show good visual correlation, the statistical model does not sufficiently distinguish the region of muscle between fat and cancer. Figs. 12(b) and 12(d) show the ROC curve and probability distributions for sample 10A FFPE, respectively. Again, there is significant overlapping between the distributions of muscle and cancer, and this results in poor detection results for muscles in the ROC curves in almost all figures.
Fig. 12:
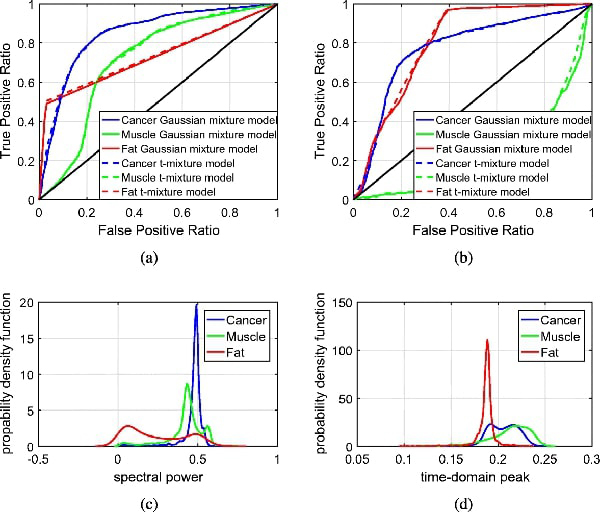
ROC curves and probability distributions for sample 10A fresh and FFPE. (a) ROC curves for sample 10A fresh. (b) ROC curves for sample 10A FFPE. (c) Probability distribution for sample 10A fresh. (d) Probability distribution for sample 10A FFPE.
Similar analysis was performed for sample 13A, which contains cancer, fibro, fat, and lymph node. The results for sample 13A fresh are shown in Figs. 10 and 15, and those for sample 13A FFPE are shown in Figs. 14 and 15.
Fig. 15:
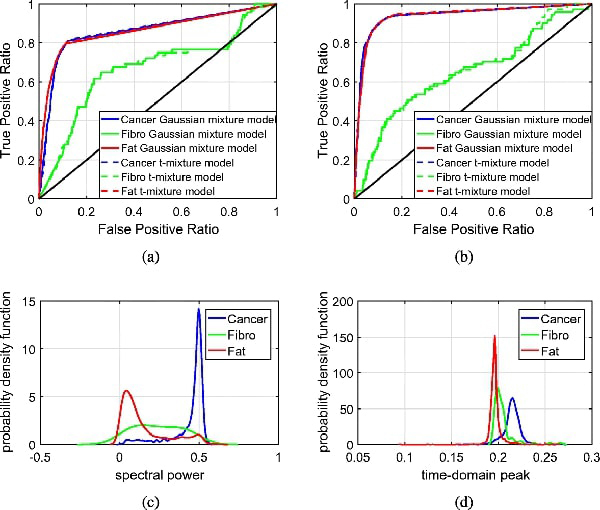
ROC curves and probability distributions for sample 13A fresh and FFPE. (a) ROC curves for sample 13A fresh. (b) ROC curves for sample 13A FFPE. (c) Probability distribution for sample 13A fresh. (d) Probability distribution for sample 13A FFPE.
Fig. 14:
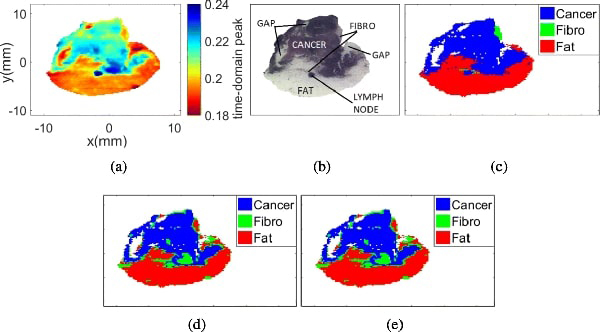
Sample 13A FFPE with 3 regions. (a) THz image. (b) Pathology image. (c) Morphed Pathology. (d) Gaussian mixture model. (e) t-mixture model.
For the fresh sample, the ROC curves in Fig. 15(a) indicate that cancer and fat can be detected with high accuracy, yet the detection accuracy of fibro is relatively poor. From the statistical model’s point of view, the compromised performance of fibro is mainly due the the significant overlapping in distributions between fat and fibro as shown in Fig. 15(c). Similar results are also observed for the FFPE samples as shown in Fig. 15(d).
To summarize the overall performance of the morphing algorithm with unsupervised Bayesian learning, Table 1 presents the areas under the curves of each sample. The area under the ROC curve represents an indicator of the performance of the Bayesian learning algorithm to distinguish a particular region from the rest of the tissue. From this table, we can highlight that the performance of the MCMC algorithm is successful for samples with 2 regions. In sample 5B, the areas under the curve for cancer and fat are greater than 95%, for both fresh and FFPE tissue. For samples with 3 regions, the areas under the curve for cancer are greater than 85% in fresh tissue and 77% in FFPE tissue. According to the results, the MCMC algorithm successfully identifies cancer and fat in samples with 2 regions, but it’s performance is compromised at the presence of a third region. Although the algorithm should be further improved for the classification of samples with 3 or more regions, the results demonstrate the potential of the proposed mesh morphing algorithm combined with the unsupervised Bayesian learning algorithm for the classification of THz imaging.
Considering all the samples presented in this section, we can highlight that the quantitative evaluation of the unsupervised Bayesian learning approach was successful due to the creation of the reference matrix through the proposed mesh morphing algorithm. Therefore, we demonstrated the effectiveness of the morphing algorithm for the quantitatively evaluation of breast cancer tissue samples.
6. Conclusions
The results of this paper demonstrated a quantitative evaluation methodology of THz imaging with pathology images of excised breast cancer tumors. The presented methodology included the development of a mesh morphing algorithm followed by a statistical classifier. The mesh morphing algorithm was based on homography mapping of histopathology images to adjust the alignment, shape, and resolution to match the external contour of the tissue in the THz image. It is important to mention that the proposed algorithm works properly if the resolution of the histopathology image is larger than that of the THz image. This requirement can always be met in practical applications because the histopathology utilizes optical images from a microscope, which possess inherently higher resolution.
The statistical classifier was based on the well-known technique, the unsupervised Bayesian learning algorithm based on Markov chain Monte Carlo (MCMC). The results showed successful evaluation of samples with two regions, and challenges remained when three different tissue regions were included. Specifically, the classification of both muscle and fibro was not successful in the results presented here. This is due to the fact that compressing the THz data to a scalar value for each pixel causes overlap in the probability distributions of cancer and fibro regions. For future studies, the selection and usage of additional parameters of the THz data by using advanced dimension reduction techniques such as basis expansion or principal component analysis [22, 23] will be studied to further improve the classification algorithm.
In addition, the THz imaging of fresh tissues is still facing challenges to be quantitatively evaluated since the pathology images were the only available images to compare with. These images were taken from two different states of the tissue; the THz was taken once the tissue was excised from the xenograft mouse while the pathology images were obtained after the tissue was immersed in formalin and embedded in paraffin to produce the tissue block. In the histopathology process, there was deformation, misalignment, and stretching of the tissue leading to comparing two different image states. Furthermore, THz imaging of fresh tissue still suffer challenges due to the presence of blood and fluid floating on the tissue surface that affects the THz reflection results. This is the reason that the results of the quantitative evaluation of THz imaging of FFPE tissues is more reliable than that of the THz imaging of fresh tissue. Future studies will focus on improving the alignment of smaller, more distributed regions (e.g. ductal carcinoma in situ DCIS), using morphing as more heterogeneous samples are investigated.
Fig. 13:
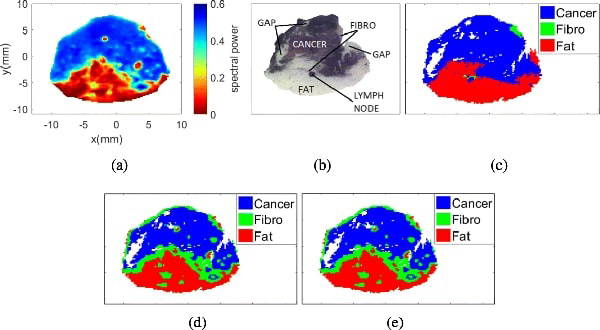
Sample 13A fresh with 3 regions. (a) THz image. (b) Pathology image. (c) Morphed Pathology. (d) Gaussian mixture model. (e) t-mixture model.
Table 1:
Area under the ROC curve for all samples.
| Sample | Type | Cancer | Muscle / Fibro | Fat |
|---|---|---|---|---|
| 5B | Fresh | 0.9522 | — | 0.9522 |
| FFPE | 0.9754 | — | 0.9754 | |
| 10A | Fresh | 0.8518 | 0.7139 | 0.7372 |
| FFPE | 0.7743 | 0.2089 | 0.8073 | |
| 13A | Fresh | 0.8604 | 0.6656 | 0.8646 |
| FFPE | 0.9399 | 0.6545 | 0.9385 |
Acknowledgements
This work was funded by the National Institutes of Health under Award No. R15CA208798. It was also funded in part by the National Science Foundation under Awards No. 1408007 and 1711087.
The authors would like to thank Dr. Rajaram and his students for handling the mice and providing the tumor tissues [11] used in this work.
Contributor Information
Tanny Chavez, University of Arkansas, Fayetteville, AR 72701 USA, tachavez@uark.edu;.
Tyler Bowman, University of Arkansas, Fayetteville, AR 72701 USA, tcbowman@uark.edu;.
Jingxian Wu, University of Arkansas, Fayetteville, AR 72701 USA, wuj@uark.edu;.
Keith Bailey, Oklahoma Animal Disease Diagnostic Laboratory, Oklahoma State University, Stillwater,OK, 74076 USA, keith.bailey@okstate.edu.
Magda El-Shenawee, University of Arkansas, Fayetteville, AR 72701 USA, magda@uark.edu.
References
- 1.American Cancer Society. Cancer facts & figures, [online] https://www.cancer.org/content/dam/cancer-org/research/cancer-facts-and-statistics/annual-cancer-facts-and-figures/2018/cancer-facts-and-figures-2018.pdf. 2018.
- 2.Jacobs Lisa. Positive margins: the challenge continues for breast surgeons. Annals of surgical oncology, 15(5):1271–1272, 2008. [DOI] [PMC free article] [PubMed] [Google Scholar]
- 3.Fitzgerald Anthony J., Wallace Vincent P., Mercedes Jimenez-Linan Lynda Bobrow, Pye Richard J., Purushotham Anand D., and Arnone Donald D.. Terahertz pulsed imaging of human breast tumors. Radiology, 239(2):533–540, 2006. PMID: . [DOI] [PubMed] [Google Scholar]
- 4.St. Peter B, Yngvesson S, Siqueira P, Kelly P, Khan A, Glick S, and Karellas A Development and testing of a single frequency terahertz imaging system for breast cancer detection. IEEE Journal of Biomedical and Health Informatics, 17(4):785–797, July 2013. [DOI] [PMC free article] [PubMed] [Google Scholar]
- 5.Bowman TC, El-Shenawee M, and Campbell LK. Terahertz imaging of excised breast tumor tissue on paraffin sections. IEEE Transactions on Antennas and Propagation, 63(5):2088–2097, May 2015. [Google Scholar]
- 6.Bowman Tyler, Wu Yuhao, Gauch John, Campbell Lucas K, and El-Shenawee Magda. Terahertz imaging of three-dimensional dehydrated breast cancer tumors. Journal of Infrared, Millimeter, and Terahertz Waves, 38(6):766–786, 2017. [Google Scholar]
- 7.Bowman Tyler, Walter Alec, Shenderova Olga, Nunn Nicholas, McGuire Gary, and El- Shenawee Magda . A phantom study of terahertz spectroscopy and imaging of micro- and nano-diamonds and nano-onions as contrast agents for breast cancer. Biomedical Physics & Engineering Express, 3(5):055001, 2017. [DOI] [PMC free article] [PubMed] [Google Scholar]
- 8.Bowman Tyler, El-Shenawee Magda, and Campbell Lucas K. Terahertz transmission vs reflection imaging and model-based characterization for excised breast carcinomas. Biomed. Opt. Express, 7(9):3756–3783, Sep. 2016. [DOI] [PMC free article] [PubMed] [Google Scholar]
- 9.M-A Brun F Formanek A Yasuda M Sekine N Ando, and Eishii Y. Terahertz imaging applied to cancer diagnosis. Physics in Medicine & Biology, 55(16):4615, 2010. [DOI] [PubMed] [Google Scholar]
- 10.Henry SC, Zurk LM, and Schecklman S. Terahertz spectral imaging using correlation processing. IEEE Transactions on Terahertz Science and Technology, 3(4):486–493, July 2013. [Google Scholar]
- 11.Bowman Tyler, Chavez Tanny, Khan Kamrul, Wu Jingxian, Chakraborty Avishek, Rajaram Narasimhan, Bailey Keith, and El-Shenawee Magda . Pulsed terahertz imaging of breast cancer in freshly excised murine tumors. Journal of Biomedical Optics, 23(2):026004, 2018. [DOI] [PMC free article] [PubMed] [Google Scholar]
- 12.Hartley Richard and Zisserman Andrew. Multiple View Geometry in Computer Vision. Cambridge University Press, New York, NY, USA, 2 edition, 2003. [Google Scholar]
- 13.Wolberg George. Image morphing: a survey. The Visual Computer, 14(8):360–372, Dec. 1998. [Google Scholar]
- 14.Liao Jing, Rodolfo S Lima Diego Nehab, Hoppe Hugues, Sander Pedro V, and Yu Jinhui. Automating image morphing using structural similarity on a halfway domain. ACM Transactions on Graphics (TOG), 33(5):168, 2014. [Google Scholar]
- 15.Cheddad Abbas. Structure preserving binary image morphing using delaunay triangulation. Pattern Recognition Letters, 85:8–14, 2017. [Google Scholar]
- 16.Dubrofsky Elan. Homography estimation. Master’s thesis, Carleton University, Canada, 2007. [Google Scholar]
- 17.Gelfand Alan E.. Gibbs Sampling. John Wiley & Sons, Inc., 2004. [Google Scholar]
- 18.Tanny Andrea Chavez Esparza. Evaluation of terahertz imaging for breast cancer detection using image morphing. Master’s thesis, University of Arkansas, May 2018. [Google Scholar]
- 19.Bowman Tyler, Wu Yuhao, Gauch John, Campbell Lucas K., and El-Shenawee Magda. Terahertz imaging of three-dimensional dehydrated breast cancer tumors. Journal of Infrared, Millimeter, and Terahertz Waves, 38(6):766–786, Mar. 2017. [Google Scholar]
- 20.Boi Shannon K., Buchta Claire M., Pearson Nicole A., Francis Meghan B., Meyerholz David K., Grobe Justin L., and Norian Lyse A.. Obesity alters immune and metabolic profiles: New insight from obese-resistant mice on high-fat diet. Obesity, 24(10):2140–2149, 2016. [DOI] [PMC free article] [PubMed] [Google Scholar]
- 21.Kaur Avneet, Kaur Lakhwinder, and Gupta Savita. Image recognition using coefficient of correlation and structural similarity index in uncontrolled environment. International Journal of Computer Applications, 59:32–39, Dec. 2012. [Google Scholar]
- 22.Caroline B Reid Anthony Fitzgerald, Reese George, Goldin Robert, Tekkis Paris, PS O’Kelly Emma Pickwell-MacPherson, Gibson Adam P, and Wallace Vincent P. Terahertz pulsed imaging of freshly excised human colonic tissues. Physics in Medicine & Biology, 56(14):4333, 2011. [DOI] [PubMed] [Google Scholar]
- 23.Fitzgerald Anthony J, Wallace Vincent P, Pinder Sarah E, Purushotham Anand D, O’Kelly Padraig, and Ashworth Philip C. Classification of terahertz-pulsed imaging data from excised breast tissue. Journal of biomedical optics, 17(1):016005, 2012. [DOI] [PubMed] [Google Scholar]


