

Abstract
Objective:
This cluster randomized trial (CRT) evaluated the efficacy of the Classroom Social, Communication, Emotional Regulation, and Transactional Support (SCERTS) Intervention (CSI) compared with usual school-based education with autism training modules (ATM).
Method:
Sixty schools with 197 students with autism spectrum disorder (ASD) in 129 classrooms were randomly assigned to CSI or ATM. Mean student age was 6.79 years (SD 1.05) and 81.2% were male. CSI teachers were trained on the model and provided coaching throughout the school year to assist with implementation. A CRT, with students nested within general and special education classrooms nested within schools, was used to evaluate student outcomes.
Results:
The CSI group showed significantly better outcomes than the ATM group on observed measures of classroom active engagement with respect to social interaction. The CSI group also had significantly better outcomes on measures of adaptive communication, social skills, and executive functioning with Cohen’s d effect sizes ranging from 0.31 to 0.45.
Conclusion:
These findings support the preliminary efficacy of CSI, a classroom-based, teacher-implemented intervention for improving active engagement, adaptive communication, social skills, executive functioning, and problem behavior within a heterogeneous sample of students with ASD. This makes a significant contribution to the literature by demonstrating efficacy of a classroom-based teacher-implemented intervention with a heterogeneous group of students with ASD using both observed and reported measures.
Keywords: autism, SCERTS, cluster randomized trial, classroom, intervention
The landscape of educating students with autism spectrum disorder (ASD) has changed over the past two decades with an overall increase in the number of students with ASD, a significant pro-portion of whom do not have concurrent intellectual disability and receive the majority of their educational programming in mainorder stream settings. The most recent Centers for Disease Control and Prevention report (Baio et al., 2018) estimates that ASD affects 1:59 children in the United States. The number of students in the United States between the ages of 6 to 21 identified with ASD is estimated to be 498,000, representing an increase of more than 435% since 2001 (Snyder, de Brey, & Dillow, 2016). The proportion of students with ASD who do not have intellectual disability is 69% (Baio et al., 2018). The larger proportion of students with ASD who are high functioning dovetails with recent reports that as of 2013, more than 39% of children with ASD in public schools are spending 80% or more of their school day in general education classrooms (Snyder et al., 2016). Thus, the educational system is charged with meeting the needs of increasing numbers of students with heterogeneous cognitive and behavioral skills within a range of educational placements. Further, school systems are required by law to implement evidence-based practices (Individuals with Disabilities Education Act, 2004), and yet few evidence-based intervention models are available to address the diverse educational needs of school-age students with ASD. Of the intervention evidence that does exist, there is limited applicability to real-world classroom implementation.
Although efficacy research has been conducted in clinical settings with several treatment models for young children with ASD, implementation in public school classrooms has been limited. Barriers to implementation include the fact that many efficacy studies require extensive training to implement with sufficient fidelity, high staff-to-child ratios, and levels of intensity that are not feasible in school settings (Kasari & Smith, 2013; Mandell et al., 2013). As a result, when such practices are delivered in school settings they are often not implemented in the way that they were designed and studied (Stahmer et al., 2015). Further implementation challenges arising in the school setting include incongruent school policies, lack of adequate staffing and resources, and competing school priorities (Locke, Shih, Kretzmann, & Kasari, 2016). Interventions implemented by school systems may require modification from their original form in order to create a better fit with the school context, which may jeopardize the integrity of the treatment and diminish treatment effects. Thus, it is not surprising that classroom interventions for children with ASD have not reported main effects on child outcomes (Boyd et al., 2014; Mandell et al., 2013).
Although there have been several intervention studies conducted in preschool settings that report significant outcomes for children with ASD (e.g., Strain & Bovey, 2011; Young, Falco, & Hanita, 2016), there continues to be a critical need for evidence-based intervention models for children with ASD that can be implemented by teachers in elementary classrooms. The need for interventions to be tested in the settings in which they are intended to be delivered, in this case public schools with teachers as agents of delivery, has been discussed widely in recent literature (Cook & Odom, 2013; Dingfelder & Mandell, 2011; Kasari & Smith, 2013) and has been identified as a key area of need for research (Interagency Autism Coordinating Committee, 2014). In the first published randomized controlled trial (RCT) for children with ASD implemented in public elementary school classrooms, Mandell and colleagues (2013) compared the effects of two comprehensive teacher-implemented interventions in elementary special education classrooms. In this study, 33 classrooms with 119 participant students were randomized to either Strategies for Teaching based on Autism Research (STAR; Arick, Loos, Falco, & Krug, 2004) or Structured Teaching (Mesibov, Shea, & Schopler, 2005). In both conditions, teachers received a combination of workshop training, observation, and coaching throughout the school year. While children in both groups demonstrated significant gains in IQ with children in the STAR program increasing from an average IQ of 61.00 to an average of 69.80 and the Structured Teaching increasing from an average of 57.60 to an average of 67.10, significant main effects of treatment were not detected. In this study, as well as other teacher-implemented interventions, challenges with meeting fidelity may contribute to the lack of main effects.
Although Mandell and colleagues (2013) were rigorous in their methodology to evaluate a teacher-delivered intervention in the school setting, the significance of this work is curtailed by the use of IQ as the single outcome measure. Though objective, valuable, and critical for unbiased student comparisons, use of standardized measures alone may result in the assessment of behaviors distal to classroom performance and may miss other important and clinically significant gains (Kasari & Smith, 2013; Rogers & Vismara, 2008). Multiple measures, including teacher report and direct observation, can provide contextually rich information on student improvement (Gordon et al., 2011). Demonstration of change in more specific areas such as adaptive behavior, executive functioning, and social skills, provides more information on how the intervention is working (Kazdin & Nock, 2003). In addition to measures using survey and interview techniques, perhaps the most meaningful source of classroom measurement is gleaned from direct observation.
It has been recommended that students with ASD spend a minimum of 25 hr per week actively engaged in learning activities to promote positive educational outcomes (National Research Council, 2001; Odom, Boyd, Hall, & Hume, 2014; Wong et al.,2015). Active engagement (AE) has been designated as a key component of effective programming for students with ASD (Io-vannone, Dunlap, Huber, & Kincaid, 2003; National Research Council, 2001; Ruble & Robson, 2007), with conceptualizations focused on school-based observation of either academically focused behavior (e.g., on task and on schedule; Ruble & Robson, 2007) or on social interaction (e.g., playground joint engagement; Locke et al., 2016). Regardless of how it has been operationalized, research has described consistently low rates of classroom AE in students with ASD (Locke et al., 2016; Nicholson, Kehle, Bray, & Van Heest, 2011; Ruble & Robson, 2007; Sparapani, Morgan, Reinhardt, Schatschneider, & Wetherby, 2016). Very few studies have examined change in AE in students with ASD as a result of intervention. Single-subject research has provided some evidence to support the malleability of aspects of AE in students with ASD (Bryan & Gast, 2000; Nicholson et al., 2011), though these studies are limited to a narrow set of behaviors that are not specifically tied to the core deficits of ASD. We have examined the construct of AE (Sparapani et al., 2016) by incorporating behaviors relevant to both academic and social participation.
Classroom Social Communication, Emotional Regulation, and Transactional Support (SCERTS) Intervention (CSI) was developed for implementation by classroom personnel in the elementary setting to address the challenges of engaging children with ASD in social interaction and learning activities. The foundation of CSI is the SCERTS Model, a manualized intervention approach aimed at addressing the most significant challenges faced by children with ASD (Prizant, Wetherby, Rubin, Laurent, & Rydell, 2006). The curriculum targets individualized intervention goals and objectives for students in the domains of social communication (SC) and emotional regulation (ER). Transactional supports (TS) are intervention or teaching strategies embedded within everyday activities by teachers, parents, or peers to support child learning and AE across settings. SCERTS is characterized as a Naturalistic Developmental Behavioral Intervention (NDBI; Schreibman et al., 2015) and is used in conjunction with the school’s existing curriculum to target the unique needs of students with ASD. CSI incorporates a collection of evidence-based practices in that each of the three SCERTS domains (SC, ER, and TS) and each objective within the curriculum are derived from research evidence. This evidence comes from a combination of treatment studies (both group and single subject) that have examined focused intervention strategies (e.g., Aldred, Green, & Adams, 2004; Wetherby & Woods, 2006) and descriptive group research designs documenting core deficits of ASD or predictors of outcomes for children with ASD (Siller & Sigman, 2002; Wetherby et al., 2004). The fundamental tenets of CSI are consistent with recommendations of the NRC (2001) and the practices identified in the recent Autism Evidence-Based Practice Review (Wong et al., 2015) on providing educational interventions to children with ASD.
An RCT with SCERTS has been implemented with toddlers in the Early Social Interaction (ESI) Project by coaching parents (Wetherby et al., 2014). This RCT compared the effects of two parent-implemented interventions, individual and group, with 82 toddlers with ASD. Both conditions used SCERTS to identify child goals and objectives and to monitor treatment progress. The individual condition resulted in significantly greater improvements in social communication, adaptive behavior, and developmental level. While the context and intervention targets of ESI are different than CSI, both interventions utilize the SCERTS curriculum, implement a common coaching model to change TS in everyday activities, and focus on improving child AE.
Prior to the present study, we conducted a 1-year pilot test of CSI to assess feasibility of implementation. Twenty schools in four school districts participated with 41 teachers and 82 students. Schools were randomly assigned to either SCERTS or Autism Training Modules (ATM). ATM was a control condition comprised of web-based training modules designed to provide information about evidence-based practice to teachers providing usual school-based education to students with ASD. Teachers in the SCERTS condition received an intensive 3-day workshop at the beginning of the year and tailored coaching sessions throughout the year including feedback individualized to their needs. The pilot study allowed us to deliver our initial manualized version of CSI and make minor adjustments in training procedures and intervention materials prior to engaging in the 3-year cluster randomized trial (CRT) presented in this study.
Given the immediate challenges of educating children with ASD in this country as well as lack of evidence-based models applied at the elementary school level, this study aimed to contribute to and extend the very limited body of research on school-based treatments for students with ASD by evaluating the efficacy of CSI as a teacher-implemented, classroom-based intervention for elementary students with ASD in both general and special education classrooms. This study addressed student outcomes in classroom settings for children diagnosed with ASD, with classroom personnel as implementation agents. The primary research objective of this study was to evaluate whether, after eight months of treatment, kindergarten—second-grade students with ASD whose teachers received CSI training and coaching demonstrated significant improvement across a variety of measures based on observed and reported information by teachers and parents compared with students whose teachers received ATM. It was hypothesized that CSI would show differential effects for students with ASD evidenced by greater improvement on measures of AE, adaptive behavior, executive functioning, and social outcomes compared with students in the usual school-based education with ATM group.
Method
This study used a CRT with schools randomly assigned to either CSI or ATM groups. Schools were matched pairwise on demographic features (i.e., school size, proportion of students receiving free or a reduced lunch, and ethnic composition) and one school from each pair was randomly assigned to either CSI or ATM using a computer-generated list created by the first author. A CRT design was used because of the possibility of contamination of treatment effects if teachers working in the same school were randomly assigned. This study was approved by the Florida State University Institutional Review Board as well as the review boards for each participating school district.
Data for this CRT were collected over a period of three school years between 2011 and 2014. Initially, letters were sent to each district’s director of special education or primary ASD contact requesting recommendations of potential school sites for the study. Principals of the suggested schools were then sent a letter explaining the study. As needed, individual meetings were held with principals and/or teachers to describe the study and to clarify participant expectations. Once a principal agreed to support school participation, interested teachers were provided an information packet and contacted research staff to complete the consent process. Once consented, teachers were provided with packets to send home with students where ASD was suspected or had been disclosed by the family in addition to those formally identified as having ASD. Families that returned initial study forms were then contacted and provided a choice of completing the consent process either via mail or through an individual meeting (face-to-face, phone, or video conference). Once consent was attained, baseline assessments were conducted.
Each year, two waves of data were collected. Baseline assessments were conducted near the beginning of the school year to confirm study eligibility and to provide baseline characteristics of the sample. The Stanford-Binet Intelligence Scale (fifth ed. [SB-51; Roid, 2003) was conducted to assess cognitive functioning using the verbal and nonverbal routing subtests to derive an abbreviated IQ score. The Autism Diagnostic Observation Schedule (ADOS; Lord, Rutter, DiLavore, & Risi, 2002) was used to confirm diagnosis of ASD and to further characterize the sample. At each site an experienced diagnostician with research-level reliability on the ADOS completed the evaluations. Baseline and end-of-treatment assessments included measures of classroom AE, vocabulary, adaptive behavior, social skills, and executive functioning. All research staff involved in administering assessments or coding observations were kept unaware of participants’ treatment group.
Participants
School sample.
A total of 70 elementary schools from school districts in California (27 schools, one school district), Florida (35 schools, seven school districts), and Georgia (eight schools, two school districts) were recruited to participate. Schools and teachers were distinct from those who participated in the initial CSI pilot study. A total of 34 schools were randomized to CSI and 36 were randomized to ATM. Ten schools dropped out of the study due to low recruitment. Three were unable to recruit target students, five had students withdraw or change schools, and two had teachers withdraw prior to the start of the study (one decided not to participate and the target student moved to a nonparticipating classroom for the other teacher), resulting in a total of 60 participating schools.
Demographic information on schools in each condition is summarized in Table 1. School size ranged from 46 to 1,256 total students. Assessment at baseline demonstrated that participating schools were demographically diverse in their representation of students with free or reduced lunch status (range = 0%–99%,). Independent sample t tests revealed no significant differences between CSI and ATM schools regarding size, ethnic/racial break-down, gender distribution, or free/reduced lunch (p = .259–.914).
Table 1.
School Demographics
| Characteristic | CSI (n = 34) | ATM (n = 26) | p | d |
|---|---|---|---|---|
| Number of students | 601.74 (237.04) | 628.12 (230.95) | .667 | .11 |
| Race/ethnicity (%) White | 46.33% (28.95) | 45.00% (27.12) | .857 | .05 |
| Black | 13.87% (11.65) | 15.45% (17.46) | .676 | .12 |
| Asian or Pacific Islander | 8.87% (14.01) | 8.51% (10.96) | .914 | .02 |
| Native American | .24% (.29) | .18% (.21) | .405 | .24 |
| Hispanica | 25.00% (28.90) | 26.14% (26.06) | .875 | .04 |
| Multiracial | 5.69% (3.21) | 4.71% (3.23) | .249 | .30 |
| Male (%) | 52.35% (2.29) | 52.66% (5.64) | .777 | .07 |
| Free–reduced lunch (%) | 59.47% (25.56) | 51.04% (28.07) | .250 | .31 |
Note. CSI = Classroom SCERTS Intervention; ATM = Autism Training Modules.
Hispanic is not categorized separately from race categories according to National Center for Education Statistics.
Teacher sample.
Within the 60 schools, 129 teachers (75 CSI, 54 ATM) participated in the study. Although a team was often centered on the student, a single teacher was identified as the lead educator for each child participating in the study. Teacher demographic characteristics are presented in Table 2. Of participating teachers, 96% were women. Examination of these demographic characteristics showed no significant differences between CSI and ATM teachers. Treatment condition was not significantly associated with distributions of teacher race, ethnicity, gender, or graduate education.
Table 2.
Teacher Demographics
| Characteristic | CSI (n = 75) |
ATM (n = 54) |
p | d |
|---|---|---|---|---|
| Age | 41.86 (11.13) | 42.98 (9.67) | .559 | −.11 |
| Race (%) | .564 | |||
| White | 82.70% | 88.90% | ||
| Asian | 5.30% | 5.60% | ||
| Black | 4.00% | 1.90% | ||
| Multiracial | 2.70% | .00% | ||
| Not reported | 5.30% | 3.70% | ||
| Ethnicity | ||||
| Hispanic | 1.30% | 5.60% | .393 | |
| Gender (% female) | 94.70% | 96.30% | .665 | |
| Years teaching | 13.20 (8.54) | 15.07 (9.88) | .385 | −.21 |
| Classroom | .071 | |||
| General education | 58.7% | 42.6% | ||
| Specialized | 41.3% | 57.4% | ||
| Number of classroom support staff | 1.14 (.94) | 1.28 (1.03) | .460 | −.14 |
| Education (% with master’s degree or higher) | 46.67% | 62.96% | .100 | |
Note. CSI = Classroom SCERTS Intervention; ATM = Autism Training Modules; d = Cohen’s measure of effect size.
Student sample.
Inclusion criteria for students included the following (1) enrollment in kindergarten, first, or second grade at the beginning of the school year in either a general education or special education classroom; (2) a diagnosis, either clinical or educational, of Autistic Disorder, PDD-NOS, or Asperger Syndrome as defined by the DSM-IV (American Psychiatric Association, 2000); and (3) no presence of severe motor delay/impairment, dual sensory impairment, or history of traumatic brain injury. There were 235 students initially assessed for eligibility. Of these, 38 students were excluded: 21 did not meet inclusion criteria, 6 did not complete diagnostic testing, 4 had teachers who withdrew from the study prior to baseline, and 7 were withdrawn by a parent prior to the start of the study. There were 197 students enrolled in the present study (see the CONSORT flow diagram in Figure 1). All families and teachers gave written informed consent for participation.
Figure 1.
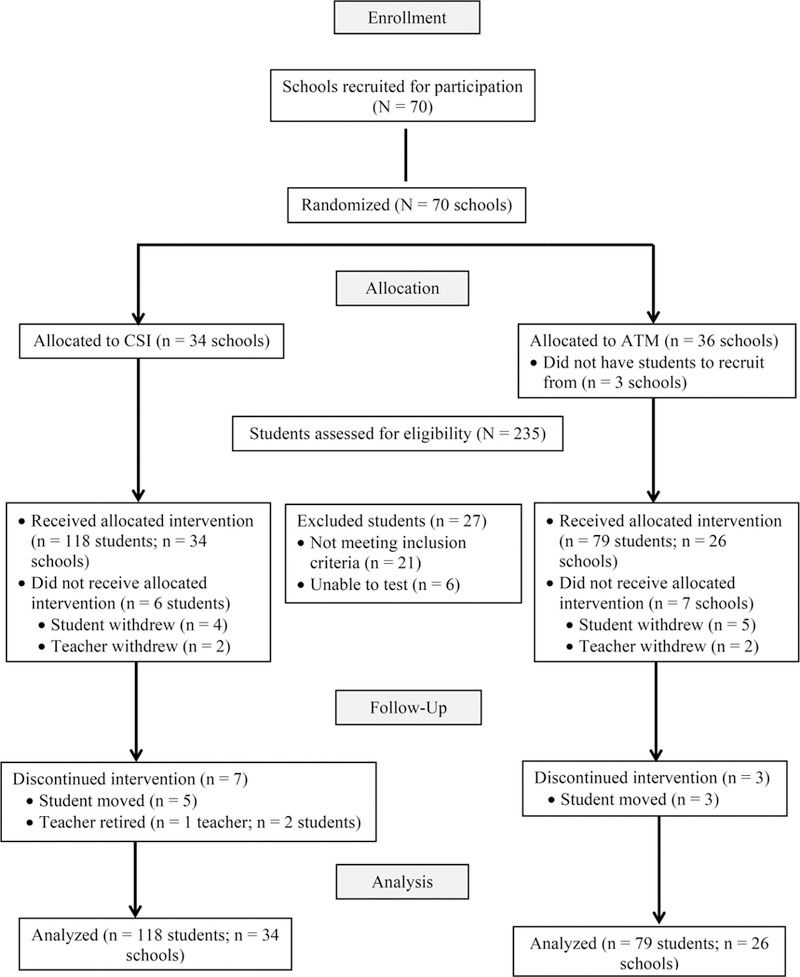
CONSORT flow diagram for school and student assignment. CSI = classroom SCERTS intervention; ATM = Autism Training Modules; CONSORT = consolidated standards of reporting trials.
Baseline demographics and developmental characteristics of the student sample are presented in Table 3. Students enrolled in the study participated in general and special education classrooms, with 40% participating in general education classroom as their primary placement at the beginning of the school year. Primary classroom placement was identified as general education for students who spent 80% or more of their day with peers in a mainstream education classroom. This sample represented the diversity of the population. Student participants were predominately male (81%), which is consistent with the observed 4:1 prevalence ratio for the ASD population (Baio et al., 2018). Distributional differences of demographic variables were nonsignificant (p = .113– .842). The sample showed variability in regard to intellectual functioning and severity of ASD. No significant differences were observed on any of the measures collected at baseline between students in CSI and ATM. Student race, ethnicity, gender, grade and classroom type were also not significantly associated with treatment condition.
Table 3.
Student Demographics and Baseline Only Measures
| Characteristic | CSI (n = 118) |
ATM (n = 79) |
p | d |
|---|---|---|---|---|
| Age | 6.82 (1.07) | 6.77 (1.02) | .722 | .05 |
| Race | .649 | |||
| White | 62.70% | 64.60% | ||
| Black | 11.90% | 12.70% | ||
| Asian | 9.30% | 10.10% | ||
| Multiracial | 8.50% | 3.80% | ||
| Not reported | 7.60% | 8.90% | ||
| Ethnicity | .562 | |||
| Hispanic | 19.50% | 22.80% | ||
| Gender (% male) | 78.80% | 84.80% | .291 | |
| Caregiver age | 31.19 (7.73) | 30.14 (6.28) | .340 | .15 |
| Caregiver education | 15.67 (2.48) | 15.78 (2.36) | .778 | −.05 |
| Grade (%) | .842 | |||
| Kindergarten | 36.40% | 36.70% | ||
| First | 31.40% | 27.80% | ||
| Second | 32.20% | 35.40% | ||
| Primary classroom placement | .133 | |||
| General education | 44.90% | 34.20% | ||
| Specialized classroom | 55.10% | 65.80% | ||
| Pretest measures | ||||
| SB-5 Nonverbal scales | 7.38 (4.27) | 6.23 (4.30) | .065 | .27 |
| SB-5 Verbal scales | 4.55 (3.35) | 4.15 (3.37) | .414 | .12 |
| SB Abbreviated IQ | 75.98(19.87) | 71.37(20.54) | .117 | .23 |
| ADOS SA | 11.46 (3.79) | 11.57 (3.77) | .839 | −.03 |
| ADOS RRB | 3.65 (1.97) | 3.70 (2.01) | .880 | −.03 |
| ADOS Total | 15.11 (4.52) | 15.27 (4.58) | .814 | −.04 |
Note. CSI = Classroom SCERTS Intervention; ATM = Autism Training Modules; SB-5 = Stanford Binet; ADOS = Autism Diagnostic Observation Schedule; SA = social affect; RRB = restricted and repetitive behaviors.
Intervention Conditions
CSI condition.
Teachers completed an initial training and received ongoing, direct coaching throughout the school year to support implementation of CSI within the classroom. While lead teachers, or teachers primarily responsible for students’ attainment of curricular standards, were the primary focus of training and implementation, all members of each student’s educational support team were invited to participate in the 3-day (18-hr) training held near the beginning of the school year. Coaching was provided a minimum of twice monthly and was increased as needed to a maximum of weekly to facilitate successful implementation. Coaching observations were provided both directly and via video. The intervention consisted of an 8-month (school year) test of the application of this model to each student’s classroom setting.
The coaching model used in this study was a classroom adaptation of the Continuum of Adult Learning Supports developed for the ESI Project (Wetherby et al., 2014). The following four-step coaching model was used: (1) identify what is working with direct teaching as needed, (2) guided practice with feedback, (3) teacher practice and reflection with feedback, and (4) teacher independence. Coaches attended the 3-day CSI training as well as a coaching orientation session aimed at sharing the CSI coaching model and operational research procedures. In addition, district coaches held videoconferences two times per month with research staff and project consultants to guide implementation of their coaching.
Three main intervention steps were included in CSI. First was assessment and selection of goals. The teacher conducted an initial assessment informed by the SCERTS Assessment Process to determine student language stage and to identify student objectives. The child’s profile in SC and ER were used to select priority goals and objectives. Second, the CSI Educational Planning Grid was used to integrate goals and supports with target activities. The teacher was guided in these processes as needed by the CSI coach. Third, coaching was provided in order to guide teachers to implement CSI for 25 hr per week across classroom activities with the primary aim of improving students’ AE and social communication. Once initial activities were selected, the teacher and coach completed the SCERTS Practice Principles for Success Checklist for two activities. The teacher practiced implementing the plan during these activities and reviewed the plan with the coach. As implementation in each activity was mastered, additional activities were identified and the process was repeated until CSI was implemented for throughout activities across the school day with the CSI coach reducing support over the course of the year as the teacher demonstrated greater independence in implementation.
ATM.
The ATM condition was a usual school-based education condition. The ATM comprised a wiki-site housing links to collections of training modules developed by the Florida Centers for Autism and Related Disabilities. Modules were designed to support teachers educating students with ASD. Content in the ATM included overview of ASD, a guide to educational programming for students with ASD, and a tutorial on visual supports. Access to these training modules was made available to ATM teachers at the start of the study; however, accessing the site was not required for participation. Beyond providing access to the ATM materials, teachers in this condition were not provided any additional education or coaching.
Treatment Integrity
Measures of treatment fidelity for comprehensive treatments are critical to account for differences between treatment and control groups as well as to ensure the relationship between implementation and intervention outcomes (Odom, Boyd, Hall, & Hume, 2010). Implementation fidelity was assessed using the CSI Teacher Fidelity Measure. This tool was developed by operationalizing 12 transactional supports described in the SCERTS Model (Prizant et al., 2006) that are core components of the CSI treatment. Teaching strategies were categorized under either General, which included common strategies used by NDBIs (e.g., planning for transitions, fostering independence, maintaining student attention) or SCERTS, which included supports for SC (e.g., visual supports, increasing demands, following student focus of attention). Items specified under SCERTS included supports implemented uniquely as part of the CSI intervention, while General supports were considered more typical supports to promote student success in the classroom that are hypothesized as necessary for response to the CSI intervention. Instructor fidelity was scored for both conditions from monthly classroom observation videos that were captured as part of the larger data collection procedures for this study as described below. Dichotomous scoring was used for each item for a maximum of three points across three to five classroom activities, resulting in a total possible score of 15 for the General teaching strategies and 21 for the SCERTS teaching strategies. Teachers were scored on all items. A score of 70% or greater on each, as well as the total score, indicated a teacher was implementing the program with acceptable levels of fidelity. Because there is no consensus on acceptable levels of treatment fidelity in classroom-based interventions (Smith, Daunic, & Taylor, 2007), this level of fidelity was selected as our benchmark given that research on teacher-implemented interventions for students with ASD similar in structure to SCERTS have reported fidelity averages ranging from 48% to 73% (Mandell et al., 2013; Strain & Bovey, 2011; Young et al., 2016). Trained research assistants and project staff unaware of treatment condition conducted all video coding. Interobserver agreement on the CSI Teacher Fidelity Measure was calculated for 35% of the total observations. Mean agreement was 87% and ranged from 75% to 95%.
Outcome Measures
This study utilized a combination of observed and reported measures. The primary outcome measure for this study was a classroom observation of student AE. Reported outcome measures included standardized measures of vocabulary, parent report of adaptive behavior, and teacher report of social skills and executive functioning. Examiners conducting the standardized measures were unaware of treatment condition. All outcome measures were collected at baseline and at the end of treatment.
Active engagement.
The Classroom Measure of Active Engagement (CMAE; Morgan, Wetherby, & Holland, 2010) assesses student AE in the classroom using video-recorded observations. The CMAE components and their operational definitions were adapted from the research version of the CMAE as reported in Sparapani and colleagues (2016). The CMAE rates six AE components: emotion regulation, productivity, social connectedness, directed communication, generative language production, and academic independence that are combined to form two composites:
Instructional Participation and Social Interaction. The first composite comprises the emotion regulation, productivity, and academic independence components. The remaining components—social connectedness, directed communication, and generative language, form the Social Interaction composite. Operational definitions of each component include benchmarks for each rating point and identify specific behaviors the student must display in order to receive the specified rating. Each behavior is scored on a four-point rating scale (ranging from zero to three) with higher scores indicating the behavior was observed for a majority (≥75%) of the video segment.
Video-recorded observations to assess student AE were conducted at baseline and the end of treatment. A project videogra-pher, blind to treatment condition, recorded a 60-min observation of each target student engaging in typical classroom activity. Video release forms were obtained for all students in the classroom. In the event a student’s parent did not give permission for videography, the teacher and videographer were instructed to avoid videoing that particular student. Because of limited resources, the entire video observation could not be coded. Each AE component was rated for the first and last 20% of the video sample (i.e., first and last 12 min of a 60-min observation) to obtain two scores across each component which were summed for each AE component, for a possible score range of zero to six. This segmentation of the video observations was chosen in order to capture at least one start of an activity and one transition between activities. Teachers were instructed to select observation periods each month that would capture the student engaging in at least three usual classroom activities. Activity type was not controlled for, as the CSI intervention was designed to be delivered across all daily events and routines within the school day. Possible activity categories included academics, meals and snacks, transitions, jobs and chores, and so forth. Three undergraduate coders blind to treatment condition, were trained on a separate set of video observations to establish reliability using percent agreement, with a criterion of at least 85% agreement across 10 observation segments of 12 min each. Interrater reliability between coders was calculated using intraclass correlation coefficients (ICCs) for 20% of the total observations. Analyses indicated high agreement for the Instructional Participation (0.78) and moderate agreement for the Social Interaction (0.60). Differences in the ICCs between the two composites were most likely due to differences in the complexity of behaviors being observed, with Social Interaction items being more difficult to score. For example, the academic independence item under Instructional Participation measures the extent to which students are completing tasks with independence while the generative language item under Social Interaction attempts to measure students’ use of novel and increasingly complex language. Both subscales demonstrated preliminary concurrent validity with related measures. Small to large correlations were observed between Instruction Participation and measures of executive functioning, academic competence, and language (r = .22–.53). Small to moderate correlations were observed between Social Interaction and measures of adaptive behavior, social skills, and language (r = .26–.33). A moderate correlation (r = .48) between the two subscales at baseline was observed.
Standardized assessments of language.
The Peabody Picture Vocabulary Test, Fourth Edition (PPVT-4; Dunn & Dunn, 2007) and the Expressive One-Word Vocabulary Picture Test, Fourth Edition (EOWVPT-4; Brownell, 2000) were used to assess general vocabulary development. The PPVT-4 is a norm-referenced measure of receptive vocabulary and the EOWPT-4 is a norm-referenced measure of expressive vocabulary.
Parent report of adaptive behavior.
The Vineland Adaptive Behavior Scales, 2nd Edition (VABS-II; Sparrow, Cichetti, & Balla, 2005) is designed to evaluate skills required for independent living. It is a structured caregiver interview assessing adaptive functioning with standard scores in four domains: Daily Living Skills, Communication, Socialization, and Motor Skills. In addition, the VABS-II includes an Adaptive Behavior Composite (ABC) score, which provides an overall estimate of an individual’s adaptive behavior. The VABS-II has good reported reliability, with alpha coefficients ranging between .80–.89. For this study, the Communication, Daily Living, and Socialization subscales were administered. This measure was previously normed on a large sample of individuals with ASD (Carter et al., 1998) and has been included in studies with school-age samples (e.g., Young et al., 2016).
Teacher report of social skills and executive functioning.
Two measures of social skills and one measure of executive functioning were completed by teacher report. The Social Responsiveness Scale (SRS; Constantino & Gruber, 2005) identifies the presence and extent of social impairment that is typically related to ASD, with higher scores indicating greater severity of social impairment. The SRS has been previously examined in a large sample of school-age children with ASD (Constantino et al., 2007). The Social Skills Rating System (SSRS; Gresham & Elliott, 1990) is a norm-referenced rating scale that assesses student behaviors across three social domains to form three scales: Social Skills, Problem Behaviors, and Academic Competence and has been previously examined in school-age samples of children with ASD (e.g., Macintosh & Dissanayake, 2006). The Behavior Rating Inventory of Executive Function (BRIEF [Teacher form]; Gioia, Isquith, Guy, & Kenworthy, 2000) assesses executive functioning in the school environment and contains 86 items in eight nonoverlapping clinical scales, two validity scales, and an overall composite with higher scores indicating greater impairment in executive functioning. For the purposes of this study, the BRIEF Global Executive Composite scores were analyzed. The BRIEF has also been previously examined in a large sample of children with ASD (Pugliese et al., 2015).
Data Analyses
Analyses were conducted using the statistical program SPSS (IBM SPSS Statistics, IBM Corporation, Version 23). Baseline equivalency was examined through a series of one-way ANOVAs. Distributional differences in proportional demographics were examined using chi-square tests of independence. A series of linear mixed models were fit to examine whether children in the CSI and ATM treatment conditions differed at posttest on standardized measures of AE, language, adaptive behavior, social skills, and executive functioning, after controlling for baseline levels of each construct. Using the SPSS MIXED procedure, models were developed with baseline scores and intervention condition as fixed effects and school as a random effect to account for the nesting of students within schools. In following the intent-to-treat approach, data for all participants was analyzed, regardless of dropout status,using the maximum likelihood estimator, which is appropriate for handling missing data. To examine the relatedness of clustering at the school level, an intraclass correlation coefficient was computed using the following formula:
where represents the variance due to schools and represents the variance due to individuals. Given the large number of secondary analyses, the Benjamini-Hochberg linear step-up procedure was implemented to control for the false discovery rate (Benjamini & Hochberg, 1995).
Results
Preliminary Analyses
Distribution properties were examined using statistical indicators of skewness and kurtosis as well as visual inspection of scatterplots. Both CSI and ATM groups demonstrated normal distribution of residuals across all measures. No outliers were identified. Equivalency at baseline was observed across all measures, indicated by nonsignificant differences between groups (p > .05; see Table 3 and Table 4) with one exception. On the Social Skills subscale of the SSRS, the ATM condition exhibited significantly higher scores at baseline compared with the CSI condition, F(1,184) = 7.23, p = .008 with an on observed effect size of d = −.40. See Table 4 for descriptive statistics and group equivalence on each of the outcome measures for the CSI and ATM groups at baseline.
Table 4.
ANOVA Results for Baseline Means
| Measure | CSI (n = 118) |
ATM (n = 79) |
ANOVA results |
||||
|---|---|---|---|---|---|---|---|
| M | SD | M | SD | F | p | d | |
| CMAE Instructional Participation | 10.81 | 04.47 | 11.46 | 03.88 | 1.05 | .307 | −.15 |
| CMAE Social Interaction | 06.40 | 03.51 | 06.31 | 03.36 | .03 | .865 | .03 |
| PPVT-4 | 76.13 | 22.99 | 73.29 | 22.38 | .71 | .399 | .12 |
| EOWPVT-4a | 100.86 | 14.72 | 98.72 | 15.38 | 1.12 | .291 | −.14 |
| VABS-II Communication | 78.23 | 13.55 | 77.02 | 12.35 | .33 | .569 | −.09 |
| VABS-II Daily Living | 78.77 | 13.92 | 77.57 | 12.21 | .31 | .577 | −.09 |
| VABS-II Socialization | 73.09 | 10.37 | 73.07 | 09.70 | .00 | .991 | .00 |
| VABS-II ABC | 75.08 | 11.22 | 74.43 | 09.96 | .14 | .713 | −.06 |
| SRS Total | 68.91 | 10.86 | 66.49 | 09.25 | 2.42 | .122 | −.24 |
| SSRS Social Skillsa | 98.00 | 14.50 | 103.10 | 15.32 | 5.25 | .023 | −.34 |
| SSRS Problem Behaviorsa | 100.79 | 14.68 | 98.78 | 15.50 | .79 | .375 | −.13 |
| SSRS Academic Competencea | 99.91 | 14.60 | 100.13 | 15.70 | .01 | .922 | – .01 |
| BRIEF GEC | 70.74 | 13.20 | 66.97 | 11.98 | 3.87 | .051 | −.30 |
Note. CSI = Classroom SCERTS Intervention; ATM = Autism Training Modules; ANOVA = analysis of variance; CMAE = Classroom Measure of Active Engagement; PPVT-4 = Peabody Picture Vocabulary Test; EOWPVT-4 = Expressive One Word Picture Vocabulary Test; VABS-II = Vineland Adaptive Behavior Scales; ABC = adaptive behavior composite; SRS = Social Responsiveness Scale; SSRS = Social Skills Rating System; BRIEF = Behavior Rating Inventory of Executive Functioning; GEC = global executive functioning. a Standard score computed from sample’s z scores (controlling for age).
Attrition Summary
Of schools randomized to a treatment condition, 10 dropped out of the study due to low recruitment. Of particular concern is all 10 of the schools that dropped out of the study were in the ATM condition. We conducted an analysis of differential attrition comparing the ATM schools that dropped out to completers in order to ensure that there were no significant differences between these two groups on school demographic variables. The two groups did not differ on any variable (all p > .05), thus we did not identify any systematic differences between the schools dropping out of the study and those that continued to participate.
At the end of the study, the attrition rate for students not completing the study was 5% (n = 10 of 197) overall, 6% (n = 7 of 118) in CSI and 4% (n = 3 of 79) in ATM. All of these students moved during the school year. Examination of differences between study completers and noncompleters did not indicate statistically significant differences on any baseline measures (p = .06 – 1.0, d = 0.00–0.65). Medium effect sizes of differences between these two groups were observed for the SSRS Academic Competence (d = 0.65), SSRS Problem Behaviors (d = 0.56), and small effects for the VABS-II Socialization (d = 0.44), with the students who did not complete the study having a higher average score for the SSRS Problem Behaviors and VABS-II Socialization at baseline. Nonattriting students scored higher on average for the SSRS Academic Competence scale compared with those who attrited. Potential systematic differences between those who completed the study and those who did not were not expected to bias the results of the study as attrition rates fell within the acceptable range determined by the attrition standards of the What Works Clearinghouse (U.S. Department of Education, Institute of Education Sciences, What Works Clearinghouse, 2017). Attrition for teachers was less than 1% (1/129), with one teacher from the CSI condition withdrawing from the study after retiring during the school year.
Teacher Fidelity of Implementation
Fidelity of implementation data are summarized in Table 5. Both conditions demonstrated variability in fidelity scores across categories of teaching strategies at baseline and the end of treatment, evidenced by the wide range in scores. While CSI and ATM demonstrated an increase in mean fidelity scores for the General teaching strategies at the end of the year, only the CSI condition demonstrated an increase in the mean SCERTS fidelity score at the end of the study (4.31 points). At the conclusion of treatment, a majority of teachers in the CSI condition were implementing at 70% fidelity. For the General teaching strategies, a large portion of teachers in both conditions were implementing these strategies with fidelity.
Table 5.
Fidelity of Implementation Measures
| CSI teacher fidelity | CSI |
ATM |
||
|---|---|---|---|---|
| Baseline | End of treatment | Baseline | End of treatment | |
| General teaching strategies | ||||
| M | 11.81 (2.94) | 14.19 (1.20) | 12.55 (2.46) | 13.20 (2.16) |
| Range | 2–15 | 10–15 | 5–15 | 5–15 |
| M implementation (%) | 78.76 (19.61) | 94.57 (8.00) | 83.64 (16.41) | 87.98 (14.40) |
| Implementation range (%) | 13–100 | 67–100 | 33–100 | 33–100 |
| Teachers meeting ≥ 70% fidelity | 71.20% | 93.20% | 74.70% | 83.50% |
| SCERTS teaching strategies | ||||
| M | 10.69 (3.84) | 14.99 (3.40) | 11.75 (3.80) | 10.55 (3.55) |
| Range | 2–19 | 5–21 | 4–20 | 1–17 |
| M implementation (%) | 50.93 (18.30) | 71.39 (16.17) | 55.94 (18.09) | 50.25 (16.90) |
| Implementation range (%) | 10–90 | 24–100 | 20–95 | 5–81 |
| Teachers meeting ≥ 70% fidelity | 17.80% | 60.20% | 25.30% | 15.20% |
| Total fidelity | ||||
| M | 22.51 (6.17) | 29.18 (4.16) | 24.29 (5.37) | 23.75 (5.13) |
| Range | 5–32 | 16–36 | 12–35 | 11–32 |
| M implementation (%) | 62.52 (17.15) | 81.05 (11.54) | 67.48 (14.92) | 65.97 (14.25) |
| Implementation range (%) | 14–89 | 44–100 | 33–97 | 31%–89% |
| Teachers meeting ≥ 70% fidelity | 37.30% | 78.00% | 45.60% | 41.80% |
Note. CSI = Classroom SCERTS Intervention; ATM = Autism Training Modules.
Treatment Effects
Table 6 summarizes covariate-adjusted means, standard deviations, and the mixed model results of differences between conditions on outcome measures at the conclusion of treatment. Effect sizes (Cohen’s d) were computed using the observed pooled posttest standard deviations as the denominator and the covariate-adjusted means in the numerator. Confidence intervals for the effect sizes were computed for each outcome.
Table 6.
Linear Mixed Model Results and Adjusted End of Treatment Means
| Measure | CSI (n = 118) |
ATM (n = 79) |
Linear mixed model results |
|||||
|---|---|---|---|---|---|---|---|---|
| Ma | SD | Ma | SD | F | p | db[CI] | ICC | |
| CMAE Instructional Participation | 12.59 | 3.85 | 11.49 | 4.26 | 3.64 | .062 | .27 [−.02, .56] | .13 |
| CMAE Social Interaction | 7.65 | 3.56 | 6.43 | 3.52 | 6.24 | .016 | .34 [.06, .63] | .01 |
| PPVT-4 | 79.16 | 20.77 | 79.25 | 25.81 | .00 | .948 | .00 [−.29, .30] | .04 |
| EOWPVT-4d | 82.90 | 14.04 | 81.57 | 16.15 | .94 | .334 | .09 [−.20, .38] | — |
| VABS-II Communication | 78.66 | 13.48 | 74.70 | 11.95 | 6.63 | .011 | .31 [−.05, .67] | — |
| VABS-II Daily Living | 79.87 | 12.82 | 78.24 | 10.34 | .90 | .350 | .14 [−.22, .49] | .09 |
| VABS-II Socialization | 74.89 | 12.05 | 71.76 | 12.77 | 2.38 | .131 | .25 [−.10, .61] | .34 |
| VABS-II ABC | 76.18 | 11.28 | 72.67 | 10.03 | 4.42 | .042c | .32 [.01, .75] | .31 |
| SRS Total | 62.92 | 10.52 | 67.20 | 9.28 | 18.79 | .000 | .43 [.12, .74] | — |
| SSRS Social Skillsd | 102.90 | 15.76 | 96.22 | 13.80 | 11.93 | .001 | .45 [.14, .75] | .02 |
| SSRS Problem Behaviorsd | 97.69 | 14.61 | 103.31 | 15.32 | 10.84 | .002 | .38 [.07, .68] | .02 |
| SSRS Academic Competenced | 101.15 | 15.06 | 99.07 | 14.95 | 1.91 | .169 | .14 [−.16, .44] | — |
| BRIEF GEC | 64.44 | 14.17 | 69.86 | 12.82 | 11.96 | .001 | .40 [.09, .70] | .06 |
Note. Dashes indicate that the intraclass correlation coefficient (ICC) could not be computed because of lack of variance. CSI = Classroom SCERTS Intervention; ATM = Autism Training Modules; CI = confidence interval; CMAE = Classroom Measure of Active Engagement; PPVT-4 = Peabody Picture Vocabulary Test; EOWPVT-4 = Expressive One Word Picture Vocabulary Test; VABS-II = Vineland Adaptive Behavior Scales; ABC = adaptive behavior composite; SRS = Social Responsiveness Scale; SSRS = Social Skills Rating System; BRIEF = Behavior Rating Inventory of Executive Functioning; GEC = global executive functioning.
Means adjusted by pretest.
d = Cohen’s measure of effect size.
Nonsignificant after Benjamini-Hochberg procedure (critical p = .03).
Standard score computed from sample’s z score.
Active engagement.
Results of the Instructional Participation composite was nonsignificant, though the CSI group demonstrated an increase in scores at the conclusion of the school year. Analysis of the Social Interaction composite revealed the CSI group demonstrated significantly higher scores at the end of treatment with a small to moderate effect size, F(1, 49.57) = 6.24, p < .05, d = .34. Measures of ICC indicated little to no clustering effect across the subscales of the CMAE.
Vocabulary.
Eight students in the CSI condition were administered a different edition of the PPVT and the EOWPVT (third) at the beginning of the school year. All of these students were administered the current edition of each assessment at the end of treatment. To examine possible effects of this, two models were run: one in which these students were included and one in which they were considered missing. Differences in output between the models were minimal. Therefore, data from these eight students were included in the final model. Analysis of the PPVT results at the end of treatment revealed no significant differences between treatment groups on change in receptive language scores. For the EOWPVT, 39 students obtained raw scores below the standard score range of the test at either baseline or end of treatment. To address this, a standard score based on the sample raw score mean and standard deviation was computed from their z-score. Because the EOWPVT was normed based on age, student age was also included in the model as a covariate. Linear mixed model results indicated no difference between treatment groups at the conclusion of the school year, F(1, 179) = .94, p = .33 and no clustering effect due to schools.
Parent-reported measures.
At the end of treatment, students in CSI made significantly greater gains than students in ATM on the Vineland Communication subscale, F(1, 116) = 6.63, p < .05, d = .31. Differences between conditions on the Adaptive Behavior Composite were initially significant; however, this difference was no longer significant after application of the Benjamini-Hochberg correction. No differences between treatment groups were observed for the Daily Living and Socialization subscales of the VABS-II. Potential clustering effects were observed for the VABS Socialization subscale indicated by 34% of the variance in results being explained by school. This pattern was not observed for the other subscales of the VABS.
Teacher-reported measures.
Similar to the EOWPVT, a small number of students (n = 12) obtained raw scores on the SSRS beyond the manual’s standard score scale. The same protocol was implemented for each subscale of the SSRS; however, student age was not added as a covariate in the model because the SSRS is standardized by grades K thru sixth together, not by age. Students in the CSI treatment condition showed significantly greater gains in social skills as measured by the SSRS-Social Skills subscale and SRS Total Score while controlling for baseline equivalency with small to moderate effect sizes (d = 0.45 and d = –0.43, respectively) and remained significant after comparison to the adjusted p value. Additionally, students in the active treatment group displayed significantly larger decreases in problematic behaviors on the SSRS-Problem Behavior subscale at the end of treatment, F(1, 52.63) = 10.46, p < .01, d = −.36. Analyses also indicated significant differences in executive functioning between the two groups at the conclusion of study as indicated by the Global Executive Composite of the BRIEF, F(1, 57.11) = 11.96, p < .001, d = −.40 that remained significant after multiple comparison correction. Students in CSI exhibited a 6.3-point (with adjustment) decrease in executive impairment scores compared with a 2.89-point increase in scores by those in ATM.
Discussion
The primary aim of this study was to evaluate whether, after eight months of treatment, kindergarten—second-grade students with ASD whose teachers received CSI training and coaching showed significant improvement across a variety of measures, both observed and reported, compared with the outcomes of students with ASD whose teachers were randomized to usual school-based education with ATM as a control condition. Analyses revealed significantly higher outcomes in social participation, adaptive communication, social skills, reduction of problem behavior, and executive functioning for students in CSI classrooms as compared with students in ATM classrooms. Though effects are modest across significant outcomes, the results provide initial efficacy of a novel approach to address the unique needs of students with ASD across multiple dimensions in the public education setting.
By demonstrating the effects of a manualized, comprehensive intervention occurring in the context of the real-world classroom setting implemented by classroom teachers, this study contributes to the literature in three main ways. First, this is one of the largest school-based teacher-implemented CRTs for students with ASD that has been conducted to date. The breadth of schools, both geographically and demographically, as well as the variability of race, ethnicity, cognitive level, and presentation of ASD symptoms that participated in this study adds to the generalizability of these findings to the greater population of elementary students with ASD (Dingfelder & Mandell, 2011).
Direct observation allows us the unique advantage of documenting whether change is occurring within the target context, in this case the classroom (Kasari & Smith, 2013). Importantly, we were able to use classroom video recordings to directly observe changes in student active engagement specific to social interaction. With this measure, we attempted to capture a representative snapshot of students’ level of active engagement in the classroom. Our interpretation of the finding that students in CSI improved in social interaction is that teachers in CSI were able in increase classroom social demands, while maintaining student productivity. Although novel, the Social Participation subscale of the CMAE includes dimensions of social communication identified as significant predictors of improved adult outcome in longitudinal studies including increased social reciprocity (Howlin, Moss, Savage, & Rutter, 2013) and language ability (Gillespie-Lynch et al., 2012; Sigman & McGovern, 2005). Further, we observed small to moderate associations between measures of verbal ability, adaptive behavior, and social skills at baseline (see the preceding text). These relationships remained at the end of the school year (not reported). Additional research validating the CMAE is necessary; however, continued growth in this domain may contribute to improving some of the poor outcomes individuals with ASD continue to achieve in adulthood (Howlin & Magiati, 2017).
Second, students receiving CSI performed better than their comparison peers on five different outcome measures used in this study. In this CRT, we employed standardized assessments, teacher and parent report, as well as direct observation of student behavior, providing for an array of measures of intervention effects across multiple domains that may contribute to students’ success within the education setting. Further, to understand the promise of these results, it is helpful to examine whether comparable effects have been demonstrated in other community-based treatment research including children with ASD. While significant outcomes of teacher-implemented interventions have been reported for preschool children with ASD (Strain & Bovey, 2011; Young et al.,2016), teacher-implemented treatment studies for students with ASD in elementary school have reported either no main effects (e.g., Mandell et al., 2013) or small to medium effects on child outcomes (e.g., Wong, 2013). Taken together, the results of this study suggest a net effect of CSI as contributing to increases in social skills and decreases in problem behavior compared with usual school-based education.
Although it is reasonable to consider whether these effects are meaningful enough to warrant the time and resources needed to implement interventions of this nature in public school settings, further research is needed to guide effect size expectations for interventions focused on this population. In tandem to this, additional inquiry is needed to determine strategies for strengthening intervention impact. Strategies that have the potential to enhance intervention effects include evaluating treatment delivery across multiple school years, focusing evaluation on students whose teachers implement with high levels of fidelity, employing cost-saving options such as web-based training, and bolstering teacher implementation by focusing training more on challenging aspects of fidelity.
Sixty percent of CSI teachers achieved acceptable levels of implementation fidelity on SCERTS teaching strategies by the end of the study. While this level of implementation is not ideal, it should be considered in context of the challenges associated with public school implementation, the amount of teacher training provided, and the nature of the intervention itself. First, challenges in meeting fidelity have been reported in public school settings (Mandell et al., 2013; Strain & Bovey, 2011). Mandell and colleagues reported that teachers averaged 57% and 48% program fidelity across the two conditions being examined. Similarly, after one year of a 2-year intervention of LEAP in preschool classrooms serving children with ASD, Strain and Bovey (2011) reported levels of fidelity averaging 53% for LEAP condition teachers; though, teachers were able to reach an average fidelity of 83% after 2 years. Because the measure of fidelity in both of these studies focused on quality of implementation and our measure of fidelity provided a gauge of intervention intensity, direct comparisons across studies is limited. Nonetheless, these rates speak to the challenges of conducting research and achieving implementation fidelity in school settings and supporting as well as demonstrating the transfer of efficacious practice to the classroom.
Factors Impacting Intervention Implementation
Obtaining indicators of intervention quantity and quality is an important first step in dismantling an intervention package. This allows for future research to examine the role of individual intervention components in explaining intervention outcomes and determining the active ingredients of a comprehensive intervention. Further, understanding of the active ingredients of an intervention is important for investigating heterogeneity in treatment response in this population. While optimal, this approach to examining fidelity is costly and was beyond the scope of the current study. Future research is needed to examine indicators of intervention quality and quantity as well as the distinct role of individual intervention components in explaining intervention outcomes.
Second, it is important to consider levels of implementation fidelity relative to density of teacher training. Mandell and colleagues (2013) reported that teachers received 28 hr of intensive workshops, assistance with classroom setup, and eight additional days of coaching provided at the beginning and throughout the school year (Mandell et al., 2013). Strain and Bovey (2011) reported similar levels of training provided over a 2-year time period. Teachers in the CSI condition received a 3-day (12-hr) training at the beginning of the school year and ongoing coaching for about 1 hr per week throughout the school year. Relative to the training required for other models, our data suggest that CSI can be effectively implemented with less hours of training and coaching required for teachers. This piece is critical because it has implications not only for the actual effective implementation of the intervention, but, in a practical sense, the amount of teacher training that school systems are able to accommodate in order to support implementation of evidence-based practices.
Finally, the complexity of an intervention as well as its structure may affect teachers’ implementation success. For example, in an examination of teacher implementation across three intervention types, fidelity rates were highest for the most structured and prescriptive intervention and were lowest in the intervention that required skills in clinical judgment (Stahmer et al., 2015). Rather than having prescribed activities with a specified set of procedures, CSI is implemented within existing classroom activities so that aspects of the intervention are infused as appropriate. One benefit of this approach is that the regular classroom schedule and teaching content do not have to be altered. It is possible, however, that CSI’s embedded approach to intervention may create challenges with respect to both implementation fidelity and its measurement. Because there is not a prescribed list of intervention steps to complete, an embedded approach requires in vivo focus and decision-making in order to appropriately infuse intervention strategies. Flexibility in using the right intervention strategies at the right time, creates measurement challenges. For example, a teacher having expertise in all of the CSI strategies may realize that certain strategies are not a good fit during certain types of activities. As a result, all strategies likely are not implemented in all activities throughout the entire school day. Rather, intervention strategies are selected and implemented as they fit best resulting in the possibility that the teacher’s level of model implementation may be underestimated by our approach to measurement. Thus, fidelity in an embedded model is more complex than in a more structured approach in terms of both implementation and measurement.
The need for interventions to be tested with teachers as agents of delivery has been recently emphasized (Cook & Odom, 2013; Dingfelder & Mandell, 2011; Kasari & Smith, 2013). This study adds to the teacher-implementation literature by showing that Kindergarten-second grade teachers, in both general and special education, can learn to implement CSI that results in positive change on a number of student outcomes. Further, we achieved this as evidenced by the majority of teachers sufficiently meeting fidelity at the end of the study, with levels of training and coaching that are feasible for public school systems to implement.
Limitations and Future Directions
Although this study was implemented with rigor, there are a few notable limitations. By comparing CSI to a usual school-based education, we may have limited the size of the between group differences. Although direct observation of student behavior is consistent with teacher and parent report, it is important to note that parents and teachers were aware of student treatment condition and therefore the potential for bias cannot be ruled out. Data were not collected on the access and usage rates of the training modules provided for the ATM condition. This prevents a full reporting of what training teachers in ATM actually received and how that training may have impacted classroom practice. Furthermore, lack of information on class size prevents analysis of how this variable may relate to levels of teacher implementation and treatment effects. The number of students attaining standard scores beyond the range of the EOWPVT and SSRS measures also limits our ability to compare this sample to other study samples. Additionally, rates of interrater reliability were low for the Social Interaction composite of our measure of AE. This reflects the presence of noise in the measure and may be related to the modesty of treatment effects observed. Finally, this study measured outcomes at the end of treatment only. Lack of student assessment at additional time points following treatment, limits our ability to evaluate long-term effects of the intervention as well as sustainability of model implementation. Future directions of this research will include analysis of mediators and moderators of treatment effects. It will be important to examine whether particular teacher and student characteristics influenced treatment outcome and how levels of treatment fidelity impacted student outcomes. Additionally, future research should explore strategies for improving teacher rates of implementation and for enhancing intervention impact of CSI on student outcomes.
Conclusions
We are faced with a number of challenges in educating children with ASD in public school settings. There is a lack of evidence-based models applied at the elementary level. This study provides evidence of the effectiveness of the CSI model, a teacher- implemented, classroom-based intervention for elementary students with ASD, contributing to the limited body of research on school-based treatments for students with ASD. That is, compared with ATM, students with ASD showed more growth on several educationally relevant variables. In light of the amount of contact time that teachers have with their students and the increased likelihood of sustainability, teacher-implemented interventions have the potential to lead to better outcomes for students with ASD. There is a pressing need to change the landscape of education for school-age students with ASD. This work has the potential to contribute to this change by providing a feasible, comprehensive model of intervention that can be implemented in a variety of educational placements and settings.
What is the public health significance of this article?
This study highlights the potential of a teacher-mediated, classroom-based intervention for young students with ASD. Findings suggest that classroom teachers can effectively implement a comprehensive educational program for elementary students with ASD that results in better outcomes relative to standard educational programming. This study demonstrates that a teacher-implemented intervention can have positive effects on a diverse population of students with ASD in a variety of placements.
Acknowledgments
This research was supported by Grant R324A100174 from the Institute of Education Sciences, U.S. Department of Education, to the Florida State University. The opinions expressed are those of the authors, not the funding agency, and no official endorsement should be inferred.
We are deeply grateful for the participation of the teachers, students, and their families. We also wish to acknowledge the support and assistance of Emily Rubin, Amy Laurent, our district champions and coaches, and our research staff.
Contributor Information
Lindee Morgan, Department of Clinical Sciences, Autism Institute, College of Medicine, Florida State University; Department of Pediatrics, School of Medicine, Emory University..
Jessica L. Hooker, School of Communication Science and Disorders, Florida State University School of Education, MIND Institute, University of California, Davis..
Nicole Sparapani, School of Communication Science and Disorders, Florida State University; MIND Institute, Department of Psychiatry and Behavioral Sciences, University of California, Davis..
Vanessa P. Reinhardt, Department of Psychology, Florida State University
Chris Schatschneider, Department of Psychology, Florida Center for Reading Research, Florida State University.
Amy M. Wetherby, Department of Clinical Sciences, Autism Institute, College of Medicine, Florida State University.
References
- Aldred C, Green J, & Adams C (2004). A new social communication intervention for children with autism: Pilot randomised controlled treatment study suggesting effectiveness. Journal of Child Psychology and Psychiatry, and Allied Disciplines, 45, 1420–1430. 10.1111/j.1469-7610.2004.00338.x [DOI] [PubMed] [Google Scholar]
- American Psychiatric Association. (2000). Diagnostic and statistical manual of mental disorders (4th ed., text rev.). Washington, DC: Author. [Google Scholar]
- Arick JR, Loos L, Falco R, & Krug DA (2004). The STAR Program: Strategies for teaching based on autism research, Levels I, II, & III. Austin, TX: Pro-Ed. [Google Scholar]
- Baio J, Wiggins L, Christensen DL, Maenner MJ, Daniels J, Warren Z, … Dowling NF (2018). Prevalence of autism spectrum disorder among children aged 8 years – Autism and developmental disabilities monitoring network, 11 Sites, United States, 2014. MMWR Surveillance Summaries, 67, 1–23. 10.15585/mmwr.ss6706a1 [DOI] [PMC free article] [PubMed] [Google Scholar]
- Benjamini Y, & Hochberg Y (1995). Controlling the false discovery rate – a new and powerful approach to multiple testing. Journal of the Royal Statistical Society Series B, Methodological, 57, 289–300. [Google Scholar]
- Boyd BA, Hume K, McBee MT, Alessandri M, Gutierrez A, Johnson L, … Odom SL (2014). Comparative efficacy of LEAP, TEACCH, and non-model specific special education classrooms for preschoolers with autism spectrum disorders. Journal of Autism and Developmental Disorders, 44, 366–380. [DOI] [PubMed] [Google Scholar]
- Brownell R (Ed.). (2000). Expressive One-Word Picture Vocabulary Test. Novato, CA: Academic Therapy Publications. [Google Scholar]
- Bryan LC, & Gast DL (2000). Teaching on-task and on-schedule behaviors to high-functioning children with autism via picture activity schedules. Journal of Autism and Developmental Disorders, 30, 553–567. 10.1023/AT005687310346 [DOI] [PubMed] [Google Scholar]
- Carter AS, Volkmar FR, Sparrow SS, Wang JJ, Lord C, Dawson G, … Schopler E (1998). The Vineland Adaptive Behavior Scales: Supplementary norms for individuals with autism. Journal of Autism and Developmental Disorders, 28, 287–302. 10.1023/A:1026056518470 [DOI] [PubMed] [Google Scholar]
- Constantino J, & Gruber CP (2005). Social Responsiveness Scale (SRS) manual. Los Angeles, CA: Western Psychological Services. [Google Scholar]
- Constantino JN, Lavesser PD, Zhang Y, Abbacchi AM, Gray T, & Todd RD (2007). Rapid quantitative assessment of autistic social impairment by classroom teachers. Journal of the American Academy of Child and Adolescent Psychiatry, 46, 1668–1676. 10.1097/chi.0b013e318157cb23 [DOI] [PubMed] [Google Scholar]
- Cook BG, & Odom SL (2013). Evidence-based practices and implementation science in special education. Exceptional Children, 79, 135–144. 10.1177/001440291307900201 [DOI] [Google Scholar]
- Dingfelder HE, & Mandell DS (2011). Bridging the research-to- practice gap in autism intervention: An application of diffusion of innovation theory. Journal of Autism and Developmental Disorders, 41, 597–609. 10.1007/s10803-010-1081-0 [DOI] [PMC free article] [PubMed] [Google Scholar]
- DiPerna JC, Volpe RJ, & Elliott SN (2002). A model of academic enablers and elementary reading/language arts achievement. School Psychology Review, 31, 298–312. [Google Scholar]
- Dunn LM, & Dunn DM (2007). PPVT-4: Peabody Picture Vocabulary Test. Bloomington, MN: Pearson Assessments. [Google Scholar]
- Elder JP, Perry CL, Stone EJ, Johnson CC, Yang M, Edmund- son EW, … Parcel GS (1996). Tobacco use measurement, prediction, and intervention in elementary schools in four states: The CATCH Study. Preventive Medicine, 25, 486–494. 10.1006/pmed.1996.0080 [DOI] [PubMed] [Google Scholar]
- Felner RD, Favazza A, Shim M, Brand S, Gu K, & Noonan N (2001). Whole school improvement and restructuring as prevention and promotion. Journal of School Psychology, 39, 177–202. 10.1016/S0022-4405(01)00057-7 [DOI] [Google Scholar]
- Fixsen DL, Naoom SF, Blasé KA, Friedman RM, & Wallace F (2005). Implementation research: A synthesis of the literature Tampa, FL: University of South Florida, Louis de la Parte Florida Mental Health Institute, The National Implementation Research Network. [Google Scholar]
- Gillespie-Lynch K, Sepeta L, Wang Y, Marshall S, Gomez L, Sigman M, & Hutman T (2012). Early childhood predictors of the social competence of adults with autism. Journal of Autism and Developmental Disorders, 42, 161–174. 10.1007/s10803-011-1222-0 [DOI] [PMC free article] [PubMed] [Google Scholar]
- Gioia GA, Isquith PK, Guy SC, & Kenworthy L (2000). Behavior Rating of Executive Function. Lutz, FL: Psychological Assessment Resources. [Google Scholar]
- Gordon K, Pasco G, McElduff F, Wade A, Howlin P, & Charman T (2011). A communication-based intervention for nonverbal children with autism: What changes? Who benefits? Journal of Consulting and Clinical Psychology, 79, 447–457. 10.1037/a0024379 [DOI] [PubMed] [Google Scholar]
- Gresham FM, & Elliott SN (1990). Social Skills Rating System: Preschool, elementary level. New York, NY: American Guidance Service. [Google Scholar]
- Howlin P, & Magiati I (2017). Autism spectrum disorder: Outcomes in adulthood. Current Opinion in Psychiatry, 30, 69–76. 10.1097/YC0.0000000000000308 [DOI] [PubMed] [Google Scholar]
- Howlin P, Moss P, Savage S, & Rutter M (2013). Social outcomes in mid- to later adulthood among individuals diagnosed with autism and average nonverbal IQ as children. Journal of the American Academy of Child and Adolescent Psychiatry, 52, 572–581. 10.1016/j.jaac.2013.02.017 [DOI] [PubMed] [Google Scholar]
- Individuals with Disabilities Education Act, 20 U.S. C. § 1400 (2004). Interagency Autism Coordinating Committee. (2014). IACC strategic plan for autism spectrum disorder research—2013 update. Retrieved from http://iacc.hhs.gov/strategic-plan/2013/index.shtml [Google Scholar]
- Iovannone R, Dunlap G, Huber H, & Kincaid D (2003). Effective educational practices for students with autism spectrum disorders. Focus on Autism and Other Developmental Disabilities, 18, 150–165. 10.1177/10883576030180030301 [DOI] [Google Scholar]
- Kasari C, & Smith T (2013). Interventions in schools for children with autism spectrum disorder: Methods and recommendations. Autism: An International Journal of Research and Practise, 17, 254–267. 10.1177/1362361312470496 [DOI] [PubMed] [Google Scholar]
- Kazdin AE, & Nock MK (2003). Delineating mechanisms of change in child and adolescent therapy: Methodological issues and research recommendations. Journal of Child Psychology and Psychiatry, and Allied Disciplines, 44, 1116–1129. 10.1111/1469-7610.00195 [DOI] [PubMed] [Google Scholar]
- Locke J, Shih W, Kretzmann M, & Kasari C (2016). Examining playground engagement between elementary school children with and without autism spectrum disorder. Autism: An International Journal of Research and Practise, 20, 653–662. 10.1177/1362361315599468 [DOI] [PMC free article] [PubMed] [Google Scholar]
- Lord C, Rutter M, DiLavore P, & Risi S (2002). Autism Diagnostic Observation Schedule—Generic. Los Angeles, CA: Western Psychological Services. [Google Scholar]
- Macintosh K, & Dissanayake C (2006). Social skills and problem behaviours in school aged children with high-functioning autism and Asperger’s Disorder. Journal of Autism and Developmental Disorders, 36, 1065–1076. 10.1007/s10803-006-0139-5 [DOI] [PubMed] [Google Scholar]
- Mandell DS, Stahmer AC, Shin S, Xie M, Reisinger E, & Marcus SC (2013). The role of treatment fidelity on outcomes during a randomized field trial of an autism intervention. Autism: An International Journal of Research and Practice, 17, 281–295. 10.1177/1362361312473666 [DOI] [PMC free article] [PubMed] [Google Scholar]
- Mesibov G, Shea V, & Schopler E (2005). The TEACCH approach to autism spectrum disorders. New York, NY: Springer Science. [Google Scholar]
- Morgan L, Wetherby A, & Holland R (2010). Classroom measure of active engagement and transactional supports Unpublished manuscript, Department of Clinical Sciences, Autism Institute, College of Medicine, Florida State University, Tallahassee, FL. [Google Scholar]
- National Research Council. (2001). Educating children with autism. Washington, DC: National Research Council Committee on Educational Interventions for Children with Autism. [Google Scholar]
- Nicholson H, Kehle T, Bray M, & Van Heest J (2011). The effects of antecedent physical activity on the academic engagement of children with autism spectrum disorder. Psychology in the Schools, 48, 198–214. 10.1002/pits.20537 [DOI] [Google Scholar]
- Odgaard EC, & Fowler RL (2010). Confidence intervals for effect sizes: Compliance and clinical significance in the Journal of Consulting and Clinical Psychology. Journal of Consulting and Clinical Psychology, 78, 287–297. 10.1037/a0019294 [DOI] [PubMed] [Google Scholar]
- Odom SL, Boyd BA, Hall LJ, & Hume K (2010). Evaluation of comprehensive treatment models for individuals with autism spectrum disorders. Journal of Autism and Developmental Disorders, 40, 425–436. 10.1007/s10803-009-0825-1 [DOI] [PubMed] [Google Scholar]
- Odom SL, Boyd BA, Hall LJ, & Hume KA (2014). Comprehensive treatment models for children and youth with autism spectrum disorders In Volkmar FR, Rogers SJ, Paul R, & Pelphrey KA (Eds.), Handbook of autism and pervasive developmental disorders: Assessment, interventions, and policy (Vol. 2, 4th ed.; pp. 770–787). Hoboken, NJ: Wiley. [Google Scholar]
- Parsons S, Guldberg K, MacLeod A, Jones G, Prunty A, & Balfe T (2011). International review of the evidence on best practice in educational provision for children on the autism spectrum. European Journal of Special Needs Education, 26, 47–63. 10.1080/08856257.2011.543532 [DOI] [Google Scholar]
- Prizant BM, Wetherby AM, Rubin E, Laurent AC, & Rydell JP(2006). The SCERTS model: Volume I Assessment; Volume II program planning and intervention. Baltimore, MD: Brookes Publishing. [Google Scholar]
- Pugliese CE, Anthony L, Strang JF, Dudley K, Wallace GL, & Kenworthy L (2015). Increasing adaptive behavior skill deficits from childhood to adolescence in autism spectrum disorder: Role of executive function. Journal of Autism and Developmental Disorders, 45, 1579–1587. 10.1007/s10803-014-2309-1 [DOI] [PMC free article] [PubMed] [Google Scholar]
- Rogers SJ, & Vismara LA (2008). Evidence-based comprehensive treatments for early autism. Journal of Clinical Child and Adolescent Psychology, 37, 8–38. 10.1080/15374410701817808 [DOI] [PMC free article] [PubMed] [Google Scholar]
- Roid GH (2003). Stanford-Binet Intelligence Scale (5th ed.). Itasca, IL: Riverside Publishing. [Google Scholar]
- Ruble LA, & Robson DM (2007). Individual and environmental determinants of engagement in autism. Journal of Autism and Developmental Disorders, 37, 1457–1468. 10.1007/s10803-006-0222-y [DOI] [PubMed] [Google Scholar]
- Sanetti LMH, & Kratochwill TR (2009). Toward developing a science of treatment integrity: Introduction to the special series. School Psychology Review, 38, 445–459. [Google Scholar]
- Schreibman L, Dawson G, Stahmer AC, Landa R, Rogers SJ, McGee GG, … Halladay A (2015). Naturalistic developmental behavioral interventions: Empirically validated treatments for autism spectrum disorder. Journal of Autism and Developmental Disorders, 45, 2411–2428. 10.1007/s10803-015-2407-8 [DOI] [PMC free article] [PubMed] [Google Scholar]
- Sigman M, & McGovern CW (2005). Improvement in cognitive and language skills from preschool to adolescence in autism. Journal of Autism and Developmental Disorders, 35, 15–23. 10.1007/s10803-004-1027-5 [DOI] [PubMed] [Google Scholar]
- Siller M, & Sigman M (2002). The behaviors of parents of children with autism predict the subsequent development of their children’s communication. Journal of Autism and Developmental Disorders, 32, 77–89. 10.1023/A:1014884404276 [DOI] [PubMed] [Google Scholar]
- Smith SW, Daunic AP, & Taylor GG (2007). Treatment fidelity in applied educational research: Expanding the adoption and application of measures to ensure evidence-based practice. Education & Treatment of Children, 30, 121–134. 10.1353/etc.2007.0033 [DOI] [Google Scholar]
- Snyder TD, de Brey C, & Dillow SA (2016). Digest of Education Statistics2014 (NCES 2016–006). Washington, DC: National Center for Education Statistics, Institute of Education Sciences, U.S. Department of Education. [Google Scholar]
- Sparapani N, Morgan L, Reinhardt VP, Schatschneider C, & Weth- erby AM (2016). Evaluation of classroom active engagement in elementary students with autism spectrum disorder. Journal of Autism and Developmental Disorders, 46, 782–796. 10.1007/s10803-015-2615-2 [DOI] [PubMed] [Google Scholar]
- Sparrow SS, Cichetti DV, & Balla DA (2005). Vineland Adaptive Behavior Scales (2nd ed.) Bloomington, MN: Pearson Assessment. [Google Scholar]
- Stahmer AC, Reed S, Lee E, Reisinger EM, Connell JE, & Mandell DS (2015). Training teachers to use evidence-based practices for autism: Examining procedural implementation fidelity. Psychology in the Schools, 52, 181–195. 10.1002/pits.21815 [DOI] [PMC free article] [PubMed] [Google Scholar]
- Strain PS, & Bovey EH II. (2011). Randomized, controlled trial of the LEAP Model of early intervention for young children with autism spectrum disorders. Topics in Early Childhood Special Education, 31, 133–154. 10.1177/0271121411408740 [DOI] [Google Scholar]
- U.S. Department of Education, Institute of Education Sciences, What Works Clearinghouse. (2017). What works clearinghouse standards handbook; (Version 4.0). Retrieved from https://ies.ed.gov/ncee/wwc/Docs/referenceresources/wwc_standards_handbook_v4.pdf [Google Scholar]
- Wetherby AM, Guthrie W, Woods J, Schatschneider C, Holland RD, Morgan L, & Lord C (2014). Parent-implemented social intervention for toddlers with autism: An RCT. Pediatrics, 134, 1084–1093. 10.1542/peds.2014-0757 [DOI] [PMC free article] [PubMed] [Google Scholar]
- Wetherby A, & Woods J (2006). Effectiveness of early intervention for children with autism spectrum disorders beginning in the second year of life. Topics in Early Childhood Special Education, 26, 67–82. 10.1177/02711214060260020201 [DOI] [Google Scholar]
- Wetherby AM, Woods J, Allen L, Cleary J, Dickinson H, & Lord C (2004). Early indicators of autism spectrum disorders in the second year of life. Journal of Autism and Developmental Disorders, 34, 473–493. 10.1007/s10803-004-2544-y [DOI] [PubMed] [Google Scholar]
- Wong CS (2013). A play and joint attention intervention for teachers of young children with autism: A randomized controlled pilot study. Autism: An International Journal of Research and Practise, 17, 340–357. 10.1177/1362361312474723 [DOI] [PubMed] [Google Scholar]
- Wong C, Odom SL, Hume K, Cox AW, Fettig A, Kucharczyk S, … Schultz TR (2015). Evidence-based practices for children, youth, and young adults with autism spectrum disorder. Chapel Hill: The University of North Carolina. [DOI] [PubMed] [Google Scholar]
- Young HE, Falco RA, & Hanita M (2016). Randomized, controlled trial of a comprehensive program for young students with autism spectrum disorder. Journal of Autism and Developmental Disorders, 46, 544–560. 10.1007/s10803-015-2597-0 [DOI] [PubMed] [Google Scholar]