Abstract
Purpose:
To demonstrate that ultrashort echo time (UTE) magnetic resonance imaging (MRI) can achieve computed tomography (CT)-like quantification of lung parenchyma in free-breathing, non-sedated neonates. Because infant CTs are used sparingly, parenchymal disease evaluation via UTE MRI has potential for translational impact.
Materials and Methods:
Two neonatal control cohorts without suspected pulmonary morbidities underwent either a research UTE MRI (n=5; 1.5T) or a clinically-ordered CT (n=9). Whole-lung means and anterior–posterior gradients of UTE-measured image intensity (arbitrary units, au, normalized to muscle) and CT-measured density (g/cm3) were compared (Mann–Whitney U-test). Separately, a diseased neonatal cohort (n=5) with various pulmonary morbidities underwent both UTE MRI and CT. UTE intensity and CT density were compared with Spearman correlations within ~33 anatomically matched regions of interest (ROIs) in each diseased subject, spanning low- to high-density tissues. Radiological classifications were evaluated in all ROIs, with mean UTE intensities and CT densities compared in each classification.
Results:
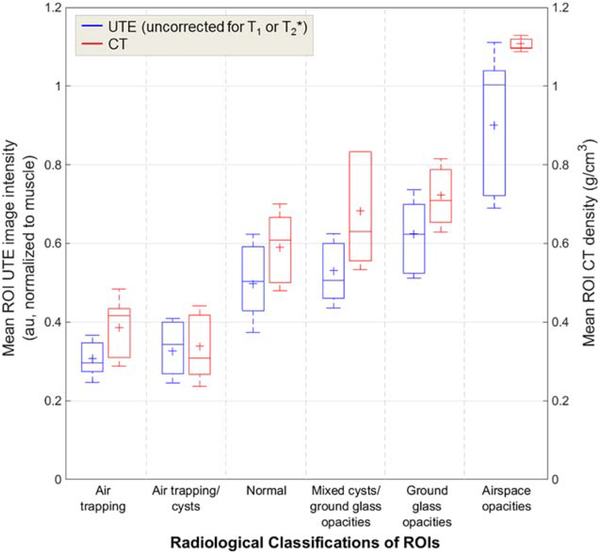
In control subjects, whole-lung UTE intensities (0.51±0.04 au) were similar to CT densities (0.44±0.09g/cm3) (P=0.062), as were UTE (0.021±0.020 au/cm) and CT (0.034±0.024 [g/cm3]/cm) anterior–posterior gradients (P=0.351). In diseased subjects’ ROIs, significant correlations were observed between UTE and CT (P ≤0.007 in each case). Relative differences between UTE and CT were small in all classifications (4–25%).
Conclusion:
These results demonstrate a strong association between UTE image intensity and CT density, both between whole-lung tissue in control patients and regional radiological pathologies in diseased patients. This indicates the potential for UTE MRI to longitudinally evaluate neonatal pulmonary disease and to provide visualization of pathologies similar to CT, without sedation/anesthesia or ionizing radiation.
Magnetic resonance imaging (MRI) has potential as a technique for longitudinal assessment of pulmonary disorders, particularly in pediatric populations. Nevertheless, pulmonary MRI currently plays a limited role in clinical diagnosis of pulmonary diseases. Thoracic X-ray computed tomography (CT) scans are the current standard for structural lung imaging and have the ability to quantify volumetric mass density of parenchymal tissue with submillimeter in-plane image resolution. Whole-lung and regional measures are used in quantitative CT (qCT) of lung density in adults, which has been well validated in numerous studies to spatially map lung density and function,1–3 as well as identify pathological structures like emphysema4 or ground glass opacities.5 However, there are concerns regarding the ionizing radiation exposure associated with CT, particularly for longitudinal monitoring in pediatric and neonatal populations.6–8 Further, pediatric CTs often require sedation or anesthesia, which exposes patients to additional medical risks.9 Thus, CT is a suboptimal option for longitudinal diagnostic imaging in the neonatal population, where the time course of pulmonary morbidities is poorly defined and understood; alternative neonatal imaging tools are desirable.
As a nonionizing modality, MRI is particularly appropriate for evaluating the progression of pulmonary pathophysiologies in pediatric patients, especially in light of recent developments using the k0 point from radial ultrashort echo time (UTE) MRI acquisitions to yield images in free-breathing neonates without sedation or anesthesia.10,11 Historically, pulmonary MRI has been challenging due to the low parenchymal proton density,12 short (0.8–3 msec at typical field strengths),13 and image artifacts from respiratory, cardiac, and bulk motion. Quantitative MRI (qMRI) has seen some initial successes using conventional Cartesian sequences to measure regional ventilation in adults14 and young cystic fibrosis (CF) patients15 using relative image intensity differences, and to distinguish parenchymal intensities between neonates with and without pulmonary disease, such as bronchopulmonary dysplasia (BPD), using intensity thresholding.16
Recent developments of UTE MRI techniques17 provide 3D whole-chest coverage, increased signal-to-noise (SNR) in tissue regions with very short , reduced sensitivity to motion, and the ability to generate respiratory-gated images at different levels of inflation from a single free-breathing scan, even in non-sedated neonates.10,11 Additional post-processing developments allow for reconstruction of radial UTE images excluding data acquired during periods of bulk motion, which obviates the need for a sedated or anesthetized neonate, regardless of UTE scan duration.11 At current clinical field strengths, the typical echo time (TE) of a UTE sequence (~0.2 msec) is well below parenchymal . The low flip angles (FA) used in the present UTE sequence (typically 5°), combined with the short TE, provide images with strong proton-density weighting. While MRI-measured intensity alone does not provide an absolute measure of volumetric mass density, the intensity can be calibrated by a reference tissue of known density. For example, muscle tissue, which has a density approximately equal to that of water on proton density-weighted images,18 can be used as a reference tissue within the field of view (FOV) of a typical thoracic volume image. Thus, parenchymal UTE MRI intensity in the lungs normalized to muscle can be expected to yield values comparable to true density.12 Early quantifications via UTE MRI in healthy subjects yielded lung density values from measurements of “water content,”19 and in chronic pulmonary obstruction disease (COPD) subjects showed similar emphysema indices to CT.20
We hypothesize that UTE MRI can quantify volumetric mass density of neonatal lung parenchyma similar to that achievable with CT, with pathological variations in parenchymal proton density analogous to electron densities as measured by CT. Because infant CTs are used sparingly, and may involve sedation or anesthesia, parenchymal disease evaluation via UTE MRI has the potential for translational impact.
Materials and Methods
Neonatal research MRI exams were performed with Institutional Review Board (IRB) approval and informed parental consent. Clinically-ordered chest CT exams were retrospectively obtained for research with IRB approval and waived consent.
Study Subjects
A prospective MRI cohort of pulmonary control subjects consisted of five neonatal patients recruited from the neonatal intensive care unit (NICU) and primarily diagnosed with seizures or gastrointestinal issues, but with no suspected lung disease. Further clinical information for the cohort is given in Table 1, including sex, age, respiratory support, administration of sedation, and administration of contrast at MRI. All subjects’ heart rates and SpO2 levels were monitored by NICU staff throughout each exam.
TABLE 1.
Clinical Details at Time of Imaging for the UTE MRI and CT Control Cohorts
| Cohort | Sex | Respiratory diagnosis | Age (wk): chronological [PMAa] | Respiratory support | Sedation | Contrast |
|---|---|---|---|---|---|---|
| MRI controls (n = 5) | 4F/ 1M | control | 4 ± 2 [39 ± 2] | Free-breathing (n = 5) | No (except clinically indicatedb for n = 1) | N/A |
| CT controls (n = 9) | 8F/ 1M | control | 11 ± 9 [49 ± 9] | Free-breathing (n = 6); Unknown (n = 3) | Yes (n = 1); No (n = 5); Unknown (n = 3) | No (n = 9) |
PMA: postmenstrual age.
Sedation was already clinically indicated irrespective of the scan; patient did not receive sedation specifically for the scan.
Clinically-ordered CT images were obtained and reviewed retrospectively in nine separate, similarly-aged control subjects. This retrospective control cohort was comprised of infants who had clinically-ordered CT scans, primarily to rule out lung involvement after rare childhood cancers; lung morbidities were subsequently ruled out, which supports their role as control subjects for this study. Further clinical information for this cohort is given in Table 1.
A separate, prospective, diseased neonatal cohort was comprised of five NICU patients (Subjects A–E) with various pulmonary morbidities who received both a research MRI exam and a clinical CT exam (mean postmenstrual age [PMA] at MRI=41±2 weeks, mean PMA at CT=43±4 weeks). Clinical information for each of the subjects at MRI and CT is given in Table 2.
TABLE 2.
Clinical Details for Diseased Subjects at Both UTE MRI and CT Exams
| Subject | Sex | Respiratory diagnosis | Time between scans (days) | Age (wk) (chronological [PMAe]) | Respiratory support | Sedation | Contrast | |
|---|---|---|---|---|---|---|---|---|
| A | M | severe BPDa | 77 (MRI first) | MRI: | 13 [39] | Ventilated (tidal breathing) | Yes (clinically indicatedf) | N/A |
| CT: | 24 [50] | Ventilated (expiration breath-hold) | Yes (procedurally orderedg) | No | ||||
| B | F | PIGb | 7 (MRI first) | MRI: | 6 [40] | Free-breathing | No | N/A |
| CT: | 7 [41] | Free-breathing | No | No | ||||
| C | M | Poland syndrome, with under-developed left chest wall and rightward mediastinal shift | 5 (CT first) | MRI: | 3 [44] | Free-breathing | No | N/A |
| CT: | 2 [43] | Free-breathing | No | Yes | ||||
| D | M | CLDc, suspected PIGb | 1 (CT first) | MRI: | 9 [43] | Free-breathing | No | N/A |
| CT: | 9 [43] | Ventilated (expiration breath-hold) | Yes (procedurally orderedg) | Yes | ||||
| E | M | TEFd (h-type), with right-sided pneumonia | 0 (MRI first) | MRI: | 2 [40] | Free-breathing | No | N/A |
| CT: | 2 [40] | Free-breathing | No | Yes | ||||
BPD: bronchopulmonary dysplasia, as determined by the consensus NICHD definition (32).
PIG: pulmonary interstitial glycogenosis.
CLD: chronic lung disease.
TEF: tracheoesophageal fistula.
PMA: post-menstrual age.
Sedation was already clinically indicated irrespective of the scan; patient did not receive sedation specifically for the scan.
Patient received sedation specifically for the scan.
MRI
All MRI was performed on a unique, small-footprint, neonatal 1.5T MRI system (originally marketed as an orthopedic scanner from ONI Medical Systems, Wilmington, MA; currently GE Healthcare, Waukesha, WI) sited within our institution’s NICU.21–23 The scanner has a 21.8-cm bore size, which is reduced to 18 cm with the insertion of a quadrature body coil, accommodating neonates up to ~4.5kg. This system operates with GE HDx software and is software-limited to a maximum gradient amplitude of 33 mT/m and slew rate of 120 mT/m/s.
A 3D radial UTE acquisition sequence with radio frequency (RF) spoiling17 was adapted for neonatal scanning and uses a pseudorandomized sampling scheme with variable density readout trajectories.10 Typical MRI acquisition parameters were: TE=200 μs; repetition time (TR)=4.4–5.2 msec; FA=5° or 10°; FOV=18 cm; 3D isotropic resolution=0.70–0.86 mm (in-plane isotropic pixel resolution identical to slice thickness); scan time=~10–16 min; and number of radial projections=~120,000–200,000. In some cases, the number of acquired projections was reduced due to exam time limitations. Flip angle values were chosen to yield very little difference in T1-weightings of lung and muscle tissue (see Discussion). Using a previously validated technique,11 images were reconstructed with retrospective respiratory gating to end-expiration with 50% acceptance windows, after discarding data acquired during bulk motion intervals, with a total runtime of ≤5 minutes. MRI exams included other non-UTE scans and lasted a total of ~60–90 minutes. However, if shortened to include only a localizer and a UTE scan, the total exam time would be ~15–20 minutes.
CT Imaging
Protocols for CT imaging varied as clinically indicated, without consideration of potential research design or standardization of acquisition methodology, and thus were necessarily subject to inconsistencies in acquisition parameters and inflation levels. CT imaging was performed on two different scanners: either a Toshiba Aquilion ONE (Toshiba America Medical Systems, Tustin, CA; three of nine control subjects and five of five diseased subjects) with an FC05 or FC56 kernel; or a GE Healthcare LightSpeed 16 (six of nine control subjects) with an unspecified lung kernel. In-plane axial isotropic resolution was 0.26–0.39mm, with a slice thickness of 2.00–3.78mm.
Whole-Lung Analysis
Whole-lung segmentations were generated semi-automatically from UTE MRI and CT images of control subjects using Amira (FEI Visualization Sciences Group). Region-growing segmentation was used, with manual guidance and editing to avoid intensity-based bias. Major vessels and atelectasis were excluded from segmented parenchymal regions. UTE-measured lung image intensities were calculated in arbitrary units (au) normalized to chest wall muscle intensity (averaged over multiple ROIs throughout the 3D FOV), meant to be analogous to macroscopic mass density. CT-measured lung densities were calculated in g/cm3, converted from Hounsfield units (HU) of CT image intensity, with 0 HU referenced to water at 1 g/cm3. T1 and corrections were applied to whole-lung UTE intensities, using relaxation time values measured for adults at 1.5T: = 1.2 sec,24 = 1.1 sec,25 = 2 msec,13 and = 30 msec.26 Whole-lung mean densities from the CT cohort were compared to whole-lung mean image intensities from the UTE cohort (with and without T1 and corrections).
Anterior–Posterior Gradient Analysis
For each individual control subject, a mean anterior–posterior (A-P) lung gradient of normalized image intensity (UTE; au, uncorrected for T1 and , detailed in Discussion) or density (CT; g/cm3) was calculated from the slopes of six A-P lines measured on one slice near the carina (three lines spaced from the lateral lung toward the mediastinum on both left and right lungs). For both the UTE and CT cohorts, a mean A-P gradient value was calculated from each subject’s individual mean gradient value. Major vessels and atelectasis were excluded from measurements.
ROI Analysis
Approximately 33 (range 28–37) ROIs were selected throughout the lungs from each of the five diseased subjects’ axial CT images, with no anatomical location preference, but spanning low- to high-density regions of both pathological and normal tissue. Each CT ROI had relatively homogeneous density, with a mean ROI standard deviation of 0.10 g/cm3. ROIs from diseased patients’ CT images (slice thickness=2.0–3.8 mm) were position- and slice-matched to ROIs in axial UTE images with a slice thickness of 2.8 mm (reconstructed at 4× thicker than the nominal UTE z-resolution of 0.70 mm for improved slice-matching). Each UTE ROI had also had relatively homogenous intensity, with a mean ROI standard deviation of 0.08 au. UTE ROI intensities (uncorrected for T1 and ) were normalized to chest wall muscle and compared to CT ROI densities (g/cm3).
ROIs on UTE MRI and CT images from all five diseased subjects were evaluated by a radiologist (R.J.F., 22 years of experience). Evaluation included classification of radiological findings within the ROI (six classifications: air trapping, air trapping/cysts, normal tissue, mixed cysts with ground glass opacities, ground glass opacities, and airspace opacities), as well as a degree of confidence in radiological assessment (score of 1–5: 1, none; 2, low; 3, moderate; 4, good; 5, high). All images were anonymized and evaluated in random order; UTE MRI and CT images for a single patient were read separately. For each of the six radiological classifications, mean UTE ROI image intensities (uncorrected for T1 and ) and mean CT ROI densities were compared.
Statistical Tests
Whole-lung mean image intensities from the UTE control cohort and mean densities from the CT control cohort were compared by a Mann–Whitney U-test and 95% confidence intervals (CI) of the difference of means. Similar statistical evaluations were used for A-P gradient values from the UTE and CT control cohorts. In each diseased subject, ROI UTE-measured intensities and CT-measured densities were compared using Spearman correlations. The level for statistical significance was set at P < 0.05. A kappa test was used to assess intermethod reliability between UTE-based and CT-based radiological classifications for all ROIs from all patients. For each classification, relative differences of the means and 95% CI of the difference of the means were calculated.
Results
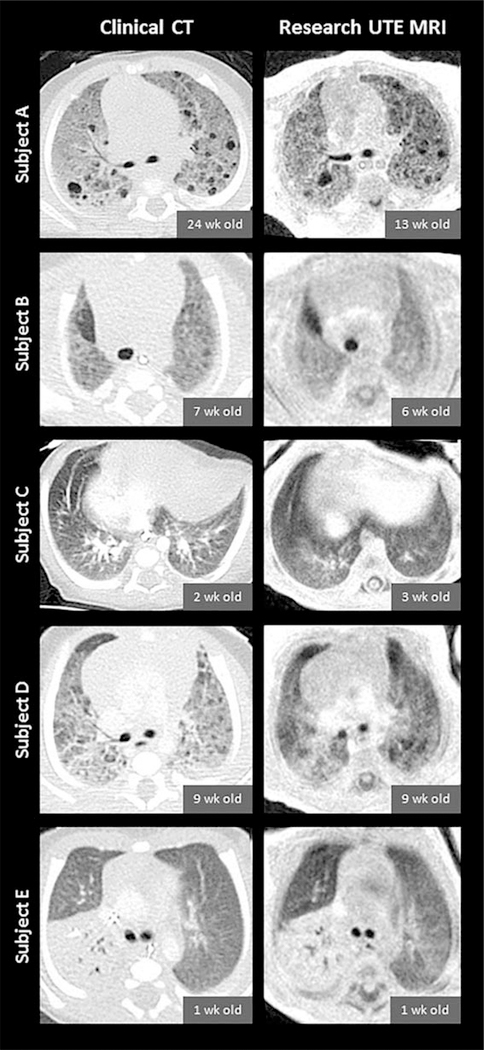
Side-by-side CT and UTE MR image comparisons for the five diseased subjects are shown in Figure 1.
FIGURE 1:
Slice-matched images comparing clinical CT scans (left column) and research UTE MRI scans (right column) in five diseased subjects (from top to bottom: Subjects A through E). CT and MRI exams were typically performed at different timepoints for each individual subject; chronological ages at each subject’s CT and MRI exams are provided. CT images have an in-plane isotropic pixel resolution of 0.29–0.39mm with a slice thickness of 2.0–3.8mm, and UTE images have an in-plane isotropic pixel resolution of 0.70mm with a reconstructed slice thickness of 2.8mm (reconstructed at 4× thicker than the nominal UTE z-resolution of 0.70mm in order to optimize slice-matching). Note that contrast was administered for the clinical CTs of Subjects C, D, and E, and that the spinal-column appearance is influenced by components with different T1 and , similar to lung.
Whole-Lung Analysis
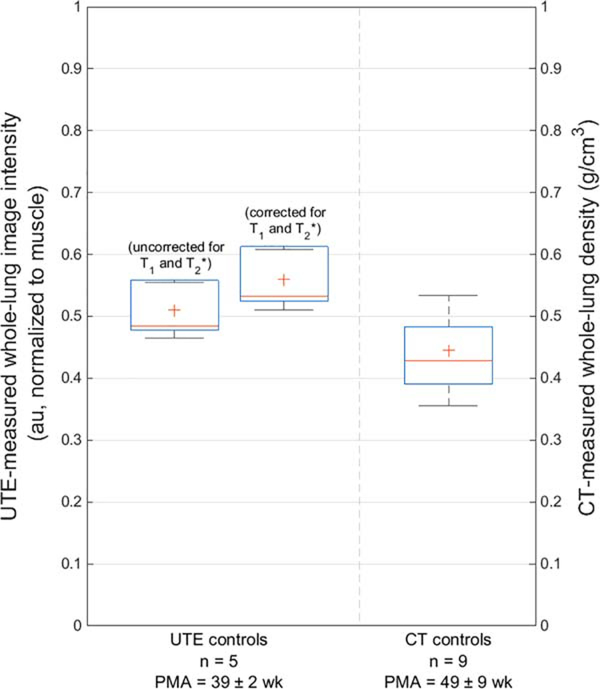
Mean UTE-measured whole-lung parenchymal image intensity in the MRI control cohort was 0.51±0.04 au when uncorrected for T1 and (0.56±0.05 au when corrected). Mean CT-measured whole-lung parenchymal density in the CT control cohort was 0.44±0.09 g/cm3 (Figure 2). Both the uncorrected and corrected UTE technique measured a slightly higher intensity value than the CT-measured density (P=0.062 and 0.062, respectively). The 95% CI of the difference of the means were [−0.159, 0.029] and [−0.210, −0.020] for uncorrected and corrected UTE values, respectively.
FIGURE 2:
A comparison of mean normalized UTE-measured image intensity (0.51±0.04 au when uncorrected for T1 and , left; 0.56±0.05 au when corrected, middle) and mean CT-measured density (0.44±0.09 g/cm3, right) from whole-lung parenchyma in control subjects. Both uncorrected and corrected UTE-measured intensities measure a slightly higher value than CT-measured density (P=0.062 and 0.062, respectively). Note that the CT control cohort was on average 10 weeks older than the MRI control cohort; PMA of both cohorts are provided (mean±standard deviation).
Anterior–Posterior Gradient Analysis
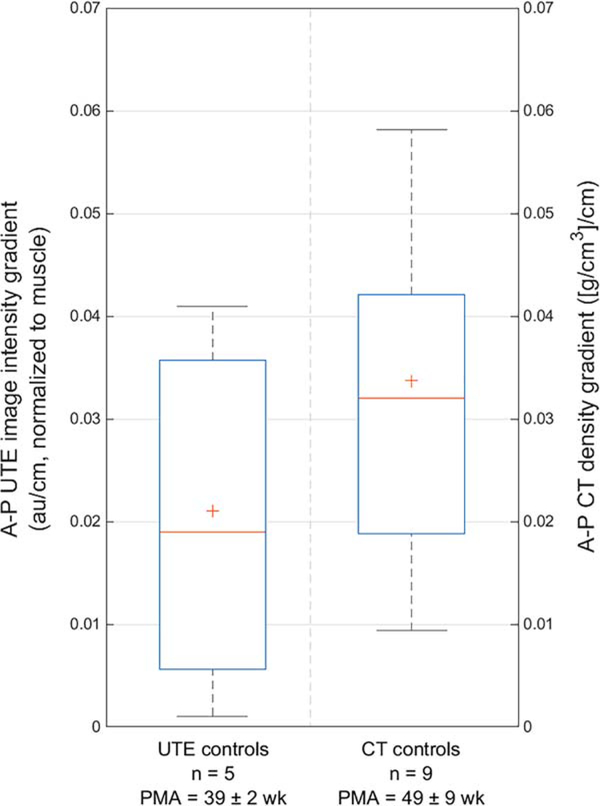
The mean A-P gradient for UTE-measured image intensity was 0.021±0.020 au/cm and for CT-measured density was 0.034±0.024 [g/cm3]/cm (Figure 3) (P=0.351). The 95% CI of the difference of the means was [−0.002, 0.004].
FIGURE 3:
A comparison of mean anterior–posterior (A-P) gradients for normalized UTE image intensity (0.021±0.020 au/cm, left) and CT density (0.034±0.024 [g/cm3]/cm, right) (P=0.351).
ROI Analysis
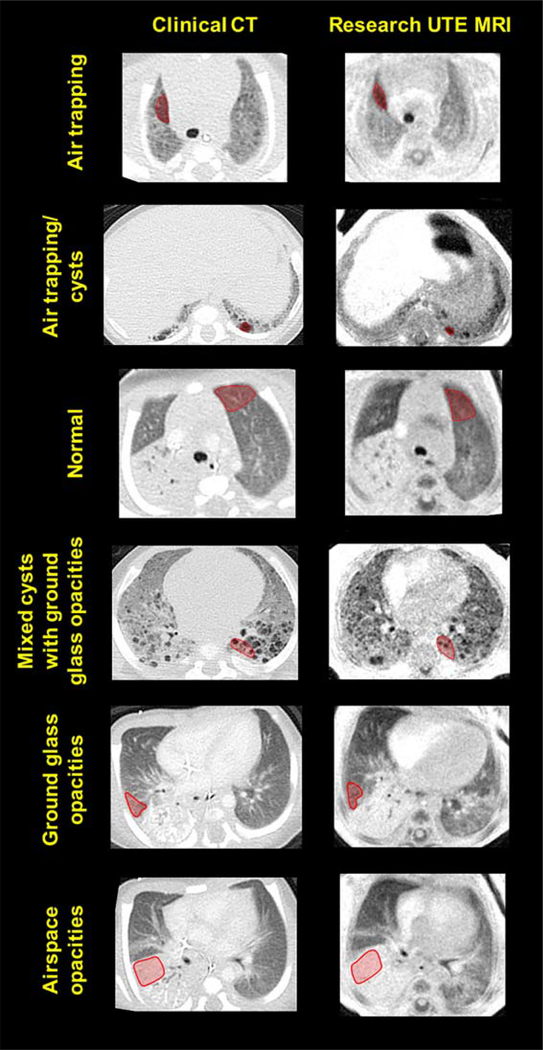
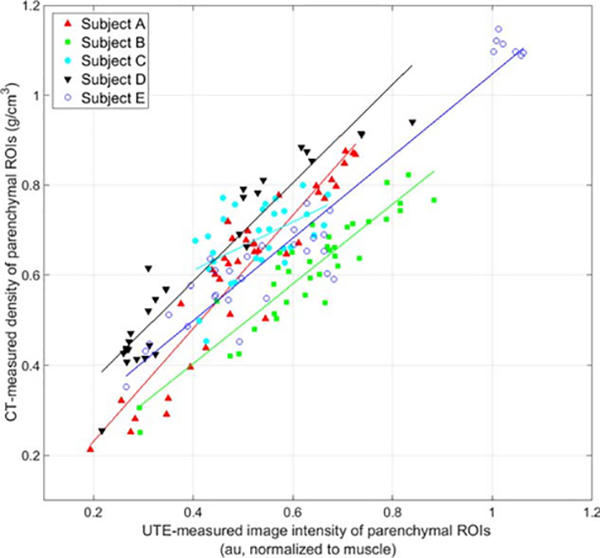
Representative slice-matched ROIs of various densities are shown in Figure 4. Significant Spearman correlations were observed from linear regression analysis between UTE-measured image intensity and CT-measured density for parenchymal ROIs in each of the five diseased subjects (P < 0.007 for all subjects). Further linear fit details (R2, slope, and ranges of UTE-measured intensity and CT-measured density) are given in Table 3.
FIGURE 4:
Representative regions of interest (ROIs: red overlay) of six radiological classifications with varying densities on slice-matched CT images (left column) and UTE MR images (right column) from neonates with pulmonary morbidities. From top to bottom: air trapping, air trapping/cysts, normal tissue, mixed cysts with ground glass opacities, ground glass opacities, and airspace opacities.
TABLE 3.
Linear Fit and Spearman Correlation Details for Comparisons of UTE-Measured Image Intensity (au) and CT-Measured Density (g/cm3) in Regions of Interest From Diseased Subjects (see also Figure 5)
| Subject | Slope ([g/cm3]/au) | P-value | R2 | Range of UTE-measured normalized image intensity (au, uncorrected) | Range of CT-measured density (g/cm3) |
|---|---|---|---|---|---|
| A | 1.26 | < 0.001 | 0.81 | 0.19–0.73 | 0.21–0.88 |
| B | 0.88 | < 0.001 | 0.79 | 0.29–0.88 | 0.25–0.82 |
| C | 0.54 | 0.007 | 0.23 | 0.40–0.67 | 0.45–0.80 |
| D | 1.09 | < 0.001 | 0.82 | 0.22–0.84 | 0.26–0.94 |
| E | 0.91 | < 0.001 | 0.73 | 0.27–1.06 | 0.35–1.15 |
Representative ROIs from each radiological classification are shown in Figure 4. 99% and 100% of ROI classifications on UTE and CT images, respectively, were scored with a confidence level of 3 (“moderate”) or greater (score from 1–5). A kappa test demonstrated moderate agreement between UTE-based classifications and CT-based classifications (κ=0.57). Mean UTE ROI image intensities and mean CT ROI densities for each of the six classifications are shown in Table 4 and Figure 6, and relative differences of the means and 95% CI of the difference of the means are shown in Table 4. We note that the differences between UTE intensities and CT densities were relatively small in each of these radiological classifications (range of 4–25%). Further, the 95% CI of the difference of the means contained zero in regions of air trapping, air trapping/cysts, and mixed cysts with ground glass opacities (see Table 4).
TABLE 4.
Mean UTE Region of Interest (ROI) Image Intensities and CT ROI Densities for Six Radiological Classifications, With Relative Differences of the Means and 95% Confidence Intervals (CI) of the Difference of the Means
| Radiological classification | Mean UTE ROI image intensity (au; normalized to muscle, uncorrected for T1 and T2*) | Mean CT ROI density (g/cm3) | Relative difference of means | Difference of means [95% CI] |
|---|---|---|---|---|
| Air trapping | 0.31 ± 0.06 | 0.39 ± 0.10 | 23% | 0.079 [−0.010, 0.168] |
| Air trapping/cysts | 0.33 ± 0.08 | 0.34 ± 0.10 | 4% | 0.012 [−0.083, 0.108] |
| Normal | 0.50 ± 0.12 | 0.59 ± 0.11 | 17% | 0.092 [0.055, 0.129] |
| Mixed cysts with ground glass opacities | 0.53 ± 0.09 | 0.68 ± 0.14 | 25% | 0.153 [−0.037, 0.343] |
| Ground glass opacities | 0.62 ± 0.11 | 0.72 ± 0.09 | 15% | 0.098 [0.059, 0.137] |
| Airspace opacities | 0.90 ± 0.21 | 1.11 ± 0.02 | 21% | 0.208 [0.056, 0.359] |
FIGURE 6:
Comparisons of mean UTE ROI image intensities (au; uncorrected for T1 or ) and mean CT ROI densities (g/cm3) for each of the six radiological classifications. Relative differences between mean UTE intensity and mean CT density were small (range of 4–25%).
Discussion
Our results demonstrate the feasibility of using pulmonary UTE MRI to quantify lung parenchymal density in non-sedated, free-breathing neonates, and importantly indicate that on a linear scale from zero density (ie, air, ~0 g/cm3) to solid tissue density (ie, muscle, ~1 g/cm3), densities measured from CT and normalized UTE MRI yield approximately the same value. To our knowledge, this work represents the first results that show a relationship between CT-measured lung density and UTE-measured normalized lung image intensity in pediatric subjects. Further, this work demonstrates that specific radiological pathologies present with similar CT-measured densities and UTE-measured intensities, indicating that similar diagnostic information can be obtained from both imaging modalities. More important, the relative densities of these radiological pathologies within a given UTE MRI slice are consistent with that seen on CT and thus create recognizable pathologies for radiologists and clinicians similar to CT.
Correlations between the two density measures were particularly strong in diseased patients with a wide range of density variation within the lungs. These data suggest that UTE MRI and CT can provide similar measures of density in patients with a range of pediatric lung pathologies. We note that Subject C had a more narrow range of tissue densities than the other subjects, due to the less heterogeneous nature of this subject’s pulmonary pathologies (Poland syndrome), and so has a higher (although still significant) P-value and a slope that deviates further from unity than the other subjects’ slopes.
Future work may evaluate the potential for UTE MR images with CT-like lung parenchymal densities to diagnosis and assess neonatal lung disease. Compared to traditional MRI sequences with comparatively long TE values (such as a gradient echo), UTE MRI provides increased intensity in tissues with short . This UTE-specific capability offers the potential for improved visualization of regions of lucency in diseased neonatal lungs, compared to conventional Cartesian MRI, through increased contrast between short- tissue and true low-density tissue. Using pointwise encoding time reduction with radial acquisition (PETRA) UTE MRI, a previous study of CF disease scoring and assessment of lung morphological changes in pediatric and adult patients (9–48 years old) found agreement between CT and MRI methods.28 By combining the present work’s UTE MRI methods with a reader-based scoring system, such as the Ochiai score used for BPD,16,27 there is potential to grade the severity of individual pathological features, such as hyperexpansion, emphysema, or fibrous/interstitial abnormalities, which could play an important role in the evaluation of therapeutic interventions and individual patient management. Furthermore, recently developed techniques for retrospective respiratory gating of free-breathing neonates using UTE MRI11 can generate images at different points of the respiratory cycle, providing the potential for trapped-gas assessment. This also allows for the possibility of quantifying regional ventilation in neonates, similar to work performed in asthmatic and emphysematous adults using MRI14,29 and in older infants with CF using CT.15
Unlike CT, MR intensities from parenchyma and muscle is influenced by proton density as well as the T1-and -weighting specific to each tissue. The T1 values of normal neonatal lung parenchyma and muscle have not been reported. However, these values in neonates are likely similar to adult values (~1.1–1.2 sec),24,25 and the relative neonatal lung and muscle T1-weightings accrued with the small flip angles in this work are likely very similar, yielding very little change to the normalized UTE MRI intensity with a T1 correction (to ~0.001%, using adult values). Likewise, the of normal neonatal lung parenchyma has not been reported but is likely similar to (or longer than) the adult value (~2 msec at 1.5T).13 At the short echo times inherent to UTE acquisitions, weighting in both lung and muscle is small (with correction, UTE image intensity changes <10% and <1% for lung and muscle, respectively).
Further, diseased neonatal lung tissue is very heterogeneous, and relaxation times likely vary widely between regional pathologies (cysts, alveolar simplification, normal tissue, fibrosis, opacities, edema, etc.). Thus, T1 and corrections may be implemented most effectively on a regional basis and would require mapping of relaxation constants in different pathological conditions; such analysis could be the subject of future work. Even so, these results show strong associations between CT densities and normalized UTE image intensities, demonstrating that UTE MRI is effective at providing a primarily proton-density weighting without the need for specific localized corrections.
This study has limitations related to the nature of the clinical CT data. As clinical protocols changed slightly in response to individual patient management, subjects were imaged under various levels of lung inflation, on two CT scanners from different manufacturers, with slightly different reconstruction kernels, and with varying image resolutions. Notably, whole-lung parenchymal density analysis was performed during either free-breathing (n=6) or at unknown inflation levels (n=3) for the CT control cohort, compared to only end-expiration (n=5) for the UTE MRI control cohort. The generally lower level of inflation at MRI may be responsible for the slightly increased whole-lung UTE intensity compared to whole-lung CT density, although we note that the variation in CT whole-lung density was itself larger than the difference between CT and MRI. Differences in the slopes between CT-measured density and UTE-measured intensity in ROIs of diseased subjects may also be related to the lack of well-controlled inflation levels at clinical CT. Additionally, the elevated CT densities for Subjects C–E likely stem from the use of contrast at clinical CT, which has been shown to increase parenchymal CT intensity in emphysematous adults.30 This may also be responsible for the larger differences between MRI and CT in ROIs classified as normal, with ground glass opacities, and with other airspace opacities, since the relative amount of contrast is more variable in such tissue than in cystic or more lucent regions.
Likewise, the timepoints at which diseased subjects’ clinical CTs were obtained were not under control of the research team, and thus MRI scans were acquired on different days than CT scans (with the exception of Subject E, whose MRI and CT scans were performed on the same day); research CT scans are typically not performed in this patient population. In one case (Subject A), the CT exam was performed 11 weeks after the MRI exam. Evolution or resolution of lung pathology during this time could lessen the correlation between the measurements in a given ROI. Similarly, the CT control cohort was slightly older than the MRI control cohort (on average, 7 weeks older in chronological age and 10 weeks older in PMA). We further suspect that the mean whole-lung CT-measured density is slightly lower than UTE-measured image intensity in small part because of the decrease in lung density after birth as infants age31; CT-measured lung density is expected to decrease by ~0.01 g/cm3 between a chronological age of 4 weeks (mean age of the MRI cohort) to 11 weeks (mean age of the CT cohort).31 Additionally, because structural characteristics of lung disease evolve with time, there was a small degree of subjectivity in manual ROI selections on CTs and UTE MRIs acquired at different timepoints. However, this was mitigated through matching of axial slices and in-plane anatomical positions of CT and UTE ROIs, in addition to a large number of ROIs per patient.
In conclusion, UTE MRI can be used to quantify both whole-lung and regional lung parenchymal density, providing tissue density quantification and visualization of pathologies similar to that achievable with CT. Unlike neonatal pulmonary CT, UTE MRI is nonionizing, can be performed during free-breathing, and does not require sedation or anesthesia, which makes it a strong and safe choice for repeated assessment of neonatal lung disease in clinical settings. UTE MRI offers the potential to longitudinally image the regional progression of pulmonary pathologies like fibrosis, bronchiectasis, edema, and alveolar simplification. In the future, this quantification may aid in identifying individual phenotypes of and personalizing clinical therapies for neonatal lung disease.
FIGURE 5:
Comparisons of UTE-measured normalized image intensity (au; uncorrected for T1 and ) and CT-measured density (g/cm3) in ~33 ROIs in diseased subjects with various pulmonary issues (red triangles for Subject A; green squares for Subject B; cyan circles for Subject C; black inverted triangles for Subject D; and blue hollow circles for Subject E). All Spearman correlations from linear regression analysis are significant (P < 0.001 for Subjects A, B, D, and E; P=0.007 for Subject C), with slightly varying linear fits.
Acknowledgments
Contract grant sponsor: The Perinatal Institute at Cincinnati Children’s Hospital Medical Center; Contract grant sponsor: The Hartwell Foundation; Contract grant sponsor: National Institutes of Health (NIH); contract grant numbers: NIH P01 HL070831, NIH T32 HL007752, and NIH T32 CA009206.
The authors thank GE Healthcare for MRI research support.
References
- 1.Aliverti A, Pennati F, Salito C, Woods JC. Regional lung function and heterogeneity of specific gas volume in healthy and emphysematous subjects. Eur Respir J 2013;41:1179–1188. [DOI] [PubMed] [Google Scholar]
- 2.Pennati F, Salito C, Baroni G, Woods J, Aliverti A. Comparison between multivolume CT-based surrogates of regional ventilation in healthy subjects. Acad Radiol 2014;21:1268–1275. [DOI] [PubMed] [Google Scholar]
- 3.Simon BA. Non-invasive imaging of regional lung function using x-ray computed tomography. J Clin Monit 2000;16:433–442. [DOI] [PubMed] [Google Scholar]
- 4.Hayhurst MD, MacNee W, Flenley DC, et al. Diagnosis of pulmonary emphysema by computerised tomography. Lancet 1984;2:320–322. [DOI] [PubMed] [Google Scholar]
- 5.Nakata M, Saeki H, Takata I, et al. Focal ground-glass opacity detected by low-dose helical CT. Chest 2002;121:1464–1467. [DOI] [PubMed] [Google Scholar]
- 6.Miglioretti DL, Johnson E, Williams A, et al. The use of computed tomography in pediatrics and the associated radiation exposure and estimated cancer risk. JAMA Pediatr 2013;167:700–707. [DOI] [PMC free article] [PubMed] [Google Scholar]
- 7.Brenner D, Elliston C, Hall E, Berdon W. Estimated risks of radiation-induced fatal cancer from pediatric CT. AJR Am J Roentgenol 2001; 176:289–296. [DOI] [PubMed] [Google Scholar]
- 8.Pearce MS, Salotti JA, Little MP, et al. Radiation exposure from CT scans in childhood and subsequent risk of leukaemia and brain tumours: a retrospective cohort study. Lancet 2012;380:499–505. [DOI] [PMC free article] [PubMed] [Google Scholar]
- 9.Cravero JP, Beach ML, Blike GT, Gallagher SM, Hertzog JH. Pediatric Sedation Research Consortium. The incidence and nature of adverse events during pediatric sedation/anesthesia with propofol for procedures outside the operating room: a report from the Pediatric Sedation Research Consortium. Anesth Analg 2009;108:795–804. [DOI] [PubMed] [Google Scholar]
- 10.Hahn AD, Higano NS, Walkup LL, et al. Pulmonary MRI of neonates in the intensive care unit using 3D ultrashort echo time and a small footprint MRI system. J Magn Reson Imaging 2016. doi: 10.1002/jmri.25394 [Epub ahead of print]. [DOI] [PMC free article] [PubMed] [Google Scholar]
- 11.Higano NS, Hahn AD, Tkach JA, et al. Retrospective respiratory self-gating and removal of bulk motion in pulmonary UTE MRI of neonates and adults. Magn Reson Med 2016. doi: 10.1002/mrm.26212 [Epub ahead of print]. [DOI] [PMC free article] [PubMed] [Google Scholar]
- 12.Hatabu H, Alsop DC, Listerud J, Bonnet M, Gefter WB. T2* and proton density measurement of normal human lung parenchyma using submillisecond echo time gradient echo magnetic resonance imaging. Eur J Radiol 1999;29:245–252. [DOI] [PubMed] [Google Scholar]
- 13.Yu J, Xue Y, Song HK. Comparison of lung T2* during free-breathing at 1.5 T and 3.0 T with ultrashort echo time imaging. Magn Reson Med 2011;66:248–254. [DOI] [PMC free article] [PubMed] [Google Scholar]
- 14.Pennati F, Quirk JD, Yablonskiy DA, Castro M, Aliverti A, Woods JC. Assessment of regional lung function with multivolume (1)H MR imaging in health and obstructive lung disease: comparison with (3)He MR imaging. Radiology 2014;273:580–590. [DOI] [PMC free article] [PubMed] [Google Scholar]
- 15.Pennati F, Salito C, Roach D, Clancy JP, Woods JC, Aliverti A. Regional ventilation in infants quantified by multi-volume high resolution computed tomography (HRCT) and multi-volume proton magnetic resonance imaging (MRI). Eur Respir J 2015;46(Suppl 59):OA2949. [Google Scholar]
- 16.Walkup LL, Tkach JA, Higano NS, et al. Quantitative magnetic resonance imaging of bronchopulmonary dysplasia in the neonatal intensive care unit environment. Am J Resp Crit Care Med 2015;192:1215–1222. [DOI] [PMC free article] [PubMed] [Google Scholar]
- 17.Johnson KM, Fain SB, Schiebler ML, Nagle S. Optimized 3D ultrashort echo time pulmonary MRI. Magn Reson Med 2013;70:1241–1250. [DOI] [PMC free article] [PubMed] [Google Scholar]
- 18.Mendez J, Keys A. Density and composition of mammalian muscle. Metabolism 1960;9:184–188. [Google Scholar]
- 19.Lederlin M, Crémillieux Y. Three-dimensional assessment of lung tissue density using a clinical ultrashort echo time at 3 Tesla: a feasibility study in healthy subjects. J Magn Reson Imaging 2014;40:839–847. [DOI] [PubMed] [Google Scholar]
- 20.Roach DJ, Crémillieux Y, Serai SD, et al. Morphological and quantitative evaluation of emphysema in chronic obstructive pulmonary disease patients: A comparative study of MRI with CT. J Magn Reson Imaging 2016. doi: 10.1002/jmri.25309 [Epub ahead of print]. [DOI] [PubMed] [Google Scholar]
- 21.Tkach JA, Hillman NH, Jobe AH, et al. An MRI system for imaging neonates in the NICU: initial feasibility study. Pediatr Radiol 2012;42: 1347–1356. [DOI] [PubMed] [Google Scholar]
- 22.Tkach JA, Merhar SL, Kline-Fath BM, et al. MRI in the neonatal ICU: initial experience using a small-footprint 1.5-T system. AJR AM J Roentgenol 2014;202:W95–W105. [DOI] [PubMed] [Google Scholar]
- 23.Tkach JA, Li Y, Pratt RG, et al. Characterization of acoustic noise in a neonatal intensive care unit MRI system. Pediatr Radiol 2014; 44: 1011–1019. [DOI] [PMC free article] [PubMed] [Google Scholar]
- 24.Jakob PM, Hillenbrand CM, Wang T, Schultz G, Hahn D, Haase A. Rapid quantitative lung (1)H T(1) mapping. J Magn Reson Imaging 2001;14:795–799. [DOI] [PubMed] [Google Scholar]
- 25.Gold GE, Han E, Stainsby J, Wright G, Brittain J, Beaulieu C. Musculoskeletal MRI at 3.0 T: relaxation times and image contrast. AJR AM J Roentgenol 2004;183:343–351. [DOI] [PubMed] [Google Scholar]
- 26.Vandenborne K, Walter G, Ploutz-Snyder L, Dudley G, Elliott MA, De Meirleir K. Relationship between muscle T2* relaxation properties and metabolic state: a combined localized 31P-spectroscopy and 1H-imaging study. Eur J Appl Physiol 2000;82:76–82. [DOI] [PubMed] [Google Scholar]
- 27.Ochiai M, Hikino S, Yabuuchi H, et al. A new scoring system for computed tomography of the chest for assessing the clinical status of bronchopulmonary dysplasia. J Pediatr 2008;152:90–95, 95.e91–93. [DOI] [PubMed] [Google Scholar]
- 28.Dournes G, Menut F, Macey J, et al. Lung morphology assessment of cystic fibrosis using MRI with ultra-short echo time at submillimeter spatial resolution. Eur Radiol 2016;26:3811–3820. [DOI] [PubMed] [Google Scholar]
- 29.Galbán CJ, Han MK, Boes JL, et al. Computed tomography-based biomarker provides unique signature for diagnosis of COPD phenotypes and disease progression. Nat Med 2012;18:1711–1715. [DOI] [PMC free article] [PubMed] [Google Scholar]
- 30.Heussel CP, Kappes J, Hantusch R, et al. Contrast enhanced CT-scans are not comparable to non-enhanced scans in emphysema quantification. Eur J Radiol 2010;74:473–478. [DOI] [PubMed] [Google Scholar]
- 31.Stein J, Walkup LL, Brody AS, Fleck RA, Woods JC. Quantitative CT characterization of pediatric lung development using routine clinical imaging. Pediatr Radiol 2016. doi: 10.1007/s00247-016-3686-8 [Epub ahead of print]. [DOI] [PMC free article] [PubMed] [Google Scholar]
- 32.Jobe AH, Bancalari E. Bronchopulmonary dysplasia. Am J Respir Crit Care Med 2001;163:1723–1729. [DOI] [PubMed] [Google Scholar]


