

Abstract
Theories about biological limits to lifespan and evolutionary shaping of human longevity depend on facts about mortality at extreme ages. The facts have remained in dispute. Do hazard curves typically ultimately level out into high plateaus, as seen in other species, or do exponential increases go on and on? Here we estimate hazard rates from data on all Italian inhabitants aged over 105 between 2009 and 2015 (born 1896–1910), 3836 carefully documented cases. We find level hazard curves, essentially constant beyond age 105. The estimates are free from artifacts of aggregation limiting earlier studies and provide the best evidence so far for the existence of extreme-age mortality plateaus in humans.
Summary
Above age 105 human mortality appears constant over age at levels that are slowly declining across cohorts.
Survival to extreme ages tests the limits of evolutionary demographic potential. Here we report a curve of death rates by age for recent cohorts of Italians, a curve essentially level over 105. In so doing, we address what is at once nearly the oldest question and also the most current question in the formal study of human senescence: are there limits to the rise in risks of death by age?
In 1825, in proposing the first model for accelerating, exponential increases in mortality by age, Benjamin Gompertz (1) cautiously included an upper bound on ages of applicability. Whether to attribute apparent deviations at extreme ages to age misreporting or to structural processes long looked impossible to settle. After 1990, as data improved, studies (2–7) began to build a case for genuine deceleration from about age 80 onwards, contrasting with clearly exponential curves at lower adult ages. When a mortality curve levels out, it is said to reach a plateau. The new findings for humans accord with new discoveries of plateauing mortality at extreme ages in other species (8) and have stimulated a wave of biodemographic and evolutionary theory. Other studies, however, have reached an opposite conclusion: the better the data, the less the appearance of leveling (9–10). A recent work (11) reports exponential increases persisting even beyond 110 in sparse but high-quality data drawn from a collection of countries.
If claims of extreme-age plateaus in human mortality turned out to be generally illusory, much of the demographic modeling of the last two decades would have to be rethought. Here, to the contrary, we show a clean case where the plateau is real.
Accurate mortality data at advanced ages are difficult to obtain. In vital statistics, the very old are often aggregated in one age-group. Even in countries with reliable vital registration, age exaggeration is common among the oldest-old. These difficulties motivated the establishment of an international research team collecting, analysing, and meticulously checking data on people who reach ages of 110 years or more, supercentenarians, in fifteen countries including Italy. The International Database on Longevity (IDL) at the Max Planck Institute for Demographic Research is the result of this decade-long effort (www.supercentenarians.org), updated through 2010.
Thanks to this database, estimates of mortality after age 110 could be obtained (12). The hazard function, the usual continuous-age version of mortality rates as a function of age, turned out to appear constant at least up to age 114, after which data become too sparse for reliable statements. For this result, data on supercentenarians had to be pooled from eleven countries to arrive at adequate sample sizes. Country-specific estimates were not feasible because individual countries do not provide enough observations to limit sampling variation. Within the limits of precision, supercentenarian hazards showed no improvement over time. These findings have been challenged (11) with analysis of the same IDL data by different methods. In the wake of limitations on precision and continuing controversy, the IDL project is now being extended to cover people who survive to age 105 or more.
In conjunction with the IDL extension, the Italian National Institute of Statistics (ISTAT) has recently collected and carefully validated the individual survival trajectories of all the Italian inhabitants aged 105 and over in the period from 1 January 2009 to 31 December 2015, the data for the present study. For several reasons, these data allow estimation of mortality at extreme ages with an accuracy and precision that were not possible before. First, individual trajectories provide information on survival in continuous time, therefore avoiding possibly misleading patterns of death rates that are computed on pre-specified age intervals and are often obtained by aggregating heterogeneous birth cohorts. Second, the validation procedure has been developed specifically for this population segment and meets the highest validation criteria provided by the IDL protocol. It is based on the resident population of the Italian municipalities that is yearly recorded on January 1st. Each municipality where individuals aged 105+ have been reported was contacted by ISTAT. A death certificate was required for each deceased subject. This certificate includes, among other information, the date of birth of the deceased certified by the Civil Status Officer. A certificate of survival was required for all the subjects who were expected to be still alive at the end of the study period. For supercentenarians, those most problematic in terms of age reporting, the birth certificate was additionally collected. In these data, age misreporting is believed to be minimal. The project includes all those 105 and older in the period 1 January 2009 to 31 December 2015, so that the data are also free of age ascertainment bias.
The present study based on ISTAT data includes 3836 cases, 463 of whom are males, across 15 birth cohorts (1896 – 1910). Less than 4% of these individuals were born abroad. Of those, many have clear Italian origins (13). Some 472 individuals born before 31 December 1903 (birth cohorts 1896 – 1903) enter the study at ages greater than exactly 105 and, as such, provide left-truncated survival trajectories. Death during the follow-up was observed in 2883 cases and, as a result, 953 individuals are right-censored, i.e., still alive at the end of the study. Table 1 displays the distribution of observed deaths and censored trajectories across gender and cohort. Increases in samples from row to row bear testimony to improvements in survival from cohort to cohort at ages before 105, and lead us to expect the downward cohort trend in hazards beyond 105 in our data to be described below.
Table 1:
Distribution of the observed cases
| Cohort | Age at entry into study (computed) |
Males | Females | Reaching | ||
|---|---|---|---|---|---|---|
| Censored | Observed | Censored | Observed | age | ||
| cases | deaths | cases | deaths | 105 | ||
| 1896 | 112 | 0 | 0 | 0 | 4 | 4 |
| 1897 | 111 | 0 | 0 | 0 | 1 | 1 |
| 1898 | 110 | 0 | 0 | 0 | 5 | 5 |
| 1899 | 109 | 0 | 0 | 1 | 12 | 13 |
| 1900 | 108 | 0 | 0 | 0 | 23 | 23 |
| 1901 | 107 | 0 | 7 | 0 | 46 | 53 |
| 1902 | 106 | 0 | 17 | 2 | 134 | 153 |
| 1903 | 105 | 0 | 23 | 2 | 195 | 220 |
| 1904 | 105 | 0 | 35 | 5 | 302 | 342 |
| 1905 | 105 | 2 | 40 | 10 | 331 | 383 |
| 1906 | 105 | 2 | 48 | 19 | 348 | 417 |
| 1907 | 105 | 11 | 55 | 40 | 354 | 460 |
| 1908 | 105 | 19 | 57 | 106 | 345 | 527 |
| 1909 | 105 | 28 | 33 | 219 | 296 | 576 |
| 1910 | 105 | 64 | 22 | 423 | 150 | 659 |
| Total | 126 | 337 | 827 | 2546 | 3836 | |
For context, Fig. 1a shows confidence intervals for logarithms of yearly hazards for the single-year cohort of Italian women born in 1904. Before age 105 intervals derive from vital statistics in the Human Mortality Database (HMD), www.mortality.org. These widening intervals, also likely distorted by age misreporting, only hint at decreasing slopes. Beyond age 105 intervals derive from ISTAT data restricted to this single cohort, with separate inter- vals for each year of age. Even with these high-quality data, separating out cohorts and ages leave too much uncertainty to tell whether hazards continue upward, level out, or decrease beyond 105. We fit a model which combines cohorts and ages to circumvent this challenge. Our best-estimated trajectory for the 1904 cohort from our modeling is the flat curve, the plateau, shown in Fig. 1b. On a log scale, exponential curves become straight lines. A straight-line fit based on ages 65 to 80, where the Gompertz model does appear to hold, fails at later ages and far overshoots our estimated plateau beyond age 105.
Figure 1:
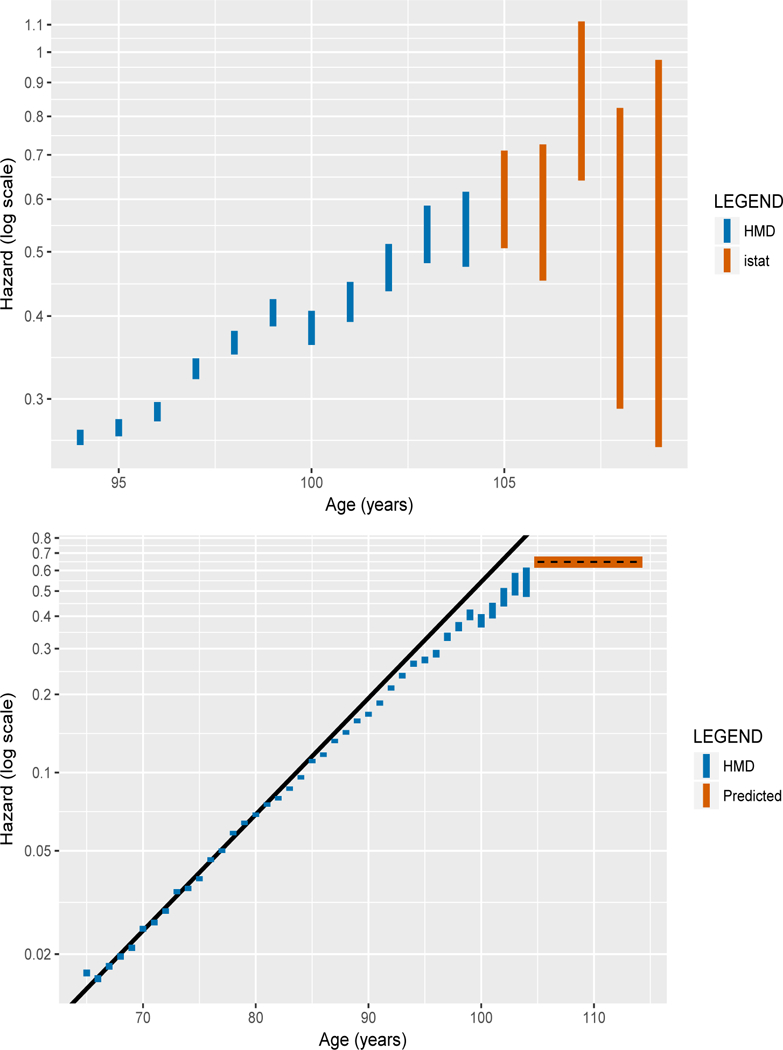
Yearly hazards on a logarithmic scale for the cohort of Italian women born in 1904, from the Human Mortality Database (blue) and from ISTAT data beyond age 105 (orange). Panel a (left): closeup with 95% confidence intervals based solely on single-cohort data; Panel b (right): broad view with estimated plateau beyond 105 (black dashed line) and 95% confidence bands (orange) predicted from the model parameters based on the full ISTAT database, along with a straight-line prediction (black) from fitting a Gompertz model to ages 65 to 80.
To determine from the full ISTAT data whether log-hazard slopes after 105 are level, upward, or downward, our modeling approach compares a null hypothesis of constant hazards to alternatives with a non-zero Gompertz slope parameter. We include a (modest) exponential cohort trend and a proportional gender effect, setting the hazard at age x years beyond 105 equal to
with b constrained to zero for the null model. Here C is cohort birth year minus 1904,M equals 1 for males, zero else. Parameters include initial hazard a at 105, Gompertz slope b, cohort effect β1 and gender effect β2.
Parameters estimated by standard maximum likelihood methods for truncated and censored survival data (14) are shown in Table 2. A likelihood ratio test fails to reject the constant-hazard null model at a level as generous as 0.44. Under the alternative hypothesis, the Gompertz slope parameter estimate b = 0.013 with standard error 0.017, is not statistically significant at the 5% level and is practically indistinguishable from zero. This near- negligible slope stands in striking contrast to the slope as large as 0.103 at younger ages (65–80) in Fig. 1b, which is paired with a log hazard at 65 of log(0.015). For variant models and power calculations, see Tables S1 and S2.
Table 2:
Parameter Estimates for Preferred Model
| Model | Parameter | Estimate | (SE) | Log-likelihood | AIC |
|---|---|---|---|---|---|
| Constant hazard | a | 0.645 | (0.016) | −4250.662 | 8507.325 |
| β1 | −0.020 | (0.008) | |||
| β2 | 0.033 | (0.058) | |||
| Gompertz hazard | a | 0.629 | (0.026) | −4250.370 | 8508.74 |
| b | 0.013 | (0.017) | |||
| β1 | −0.016 | (0.009) | |||
| β2 | 0.034 | (0.058) |
Difference in Log-likelihoods is 0.292
AIC is the Akaike Information Criterion
The estimated cohort effect β1 = −0.020 with standard error 0.008, though small, is in line with expectations, statistically significant, and important (13). The 463 male survivors beyond 105 are too few for the gender effect to come out statistically significant, though the estimate β2 = 0.033 is plausible.
For the baseline cohort born in 1904, the estimated level of the plateau is a = 0.645. It corresponds to an annual probability of dying of 1 — exp(−0.645) = 0.475, and an expectation of further life of 1/0.645 = 1.55 years. This outcome is in keeping with the probability estimated elsewhere for supercentenarians (12). With 90% of person-years at risk coming before age 108, the ISTAT data cannot rule out alternatives like a plateau followed somewhat later by decline, but supercentenarian estimates argue against such alternatives.
Our estimates based on all ISTAT cohorts together produce excellent fits for single cohorts. We examine the cumulative hazard, the integral under the hazard curve, for which non-parametric confidence bounds are available. Hazards that are constant imply cumulative hazards that are linearly increasing. Poor fit would stand out as curvature. Fig. 2 shows heartening absence of curvature for Italian women born in 1904, as do plots for other cohorts not included here.
Figure 2:
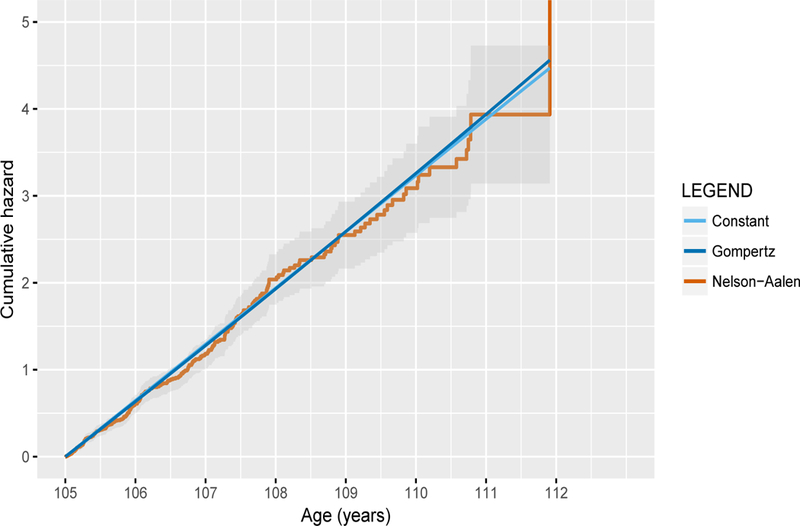
Cumulative hazard beyond age 105 (orange) with non-parametric confidence bands for the cohort of Italian women born 1904. The straight lines are the translation to cumulative hazards of the estimated plateau predicted from ISTAT data, under a constant hazard (light blue) and a Gom- pertz hazard model (blue).
The increasing number of exceptionally long-lived people in Table 1 and the fact that their mortality beyond 105 is seen to be declining across cohorts lowering the mortality plateau or postponing the age when it appears strongly suggest that longevity is continuing to increase over time and that a limit, if any, has not been reached. Our results contribute to a recently rekindled debate (15–17) about the existence of a fixed maximum lifespan for humans, underwriting doubt that any limit is as yet in view.
Our findings further provide fundamental knowledge about the biodemography of human longevity. In this setting with clean data from a single nation and straightforward estimation, death rates which increase exponentially up to about age 80 do, as we report here, decelerate thereafter and reach or closely approach a plateau after age 105. Thus these well-estimated hazard curves share the qualitative pattern observed at extreme ages in widely differing species (8, 18), regularities calling for common structural and evolutionary explanations.
An important structural contributor to deceleration must be the impact of selective survival in heterogeneous populations. The fixed-frailty proportional hazard model of Vaupel, Stallard, and Manton (19) (with precursor 20) implies approach to plateaus (5, 8, 18), and elegant Gamma-Gompertz distributions for deaths arise naturally in the framework (21–24). Enhanced care for the extremely old may help to hold increases in mortality in check. Evolutionary theories of senescence including the mutation accumulation theory and age-dependent effects of genetic load (25) also offer promising ingredients toward a joint explanation of both the phases of exponential increase and extreme age plateaus. Ongoing theoretical progress depends on empirical clarity. We hope to promote such clarity with the data and estimates for Italians 105 and older reported here.
Supplementary Material
Acknowledgments
The authors thank Marco Battaglini and Giorgia Capacci at ISTAT for collecting and validating the data used in this paper. Funding: KWW supported by Grant 5P30AG012839 from the U.S. National Institute on Aging; Author contributions: E.B. wrote the paper; F.L. performed the statistical analyses; M.M. designed the data validation procedure and supervised the data collection; J.W.V initiated the research project and suggested revisions to subsequent drafts; K.W.W. suggested extensions and revisions. All authors contributed to interpretation of results; Competing interests: Authors declare no competing interests; Data and materials availability: The data that support the findings of this study are owned by ISTAT and are not publicly available. However the data can be obtained directly from ISTAT after registration at the contact centre (https://contact.istat.it), mentioning the Semisupercentenarian Survey and Marco Marsili as contact person.
Footnotes
This is the author's “Accepted Version" of the work. It is posted in PubMed Central six months after date of publication by permission of the American Association for the Advancement of Science. The definitive version was published in Science (2018–06-29) doi: 10.1126/science.aat3119.
References
- 1.Gompertz B, On the nature of the function expressive of the law of human mortality, and on a new mode of determining the value of life contingencies. Phil. Trans. Royal Society of London 115, 513–583 (1825). [DOI] [PMC free article] [PubMed] [Google Scholar]
- 2.Horiuchi S, Coale AJ, Age patterns of mortality for older women: an analysis using the age-specific rate of mortality change with age. Math. Pop. Studies 2, 245–267 (1990). [DOI] [PubMed] [Google Scholar]
- 3.Kannisto V, Development of oldest-old mortality, 1950 – 1990: evidence from 28 developed countries. (Odense: University Press, 1994). [Google Scholar]
- 4.Horiuchi S, Wilmoth JR, Deceleration in the age pattern of mortality at older ages. Demography 35, 391–412 (1998). [PubMed] [Google Scholar]
- 5.Thatcher AR, Kannisto V, Vaupel JW, The force of mortality at ages 80 to 120. (Odense: University Press, 1998). [Google Scholar]
- 6.Robine JM, Vaupel JW, Supercentenarians: slower ageing individuals or senile elderly? Experimental Gerontology 36, 915–930 (2001). [DOI] [PubMed] [Google Scholar]
- 7.Barbi E, Caselli G, Vallin J, Trajectories of extreme survival in heterogeneous populations. Population 58, 43–65 (2003). [Google Scholar]
- 8.Vaupel JW, Carey JR, Christensen K, Johnson TE, Yashin AI, Holm NV, Iachine IA, Kannisto V, Khazaeli AA, Liedo P, Longo VD, Zeng Y, Manton KG, Curtsinger JW, Biodemographic Trajectories of longevity. Science 280, 855–860 (1998). [DOI] [PubMed] [Google Scholar]
- 9.Gavrilov LA, Gavrilova NS, Mortality measurement at advanced ages: A study of the social security administration death master file. North American Actuarial Journal 15, 432–447 (2011). [DOI] [PMC free article] [PubMed] [Google Scholar]
- 10.Gavrilov LA, Gavrilova NS, Biodemography of old-age mortality in humans and rodents. Journals of Gerontology Series A 70, 1–9 (2015). [DOI] [PMC free article] [PubMed] [Google Scholar]
- 11.Gavrilov LA, Gavrilova NS, Krutko VN, Mortality of supercentenarians: does it grow with age? in 2017 Living to 100 Monograph, Harris TF, Ed. (Society of Actuaries, Schaumburg, IL: 2017). [Google Scholar]
- 12.Gampe J, Human mortality beyond age 110 in Supercentenarians, Meier H, Gampe J, Jeune B, Robine JM, Vaupel JW, Eds. (Springer, 2010), pp.219–230. [Google Scholar]
- 13.Materials and methods are available as supplementary materials.
- 14.Klein JP, Moeschberger ML, Survival Analysis (Springer, New York, 2003), pp. 74–75 and pp. 91–98. [Google Scholar]
- 15.Dong X, Milholland B, Vijg J, Evidence for a limit to human lifespan. Nature 538, 257–259 (2016). [DOI] [PMC free article] [PubMed] [Google Scholar]
- 16.Lenart A, Vaupel JW, Questionable evidence for a limit to human lifespan. Nature 546, E13–E14 (2017). [DOI] [PubMed] [Google Scholar]
- 17.Rootzn H, Zholud D, Human life is unlimited but short. Extremes 20, 713–728 (2017). [Google Scholar]
- 18.Vaupel JW, Biodemography of human aging. Nature 464, 536–542 (2010). [DOI] [PMC free article] [PubMed] [Google Scholar]
- 19.Vaupel JW, Manton KG, Stallard E, The impact of heterogeneity in individual frailty on the dynamics of mortality. Demography 16, 439–454 (1979). [PubMed] [Google Scholar]
- 20.Beard RE, Notes on some mathematical mortality models in The lifespan of animals, Wolstenholme GEW, O’Connor M, Eds. (Boston: Little, Brown, 1959), pp. 802–811. [Google Scholar]
- 21.Finkelstein MS, Esaulova V, Asymptotic behavior of a general class of mixture failure rates. Adv. Appl. Prob. 38, 244–262 (2006). [Google Scholar]
- 22.Steinsaltz DR, Wachter KW, Understanding mortality rate deceleration and heterogeneity. Math. Pop. Studies 13, 19–37 (2006). [Google Scholar]
- 23.Missov TI, Finkelstein MS, Admissible mixing distributions for a general class of mixture survival models with known asymptotics. Theor. Pop. Bio. 80, 64–70 (2011). [DOI] [PubMed] [Google Scholar]
- 24.Missov TI, Vaupel JW, Mortality implications of mortality plateaus. SIAM Review 57, 61–70 (2015). [Google Scholar]
- 25.Wachter KW, Steinsaltz DR, Evans SH, Evolutionary Shaping of Demographic Schedules PNAS 111(s3), 10846–10853 (2014). [DOI] [PMC free article] [PubMed] [Google Scholar]
- 26.Ulm K, A Simple method to calculate the confidence interval of a standardized mortality ratio (SMR). American Journal of Epidemiology, 131(2), 373–375 (1990). [DOI] [PubMed] [Google Scholar]
- 27.Vaupel JW, Zhang Z, Attrition in heterogeneous cohorts. Demographic Research 23, 737–748 (2010). [Google Scholar]
Associated Data
This section collects any data citations, data availability statements, or supplementary materials included in this article.