

Abstract
Diffuse gliomas comprise the most common malignant brain tumors in adults and include glioblastomas (GBM) and World Health Organization (WHO) grade II and grade III tumors, sometimes referred to as lower-grade gliomas (LGGs). Genetic tumor profiling is used for disease classification and to guide therapy1,2, but involves brain surgery for tissue collection and repeated tumor biopsies may be necessary for accurate genotyping over the course of the disease 3–10. While detection of circulating tumor DNA (ctDNA) in blood remains challenging for patients with primary brain tumors 11,12, sequencing of cerebrospinal fluid (CSF) ctDNA may provide an alternative to genotype glioma at lower morbidity and cost 13,14. We therefore evaluated the representation of the glioma genome in CSF from 85 glioma patients who underwent a lumbar puncture for evaluation of neurological signs or symptoms. Tumor-derived DNA was detected in CSF from 42/85 (49.4 %) patients and was associated with disease burden and adverse outcome. The genomic landscape of glioma in CSF contained a broad spectrum of genetic alterations and closely resembled the genome in tumor biopsies. Alterations that occur early during tumorigenesis, such as co-deletion of chromosome arms 1p and 19q (1p/19q codeletion) and mutations in the metabolic genes isocitrate dehydrogenase 1 (IDH1) or IDH2 1,2, were shared in all matched ctDNA-positive CSF/tumor pairs, whereas we observed considerable evolution in growth factor receptor signaling pathways. The ability to monitor evolution of the glioma genome through a minimally invasive technique could advance the clinical development and use of genotype-directed therapies for glioma, one of the most aggressive human cancers.
Eighty-five adults with glioma underwent collection of cerebrospinal fluid (CSF) as part of their clinical evaluation for neurological signs or symptoms. Diagnoses included WHO grade IV glioblastoma (46/85; 54 %), WHO grade III glioma (26/85; 31 %), and WHO grade II glioma (13/85; 15 %). The diagnosis of glioma had been established by prior tumor biopsy or resection. All patients had received treatment for glioma prior to CSF collection, including surgery (85/85; 100%), radiation (84/85; 99%), and at least one systemic tumor-directed chemotherapy (81/85 95%) (Supplementary Information Table 1). The median duration of disease prior to CSF collection was 355 days for IDH-wildtype GBMs, 473 days for IDH-wildtype LGGs, and 2077 days for IDH-mutant LGG (Extended Data Fig. 1). Indications for lumbar puncture included signs or symptoms of CNS infection, leptomeningeal tumor spread, or increased intracranial pressure. All samples were analyzed using MSK-IMPACT, a custom FDA-authorized next-generation sequencing based tumor sequencing assay 15. We detected at least one tumor-derived genetic alteration in the CSF from 42/85 (49.4 %) glioma patients. In contrast, we did not detect any oncogenic variants in CSF from seven individuals with non-malignant neurological conditions (Extended Data Table 1).
In our glioma patients, several radiographic findings were associated with shedding of tumor DNA into CSF, including tumor progression (p= 0.0005, Fischer’s exact test), tumor burden (p= 0.0000017, Wilcoxon rank sum), and tumor spread toward the ventricular system or subarachnoid space (p=0.02, Fischer’s exact test)(Extended Data Fig. 2)(Table 1). The latter finding is reminiscent of a prior study which collected CSF during surgery and detected tumor DNA more commonly in patients with tumors abutting a CSF reservoir or cortical surface 14. Presence of tumor DNA in CSF was associated with shorter survival following CSF collection (Extended Data Fig. 3). In a multivariable analysis, CSF ctDNA positivity remained a statistically significant prognostic factor, even after adjustment for percent extent of resection at original diagnosis, tumor burden at CSF collection, and IDH status (Extended Data Table 2 and Supplementary Information Table 2). Subjects with CSF positivity experienced a four-fold risk of death compared to subjects who were CSF negative (p-value = 0.000024315). We found no significant association between ctDNA-positive CSF and glioma grade, disease duration, or prior therapy. Most patients with ctDNA-positive CSF (35/42 or 83%) did not have detectable malignant cells in CSF by standard CSF cytopathologic analysis.
Table 1.
Clinico-pathological Correlates of CSF ctDNA
| Characteristic | (+) ctDNA (n=42) |
(−) ctDNA (n=43) |
P-Value* |
|---|---|---|---|
| Median age -- yr (range) | 45 (22-77) | 51 (22-90) | 0.13 |
| Sex | 0.18 | ||
| Male -- no (%) | 30 (71) | 24 (56) | |
| Female -- no (%) | 12 (29) | 19 (44) | |
| WHO Grade | 0.08 | ||
| GBM (IV)--no (%) | 27 (64) | 19 (44) | |
| LGG (II, III)--no (%) | 15 (36) | 24 (56) | |
| CSF characteristics | |||
| Nucleated Cells – median (range) | 4 (0-281) | 1 (0-1025) | 0.019** |
| Protein – median (range) | 72 (24-2142) | 56 (13-230) | 0.017** |
| Positive cytologyǂ –no (%) | 7 (18) | 0 (0) | 0.005** |
| Prior Therapy | |||
| Prior resections (median) | 2 (1-5) | 1 (1-5) | 0.32 |
| Prior RT-–no (%) | 42 (100) | 42 (98) | 1 |
| Lines of prior systemic therapy (median) | 2 (0-5) | 2 (0-5) | 0.29 |
| Alkylator therapy – no (%) | 39 (93) | 39 (91) | 1 |
| Bevacizumab – no (%) | 17 (40) | 19 (44) | 0.83 |
| Immunotherapy – no (%) | 17 (40) | 9 (21) | 0.06 |
| Disease Duration | |||
| Interval since diagnosis--days (range) | 463 (62-5745) | 591 (63-9122) | 0.26 |
| Interval since last RT (days) | 256 (0-3591) | 327 (0-6167) | 0.35 |
| Interval since last systemic therapy (days) | 21 (0-982) | 25 (0-5984) | 0.17 |
| Radiographic Features (MRI brain) | |||
| Worsening probable tumor | 23 (55) | 8 (19) | 0.0005** |
| Enhancing disease# | 37 (93) | 28 (82) | 0.29 |
| Tumor Burden (SPD) (mm2)--median (range) | 1553 (0-10323) | 373 (0-4502) | 0.0000017** |
| Absence of LM, P, or SE disease (brain only) | 6 (14) | 16 (37) | 0.02** |
P values were calculated using nonparametric tests for comparisons using either Wilcoxon rank sun test or Fisher's exact test where appropriate
All statistical tests were two-sided with an alpha level ≤ 0.05 for statistical significance
5 patients were excluded from analysis because CSF cytology was not available
This analysis was limited to patients with enhancing disease
Abbreviations: GBM=Glioblastoma; LGG=Low grade glioma; RT=radiation therapy; SPD=sum of the products of the diameters; SE=subependymal; P=Pial; LM=lemptomeningeal
Certain genetic alterations occur at the earliest stages of glioma development. These alterations are viewed as “truncal” events during tumor evolution and are used to define prognostically distinct LGG subtypes 16. For example, gliomas with IDH mutation and 1p/19q codeletion typically also harbor mutations in telomerase reverse transcriptase (TERT) promoter. In contrast, gliomas with IDH and TP53 mutations (and no 1p/19q codeletion) often contain alterations in α-thalassemia/Mental-Retardation-Syndrome-X-linked (ATRX). TERT promoter mutations and ATRX gene alterations both promote telomerase maintenance and are mutually exclusive 17. We examined whether these combinations of genetic alterations or “LGG signatures” were detectable in CSF and matched the signature of the original tumor. We sequenced all available tumor biopsies from patients with positive CSF ctDNA (36/42 patients). These included ten LGGs, twenty GBMs, and six with DNA hypermutation in tissue or CSF. In 10/10 (100%) LGG patients without DNA hypermutation, the combination of genetic alterations defining the LGG subtype were congruent between CSF and tumor (Extended Data Fig. 4, Patients #1–10). Mutations were also shared between CSF and tumor in 20/20 (100%) GBM patients without DNA hypermutation (Extended Data Fig. 4, patients #11–30).
Further analysis of CSF ctDNA revealed a broad spectrum of protein-coding mutations, copy number alterations (CNAs), promoter mutations, and structural rearrangements. The most commonly observed alterations included mutations within the TERT promoter, the protein-coding regions of TP53, and the catalytic domain of IDH1 as well as deletions of CDKN2A/CDKN2B, amplifications of the Epidermal Growth Factor Receptor (EGFR), and the in-frame EGFR-variant III deletion (Fig. 1a).
Figure 1. Genomic Landscape of Glioma in the CSF.

a, Oncoprint of CSF mutations in 42 CSF ctDNA-positive glioma patients. Shown are the most common genetic alterations (SNVs/ Indels/ CNAs/ SVs). CSF ctDNA from 5/42 patients showed DNA hypermutation (labeled with an asterisk). b, and c, Comparison of somatic mutation rates and alterations in CSF ctDNA with somatic mutation rates and alterations detected in tumor tissue in a cohort of MSK patients (also sequenced by MSK-IMPACT, n=553). Panel b shows the median mutational burden in tumor tissue (left) and CSF (right). + = log10 scale. The box-plot elements are as follows for the MSK-IMPACT tissue cohort (N=553): Median = 4.461; Min = 0; Max = 410.240; 25th Percentile = 2.95; and 75th Percentile=5.903 and the CSF ctDNA cohort (N=42): Median = 4.902; Min = 0; Max = 196.078; 25th Percentile = 2.206; 75th Percentile = 5.882. Panel c shows the frequency of the most common genetic alterations in tumor tissue (light grey bars) and CSF (dark grey bars). After excluding hypermutated samples, the median mutation rate in CSF ctDNA and tumor was 3.92/Mb and 3.94/Mb, respectively.
CSF ctDNA from 5/42 (12 %) glioma patients (marked with an asterisk in Fig. 1a) showed a markedly higher mutation rate and harbored the signature (G:C-->A:T transitions) suggestive of prior exposure to alkylating agents 18–20 (Extended Data Fig. 5). All five patients had received temozolomide prior to CSF collection. The median mutation rate in CSF ctDNA was 4.90 mutations/Mb. This rate is higher than the reported mutation rate in The Cancer Genome Atlas (TCGA) for the LGG exome (0.7–0.8/Mb)3 or the GBM exome (2.2 /Mb) 21, but not different from the mutation rate in our glioma tumor biopsies previously sequenced with the same gene panel (Fig. 1b, MSK-IMPACT tissue cohort)(4.46/Mb). This observation may be partially related to the more advanced disease of our patients and the enrichment of frequently mutated genes in MSK-IMPACT. Overall, the frequency of genetic alterations in CSF ctDNA mirrored the distribution of genetic alterations in MSKCC glioma biopsies (Fig. 1c).
To determine whether mutations detected in CSF were also present in plasma, we sequenced plasma cfDNA from 19 glioma patients with positive CSF ctDNA using a high-sensitivity capture-based NGS assay (average raw sequence coverage >18,000x). This assay, while more targeted than MSK-IMPACT, encompassed at least 1 CSF mutation in each of the 19 patients, and 211 in total. We detected no mutations in plasma cfDNA from 16/19 (84%) patients (Supplementary Information Table 3). A total of 35 mutations were detected in the remaining three patients, including 32 from a single patient with a hypermutated tumor. The average variant allele fraction of these 35 mutations was very low in plasma (0.58%), compared to 23.96% in the CSF (Wilcoxon rank sum test comparing AFs p-value = 5.821e-11)(Supplementary Information Table 4). All three patients with positive plasma ctDNA had radiographic evidence for disseminated disease within the CNS and one of these patients (#11) later developed metastatic GBM (bone and lymph node involvement). These data demonstrate that CSF is a more frequent reservoir of tumor DNA than plasma in glioma patients. It also suggests that tumor DNA is directly shed from the tumor into CSF rather than reaching it indirectly through plasma.
Sequential tumor biopsies in patients with glioma have uncovered considerable evolution of the cancer genome during the course of the disease, with only 33–73 % of genetic alterations shared between the initial and recurrent tumor from the same patient 3–10. In our 30 CSF/tumor pairs without DNA hypermutation, the percentage of shared mutations varied considerably across samples (0–100%; Figure 2a), with a median 81.7 % shared mutation rate. In patients with hypermutated tumors, shared mutations were considerably less common (range: 3%−49%; Figure 2b) with a median 19.6 % shared mutation rate (Supplementary Information Table 5). The majority of mutations that were clonal in tissue were also present in CSF, even in patients with DNA hypermutation. In contrast, subclonal mutations were less likely to be shared in CSF (Fig. 2c).
Figure 2. CSF ctDNA documents evolution of the glioma genome.

a, b, Frequency of shared versus private mutations in “matched” tumor tissue/CSF sample pairs. Panel A shows results for patients without DNA hypermutation (n=30). Panel B shows results for patients with DNA hypermutation (N=6). The insets show the aggregate number of mutations for each cohort. Red=shared; Blue=private tissue; Teal=private CSF. c, Fraction of shared versus private mutations within clonal and subclonal tumor mutations. Top row: results from tumor/CSF pairs without DNA hypermutation (Non-HM). Bottom row: tumor/CSF pairs with DNA hypermutation (HM). Shared=red and private=blue. d, CSF ctDNA results in contemporaneously collected CSF replicates. Five patients underwent two CSF collections within three weeks [one lumbar puncture (LP) and one ventricular sample collected during VP stent placement]. Heatmaps display the variant allele frequencies of all the mutations detected in either replicate. e, comparison of tumor and CSF pairs collected within a three-week interval. Tumor samples were collected via biopsy and CSF collections were acquired via LP. Heatmaps display the variant allele frequencies of all the mutations present in either sample. f, divergence of mutations in growth factor receptor pathways. Shown is the presence (blue) vs. absence (white) of selected mutations in matched CSF/tumor pairs (N=30, non-hypermutated). Bold: Recurrent somatic mutations, defined as occurring >1 time across all gliomas in the MSKCC cancer cohort n=553. g, Representative example for convergent evolution. Shown is the disease course of patient #25 with GBM. MRIs (T2 FLAIR) are shown from the initial tumor resection (left) and at the time of CSF collection (right). The CSF sample collected at recurrence showed a new PDGFRA amplification and mutation and loss of the previously detected EGFR amplification and EGFR G719C mutation (copy number plots shown). Diamond=tumor sample profiled; Circle=CSF sample profiled. Heatmap VAF scale shown.
We also examined the concordance between contemporaneously collected CSF replicates and tumor/CSF pairs. Six patients in our study underwent placement of a ventriculo-peritoneal (VP) shunt for the treatment of hydrocephalus within three weeks of the initial lumbar puncture (LP). Despite collection from different anatomical locations within the CNS, the genomic profiles of these CSF replicates were highly concordant (Fig. 2d), even in patients with DNA hypermutation (Extended Data Fig. 6). Five patients in our study underwent a tumor resection within three weeks following CSF collection and showed near-identical genetic profiles in CSF and tumor tissue (Fig. 2e).
As the interval between tumor and CSF collection increased, we observed greater divergence of the genetic profiles, in particular within growth factor signaling pathways (Fig. 2f)(Extended Data Fig. 7). This discordance followed a pattern of convergent evolution with later samples showing other genetic alterations within the same gene or related signaling pathway. For example, the initial tumor biopsy from patient # 25 harbored a high-level EGFR amplification and EGFR missense mutation whereas a later CSF sample revealed amplification and mutation of the Platelet-Derived Growth Factor Receptor (PDGFR) without evidence for the original EGFR alteration (Fig. 2g). Similarly, the initial tumor profile of patient #28 showed an activating mutation in PIK3CA (E545K), whereas a later tumor biopsy showed amplifications of MET and PDGFRA and a subsequent CSF sample retained the MET amplification and acquired a MYC amplification while losing the PDGFRA amplification (Extended Data Fig. 8a). In LGGs, truncal alterations (IDH1, TP53, and ATRX) persisted throughout the disease course, but later samples documented additional mutations in glioma core pathways (Extended Data Fig. 8b), a pattern consistent with branched evolution of the LGG genome.
Our study shows that tumor-derived DNA in CSF from glioma patients provides a comprehensive and genetically faithful representation of the tumor genome at the time of the CSF collection. The frequency and type of alterations in CSF closely resembled the genomic landscape of diffuse glioma, as defined in large oncogenomic studies 2,16,22, and we observed high concordance between CSF and tumor DNA in patients who underwent both lumbar puncture and neurosurgical tumor resection within a few weeks. Any divergence between CSF and tumor genomes within the same patient followed the pattern of genomic evolution that has been reported in studies with sequential tumor biopsies. This evolution is characterized by the persistence of “truncal” genetic alterations (IDH1, 1p/19q codeletion, TP53, TERT, ATRX) and the convergent and branched evolution within glioma core pathways, in particular growth factor receptor pathways 3–10.
Performing a lumbar puncture in patients with a brain tumor is usually safe and done routinely for certain brain tumors as part of the staging criteria (e.g. CNS lymphoma, medulloblastoma, germ cell tumors). In patients who have a tumor which cannot be approached surgically, a lumbar puncture offers an opportunity to obtain a molecular signature and potentially a definitive diagnosis. In patients with tumor recurrence, a lumbar puncture is a simpler and safer procedure than a second craniotomy for another tumor sample. However, shedding of tumor DNA into CSF does not appear to be a universal property of diffuse glioma, even in previously treated patients. Our data suggests that the presence of ctDNA in the CSF may be an early indicator of progression in glioma. Further studies are needed to determine when tumor-derived DNA first becomes detectable in CSF. By demonstrating the accuracy and frequency of detecting important mutational changes through CSF profiling, our work provides a framework for such studies.
METHODS
Patients.
Our study includes CSF and tumor samples from 85 patients who were treated for glioma at Memorial Sloan Kettering Cancer Center (MSKCC) from January 2015 to April 2017. All patients had received treatment for glioma prior to CSF collection, including surgery (85/85; 100%), radiation (84/85; 99%), and at least one systemic tumor-directed chemotherapy (81/85 95%). For 7/85 patients, we isolated ctDNA from plasma within four weeks of CSF collection to compare sequencing results in blood and CSF. We used a previously published sequencing cohort that included 553 MSKCC glioma samples from 512 patients 23,24 to benchmark our CSF findings in glioma patients against a larger number of glioma tumor biopsies sequenced with the same platform. All patients signed informed consent under protocols approved by the MSKCC Institutional Review Board.
Magnetic Resonance Imaging (MRI).
All patients underwent brain MRIs as indicated by standard of care with standard sequences including axial T1-weighted, T2-weighted, fluid-attenuated inversion recovery (FLAIR) and contrast T1-weighted images. Brain MRIs prior to and directly following the initial resection were reviewed by an experienced neuroradiologist without knowledge of the CSF ctDNA results. To calculate extent of resection, the entire lesion was manually segmented using Aquarius iNtuition (Tera Recon Inc, Foster City, CA) using axial contrast-enhanced T1-weighted images for enhancing lesions and axial fluid attenuated inversion recovery (FLAIR) images for non-enhancing lesions. The process was repeated for the postoperative scans, with the volumes reported in cm3. Extent of resection was calculated for 63 patients with median 6 days between scans (range, 1–45). The remaining 22 patients were missing preoperative and/or postoperative scans. Brain MRIs that were performed closest to the CSF collection date were also reviewed by a neuroradiologist without knowledge of the CSF ctDNA results. Standard Response Assessment in Neuro-Oncology (RANO) criteria were applied to determine tumor burden (sum of the products of diameters or SPD) and radiographic progression 25. Presence or absence of radiographic signs of tumor spread to subependymal (SE), pial (P) and leptomeningeal (LM) sites was also documented. In a binary manner, subependymal spread was determined to be present when the edge of the enhancing lesion extended to the subependymal margin of any ventricle. Similarly, pial spread was determined as present when the edge of the enhancing lesion extended to any pial surface of the brain, and leptomeningeal spread when the enhancing lesion involved any subarachnoid space (e.g., in a sulcus or fissure).
CSF Collection.
CSF collections were performed as part of standard of care. CSF was collected by lumbar puncture in 82/85 (96 %) patients. Additional CSF samples were collected during VP shunt placement or intraoperatively. Altogether, our dataset includes 113 CSF samples. We collected two or more CSF samples for 22 patients.
Isolation of ctDNA.
Freshly collected CSF was stored at 4°C until centrifugation (1,400 rpm, 5 minutes, 4°C). CSF supernatants were transferred into cryotubes and stored in 3.5 mL aliquots at −80°C. Immediately prior to use, CSF (3.5 mL) was thawed in the waterbath at 37°C. The QIAsymphony SP system (QIAGEN) was used for DNA extraction using two kits throughout the duration of the study: the QIAsymphony DSP Virus/Pathogen Midi Kit (catalog #937055) and the QIAsymphony DSP Circulating DNA Kit (catalog #937556). No differences in cfDNA performance were observed between the two kits.
Whole blood was collected in Cell-Free DNA BCT tubes (STRECK, product #218962). Samples were centrifuged in two steps to isolate cell-free plasma. First, whole blood was centrifuged at 800 x g for 10 min (ambient temperature). The plasma was then separated from the red blood cells and separated plasma was centrifuged at 18,000 x g for 10 min (ambient temperature). Cell-free plasma (3.5 mL) was stored at 80°C until the time of ctDNA extraction with the QIAsymphony DSP Virus/Pathogen Midi Kit or DSP Circulating DNA Kit.
Isolation of Tumor and Germline DNA.
Isolation of tumor DNA from formalin-fixed and paraffin embedded (FFPE) tumors was performed using published protocols 24. Of the 42 patients in whom ctDNA was detected in the CSF, 36 had residual tumor tissue and germline DNA for targeted sequencing. These 36 “matched” cases were used for the determination of genetic alterations that were shared between CSF and tumor. [In these “matched pair” comparisons, we refer to tumor biopsy-derived DNA as “tissue” to distinguish biopsy-derived tumor DNA from CSF-derived tumor DNA.]
Targeted Capture & Sequencing.
All CSF ctDNA samples were subjected to molecular analysis using the Memorial Sloan Kettering - Integrated Molecular Profiling of Actionable Cancer Targets (MSK-IMPACT) assay, a custom FDA-authorized next-generation sequencing based assay 15 which captures all protein-coding exons of 410 cancer-associated genes as well as 46 introns from 17 recurrently rearranged genes. Tumor DNA was sequenced using one of 3 iterations of IMPACT (IMPACT 341, IMPACT 410, or IMPACT 468) 24. A genetically matched normal was used in 73/85 (86%) of cases. In patients without a genetically matched normal, variants were called against a single pool of unmatched normal samples, and variants were further filtered if the minor allele frequency was >1% in the 1000 Genomes cohort 26 as these are more likely to be common population polymorphisms than somatic mutations. The current framework can be found here (https://github.com/rhshah/IMPACT-Pipeline). Copy number variation was identified by analyzing sequence coverage of targeted regions in a tumor sample in comparison to a standard diploid normal sample after performing sample wide LOESS normalization for GC percentage across exons and normalizing for global differences in “on-target” sequence coverage, as previously described 15. All candidate somatic mutations, indels and structural aberrations were filtered, annotated using in-house tools, and manually reviewed using the Integrative Genomics Viewer 27.
Plasma cfDNA samples were sequenced using a separate custom capture-based next-generation sequencing assay composed of one or more exons in 129 genes in MSK-IMPACT. Plasma cfDNA libraries were prepared using adapters with duplex unique molecular indexes (UMIs) to allow replicate reads from the same original template molecule to be collapsed in an error-free consensus sequence. Duplex UMIs enabled the construction of consensus sequences involving reads from both strands of the original molecule. Samples were sequenced to a raw coverage of >18,000x and a median unique coverage of 1,032x. Mutations previously detected in CSF were determined to be present in plasma cfDNA if they were supported by two or more duplex consensus reads.
Comparison of genomic alterations in CSF and Tumor.
For concordance analysis of matched tumor/CSF pairs (n=36), mutations were designated as either “called” or “present”. “Called” mutations were independently detected without any prior knowledge using clinically validated filters (Total Depth ≥ 20, Variant Allele Depth ≥ 8 and Variant Allele Frequency ≥ 2% for known mutational hotspots; Total Depth ≥ 20, Variant Allele Depth ≥ 10 and Variant Allele Frequency ≥ 5% for novel mutations). For all mutations called in either the tumor or the CSF, a secondary mutation analysis was performed in which less stringent criteria were applied to detect the full compilation of SNVs detectable within our samples. Mutations were called as “present” if the Variant Allele Depth ≥ 2 and Variant Allele Frequency ≥ 1%. If these criteria were not met a mutation was marked as “not present” and considered to be private to the tumor or the CSF. For the matched pair analysis, the tumor used was the closest tumor sequenced to the time of CSF collection. In patients with multiple CSF collections, we prioritized CSF samples that met the following criteria: (1) at least one mutation “called” in CSF; (2) CSF collected through lumbar puncture (i.e., rather than during VP-shunt placement or intra-operatively); (3) highest sequence coverage; (4) shortest interval between CSF and tumor collection.
Clonality Analysis.
We determined total, allele-specific, and integer DNA copy number genome-wide using the FACETS algorithm in all cases 28. Allelic imbalance (including tumor-specific loss-of-heterozygosity) was determined from a change in the zygosity of heterozygous SNPs. We then defined the presence of genome doubling (GD) in samples for which the majority of the genome (> 50%) contained multiple copies from the same parent/allele. Gene-level copy number was assigned from spanning segments of integer copy number data in each tumor. Homozygous deletion was determined from regions of total copy number of zero. Amplifications were those regions of total integer copy number greater than 5 or 6 in diploid and GD cases respectively. Partial deletions (with intragenic breakpoints) were called whereas partial amplifications were not.
Statistical Analysis.
Associations between ctDNA positivity and patient and treatment characteristics were assessed using nonparametric tests by either Wilcoxon rank sum test or Fisher’s exact test. Wilcoxon rank sum was used for the continuous variables and Fischer’s exact test was used for the categorical variables. All statistical tests were two-sided with an alpha level ≤ 0.05 for statistical significance. To assess the association between CSF ctDNA positivity and overall survival, we performed a multivariable Cox model which included CSF ctDNA positivity and further adjusted for percent extent of resection at original diagnosis, tumor burden at CSF collection, and IDH status. Follow-up time was calculated from time of CSF collection until death or last follow-up. Deaths were treated as events in the model and those who were alive at last follow-up were censored.
DATA AVAILABILITY
All genomic results and associated clinical data for all patients in this study are publically available in the cBioPortal for Cancer Genomics at the following URL: http://www.cbioportal.org/study?id=glioma_msk_2018. The MSK-IMPACT data analysis pipeline can be found here: https://github.com/rhshah/IMPACT-Pipeline. The source data for Table 1 and Extended Data Figure 1 are available in Supplementary Table 1. The source data for the Multivariable analysis (Extended Data Table 2) is available in Supplementary Table 2. The source data for the matched pair analysis (Figure 2A-B) is available in Supplementary Table 5 (separate MS excel file).
Supplementary Material
Extended Data
Extended Data Table 1. Sequencing of CSF samples collected from individuals with non-malignant neurological conditions (“controls”).
a, the table lists the primary diagnosis of the patients, the indication for LP, and the sequencing coverage; b, list of sequence variants identified in negative control CSF samples. Because matched normal DNA was not available, sequence variants were filtered according to population sequencing databases. The remaining variants (above) may represent rare germline SNPs and have not previously been reported in databases of somatic mutations such as COSMIC.
| a | |||
|---|---|---|---|
| Sample # | Disease | Reason for lumbar puncture | Coverage |
| Control-1 | Headaches | rule out meningitis | 105x |
| Control-2 | Cryptococcal meningitis & HIV | infection | 1548x |
| Control-3 | Multiple Sclerosis | diagnostic work-up | 3x |
| Control-4 | Healthy Individual | n/a | 2x |
| Control-5 | Multiple Sclerosis | diagnostic work-up | 2x |
| Control-6 | Neurofibromatosis Type 2/schwannoma | leg weakness; rule-out inflammatory neuropathy | 4x |
| Control-7 | Meningioma | r/o normal pressure hydrocephalus | 5x |
| b | |||||||||||
|---|---|---|---|---|---|---|---|---|---|---|---|
| Sample # | Chr | Pos | Ref | Alt | Gene | cDNAchange | AAchange | Total Depth(DP) |
Variant Allele Depth(AD) |
Variant Allele Frequency(VAF) |
Present in cosmic? |
| Control-1 | X | 63409890 | C | T | AMER1 | c.3277G>A | p.E1093K | 96 | 39 | 0.40625 | Not present |
| Control-1 | 1 | 36938122 | G | A | CSF3R | c.839C>T | p.A280V | 83 | 30 | 0.361445783 | Not present |
| Control-1 | 2 | 46605868 | G | T | EPAS1 | C.1516G>T | p.A506S | 104 | 51 | 0.490384615 | Not present |
| Control-1 | 17 | 33428326 | C | T | RAD51D | C.461G>A | p.R154H | 88 | 48 | 0.545454545 | Not present |
| Control-1 | 8 | 145738723 | G | A | RECQL4 | c.2341C>T | p.P781S | 40 | 20 | 0.5 | Not present |
| Control-1 | 20 | 31023246 | C | T | ASXL1 | c.2731C>T | p.P911S | 1860 | 891 | 0.479032258 | Not present |
| Control-2 | 11 | 119155969 | C | T | CBL | c. 1634C>T | p.P545L | 1472 | 739 | 0.502038043 | Not present |
| Control-2 | 12 | 49437478 | T | C | KMT2D | C.5407A>G | p.T1803A | 1591 | 803 | 0.504714016 | Not present |
| Control-2 | 3 | 37092086 | G | A | MLH1 | C.2213G>A | p.G738E | 1493 | 727 | 0.486939049 | Not present |
| Control-2 | 5 | 79950696 | - | GCTGCAGCG | MSH3 | c.162_170dup | p.A60_A62dup | 1398 | 356 | 0.254649499 | Not present |
| Control-2 | 19 | 15302618 | T | C | NOTCH3 | c.740A>G | p.N247S | 2107 | 1019 | 0.483626009 | Not present |
| Control-2 | 19 | 50905288 | C | T | POLD1 | c.496C>T | p.R166W | 1685 | 797 | 0.472997033 | Not present |
| Control-2 | 9 | 8499691 | T | G | PTPRD | c.2278A>C | p.K760Q | 1566 | 784 | 0.50063857 | Not present |
| Control-2 | 3 | 12647740 | T | C | RAF1 | C.640A>G | p.M214V | 535 | 255 | 0.476635514 | Not present |
Extended Data Table 2. Results from multivariable model for overall survival from the time of CSF collection.
Analysis showed that CSF positivity was significantly associated with an increased rate of death from the time of CSF collection in an analysis also accounting for the following variables: 1) % extent of resection at diagnosis; 2) Tumor burden at the time of CSF collection; 3) IDH status. n=63 biologically independent samples were included in the analysis. This number comprises n = 33 samples from CSF ctDNA positive patients and n =30 samples from CSF ctDNA negative patients. The statistical tests used for the analysis were Wald tests and they are two-sided. HR=Hazard Ratio; CI=confidence interval.
| Variable | Category | HR | 95% CI | p-value |
|---|---|---|---|---|
| % Extent of resection at diagnosis | continuous | 1.005 | 0.997-1.013 | 0.26 |
| Tumor burden at LP/CSF | continuous | 1.0002 | 1.0001-1.0004 | 0.007 |
| CSF positivity | Negative | ref | -- | -- |
| Positive | 4.16 | 2.15-8.05 | 0.000024315 | |
| IDH Status | Mutant | ref | -- | -- |
| WT | 12.01 | 4.44-32.49 | 0.0000009778250 |
Extended Data Fig. 1. Interval between diagnosis and CSF collection, grouped by glioma subtype.
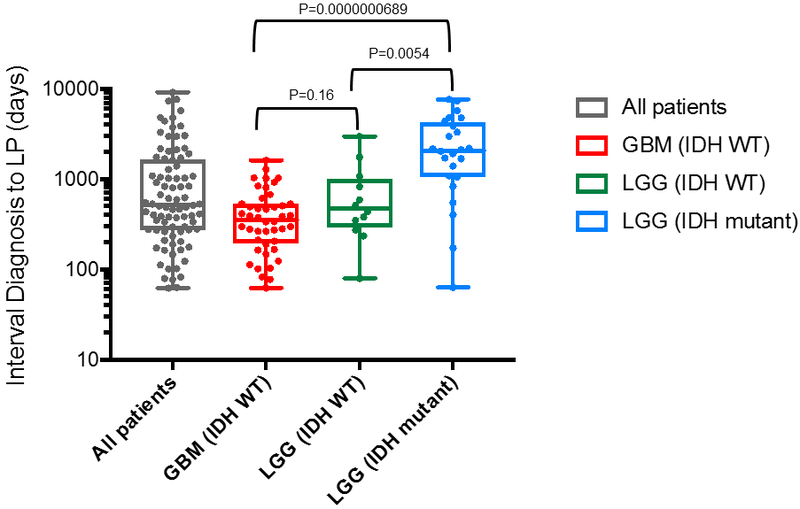
For the comparison between the GBM (IDH WT) and the LGG (IDH WT) groups the p-value is not significant at 0.16; between the GBM IDH WT and the LGG IDH mutant, the precise p-value is 0.0000000689; between the LGG (IDH WT) and the LGG (IDH mutant) groups the p-value is also significant (P=0.0054). The wilcoxon two sample test was used for two-way comparisons. No adjustments were made for multiple comparisons. The box-plot elements are as follows: All patients (N=85) [Grey box]: Median: 510; Minimum: 62; Maximum: 9122; 25th percentile: 273; 75th percentile: 1606; Maximum: 9122. GBM (IDH WT) (N=44) [Red box]: Median: 354.5; Minimum: 62; Maximum: 1606; 25th percentile: 193; 75th percentile 528. LGG (IDH WT) (N=12) [Green box]: Median: 473; Minimum:79; Maximum: 2982; 25th Percentile: 292; 75th percentile: 1013. LGG (IDH mutant) (N=24) [Blue box]: Median: 2077; Minimum: 63; Maximum: 7669; 25th percentile: 1061; 75th percentile: 4274. Abbreviations: GBM, glioblastoma; LGG, lower grade glioma; IDH, isocitrate dehydrogenase; WT, wildtype. *5 patients were excluded from sub-group analysis due to unknown IDH status.
Extended Data Fig. 2. Glioma growth toward CSF spaces.

Shown are representative Brain Magnetic Resonance Imaging (MRI) examples (T1 post-contrast) from patients with distinct patterns of tumor spread. Spread of enhancing disease to the pial, subependymal and subarachnoid spaces was used as an imaging surrogate to estimate tumor spread into the CSF, which is otherwise not visible by MRI. Panel a shows enhancing leptomeningeal spread along the bilateral cranial nerves VII and VIII (arrows). Panel b shows enhancing pial spread to the surface of the pons (arrows). Panel c demonstrates nodular and curvilinear enhancing subependymal spread along both lateral ventricles (arrows).
Extended Data Fig. 3. Interval between CSF collection and death for patients with positive (blue) and negative (red) CSF ctDNA.

a, all glioma patients: The median OS for CSF ctDNA-positive subjects was 3.15 months (95% CI: 1.97-4.63). The median OS for CSF ctDNA-negative subjects was 11.91 months (95% CI: 8.40-30.81). The log-rank p-value for comparing the survival experience of all glioma patients stratified by ctDNA status is 0.0000078675. b, GBM IDH WT patients: The median OS for CSF ctDNA-positive subjects was 2.04 months (95% CI: 0.98-3.77). The median OS for CSF ctDNA-negative subjects was 9.89 months (95% CI: 5.54-12.39). The log-rank p-value for comparing the survival experience of GBM IDH WT patients by ctDNA status is 0.000062396. The statistical test was two-sided.
Extended Data Fig. 4. Concordance between CSF and tumor in glioma subtype-defining genes.

Concordance between CSF and tumor in glioma subtype-defining genes. Shown are combinations of genetic alterations or “LGG signatures” that are consistently congruent between the CSF and tumor (10/10). This was also the case in Glioblastoma (20/20).
Extended Data Fig. 5. DNA hypermutation signature in CSF.

Shown is the disease course for GBM patient # 36 with two tumor resections and one CSF collection. The patient received 14 monthly cycles of temozolomide (TMZ) following the initial tumor resection and postoperative radiation (RT)/temozolomide (TMZ). The initial tumor harbored five mutations, the recurrent tumor 120 mutations and the CSF 132 mutations. MRIs (T1 post contrast) are shown at the time of diagnosis, 1st recurrence and 2nd recurrence. The original tumor was in the R parietal lobe while recurrence was in the R frontal lobe. Diamond=tumor samples profiled; Circle=CSF sample profiled. Bev= Bevacizumab. The bar graph shows the precise n number of SNVs that were called by the IMPACT pipeline in the recurrent tumor (n=120 independent somatic SNVs) and in CSF ctDNA (n=132 independent somatic SNVs)(INDELs were excluded). Bar graphs show the precise number of SNVs for each of the possible tri-nucleotide combinations.
Extended Data Fig. 6. Variant allelic frequencies for all SNVs in two independently collected CSF samples from Patient #34 with DNA hypermutation.

Scatter plot of variant allelic frequencies for all SNVs in two independently collected CSF samples from Patient #34 with DNA hypermutation. Both CSF replicates harbored over 200 SNVs. Pearson correlation coefficient (r2=0.966) was calculated based on a linear regression model in R [following Gist (https://gist.github.com/rhshah/3f4965a80886affb96d847dc2ecf69f5)].
Extended Data Fig. 7. Divergence of tumor and CSF profiles over time.
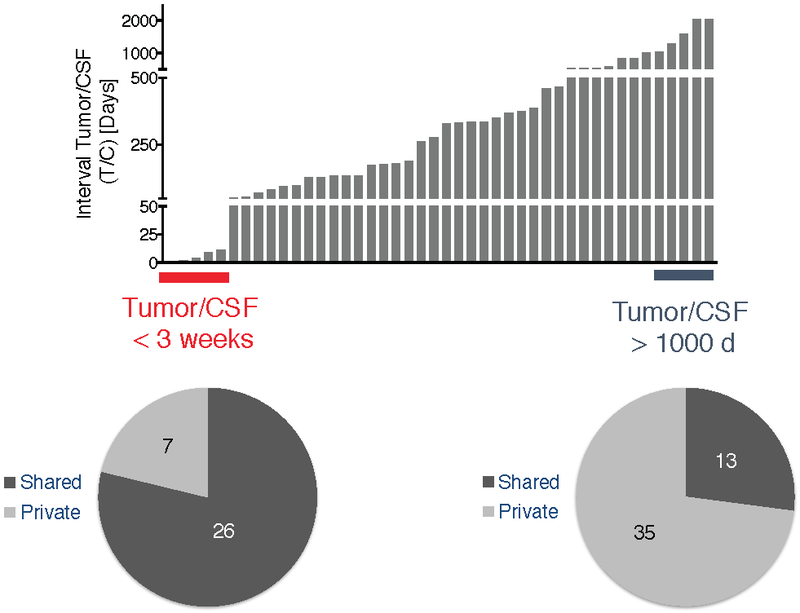
The histogram (top) depicts the interval (in days) between tumor and CSF collection. The pie chart below shows that the samples that were collected at a very close interval (<3 weeks; red) had a higher percentage of shared mutations (79 %) than the samples that were collected at a longer interval (>1000 days; blue)(29 %).
Extended Data Fig. 8. Evolution of the glioma genome.

a, disease course of Patient #28 (GBM, IDH WT) who received treatment with concurrent radiation(RT)/temozolomide (TMZ), bevacizumab, and a PD-1 inhibitor. The patient underwent three tumor resections and one CSF collection and all four biospecimens were sequenced. The CDK4 amplification was seen in all four samples. Amplifications of PDGFRA/KIT were observed in tumor #3, whereas the later CSF sample (#4) no longer showed the PDGFRA/KIT amplification. b, disease course of Patient #07 (IDH-mutant anaplastic astrocytoma). The patient underwent four tumor resections and 2 CSF collections. All 6 samples were profiled. MRIs (T2 FLAIR) correspond to the time of each tissue resection/CSF recollection. Below is a heat map showing all mutations across the 6 samples. Diamond=tumor samples profiled; Circle=CSF samples profiled. The heatmap indicates the Variant Allelic Frequency (VAF) of the indicated SNVs. TMZ=temozolomide; RT=radiation; Bev=bevacizumab.
Acknowledgments
FUNDING/SUPPORT
This research was supported by the National Brain Tumor Society Defeat GBM Initiative (IKM), the National Institutes of Health (1 R35 NS105109 01 and P30CA008748), Cycle of Survival (IKM), the American Brain Tumor Association (EIP), the Marie Josée and Henry R. Kravis Center for Molecular Oncology, the MSKCC Brain Tumor Center, and the MSKCC Neuro-Oncology Research in Translation (NORTH) Program.
Footnotes
SUPPLEMENTARY INFORMATION is linked to the online version of the paper at www.nature.com/nature.
REFERENCES:
- 1.Louis DN et al. The 2016 World Health Organization Classification of Tumors of the Central Nervous System: a summary. Acta Neuropathol 131, 803–820, doi: 10.1007/s00401-016-1545-1 (2016). [DOI] [PubMed] [Google Scholar]
- 2.Cancer Genome Atlas Research, N. Comprehensive genomic characterization defines human glioblastoma genes and core pathways. Nature 455, 1061–1068, doi: 10.1038/nature07385 (2008). [DOI] [PMC free article] [PubMed] [Google Scholar]
- 3.Suzuki H et al. Mutational landscape and clonal architecture in grade II and III gliomas. Nat Genet 47, 458–468, doi: 10.1038/ng.3273 (2015). [DOI] [PubMed] [Google Scholar]
- 4.Johnson BE et al. Mutational analysis reveals the origin and therapy-driven evolution of recurrent glioma. Science 343, 189–193, doi: 10.1126/science.1239947 (2014). [DOI] [PMC free article] [PubMed] [Google Scholar]
- 5.Aihara K et al. Genetic and epigenetic stability of oligodendrogliomas at recurrence. Acta Neuropathol Commun 5, 18, doi: 10.1186/s40478-017-0422-z (2017). [DOI] [PMC free article] [PubMed] [Google Scholar]
- 6.Bai H et al. Integrated genomic characterization of IDH1-mutant glioma malignant progression. Nat Genet 48, 59–66, doi: 10.1038/ng.3457 (2016). [DOI] [PMC free article] [PubMed] [Google Scholar]
- 7.Kim H et al. Whole-genome and multisector exome sequencing of primary and post-treatment glioblastoma reveals patterns of tumor evolution. Genome Res 25, 316–327, doi: 10.1101/gr.180612.114 (2015). [DOI] [PMC free article] [PubMed] [Google Scholar]
- 8.Kim J et al. Spatiotemporal Evolution of the Primary Glioblastoma Genome. Cancer Cell 28, 318–328, doi: 10.1016/j.ccell.2015.07.013 (2015). [DOI] [PubMed] [Google Scholar]
- 9.Wang J et al. Clonal evolution of glioblastoma under therapy. Nat Genet 48, 768–776, doi: 10.1038/ng.3590 (2016). [DOI] [PMC free article] [PubMed] [Google Scholar]
- 10.Lee JK et al. Spatiotemporal genomic architecture informs precision oncology in glioblastoma. Nat Genet 49, 594–599, doi: 10.1038/ng.3806 (2017). [DOI] [PMC free article] [PubMed] [Google Scholar]
- 11.Merker JD et al. Circulating Tumor DNA Analysis in Patients With Cancer: American Society of Clinical Oncology and College of American Pathologists Joint Review. J Clin Oncol, JCO2017768671, doi: 10.1200/JCO.2017.76.8671 (2018). [DOI] [PubMed] [Google Scholar]
- 12.Bettegowda C et al. Detection of circulating tumor DNA in early- and late-stage human malignancies. Sci Transl Med 6, 224ra224, doi: 10.1126/scitranslmed.3007094 (2014). [DOI] [PMC free article] [PubMed] [Google Scholar]
- 13.Pentsova EI et al. Evaluating Cancer of the Central Nervous System Through Next-Generation Sequencing of Cerebrospinal Fluid. J Clin Oncol 34, 2404–2415, doi: 10.1200/JCO.2016.66.6487 (2016). [DOI] [PMC free article] [PubMed] [Google Scholar]
- 14.Wang Y et al. Detection of tumor-derived DNA in cerebrospinal fluid of patients with primary tumors of the brain and spinal cord. Proc Natl Acad Sci U S A 112, 9704–9709, doi: 10.1073/pnas.1511694112 (2015). [DOI] [PMC free article] [PubMed] [Google Scholar]
- 15.Cheng DT et al. Memorial Sloan Kettering-Integrated Mutation Profiling of Actionable Cancer Targets (MSK-IMPACT): A Hybridization Capture-Based Next-Generation Sequencing Clinical Assay for Solid Tumor Molecular Oncology. The Journal of molecular diagnostics : JMD 17, 251–264, doi: 10.1016/j.jmoldx.2014.12.006 (2015). [DOI] [PMC free article] [PubMed] [Google Scholar]
- 16.Cancer Genome Atlas Research, N. et al. Comprehensive, Integrative Genomic Analysis of Diffuse Lower-Grade Gliomas. N Engl J Med 372, 2481–2498, doi: 10.1056/NEJMoa1402121 (2015). [DOI] [PMC free article] [PubMed] [Google Scholar]
- 17.Eckel-Passow JE et al. Glioma Groups Based on 1p/19q, IDH, and TERT Promoter Mutations in Tumors. N Engl J Med 372, 2499–2508, doi: 10.1056/NEJMoa1407279 (2015). [DOI] [PMC free article] [PubMed] [Google Scholar]
- 18.Tomita-Mitchell A et al. Mismatch repair deficient human cells: spontaneous and MNNG-induced mutational spectra in the HPRT gene. Mutat Res 450, 125–138 (2000). [DOI] [PubMed] [Google Scholar]
- 19.Hunter C et al. A hypermutation phenotype and somatic MSH6 mutations in recurrent human malignant gliomas after alkylator chemotherapy. Cancer Res 66, 3987–3991 (2006). [DOI] [PMC free article] [PubMed] [Google Scholar]
- 20.Alexandrov LB et al. Signatures of mutational processes in human cancer. Nature 500, 415–421, doi: 10.1038/nature12477 (2013). [DOI] [PMC free article] [PubMed] [Google Scholar]
- 21.Brennan CW et al. The somatic genomic landscape of glioblastoma. Cell 155, 462–477, doi: 10.1016/j.cell.2013.09.034 (2013). [DOI] [PMC free article] [PubMed] [Google Scholar]
- 22.Parsons DW et al. An integrated genomic analysis of human glioblastoma multiforme. Science 321, 1807–1812, doi:1164382 [pii] 10.1126/science.1164382 (2008). [DOI] [PMC free article] [PubMed] [Google Scholar]
- 23.Consortium, A. P. G. AACR Project GENIE: Powering Precision Medicine through an International Consortium. Cancer Discov 7, 818–831, doi: 10.1158/2159-8290.CD-17-0151 (2017). [DOI] [PMC free article] [PubMed] [Google Scholar]
- 24.Zehir A et al. Mutational landscape of metastatic cancer revealed from prospective clinical sequencing of 10,000 patients. Nat Med 23, 703–713, doi: 10.1038/nm.4333 (2017). [DOI] [PMC free article] [PubMed] [Google Scholar]
- 25.Wen PY et al. Response Assessment in Neuro-Oncology Clinical Trials. J Clin Oncol 35, 2439–2449, doi: 10.1200/JCO.2017.72.7511 (2017). [DOI] [PMC free article] [PubMed] [Google Scholar]
- 26.Genomes Project, C. et al. An integrated map of genetic variation from 1,092 human genomes. Nature 491, 56–65, doi: 10.1038/nature11632 (2012). [DOI] [PMC free article] [PubMed] [Google Scholar]
- 27.Thorvaldsdottir H, Robinson JT & Mesirov JP Integrative Genomics Viewer (IGV): high-performance genomics data visualization and exploration. Brief Bioinform 14, 178–192, doi: 10.1093/bib/bbs017 (2013). [DOI] [PMC free article] [PubMed] [Google Scholar]
- 28.Shen R & Seshan VE FACETS: allele-specific copy number and clonal heterogeneity analysis tool for high-throughput DNA sequencing. Nucleic Acids Res 44, e131, doi: 10.1093/nar/gkw520 (2016). [DOI] [PMC free article] [PubMed] [Google Scholar]
Associated Data
This section collects any data citations, data availability statements, or supplementary materials included in this article.
Supplementary Materials
Data Availability Statement
All genomic results and associated clinical data for all patients in this study are publically available in the cBioPortal for Cancer Genomics at the following URL: http://www.cbioportal.org/study?id=glioma_msk_2018. The MSK-IMPACT data analysis pipeline can be found here: https://github.com/rhshah/IMPACT-Pipeline. The source data for Table 1 and Extended Data Figure 1 are available in Supplementary Table 1. The source data for the Multivariable analysis (Extended Data Table 2) is available in Supplementary Table 2. The source data for the matched pair analysis (Figure 2A-B) is available in Supplementary Table 5 (separate MS excel file).