Abstract
The micellar property of mixed surfactant systems, cationic (dodecyltrimethylammonium bromide, DTAB) and anionic (sodium dodecylsulfate, SDS) surfactants with variable molar ratios in aqueous system has been reported by using surface tension and conductivity measurements at T = 293.15, 298.15 and 303.15 K. DTAB concentrations are varied from 1.0 × 10⁻⁴ to 3 × 10⁻⁴ mol l−1 in 1.0 × 10⁻² mol l−1 SDS solution while the SDS concentration is varied from 1.0 × 10⁻³ to 1.5 × 10⁻² mol l−1 in approximately 5.0 × 10⁻³ mol l−1 DTAB, so that such concentrations of DTAB-SDS (DTAB-rich) and SDS-DTAB (SDS-rich) solutions were chosen 3 : 1 ratio. The critical micellar concentration, as well as surface and thermodynamic properties for DTAB-rich and SDS-rich solutions, were evaluated by the surface tension (γ) and conductivity (κ) methods. The pseudo phase separation model was coupled with the dissociated Margules model for synergism. The Krafft temperature behaviour and optical analysis of mixed surfactants are studied using conductivity and UV–Vis spectroscopy, respectively. The dispersibility and stability of DTAB-rich and SDS-rich solutions with and without dyes (2.5 × 10⁻⁵ mol l−1 of methyl orange and methylene blue) are carried out by using UV–Vis spectroscopy and dynamic light scattering.
Keywords: critical micellar concentration, DTAB-rich, SDS-rich, surface properties, thermodynamic properties
1. Introduction
For the understanding of both fundamental and applicative prospects of mixed surfactant systems, the scrutiny of their various significant physico-chemical aspects becomes necessary. These physico-chemical aspects include aggregates formation, which depends on system environmental parameters including temperature and the other additives [1].
The physico-chemical properties (PCPs) of solutions containing both cationic and anionic surfactants, i.e. catanionic surfactant systems are different from those of their individual components. Due to the synergetic effect, the critical micellar concentration (CMC) value of mixed surfactant system is less than the pure surfactant system [2]. The catanionic surfactant system shows lower CMC, higher cloud point, lower Krafft point and higher surface activities; these properties are accommodating for their various applications [3]. At the appropriate concentrations and mole ratios, this catanionic surfactant system spontaneously tends to form fascinating structures, like mixed micelles [4], vesicles [5] and extended networks. The mixed surfactants play a very significant role in our life. It has several applications in the industrial and biological fields such as oil recovery enhancement, detergency, cosmetics, emulsification, solubilization, food industries, targeted drug delivery, wastewater treatment, chemical purification and synthesis of advanced nanomaterials [6,7]. Therefore, mixed surfactant systems are believed to be superior to single surfactant systems [8].
To date, many researchers have reported the study of micelle formation and aggregation process in the various solvent media [9,10]. The phase behaviour of various catanionic surfactant mixtures in aqueous solution is also well studied [11,12]. Among them, Zana et al. [13] studied the micellization behaviour of cationic surfactant mixtures with an aqueous solution; nevertheless, the thermodynamic properties of the solutions were not investigated. Sohrabi et al. [14] studied the phase behaviour and aggregate structures of mixed surfactants by using pulsed field gradient stimulated echo NMR technique. Yousefi et al. [15] reported the effect of co-solvent on the spontaneous formation of nanorod vesicles in catanionic mixtures of cetyltrimethylammonium bromide (CTAB) and sodium dodecylsulfate (SDS). Bhattarai [16] studied the micellization behaviour of cationic surfactant mixtures in aqueous solution as well as methyl alcohol–water mixture along with the detailed investigation of thermodynamic phenomena. Aslanzadeh & Yousefi [17] reported the micellization behaviour of tetradecyltrimethylammonium bromide (TDTAB) and SDS in the water–ethanol mixture. The self-assembling of catanionic surfactant mixtures in aqueous ionic liquid was studied by Sohrabi et al. [18]. The self-aggregation behaviour of catanionic surface active ionic liquids was studied by Xu et al. [19]. Similarly, the effect of the molecular structure of cationic surfactant mixtures on the interfacial properties at the oil–aqueous interface was reported by Wang et al. [20]. Earlier studies have been reported on the interaction of mixed surfactants with salts [21]. Recently, Bhattarai et al. [22] determined the micellar properties between DTAB and SDS in methanol–water mixed solvent media of varying proportions at 293.15 K. In this study, we have studied the effect of temperature on CMC and several other surface properties in depth; such type of study is not reported yet. Sachin et al. [23] have reported in the previous study on PCPs of DTAB-rich and SDS-rich mixed surfactant in the aqueous medium at 293.15, 298.15 and 303.15 K.
Our first objective is to determine the surface properties as the maximum surface excess concentration (), area occupied per surfactant molecule (), surface pressure at the CMC (), the free energy of adsorption (), packing parameter (P), free energy of surface at equilibrium and the thermodynamic properties such as the degree of ionization (), the standard behaviour of Gibb's free energy of micellization (), enthalpy (), entropy (), heat capacity of micellization of SDS-rich and DTAB-rich from and data, respectively. The study of synergistic effects of our system with the help of models is also our interest. Moreover, we study the Krafft temperature behaviour and the optical analysis of mixed surfactants by conductivity measurements and UV–Vis spectroscopy, respectively.
Earlier studies have reported the effect of dyes with single and mixed surfactants [24,25]. Samiey & Ashoori [26] have studied the kinetic and thermodynamic properties on the effect of crystal violet with DTAB and SDS. Dey et al. [27] have also reported the diffusion rate of dyes with SDS and DTAB vesicle in bulk water separately. Therefore, dye-surfactant interactions studies are very useful for industrial applications, chemical research and dye separation processes [28]. Till now, there was no literature reported yet on the effects of methylene blue (MB) and methyl orange (MO) on equimolar concentrations of SDS-rich and DTAB-rich.
Our second objective is to see the effects of each concentration of DTAB-rich surfactant with MB and MO separately and also to determine the binding and distribution constants by using the spectroscopic method as well as to estimate the stability of SDS-rich and DTAB-rich surfactant with and without dyes from dynamic light scattering (DLS) analysis.
2. Material and methods
2.1. Materials
The DTAB (purity approx. 99%), SDS (approx. 98.5%), MO (greater than 85%) and MB (greater than 96%) used in the experiments were obtained from Sigma-Aldrich and SD Fine Chemicals Ltd (Mumbai, India). The surfactants were stores of DTAB and SDS, the vacuum desiccator filled with P2O5 due to their hygroscopic nature.
2.2. Methods
Milli-Q water was used for the preparation of all the solutions of mixed surfactants at three different temperatures as described in the earlier study [23]. Also, Milli-Q water was used for the preparation of the aqueous solutions of MB and MO and stored in the airtight volumetric flasks.
2.3. Density measurements
The densities () were measured by Anton Paar DSA 5000 M density meter, which was calibrated with DMSO (table 1) at T = 293.15, 298.15 and 303.15 K and compared with the literature [31].
Table 1.
Comparison of measured densities values (ρ) and surface tension (γ) values of DMSO at T = 293.15, 298.15 and 303.15 K with the literature data. Standard uncertainties are u(T) = ± 0.01 K, u(p) = ± 0.01 MPa. Unit: Δρ = 103 kg m−3, Δγ = mN m−1. Δρ = Exp. - Lit., Δγ = Exp. - Lit. values.
2.4. Surface tension measurements
The electronic counter counted the pendant drop numbers of mixed surfactants with the Survismeter [31] after attaining a thermal equilibrium in Lauda Alpha RA 8 thermostat with ± 0.05 K. The reported surface tension was average values of three repeated measurements with ± 0.03 mN m−1 combined uncertainty in surface tension. The Survismeter was calibrated by using DMSO. The surface tension data of our system agree well with the literature value (table 1) [30]. The presented surface tension () and log C (i.e. C is the surfactant concentration) were plotted, for calculating the CMC value.
2.5. Conductance measurements
Specific conductance data were measured at T = 293.15, 298.15 and 303.15 K with the Pye-Unicam PW 9509 model conductivity meter having the frequency of 2000 Hz using a dip-type cell with a cell constant of 1.15 cm−1 with an uncertainty of 0.01%. The instrument cell was calibrated by using the proposed method [32] using the aqueous potassium chloride solution. The temperature of the measurement cell was controlled with a Lauda Alpha RA 8 thermostat with ± 0.05 K.
2.6. UV–visible spectroscopy
Absorbance was measured by the Spectro 2060 plus model of UV–visible spectrometer. The spectral analysis was done in the range of 200–600 nm at 298.15 K. All UV–visible measurements were carried out with the following procedure. Firstly, the measurement of baseline with water was done. After that, 3 ml of DTAB-rich and SDS-rich different concentrations of surfactant solutions involved obtaining a well-marked absorption band. For mixed surfactants interaction with dyes, the baseline was registered for given DTAB-rich solution, and afterwards, a constant volume of aqueous MO or MB solution was added and the solution was mixed properly for 5 min. After that, the absorbance was noted.
By experimental data, the intensity of dye absorbance as a function of the concentration of DTAB-rich was examined. Using nonlinear regression procedure, MO and MB binding constant and MO and MB distribution constant between the aqueous phase and DTAB-rich micellar phase were calculated.
2.7. Zeta potential, polydispersity index and hydrodynamic radius measurements
Zeta potentials, polydispersity index (PDI) and hydrodynamic radius of DTAB-rich and SDS-rich surfactants in the presence and absence of MO and MB dye in the aqueous medium were measured by dynamic light scattering (DLS, MicrotracZetatrac, U2771). Using an aqueous surfactant, the set-zero was made to nullify their contribution in the formulations. The calibration was done using an aqueous dispersion of polystyrene in Milli-Q water for a standard particle diameter and zeta potential measurements at 298.15 K and p = 0.1 MPa with ± 2 nm and ± 5 mV uncertainties, respectively.
2.8. Krafft point measurements
The Krafft temperatures () of DTAB-rich and SDS-rich surfactant solutions were determined by placing the samples in a refrigerator at 278.15 K for at least 24 h, and the precipitation was observed. The temperature was raised slowly by recording the specific conductance after every 2 min till the steady value in the circulatory bath under constant stirring. The increment of temperature in the circulatory bath should be slow in order to make the solution homogeneous, and the mobility of the molecules of the mixed surfactants was regular, and the specific conductivity value was accurate without fluctuation in the experimental conductivity value. There was the temperature in which the specific conductance against temperature graph displayed the sudden alteration in the slope [33]. Such temperature was the same as that required for complete dissolution of the precipitated system into a clear solution. The Krafft temperature measurements reproducibility in each case was within ± 0.05 K.
3. Results and discussion
3.1. Surface tension () and surface properties
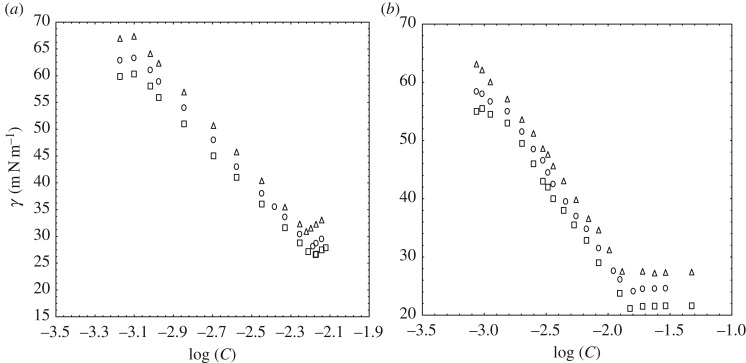
We can observe in figure 1a that the γ initially decreases with an increment of the concentration of SDS-rich and goes to the lowest value which indicates the formation of the micelle and the break point is the CMC. Now for figure 1b of DTAB-rich, the is reduced with the sharp break after which stays very nearly constant. This meeting point provides CMC [34]. Table 2 contains the CMC of SDS-rich and DTAB-rich surfactant by tensiometry.
Figure 1.
Plot of surface tension versus concentration of SDS-rich (a) and DTAB-rich (b) solution at T = 293.15 (triangle), 298.15 (circle) and 303.15 K (square).
Table 2.
Values of slope, critical micelle concentration (CMC), maximum surface excess concentration (Γmax), area occupied by per surfactant molecule (Amin), surface pressure (πcmc), packing parameter (P), standard free energy interfacial adsorption () of SDS-rich and DTAB-rich in aqueous medium at T = 293.15, 298.15 and 303.15 K. The error limits of CMC, Γmax, Amin, πcmc, P and are within ±3, ±5, ±4, ±3, ±4 and ±6%, respectively. Standard uncertainty is u(T) = ±0.01 K.
| temperature (K) | slope (mN m−1 lnM−1) | CMC (mol l−1) | Γmax (106 mol m−2) | Amin ( molecule−1) | πcmc (mNm−1) | P | (kJ mol−1) |
|---|---|---|---|---|---|---|---|
| SDS-rich | |||||||
| 293.15 | −41.70 | 0.0060 | 3.71 | 44.70 | 41.95 | 0.47 | −43.39 |
| 298.15 | −38.40 | 0.0063 | 3.36 | 49.37 | 43.85 | 0.43 | −45.29 |
| 303.15 | −37.20 | 0.0067 | 3.20 | 51.82 | 44.61 | 0.41 | −46.31 |
| DTAB-rich | |||||||
| 293.15 | −32.2 | 0.0135 | 2.87 | 57.89 | 45.35 | 0.36 | −49.5 |
| 298.15 | −31.8 | 0.01401 | 2.79 | 59.62 | 47.91 | 0.35 | −51.1 |
| 303.15 | −31.3 | 0.0147 | 2.70 | 61.59 | 49.99 | 0.34 | −52.5 |
The CMC of SDS-rich decreased to a value of 6.30 mM (table 2) in contrast with the CMC of 8.30 mM of SDS [35] at 298.15 K and the CMC of DTAB-rich diminished to a value of 14.01 mM (table 2) in contrast with the CMC of 14.6 mM of DTAB [36] at 298.15 K. The decrease in CMC was observed for cationic surfactant mixtures [37], due to the synergism in mixed micelle formation that is present when a mixture of two surfactants has a CMC lower than those of both individual surfactants [38]. The CMC increase here with an increase in temperature is due to the smaller probability of the hydrogen bond formation [39].
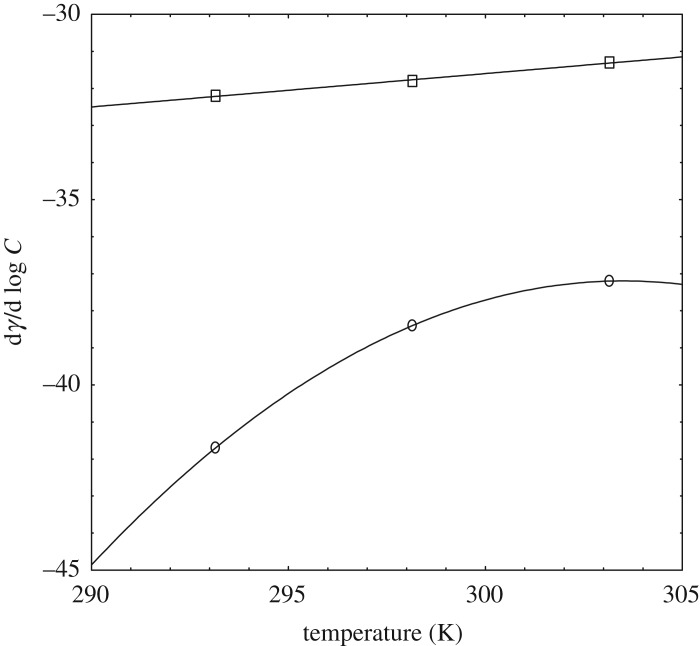
The slope of the sigmoidal curve, where C is a surfactant concentration (mol l−1), gives numerous facts regarding the surface properties [34]. The plot of slope of SDS-rich and DTAB-rich surfactant solutions with temperature is displayed in figure 2.
Figure 2.
Variation of with temperature (K) for DTAB-rich (square) and SDS-rich (circle).
The slope can play a vital role in the surface properties of mixed surfactants (table 2). It is observed in figure 2, that both the graphs containing a minimal variation in nature. For DTAB-rich, the graph is best fitted with a polynomial of second degree fit, whereas, for SDS-rich, the graph is best fitted with a linear fit. From the slope of the curve, the maximum surface excess concentration () value is evaluated with Gibb's isotherm [34].
| 3.1 |
Here, R is value of gas constant and n takes the value of 2 [36].
The surface excess concentration (Γmax) is an adequate measure of adsorption at the air/solution interface which depends upon the nature of surfactants.
The Γmax of SDS-rich in water is observed as 3.71 µmol m−2 (table 2) at 293.15 K which matched with the literature [22]. But there is a decrease in the value of Γmax with an increase of temperature as 3.36 µmol m−2 (table 2) at 298.15 K in contrast with the Γmax of 2.65 µmol m−2 of SDS in the aqueous system [35] at 298.15 K.
Similarly, Γmax of DTAB-rich in water is noted as 2.87 µmol m−2 (table 2) at 293.15 K which agreed with the reported study [22]. But there is a decrease in the value of Γmax with an increase of temperature as 2.79 µmol m−2 (table 2) at 298.15 K in contrast with the Γmax of 1.56 µmol m−2 of DTAB in the aqueous system [40] at 298.15 K.
Table 2 shows that the Γmax values decrease with an increase in temperature which may be due to the enhanced molecular thermal agitation at higher temperature [41]. Such behaviours were also observed in the previous study [36].
The area occupied per surfactant molecule (Amin) is calculated by following equation:
| 3.2 |
where N stands for Avogadro's number.
Our data of value of SDS-rich in the water is 44.70 molecule−1 (table 2) at 293.15 K which is supported by the earlier result [22]. With increasing the temperature, the value is increased as 49.37 molecule−1 (table 2) at 298.15 K, while with anionic surfactant (SDS) in water value is 62.10 molecule−1 at 298.15 K [35].
In the same way, it is noted that the value of DTAB-rich in water as 57.89 molecule−1 (table 2) at 293.15 K is similar to the reported data [22]. With an increase in temperature, the value of DTAB-rich in water is observed as 59.62 molecule−1 (table 2) at 298.15 K, in contrast with the value of DTAB in water as 106.37 molecule−1 [40] at 298.15 K.
The increase in was observed with an increase in temperature process orientation as a result of the thermal molecular motion at high temperatures [42]. The Γmax and Amin are inversely proportional with rising of the temperature. Such trends were also noted in earlier studies [36].
If there is no interaction [40] between SDS and DTAB, but they only compose the mixed adsorption film, the ideal area of the mixed adsorption film can be calculated as
| 3.3 |
For SDS-rich, = (0.75) is the mole fraction of the SDS in the total mixed solute. By substituting the values of (62.1 molecule−1 and 63 molecule−1 for pure SDS) and (106.37 molecule−1 and 111 molecule−1 for pure DTAB) at 298.15 K and 303.15 K, respectively, in equation (3.3), we get (73.16 molecule−1 at 298.15 K and 75 molecule−1 at 303.15 K).
Similarly, For DTAB-rich, = (0.75) is the mole fraction of the DTAB in the total mixed solute. By substituting the values of (106.37 molecule−1 and 111 molecule−1 for pure DTAB) and (62.1 molecule−1 and 63 molecule−1 for pure SDS) at 298.15 K and 303.15 K, respectively, in equation (3.3), we get (95.30 molecule−1 at 298.15 K and 99 molecule−1 at 303.15 K).
It is observed that the values of are higher than Amin of SDS-rich and DTAB-rich systems (table 2), and the values of are higher than Amin of DTAB and SDS. Also, it is noted that the Amin values for SDS-rich and DTAB-rich systems are lower in comparison with the pure SDS and DTAB. Such behaviour was noted in the literature [40]. The lowered Amin values indicate a significant attractive interaction between the components of the mixed surfactant system and hence the strongest attraction between the oppositely charged head groups [43].
The surface pressure at the CMC () is calculated by using the following equation:
| 3.4 |
where and have the usual meanings.
The calculated value of SDS-rich in water as 41.95 mN m−1 (table 2) at 293.15 K closed with the literature [22]. With an increase in temperature, the value is also increased as 43.85 mN m−1 (table 2) at 298.15 K, but there is the difference in of SDS in water as 32.43 mN m−1 at 298.15 K [35].
Similarly, the value of DTAB-rich in water is found as 45.35 mN m−1 (table 2) at 293.15 K and then closed with an already reported study [22]. With an increase in the temperature, the value is obtained as 47.91 mN m−1 (table 2) at 298.15 K which is different from the value of DTAB in water as 29.35 mN m−1 [40] at 298.15 K.
An increase in is observed with an increase in temperature. The reason is that is a measure of the efficiency of the surfactant to lower the surface tension of water. Such increase in with a rise in temperature was also noted in the earlier research work [44]. Normally, an increase in for mixed surfactants deals with an associative interaction [45]. Israelachvili et al. [46] have discussed the micellar shape. To find out the packing parameter, the surface area of amphiphiles in mixed micelles and micellar growth may be used as
| 3.5 |
The value of P as 0.47 of SDS-rich in the aqueous system (table 2) at 293.15 K is similar to the literature data [22]. But with increase in the temperature, the P value decreases as 0.43 (table 2) at 298.15 K in contrast with the value as 0.34 for P of SDS in water at 298.15 K [35]. Similarly, P of DTAB-rich in water is observed as 0.36 (table 2) at 293.15 K is close to the literature [22], and when temperature increases, there is a decrease in the P value as 0.35 (table 2) at 298.15 K in contrast with the P value as 0.20 at 298.15 K of DTAB in water [36].
Thus, the packing parameter infers that the structural parameter of the surfactant at a molecular level with a favoured interfacial curvature is the resulting aggregate. The geometry of surfactant indicates that with the deep impact in the type of self-assembly structure of surfactants formed in solution, which is dependent on the packing parameter, amphiphiles can form different structures, spherical, cylindrical micelles, lamellar phases and reverse micelles, etc. [47].
Basically, the micelles are spherical for p < 1/3, cylindrical for p < 1/2 suggested by Israelachvili et al. [46]. In our investigation, from table 2, it is observed that P values for both DTAB-rich and SDS-rich are higher than 0.3, indicating the formation of cylindrical or rod-shaped micelles. With an increasing temperature, the P values decrease due to inducing the vibrational, rotational and translational oscillations with wreaking of binding forces of the SDS-rich and DTAB-rich mixed surfactants system [41]. Such a trend was also seen in the reported study [36]. The higher value of P in mixed surfactants indicates disc-like micelles formation in water, which should also be suitable to form reverse micelles [48].
3.1.1. Correlation of packing parameter with temperature
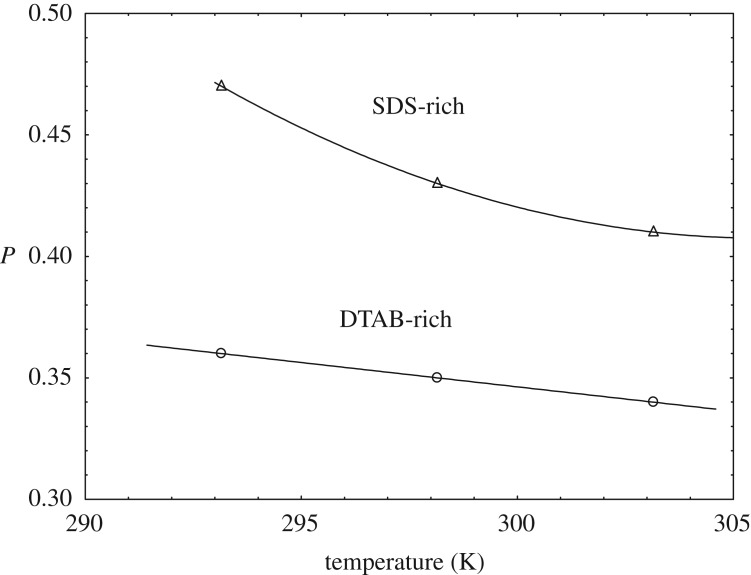
The decrease of P with temperature is sharply linear having a correlation coefficient (r2 = 1) for DTAB-rich whereas SDS-rich shows the decrease of P with temperature is in the concave pattern curve (figure 3).
Figure 3.
Variation of P with temperature (K).
From Tanford's formula [49], V0 is the volume of exclusion per monomer in the micelle:
,; lc is the highest chain length, whereas nc is carbon atoms in the chain of a hydrocarbon. The free energy of adsorption was calculated by using the following equation [46]:
| 3.6 |
From equations (3.1)–(3.6), Γmax, , P and are evaluated for DTAB-rich and SDS-rich and are displayed in table 2.
Our data of of SDS-rich in water is observed as −43.39 kJ mol−1 (table 2) at 293.15 K and it is similar to the reported value [22], while at 298.15 K, the value decreases as −45.29 kJ mol−1 (table 2) of SDS-rich system, and the value of −51.80 kJ mol−1 for of SDS in aqueous system at 298.15 K was observed [40].
In the case of DTAB-rich in water, the value is −49.5 kJ mol−1 at 293.15 K and then it is closed with the literature [22]. With an increasing temperature, the value decreases as −51.1 kJ mol−1 (table 2) at 298.15 K in contrast with the value of −48.63 kJ mol−1 for of DTAB in an aqueous system at 298.15 K [36].
Negative values of indicate spontaneity of the adsorption of surfactant molecules on the surface. The values become more negative on increasing the temperature, which is indicating the higher spontaneity of adsorption of surfactant molecules on the surface; the negative values were also observed in the literature [36].
3.1.2. Correlation of with temperature
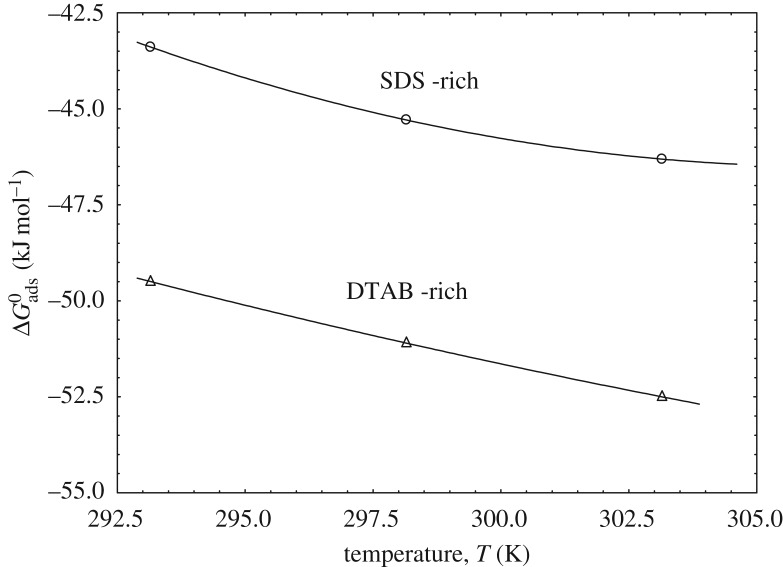
Gibbs energies of adsorption of SDS-rich and DTAB-rich show the unique variation. It is found that there is a concave curve with an increase of temperature for SDS-rich, whereas, in DTAB-rich, the curve became linear with a correlation coefficient (r2 = 1) with an increase of temperature (figure 4).
Figure 4.
Variation of with temperature (K).
3.1.3. Correlation of with temperature
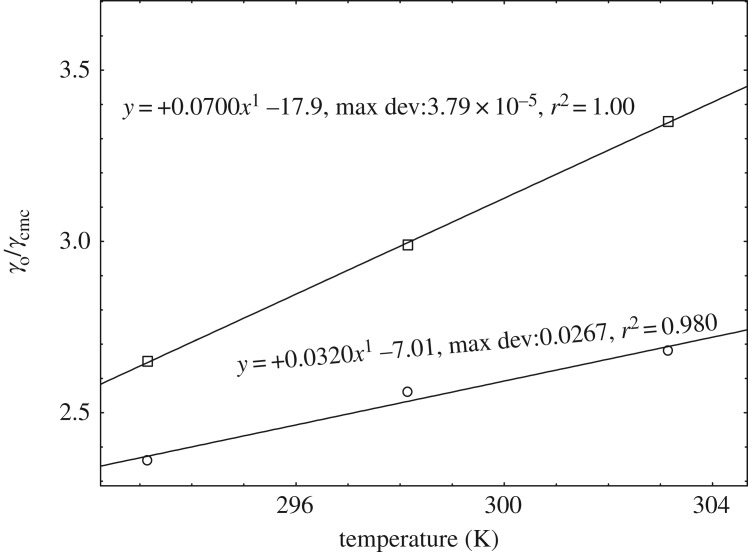
Secondary parameters can be generated from the primary data of surface tension. In 2012, a new concept to describe the solvophobic effect [50] was proposed by Mukhim and Ismail. They calculated the ratio of the solvent surface tension to the solution surface tension at the CMC, . This ratio can be used to describe the solvophobic effect [51]. Figure 5 shows that the variation of the ratio of the solvent surface tension to the solution surface tension at the CMC with temperature for DTAB-rich and SDS-rich systems. The plot of with the volume fraction of methanol at 293.15 K was noted for the concave nature of the curves by Pathak et al. [22] for DTAB-rich and SDS-rich systems, whereas we have seen the linear variation with temperatures for DTAB-rich and SDS-rich systems. But the DTAB-rich has the higher curve than SDS-rich with a slope (0.07) and the correlation coefficient (r2 = 1) and whereas SDS-rich has a slope (0.032) and the correlation coefficient (r2 = 0.980).
Figure 5.
Variation of with temperature: open circles (SDS-rich) and open squares (DTAB-rich).
The observed values are higher than values indicating the adsorption at the air–solution interface is more favourable than the formation of micelles in the bulk solution [52]. The ratio of was found to be approximately 1.5 (table 3) for SDS-rich and DTAB-rich at different temperatures indicating less spontaneity in the transfer of the monomers to the interface [53].
Table 3.
Values of solution surface tension (γcmc), solvent surface tension (γo), γo/γcmc, free energy of surface at equilibrium (Gmin) and of SDS-rich and DTAB-rich in aqueous medium at T = 293.15, 298.15 and 303.15 K. Errors limits of γcmc, γ0 and ΔGmin are within ± 4%, ± 3% and ± 5%, respectively.
| temperature (K) | γcmc (mN m−1) | γo (mN m−1) | γo/γcmc | Gmin (kJ mol−1) | |
|---|---|---|---|---|---|
| SDS-rich | |||||
| 293.15 | 30.80 | 72.75 | 2.362 | 8.29 | 1.35 |
| 298.15 | 28.16 | 72.01 | 2.557 | 8.37 | 1.40 |
| 303.15 | 26.60 | 71.21 | 2.677 | 8.30 | 1.43 |
| DTAB-rich | |||||
| 293.15 | 27.40 | 72.75 | 2.655 | 9.55 | 1.47 |
| 298.15 | 24.10 | 72.01 | 2.988 | 8.65 | 1.50 |
| 303.15 | 21.16 | 71.21 | 3.349 | 7.85 | 1.54 |
Free energy of surface at equilibrium is also known as molar Gibbs energy at CMC for maximum adsorption attained. This is one of the thermodynamic parameters for the evolution of synergism in mixed adsorption film at equilibrium [54] and calculated as follows:
| 3.7 |
where is the surface tension at CMC and NA is the Avogadro's number. We observed the lower values of Gmin in SDS-rich and DTAB-rich systems. The observed lower values of Gmin ascertain the thermodynamic stability [55]. Since the obtained Gmin values are lower in magnitude (table 3), it can be inferred that thermodynamically stable surfaces are formed with synergistic interaction [56].
As we have two systems (DTAB-rich and SDS-rich) and their interaction is discussed at three different temperatures above, different parameters from surface tension are studied. Here we want to take one representative system as DTAB-rich and compare with DTAB at 303.15 K by some parameters. Here, 21.16 is the γcmc for DTAB-rich at 303.15 K (table 3), and 39 was the γcmc of DTAB at 303.15 K [57]. The Γmax for DTAB-rich at 303.15 K is 2.70 (table 2), and 1.51 was the Γmax of DTAB at 303.15 K [57]. The for DTAB-rich at 303.15 K is 61.59 (table 2), and 111 was the of DTAB at 303.15 K [57]. The CMC for DTAB-rich at 303.15 K is 14.7 mM (table 2), and 15.3 was the CMC of DTAB at 303.15 K [57]. Thus we can say from the above comparison that the addition of DTAB into SDS leads to the strong electrostatic attraction between (+ve and −ve) charged head groups and the strengthening of the interaction between the SDS and DTAB molecules, thus leading to larger Γmax, smaller Amin and lower CMC and γcmc at air/solution interface [58].
The further detailed investigation regarding the interaction between DTAB and SDS is also carried out in the following section by conductivity study.
3.2. Specific conductance measurement and thermodynamic properties
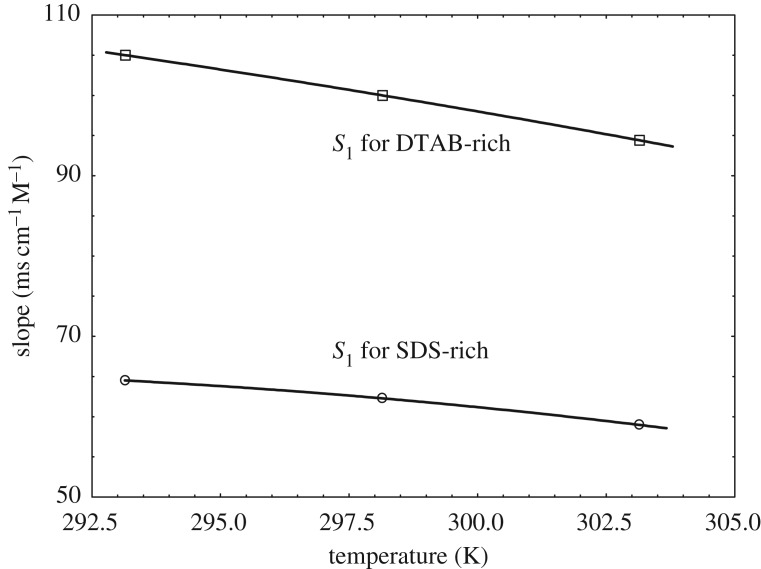
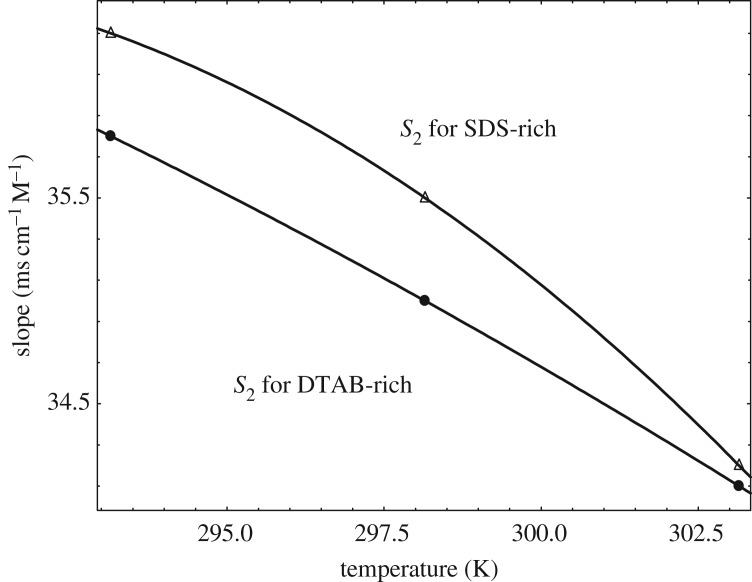
The specific conductance of the mixture of DTAB and SDS in the form of DTAB-rich and SDS-rich solutions in water for the calculation of the CMC at T = 293.15, 298.15 and 303.15 K are displayed in electronic supplementary material, figure S1. The specific conductance values of DTAB-rich and SDS-rich system increases with increment in temperature. The conductivity increases with increment in concentration with a certain slope. However, at a particular concentration, the slope changes for each plot. The break of two straight lines is indicated as the CMC. A degree of ionization (α) can be obtained from the ratio of post-micellar (S2) to the pre-micellar slope (S1). The variations in pre- and post-micellar slopes on the plots of conductance with a concentration of the solution of DTAB-rich and SDS-rich solutions in the mixed surfactants are given in table 4. With an increase of temperature, both slopes (pre-CMC and post-CMC) decrease (table 4 and figures 6 and 7) for DTAB-rich and SDS-rich systems. But pre-micellar slopes decrease monotonously showing almost linear variation for DTAB-rich and SDS-rich systems and the post-micellar slopes decrease sharply showing almost linear variation for DTAB-rich, and the nature of the curve seems convex for SDS-rich system.
Table 4.
Values of pre-micellar slope (S1), post-micellar slope (S2), degree of ionization (α), critical micelle concentration (CMC), Gibb's free energy of micellization (), standard enthalpy of micellization (), the standard entropy of micellization () of SDS-rich and DTAB-rich in an aqueous medium at T = 293.15, 298.15 and 303.15 K. The error limits of CMC, α, , and are within ±4, ±4, ±4, ±5 and ±5%, respectively. Standard uncertainty is u(T) = ±0.01 K.
| temperature (K) | S1 (mS cm−1 M−1) | S2 (mS cm−1 M−1) | α | CMC (mol l−1) | (kJ mol−1) | (kJ mol−1) | (J mol−1 K−1) |
|---|---|---|---|---|---|---|---|
| SDS-rich | |||||||
| 293.15 | 64.5 | 36.3 | 0.56 | 0.00592 | −32.096 | −9.876 | 75.7945 |
| 298.15 | 62.28 | 35.5 | 0.57 | 0.00620 | −32.25 | −10.040 | 74.4887 |
| 303.15 | 58.97 | 34.2 | 0.58 | 0.00650 | −32.38 | −10.459 | 72.3316 |
| DTAB-rich | |||||||
| 293.15 | 105.0 | 35.8 | 0.34 | 0.01349 | −33.67 | −10.425 | 79.2864 |
| 298.15 | 100 | 35.0 | 0.35 | 0.01400 | −33.88 | −10.73 | 77.6400 |
| 303.15 | 94.4 | 34.1 | 0.36 | 0.01470 | −34.03 | −11.053 | 75.7985 |
Figure 6.
Variation of slope versus temperature in pre-micellar slope regions.
Figure 7.
Variation of slope versus temperature in post-micellar slope regions.
The mixed surfactants have shown the largest pre-CMC slopes and smallest post-CMC slopes leading to the lowest degrees of dissociation (table 4). These slopes are so sensitive, which decides the degrees of dissociation, CMC and other thermodynamic parameters.
The CMC obtained for DTAB-rich and SDS-rich system from conductivity measurements in water at three different temperatures are given in table 4. It indicates that the CMC increases with increasing temperature. The effect of temperature on micelle formation could be explained by two reasons. The first reason is as the temperature increases, the degree of hydration of the hydrophilic group decreases, which could favour micelle formation; however, a rise in the temperature also induces disruption of the water structure surrounding the hydrophobic group, and this is unfavourable to micelle formation. It seems from the data of table 4 that the second effect is a main studied temperature range [59].
The CMC of SDS-rich diminished to a value of 6.2 mM (table 4) in contrast with the CMC of 8.38 mM of SDS [60] at 298.15 K, and CMC of SDS-rich is observed as 6.5 mM (table 4) at 303.15 K in contrast with the CMC of 8.5 mM of SDS [61] at 303.15 K, while the CMC of DTAB-rich diminished to a value of 14.00 mM (table 4) in contrast with the CMC of 14.50 mM of DTAB [36] at 298.15 K and the CMC of DTAB-rich is observed as 14.70 mM (table 4) at 303.15 K in contrast with the CMC of 15.1 mM of DTAB [57] at 303.15 K by conductivity methods. Herrington et al. [62] observed the decrease in CMC for cationic surfactant mixtures. Such a decline in CMC happens in the more substantial synergistic effects between two oppositely charged surfactants that are mixed homogeneously.
3.2.1. Synergistic effects
The synergistic effects can be observed with the help of models. The synergism in the mixed surfactants is possible when the CMC of a mixture is less than that of individual surfactants among the mixture. So, we have selected our SDS-rich system for the study of synergistic effects because, in DTAB-rich system, the values of mixed CMCs are found to be lower than the CMC values of pure DTAB and higher than the CMC values of pure SDS. Moreover, we have tested the values for (the micellar interaction parameter) of DTAB-rich and SDS-rich systems from the conductivity study with the famous equations given in the literature [38] as
| 3.8 |
and
| 3.9 |
For SDS-rich, CMC = CMC of mixed surfactant system for SDS-rich system, CMC1 = CMC of pure SDS for SDS-rich system and CMC2 = CMC of pure DTAB for SDS-rich system. The α and x are the mole fractions of the SDS in the total mixed solute and the mixed micelles, respectively.
Similarly, for DTAB-rich, CMC = CMC of mixed surfactant system for DTAB-rich system, CMC1 = CMC of pure DTAB for DTAB-rich system and CMC2 = CMC of pure SDS for DTAB-rich system. The α and x are the mole fractions of the DTAB in the total mixed solute and in the mixed micelles, respectively.
We found that was positive for DTAB-rich system as 0.5677 at 293.15 K, 0.8077 at 298.15 K and 0.8284 K at 303.15 K, by solving equation (3.8) iteratively to obtain the value of x and then putting the value of x into equation (3.9), whereas the negative values of were found for SDS-rich system (table 5). The evaluated positive and negative values of for DTAB-rich and SDS-rich systems were used in Rubingh's equations (3.10) and (3.11) to calculate the activity coefficients ( and ). DTAB-rich systems generated values greater than 1 for and , whereas SDS-rich systems produced values less than 1 for and .
| 3.10 |
and
| 3.11 |
As the values of as well as in aqueous as well as other media in the entire study, α are less than unity, showing the synergistic interactions as well as non-ideal behaviour of the mixed systems [63].
Table 5.
Values of βm, critical micelle concentration (CMC) from Rubingh model and dissociated Margules model, A12 and A21 of SDS-rich in aqueous medium at T = 293.15, 298.15 and 303.15 K.
| temperature (K) | βm | CMC from Rubingh model (mM) | CMC from Margules model (mM) | A12 | A21 | CMC of SDS CMC1 (mM) | CMC of DTAB CMC2 (mM) |
|---|---|---|---|---|---|---|---|
| 293.15 | −2.727 | 4.61 | 5.96 | −1.70 | −3.897 | 8.03a [60] | 15.38a [64] |
| 298.15 | −2.450 | 5.07 | 6.20 | −1.65 | −3.088 | 8.38a [60] | 14.50a [36] |
| 303.15 | −2.436 | 5.16 | 6.50 | −1.51 | −3.681 | 8.5a [61] | 15.1a [57] |
aConductivity methods.
So, DTAB-rich system explains the antagonistic interaction whereas SDS-rich system explains synergistic interaction. Therefore, we proceeded with further investigations on SDS-rich system.
The obtained values of and were less than 1, so the Clint condition of ideality was not recovered. So, we used our data to calculate the mixed CMC from the equation
| 3.12 |
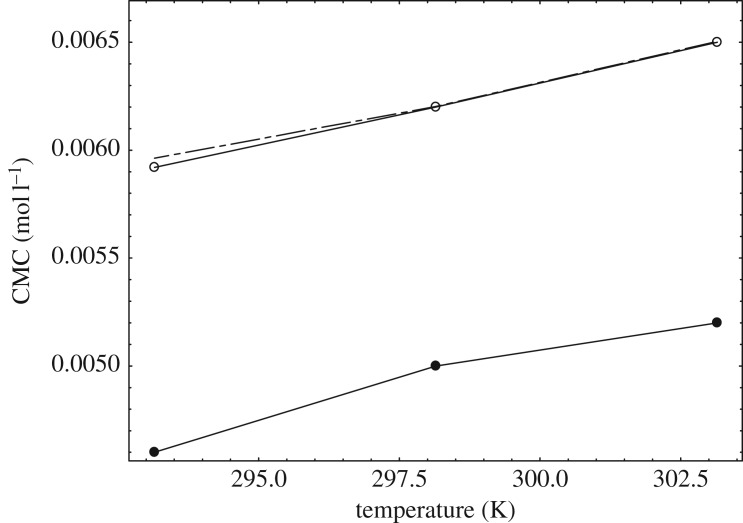
Thus obtained mixed CMC values were lower than the measured experimental CMC of our system (tables 4 and 5) even though were the negative values (table 5). So, we used the pseudo phase separation model coupled with the dissociated Margules model [21] and obtained the almost closer mixed CMC in comparison with the experimental mixed CMC (tables 4 and 5 and figure 8).
Figure 8.
Variation of CMC versus temperature: closed circles: calculated CMC values from Rubingh model; open circles: experimental CMC values from the conductivity study; dashed lines are the CMC values from the dissociated Margules model.
The interesting facts are that the Margules model used equations (3.13) and (3.14) if = = , then equations (3.13) and (3.14) recover to equations (3.10) and (3.11).
| 3.13 |
and
| 3.14 |
By using possible dissociation in SDS-rich system, then equations (3.13) and (3.14) can be changed into
| 3.15 |
and
| 3.16 |
The details about these two parameters (A12 and A21) as well as were described in the literature [21]. Then for the above SDS-rich systems, A12 and A21 were iteratively evaluated with the help of equations (3.13)–(3.16) and are given in table 5.
The value of (r1A12 + r2A21)/ (r1 + r2) is equivalent to βm when cationic and ionic surfactant mixed at equimolar composition and βm acts as a measure of the excess interaction between the two different surfactants in mixed micelles. Here, we suppose that surfactant SDS generates r1 particles, and surfactant DTAB generates r2 particles. It was found in the literature [21] that for the near-symmetric DTAB/SDS/H2O mixed system, the two surfactants DTAB and SDS had the same alkyl chain and similar surface activities, their interaction was useful for the complete dissociation of surfactants, both r1 and r2 were chosen as 2 and observed more negative values of and ; whereas, in our SDS-rich system, we have used r1 and r2 as 1 instead of 2, because r1 and r2 as 2 generated the positive values of and which is in contrast with synergistic effects.
By using r1 = r2 = 1 in our system, we get the value of and less negative in comparison with the literature [21]. That may be one of the reasons we observed different values of and , and other reason may be that we used asymmetrical amounts of SDS and DTAB. Hao et al. [21] used almost the symmetrical amount of SDS and DTAB, which interact highly by generating more negative values of and , whereas our SDS-rich system gives less negative values of and as SDS is more in excess in the mixture, which lowers the value of r1 and r2. Such types of behaviour were also discussed in the literature [65]. When the deviation is more, the degree of interaction between the mixed systems is higher. Hence the positive deviation as in our DTAB-rich system explains the antagonistic interaction, while the negative deviation as in our SDS-rich indicates the synergistic interaction. Therefore, there is still a need to have a huge research scope for the mixed micellization of opposite charged surfactants [66].
The free energies of micelle formation are calculated by a pseudo-phase separation model [22] and given in table 4.
| 3.17 |
where , R and T have the usual meanings.
The value of α for SDS-rich in water is noted to be 0.56 (table 4) at 293.15 K and closed with the literature [22]. When the temperature has increased, the value of α is increased as 0.57 (table 4) at 298.15 K, but α of SDS in water was noted as 0.45 [67] at 298.15 K.
In the same way, the α value for DTAB-rich in water is noted as 0.34 (table 4) at 293.15 K and similar to the previously reported study [22]. But α of DTAB-rich in water is observed as 0.35 (table 4) at 298.15 K whereas α of DTAB in water as 0.21 was noted in the literature [36] at 298.15 K, and α of DTAB-rich is observed as 0.36 (table 4) at 303.15 K in contrast with the α of 0.29 of DTAB [57] at 303.15 K.
The increase in α with temperature is because of the decreasing charge density on the micellar surface. A more significant fraction of the counterions is dissociated and increasing the temperature reduces the aggregation number of the ionic surfactants [68].
The data of for SDS-rich in water is found as −32.096 kJ mol−1 (table 4) at 293.15 K, which is similar to the earlier studied work [22], and an increase of temperature shows the free energy formation is more negative as −32.25 kJ mol−1 (table 4) at 298.15 K in contrast with the value for SDS in water as −34.04 kJ mol−1 [67] at T = 298.15 K, and of SDS-rich is observed as −32.38 kJ mol−1 (table 4) at 303.15 K in contrast with the of −36.2 kJ mol−1 of SDS [61] at 303.15 K.
In the case of DTAB-rich in water, is −33.67 kJ mol−1 (table 4) at 293.15 K and a similar result was noted in the earlier study [22], and an increase of temperature shows the free energy formation is more negative as −33.88 kJ mol−1 (table 4) at 298.15 K in contrast with the value for DTAB in water as −35.25 kJ mol−1 [69] at 298.15 K, and of DTAB-rich is observed as −34.03 kJ mol−1 at 303.15 K (table 4) in contrast with the of −35.73 kJ mol−1 of DTAB [69] at 303.15 K.
The is negative with all systems and becomes more negative as the temperature increases (table 4). The higher negative with increasing temperature indicates that the micellization process is spontaneous and becomes more spontaneous with an increase in temperature. Our results are also supported by the literature [70]. The decreasing value of is attributed to the tendency to drive equilibrium towards hydrophobic bonding as temperature increased. Furthermore, the free energy of micelle formation is more negative in DTAB-rich systems in contrast to the SDS-rich systems at investigated temperatures whereas the free energy of micelle formation is less negative in DTAB-rich and SDS-rich systems in comparison to pure DTAB and SDS at investigated temperatures. Less negative indicates co-solute does not facilitate the micellization.
Standard enthalpies of micelle formation, the value is calculated by the Gibbs–Helmholtz equation as
| 3.18 |
by fitting the graph of against temperature, and then the term is calculated. can be evaluated with the help of and by the following equation (3.19):
| 3.19 |
Our data of for SDS-rich in water is obtained as −9.876 kJ mol−1 (table 4) at 293.15 K and increase of temperature shows is more negative as −10.04 kJ mol−1 (table 4) at 298.15 K while the value for SDS in water as −14.49 kJ mol−1 was noted in the literature [67] at T = 298.15 K. In the case of DTAB-rich in water, is −10.425 kJ mol−1 (table 4) at 293.15 K and increase of temperature shows is more negative as −10.73 kJ mol−1 (table 4) at 298.15 K whereas the value of for DTAB in water was −9.08 kJ mol−1 [69] at 298.15 K, and of DTAB-rich is observed as −11.053 kJ mol−1 (table 4) at 303.15 K in contrast with the of −9.38 kJ mol−1 of DTAB [69] at 303.15 K.
Table 4 shows that the micellization is exothermic at T = 293.15, 298.15 and 303.15 K for the DTAB-rich and SDS-rich system. Hence, is negative with all systems and becomes more negative as the temperature increases (table 4). It depicts the decrease in energy required for breaking the iceberg structure surrounding the alkyl chains of DTAB-rich and SDS-rich. Also, is more negative in DTAB-rich systems in comparison with pure DTAB, whereas in SDS-rich systems at 298.15 K, is less negative in comparison with pure SDS. Less negative value of may be due to an increase of hydrophobic interaction.
In our study of DTAB-rich and SDS-rich system, DTAB-rich are highly exothermic, primarily because of tail association [71]. Negative enthalpy values infer the importance of London dispersion interactions (LDI) as an attractive force for micellization for DTAB-rich and SDS-rich system [72]. The negative values of enthalpies of micellization for DTAB/SDS mixtures at 303.15 K found from microcalorimetry [73] also support our findings of enthalpies of micellization.
Our calculated data of for SDS-rich in water is found as 75.7945 J mol−1 K−1 (table 4) at 293.15 K and decreases with increasing the temperature as 74.4887 J mol−1 K−1 (table 4) at 298.15 K, whereas the value of for SDS in water as 65.67 J mol−1 K−1 was mentioned [67] at 298.15 K. With DTAB-rich in water, is 79.2864 J mol−1 K−1 (table 4) at 293.15 K, and increase of temperature shows decreases as 77.6400 J mol−1 K−1 (table 4) at 298.15 K, while the value for DTAB in water as 87.8 J mol−1 K−1 [69] at 298.15 K and of DTAB-rich is observed as 75.7985 J mol−1 K−1 (table 4) at 303.15 K, in contrast with the of 87 J mol−1 K−1 of DTAB [69] at 303.15 K. Moreover, the values of in DTAB-rich solutions were observed to be high, in contrast to the SDS-rich solutions at investigated temperatures.
On increasing the temperature, the value decreases for DTAB-rich and SDS-rich system. It may be because of the disruption of the iceberg water structure around the alkyl group with increasing the kinetic energy of the system.
In our study, we observed the positive value of with DTAB-rich and SDS-rich systems. It infers that a liquid–phase aggregate could be formed, whereas a negative value of may indicate the formation of the solid–phase aggregate [71].
Therefore, the negative values of and and positive values of are indicative for DTAB and SDS interactions. Such behaviour is also noted in the earlier study [74]. But in the literature [71], the negative values of entropy have been reported.
Electronic supplementary material, figure S2 shows the relationship of enthalpy–entropy compensation phenomenon for DTAB-rich and SDS-rich in the water at T = 293.15, 298.15 and 303.15 K. A linear relationship is obtained for and is expressed with the help of the following equation:
| 3.20 |
where 1/Tc is slope and σ are intercepts of a linear plot. Tc measures solvation part of micellization while determines the solute–solvent interaction. Tc values obtained in water for DTAB-rich and SDS-rich are 179.86 K and 172.71 K, respectively. , and of DTAB-rich and SDS-rich in water at T = 293.15, 298.15 and 303.15 K are displayed in table 4, whereas the values of Tc, σ and for DTAB-rich and SDS-rich solutions by using conductivity measurement are given in table 6.
Table 6.
Compensation parameters: Tc, σ and value of SDS-rich and DTAB-rich by using conductivity measurement.
| compensation parameters | SDS-rich | DTAB-rich |
|---|---|---|
| Tc(K) | 172.71 | 179.86 |
| σ | 132.8 | 137.2 |
| (J mol−1 K−1) | −58.2 | −62.8 |
The heat capacity of micellization which is obtained from the slope of against temperature curve (electronic supplementary material, figure S3) is noted as
| 3.21 |
The negative value of the heat capacity of micellization is observed for the self-association of amphiphiles.
3.3. UV–visible absorption spectroscopy
3.3.1. Optical analysis
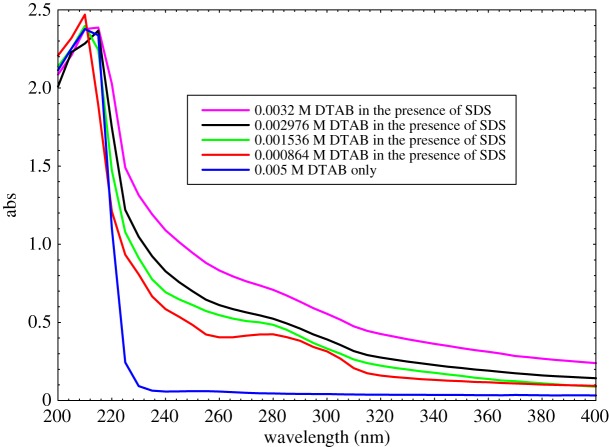
Systematic UV–Vis spectroscopic investigations of DTAB-rich and SDS-rich solutions were carried out to understand the behaviour of mixed surfactants association in water. The absorption maxima of an aqueous solution of DTAB-rich were found at 210 nm and 280 nm, respectively (figure 9).
Figure 9.
Absorption spectra of DTAB-rich surfactant.
With increasing the concentration of DTAB into aq-SDS initially, the absorbance intensity is increased significantly due to the hyperchromic shift as for 0.005 M DTAB only; the maximum absorbance of 2.377 at 210 nm is noted. When adding the constant amount of 0.01 M SDS in 0.000864 M DTAB, the absorbance increases up to 2.469 without red or blue shift, but only the hyperchromic shift is observed. When the amount of DTAB increases up to 0.001536 M in the constant concentration of 0.01 M SDS, i.e. the absorbance decreases as 2.398, so there is the observation of hypochromic shift. Further, adding more DTAB as 0.002976 M with 0.01 M SDS, there is the observation of hypochromic shift as well as red shift containing absorbance as 2.367 at 215 nm, and again on increasing the concentration of DTAB as 0.0032 M with 0.01 M SDS, there is the observation of hyperchromic shift containing absorbance as 2.387 at 215 nm, while at 280 nm the hyperchromic shift is observed with increasing DTAB concentration due to the weakening of binding forces, van der Waals forces and electrostatic interaction. The results depicted that the hydrophobic interactions among surfactant tails also give rise to the higher adsorption of surfactant molecules. Such behaviour was also observed for cationic-rich and anionic-rich mixtures of CTAB and SDS in the literature [75].
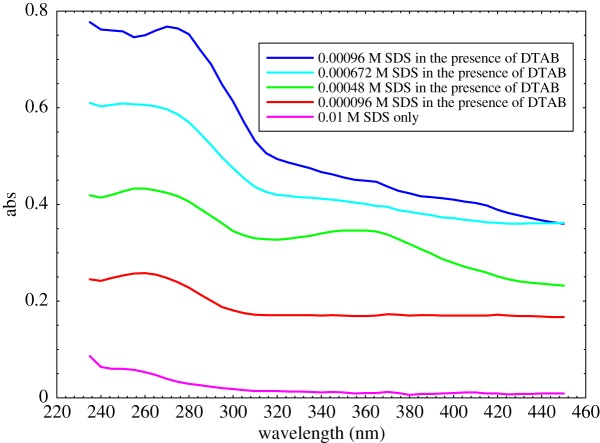
The absorption maxima of an aqueous solution of SDS-rich were found at 270 nm and 360 nm, respectively (figure 10).
Figure 10.
Absorption spectra of SDS-rich surfactant.
With increasing the concentration of SDS into aq-DTAB initially, the absorbance intensity is increased significantly due to the hyperchromic shift as for 0.01 M SDS only; the maximum absorbance of 0.039 at 270 nm is noted. When adding the constant amount of 0.005 M DTAB into 0.000096 M SDS, the absorbance increases up to 0.248 without red or blue shift but only hyperchromic shift is observed. When the amount of SDS increases up to 0.00048 M in the constant amount of 0.005 M DTAB, i.e. the absorbance also increases as 0.424, the observation is a hyperchromic shift. On further adding more SDS as 0.000672 M to 0.00096 M with 0.005 M DTAB, there is the observation of hyperchromic shift for both cases as 0.597 and 0.768 absorbances. In the same manner, for 360 nm, there is also absorbance of 0.01 for 0.01 M SDS only. When the constant DTAB is added as 0.005 M in 0.000096 M SDS, there is the progressive evolution of the absorbance bands as 0.169 at 360 nm. In the case of 0.00048 M, 0.000672 M and 0.00096 M SDS, the constant amount of 0.005 M DTAB interacts with SDS solutions to give the absorbance of 0.346, 0.401 and 0.449, respectively. Hence, two visible peaks at 270 and 360 nm of SDS-rich surfactant mixture give only the hyperchromic shift, but not visible blue or red shift is noted at the investigated concentrations of SDS solution in the presence of DTAB. Thus, our results show that the hydrophobic interactions among surfactant tails give rise to the higher adsorption of surfactants molecules. Liu et al. have also been observed such type of behaviour of variable concentration of SDS in the aqueous medium [76]. Our findings of SDS-rich surfactant mixtures are also supported from the literature [24].
3.3.2. Interaction between dyes and mixed surfactants
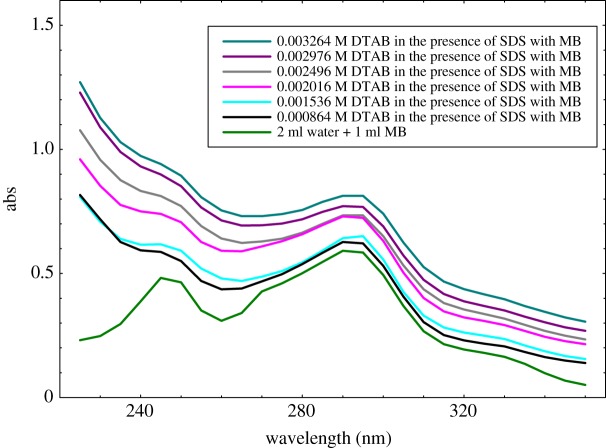
Figure 11 shows that the absorbance intensity of the MB in aqueous solution affected with increasing the DTAB concentration. Thus, the MB and DTAB have positive charges while with SDS is opposite so they could be induced to have a weak interaction with the hyperchromic shift. With increasing the concentration of surfactants, the maximum MB molecules could be accommodated into normal micelles as monomeric molecules, and absorbance intensity sharply increases with the hyperchromic shift [77].
Figure 11.
Absorption spectra of DTAB-rich surfactant in the presence of MB.
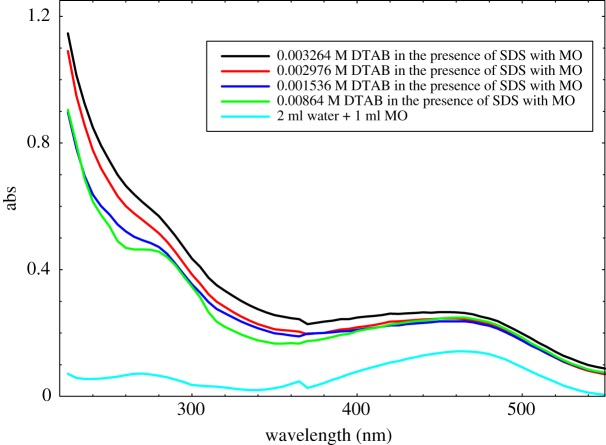
Figure 12 shows that the absorption peaks are obtained from MO in the aqueous medium. Such characteristic of the MO could be used for studying the DTAB-rich surfactants aggregates in the aqueous medium. The influences of different concentration of DTAB on the absorption spectrum of MO were studied by using UV–Vis spectroscopy. On increasing the concentration of DTAB, the absorbance intensity increases monotonously with the hyperchromic shift, which could induce strong interaction between MO and DTAB-rich solution as compared to MB with DTAB-rich solution. Our patterns of spectra are also supported by the reported study [78]. In the case of DTAB-rich with MB and MO solution showing more hydrophobic micellar environment, the maximum absorbance of dyes with surfactants is observed. In the case of SDS-rich interaction with MB and MO solution, there was cloudy in the preparation of the solutions. Two intense absorption bands were registered between 275 and 465 nm for MO, and between 245 and 295 nm for MB, which is in good agreement with the literature data [79,80], as shown in figures 11 and 12.
Figure 12.
Absorption spectra of DTAB-rich surfactant in the presence of MO.
Moreover, there is a progressive evolution of these bands with an increase of DTAB-rich concentration. The interaction of MO and MB with DTAB-rich has non-visibly shifted (figures 11 and 12). By assuming the ideal behaviour of dye in both phases, the distribution constant of dye following Nernstian distribution law can be written as
| 3.22 |
Here, K is distribution constant, whereas and are the concentrations of dye in micellar and aqueous phases. In the analysis of spectra of UV–Vis, parameter A was calculated. Following Magid et al. [81], the ratio of dye absorbance's band intensities () was described as a function of cationic rich surfactant concentration and A value is a sum of two parameters,
| 3.23 |
where is the dye mole fraction, is the value of A corresponding to the situation when dye completely dissolves in micellar phases, whereas related to aqueous phases. In our case, dyes dissolve in pure water so the distribution constant can be presented as
| 3.24 |
where is the moles of dye in aqueous phase whereas is with micellar phases, the [DTAB-SDS] is the molarity of DTAB in the presence of SDS, and the is molecular weight of DTAB in the presence of SDS. Following the procedure developed in the literature [81] on analysis of the UV–Vis spectra, the binding constant of dye to reversed micelle is given as
| 3.25 |
There is a connection between K and as .
According to Poisson distribution [59], equation (3.25) can be written as
| 3.26 |
Combining equations (3.23) and (3.26), we get
| 3.27 |
Here and were fitted parameters, values were found in a separate experiment. Obtained results are presented in electronic supplementary material, figures S4 and S5. Fitted parameters and constant distribution values are summarized in table 7. Table 7 indicates that the stronger interactions between MO with DTAB-rich micelles appeared in comparison among MB with DTAB-rich micelles.
Table 7.
The fitting parameters (Am and K′) obtained in the nonlinear regression procedure (NLREG) of the UV–Vis data for dyes partitioning between water and (DTAB-SDS) micelles measured at room temperature and K (distribution constant) calculated from relation: ().
| S.N. | Ama | K′ (binding constant) [l mol−1] | K (distrib. constant) |
|---|---|---|---|
| methyl orange (MO) | |||
| 1. | 0.4290 | 21200 | 68753.48 |
| methylene blue (MB) | |||
| 2. | 0.0116 | 126 | 408.6300 |
aAbsorbance of dyes dissolved in micellar phase.
3.4. Zeta potential, polydispersity index and hydrodynamic radius measurement for stability analysis
The is a potential that exists among the particle surface and dispersing liquid which changes according to the distance from the particle surface. The greater the positive/negative charge of the , the more stable the particles are (due to electrical repulsion). Nevertheless, the higher value describes the higher dispersed condition of the particle in an aqueous media. For an adsorbent, a large available surface area is desirable, which is possible if it has been in dispersed condition (higher value). The and hydrodynamic radius () values of DTAB-rich and SDS-rich surfactants with and without MO and MB with an aqueous medium have been determined. The , and PDI values (table 8) reflect the dispersion and stability of the solution. The higher value indicates the higher repulsive strength of molecules [82]. Our study found the higher positive value (27.02 mV) with MB + water system, whereas the lower value (0.53 mV) with 0.005 M DTAB+MB system; similarly, a higher negative values −15.13 with 0.012 M SDS + 0.005 M DTAB, while the lower value −0.54 with MO + water system.
Table 8.
Zeta potential (ξ), hydrodynamic radius (Rh) and PDI value of DTAB-rich and SDS-rich in the presence and absence of MB and MO at 298.15 K.
| systems | Rh (nm) | PDI | ξ (mV) |
|---|---|---|---|
| SDS-rich | |||
| 0.01 M SDS | 3640 | 1.201 | 0.57 |
| 0.012 M SDS + 0.005 M DTAB + MB | 3720 | 1.170 | −11.10 |
| 0.01 M SDS + MB | 5230 | 0.1152 | 1.75 |
| MO + water | 5160 | 0.2680 | −0.54 |
| 0.01 M SDS + MO | 4650 | 1.784 | 0.56 |
| 0.012 M SDS + 0.005 M DTAB | 3270 | 1.708 | −15.13 |
| 0.012 MSDS + 0.005 M DTAB + MO | 3630 | 0.706 | −13.75 |
| DTAB-rich | |||
| 0.005 M DTAB | 2355 | 1.589 | 0.55 |
| 0.00504 M DTAB + 0.01 M SDS + MB | 3530 | 1.0310 | 12.59 |
| 0.005 M DTAB + MB | 4660 | 0.392 | 0.53 |
| MB + water | 4780 | 1.846 | 27.02 |
| 0.005 M DTAB + MO | 5350 | 0.2394 | 0.55 |
| 0.00504 M DTAB + 0.01 M SDS | 5990 | 2.285 | 14.18 |
| 0.00504 M DTAB + 0.01 M SDS + MO | 6000 | 2.481 | −9.15 |
The PDI is a dimensionless parameter. If the PDI values are less than 0.05, it means that the solution has a high monodispersity, while for greater than 0.7, it indicates that the solution has a polydispersive nature [83]. The interaction between MB and SDS indicates that MB is encountering a microenvironment in the SDS micelles. Probably, the SDS-MB form stable solution which could be induced by both coulombic and hydrophobic interactions [84], and the interaction of MB [85] with SDS could proceed by the mechanism opposite to that of micelle formation. In our study, MB and SDS concentrations being unchanged, the initially clear, homogenous solution becomes opalescent. Similar changes (appearance of opalescence) were also observed in ageing of initially homogeneous SDS-MB solutions, suggesting that the system is thermodynamically and kinetically stable. So, SDS-MB is strongly monodispersive with highly dispersive solutions. In the case of DTAB-rich samples as 0.005 M DTAB + MB, 0.005 M DTAB + MO are also highly monodispersive with strongly stable and highly dispersive solutions. Similarly, the interaction mechanism could be developed in the DTAB-MO system; DTAB and MO depict that the stronger electrostatic interactions for positive part of quaternary ammonia of DTAB and negative part of a sulfonate group of the MO with hydrophobic interactions could be induced in the electrostatic and ion-phobic/philic interactions with DTAB-MO system. The maximum PDI value is 2.481 for 0.00504 M DTAB + 0.01 M SDS + MO and the minimum PDI value is 0.2394 for 0.005 M DTAB + MO.
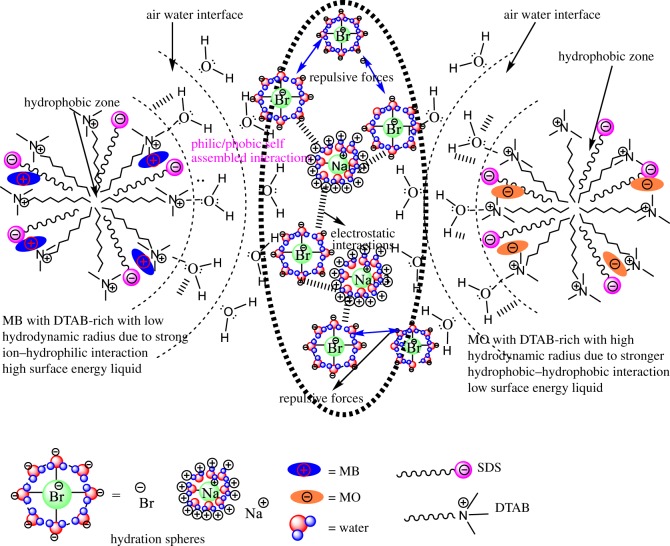
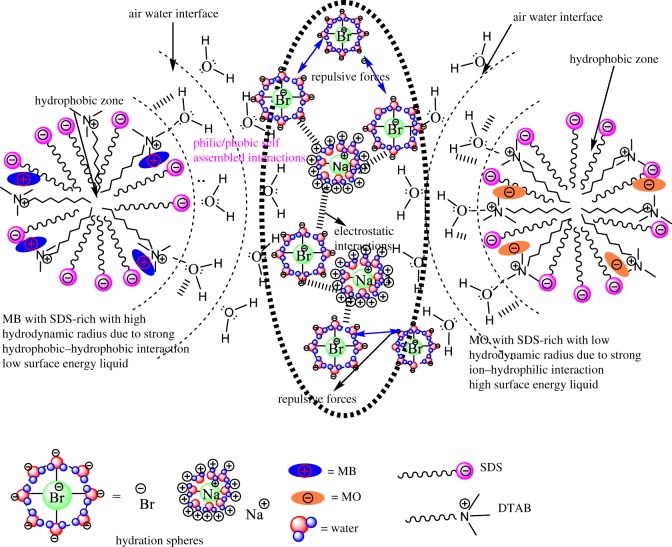
The surfactants and dyes are developed in an individual hydration sphere in the solution. Due to the stronger electrostatic, ion-dipole and intermolecular interaction, this could be started as the formation of stable dye-surfactant solution due to such interaction; the dyes are arranged like H-type aggregation [86]. It depicted that the dye-surfactant is a monomer with the electrostatic interaction among positive part of the quaternary nitrogen of DTAB and negative part of sulphonate group, and the alkyl chain length (ACL) of DTAB strongly interacts with azo-group (chromophoric unit) of the rest of the molecules of MO dye [87]. Moreover, lots of factors such as mobility and dispersivity play an essential role in the dye–surfactant interaction. The H-type aggregation of MO with DTAB molecules in the liquid mixture and also different types of aggregates could be dependent on the ACL. The methylene groups (–CH2–) in the ACL could affect the interacting and packing parameters of dye-surfactant in the aqueous medium. The hydrophobic nature of ACL also has an important impact on the DTAB aggregation. Thus, the ion–hydrophobic, electrostatic and ion–dipole interactions (IDI) in between dye and surfactants micelles play a significant part in the penetration of dye into micelles and the solubilization and distribution of the dye molecules between aqueous and micellar phases. Table 8 shows that the SDS-rich system 0.012 M SDS + 0.005 M DTAB has (3270 nm) the lowest hydrodynamic radius due to the stronger electrostatic interaction and intermolecular forces, while the 0.005 M DTAB system shows a stronger interaction with solvent molecules. The DTAB-rich system 0.00504 M DTAB + 0.01 M SDS + MO has (6000 nm) the highest hydrodynamic radius. It depicts that due to the ion–hydrophobic interaction dominant over IHI.
Figure 13 shows that an addition of MB into DTAB-rich mixed surfactant shows weak interaction because DTAB and MB have same charges, due to the dominant ion-hydrophilic interaction (IHI) over the ion-hydrophobic interaction (IHbI) with decreasing value. Similarly, with MO into DTAB-rich, the value is increased with strong hydrophobic-hydrophobic interaction (HbHbI).
Figure 13.
Molecular structural interactions of MO and MB with DTAB-rich mixed surfactants.
MB with SDS-rich mixed surfactant (figure 14) shows strong HbHbI because SDS and MB have phobic/philic nature, it could be induced by weak electrostatic interaction and increased the value with high surface energy liquids, while with MO into SDS-rich (figure 14), the value is decreased because of strong electrostatic interaction and multiple intermolecular interactions. On addition of SDS and DTAB into aq-DTAB and aq-SDS solution, the increased size of mixed surfactant is apparently increased as the size of aggregates increased (table 8) and also, by a DLS experiment wherein the value of the DTAB-rich and SDS-rich were observed to increase in the presence of MO and MB dyes (table 8). This is in contrast to the stability of the in the absence and presence of dyes with a mixed surfactant system. In our study, we observed an inclusion of MO and MB into SDS-rich and DTAB-rich mixed surfactant; the is increased as well as aggregation increases with the higher stability of the solution. The systems containing ionic dyes and surfactants charged opposite to the dye electrostatic interactions develop. As a result of the attraction forces, ionic pairs dye-surfactant (MB and MO with DTAB-rich and SDS-rich) are formed in a stable solution [88]. Hydrophobic interactions, electrostatic interactions, hydrogen bonds, p-stacking and Van der Waals forces are typical examples of the intermolecular forces that dominate the interactions of dye molecules with surfactant aggregates [89].
Figure 14.
Molecular structural interactions of MO and MB with SDS-rich mixed surfactants.
3.5. Krafft point measurements
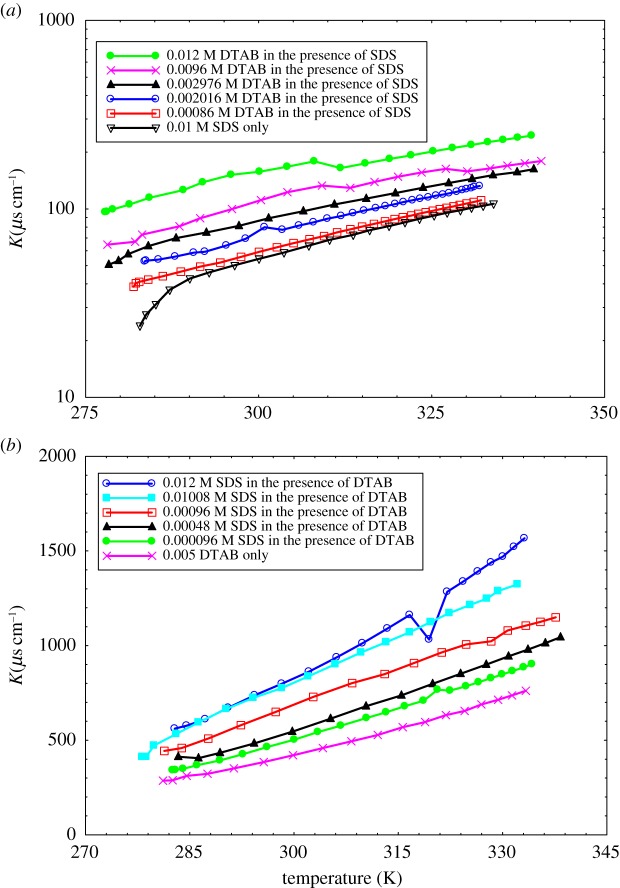
The Krafft point is generally the interaction between the solubility and CMC of the surfactant [18]. With increasing temperature, the solubility is increased. The solubility is adequate to the CMC at a particular temperature, and hence the micelles can form [90]. The solubility and CMC curves intersect at the specific temperature called the Krafft temperature (TK). Figure 15 of SDS-rich and DTAB-rich were measured by the use of data in the aqueous medium [88].
Figure 15.
Conductivity () versus T/K for Krafft temperature (TK) of (a) DTAB-rich and (b) SDS-rich surfactants.
The degree of counterion dissociation of ionic micelles is calculated from TK measurements. TK of DTAB and SDS are the roles of the counterions concentration in water. When the aqueous solution of ionic surfactant goes above the saturation concentration, a hydrated solid surfactant stage is divided [89]. The solubility is determined at temperatures below the Krafft point. The micelles begin to form at the Krafft point. The Krafft point can be determined as the temperature at which the solubility versus temperature curve intersects. Zhang et al. [91] have reported Krafft point and the solubility of SDS only on the function of temperature. By the use of the third-order polynomial equation, the relationship between solubility and temperature of surfactants has been determined. Gayet et al. [92] have studied the temperature effect on CMC value for SDS. An addition of MB and MO into SDS-rich and DTAB-rich mixed surfactant could induce electrostatic interactions; multiple intermolecular interactions (IMMI) form the stable thermodynamic solution. Although for cationic-anionic combinations a high probability of precipitation through change neutralization at comparable ratio is present, when one component is increased, the stably mixed micelles are usually formed [93]. However, in this study, we have chosen 3 : 1 critical ratio of surfactants; at this ratio surfactants do not form precipitation with and without dyes. Figure 15 illustrates that with increasing DTAB and SDS concentration, the TK of DTAB-rich and SDS-rich was first increased rapidly and then drastically decreases. It is due to the electrostatic repulsion forms the local concentration of DTAB-rich and SDS-rich increase in the presence of SDS/DTAB in an aqueous medium. Therefore, DTAB-rich and SDS-rich mixed surfactants have no significant effect on the solubility of SDS and DTAB in liquid water at temperatures between 313.15 and 323.15 K, as shown in figure 15. Also, there is no remarkable rise in the solubility before temperature move towards the minimum temperature of the normal Krafft point 313.15 and 323.15 K. This also indicates that the Krafft point for DTAB-rich and SDS-rich mixed surfactants show different interaction activities, this condition does not shift to a temperature below 313.15 and 323.15 K.
4. Conclusion
The conductance and surface tension of SDS-rich and DTAB-rich mixtures in an aqueous medium at T = 293.15, 298.15 and 303.15 K were used as a function of surfactant concentration. On increasing the concentration of surfactant and temperature, the conductance values are increased and CMC and α also increased. The CMC obtained by conductance and surface tension are close to each other. Also, and are found more negative with increment in temperature, while is found decreased with increase in temperature. The Krafft point is determined as the temperature where the solubility against temperature plot intersects with the specific conductance versus temperature graph. The surface tension is decreased at first with increment in the concentration of surfactant mixtures in water. DTAB-rich systems show the antagonistic interaction, whereas SDS-rich systems explore synergistic interaction. Hence the synergism in mixed micelle formation is present when mixed surfactants have a lower CMC than the individual surfactants. When the CMC is increased, then the value of decreases and followed the opposite trend. Similarly, when the CMC is increased, increases while P and decreases. The and PDI values are reflected in the dispersion and stability of the solution. An addition of dyes into SDS and DTAB-rich system increases the monodispersibility, which is confirmed by PDI measurement. The micellar size distribution of DTAB and SDS-rich surfactant analysed by DLS has confirmed their effective micellization for the stability of the solution with and without dyes. The binding and distribution constant of MO and MB between the aqueous phase and DTAB-rich micellar phase have been calculated efficiently.
Supplementary Material
Acknowledgements
We thank the editor and anonymous reviewers for their valuable comments and suggestions.
Data accessibility
The graphical data of specific conductivities and UV–Vis that supporting this paper have been uploaded as electronic supplementary material.
Authors' contributions
K.M.S. and S.A.K. conducted the experiments and data analysis, M.S. guided the writing process and A.B. wrote the paper. All the authors gave their final approval for publication.
Competing interests
The authors declare no competing interest.
Funding
This study was supported by The World Academy of Sciences, Italy under the Award of 2016 TWAS Fellowship for Research and Advanced Training FR number: 3240288440 to Dr Ajaya Bhattarai.
References
- 1.Fan Y, Liu Y, Xi J, Guo R. 2011. Vesicle formation with amphiphilic chitosan derivatives and a conventional cationic surfactant in mixed systems. J. Colloid Interface Sci. 360, 148–153. ( 10.1016/j.jcis.2011.04.009) [DOI] [PubMed] [Google Scholar]
- 2.Rub MA, Azum N, Asiri AM. 2017. Binary mixtures of sodium salt of ibuprofen and selected bile salts: interface, micellar, thermodynamic, and spectroscopic study. J. Chem. Eng. Data 62, 3216–3228. ( 10.1021/acs.jced.7b00298) [DOI] [Google Scholar]
- 3.Cui Z-G, Canselier JP. 2001. Interfacial and aggregation properties of some anionic/cationic surfactant binary systems II. Mixed micelle formation and surface tension reduction effectiveness. Colloid Polym. Sci. 279, 259–267. ( 10.1007/s003960000420) [DOI] [Google Scholar]
- 4.Kume G, Gallotti M, Nunes G. 2007. Review on anionic/cationic surfactant mixtures. J. Surfactants Deterg. 11, 1–11. ( 10.1007/s11743-007-1047-1) [DOI] [Google Scholar]
- 5.Šegota S, Težak D. 2006. Spontaneous formation of vesicles. Adv. Colloid Interface Sci. 121, 51–75. ( 10.1016/j.cis.2006.01.002) [DOI] [PubMed] [Google Scholar]
- 6.Rosen MJ, Kunjappu JT. 2012. Surfactants and interfacial phenomenon, 4th edn New York NY: Wiley. [Google Scholar]
- 7.Sohrabi B, Gharibi H, Tajik B, Javadian S, Hashemianzadeh M.. 2008. Molecular interactions of cationic and anionic surfactants in mixed monolayers and aggregates. J. Phys. Chem. B 112, 14 869–14 876. ( 10.1021/jp803105n) [DOI] [PubMed] [Google Scholar]
- 8.Shiloach A, Blankschtein D. 1998. Predicting micellar solution properties of binary surfactant mixtures. Langmuir 14, 1618–1636. ( 10.1021/la971151r) [DOI] [Google Scholar]
- 9.Tikariha D, Ghosh KK, Barbero N, Quagliotto P, Ghosh S.. 2011. Micellization properties of mixed cationic gemini and cationic monomeric surfactants in aqueous-ethylene glycol mixture. Colloids Surf. A 381, 61–69. ( 10.1016/j.colsurfa.2011.03.027) [DOI] [Google Scholar]
- 10.Javadian S, Gharibi H, Fallah HT. 2010. Adsorption and micellar properties of binary ionic/nonionic surfactant mixtures in ethylene glycol+water. J. Chem. Eng. Data 55, 1122–1130. ( 10.1021/je900564p.) [DOI] [Google Scholar]
- 11.Caria A, Khan A. 1996. Phase behavior of catanionic surfactant mixtures:sodium bis(2-ethylhexyl)sulfosuccinate− didodecyldimethylammonium bromide−water system. Langmuir 12, 6282–6290. ( 10.1021/la960581z) [DOI] [Google Scholar]
- 12.Silva BFB, Marques EF, Olsson U. 2011. Aqueous phase behavior of salt-free catanionic surfactants: the influence of solubility mismatch on spontaneous curvature and balance of forces. Soft Matter 7, 225–236. ( 10.1039/c0sm00477d) [DOI] [Google Scholar]
- 13.Zana R, Lévy H, Danino D, Talmon Y, Kwetkat K.. 1997. Mixed micellization of cetyltrimethylammonium bromide and an anionic dimeric (gemini) surfactant in aqueous solution. Langmuir 13, 402–408. ( 10.1021/la9606963) [DOI] [Google Scholar]
- 14.Sohrabi B, Gharibi H, Javadian S, Hashemianzadeh M.. 2007. A new model to study the phase transition from microstructures to nanostructures in ionic/ionic surfactants mixture. J. Phys. Chem. B 111, 10 069–10 078. ( 10.1021/jp073284j) [DOI] [PubMed] [Google Scholar]
- 15.Yousefi A, Javadian S, Gharibi H, Kakemam J, Rashidi-Alavijeh M. 2011. Cosolvent effects on the spontaneous formation of nanorod vesicles in catanionic mixtures in the rich cationic region. J. Phys. Chem. B 115, 8112–8121. ( 10.1021/jp202199d) [DOI] [PubMed] [Google Scholar]
- 16.Bhattarai A. 2015. Studies of the micellization of cationic–anionic surfactant systems in water and methanol–water mixed solvents. J. Solution Chem. 44, 2090–2105. ( 10.1007/s10953-015-0391-4) [DOI] [Google Scholar]
- 17.Aslanzadeh S, Yousefi A. 2013. The effect of ethanol on nanostructures of mixed cationic and anionic surfactants. J. Surfactants Deterg. 17, 709–716. ( 10.1007/s11743-013-1548-z) [DOI] [Google Scholar]
- 18.Sohrabi B, Eivazzadeh S, Sharifi A, Azadbakht R. 2015. Self-assembled catanionic surfactant mixtures in aqueous/ionic liquid systems. J. Mol. Liq. 211, 754–760. ( 10.1016/j.molliq.2015.07.025) [DOI] [Google Scholar]
- 19.Xu W, Zhang Q, Wei H, Qin J, Yu L.. 2015. Self-aggregation of catanionic surface active ionic liquids in aqueous solutions. J. Surfactants Deterg. 18, 421–428. ( 10.1007/s11743-014-1666-2) [DOI] [Google Scholar]
- 20.Wang C, Cao XL, Guo L-L, Xu Z-C, Zhang L, Gong Q-T, Zhang L, Zhao L.. 2016. Effect of molecular structure of catanionic surfactant mixtures on their interfacial properties. Colloids Surf. A 509, 601–612. ( 10.1016/j.colsurfa.2016.09.069) [DOI] [Google Scholar]
- 21.Hao L-S, Deng Y-T, Zhou L-S, Ye H, Nan Y-Q, Hu P.. 2012. Mixed micellization and the dissociated margules model for cationic/anionic surfactant systems. J. Phys. Chem. B 116, 5213–5225. ( 10.1021/jp300568k) [DOI] [PubMed] [Google Scholar]
- 22.Bhattarai A, Pathak K, Dev B. 2017. Cationic and anionic surfactants interaction in water and methanol–water mixed solvent media. J. Mol. Liq. 229, 153–160. ( 10.1016/j.molliq.2016.12.021) [DOI] [Google Scholar]
- 23.Sachin KM, Karpe S, Singh M, Bhattarai A.. 2018. Physicochemical properties of dodecyltrimethylammonium bromide (DTAB) and sodiumdodecyl sulphate (SDS) rich surfactants in aqueous medium, at T = 293.15, 298.15, and 303.15 K. Macromol. Symp. 379, 1700034 ( 10.1002/masy.201700034) [DOI] [Google Scholar]
- 24.Mehta SK, Chaudhary S, Bhasin KK. 2008. Self-assembly of cetylpyridinium chloride in water–DMF binary mixtures: a spectroscopic and physicochemical approach. J. Colloid Interface Sci. 321, 426–433. ( 10.1016/j.jcis.2008.02.043) [DOI] [PubMed] [Google Scholar]
- 25.Ghosh S, Mondal S, Das S, Biswas R. 2012. Spectroscopic investigation of interaction between crystal violet and various surfactants (cationic, anionic, nonionic and gemini) in aqueous solution. Fluid Phase Equilib. 332, 1–6. ( 10.1016/j.fluid.2012.06.019) [DOI] [Google Scholar]
- 26.Samiey B, Ashoori F. 2011. Kinetics of crystal violet fading in the presence of TX-100, DTAB and SDS. Acta Chim. Slov. 58, 223–232. [PubMed] [Google Scholar]
- 27.Dey S, Mandal U, Mojumdar SS, Mandal AK, Bhattacharyya K.. 2010. Diffusion of organic dyes in immobilized and free catanionic vesicles. J. Phys. Chem. B 114, 15 506–15 511. ( 10.1021/jp1068347) [DOI] [PubMed] [Google Scholar]
- 28.Purkait M, DasGupta S, De S. 2004. Removal of dye from wastewater using micellar-enhanced ultrafiltration and recovery of surfactant. Sep. Purif. Technol. 37, 81–92. ( 10.1016/j.seppur.2003.08.005) [DOI] [Google Scholar]
- 29.Ciocirlan O, Iulian O. 2008. Vapor pressure, density, viscosity and refractive index of dimethyl sulfoxide+1,4-dimethylbenzene system. J. Serb. Chem. Soc. 73, 73–85. ( 10.2298/jsc0801073c) [DOI] [Google Scholar]
- 30.Kinart CM, Kinart WJ, Bald A. 1999. The measurements of the surface tension of mixtures of dimethyl sulfoxide with methyl, ethyl and propyl alcohols. Phys. Chem. Liq. 37, 317–321. ( 10.1080/00319109908031436) [DOI] [Google Scholar]
- 31.Singh M. 2006. Survismeter — Type I and II for surface tension, viscosity measurements of liquids for academic, and research and development studies. J. Biochem. Biophys. Methods 67, 151–161. ( 10.1016/j.jbbm.2006.02.008) [DOI] [PubMed] [Google Scholar]
- 32.Lind JE, Zwolenik JJ, Fuoss RM.. 1959. Calibration of conductance cells at 25° with aqueous solutions of potassium chloride1. J. Am. Chem. Soc. 81, 1557–1559. ( 10.1021/ja01516a010) [DOI] [Google Scholar]
- 33.Tsujii K. 1998. Surface activity: principles, phenomena, and applications. San Diego, CA: Academic Press. [Google Scholar]
- 34.Mukherjee I, Moulik SP, Rakshit AK. 2013. Tensiometric determination of Gibbs surface excess and micelle point: a critical revisit. J. Colloid Interface Sci. 394, 329–336. ( 10.1016/j.jcis.2012.12.004) [DOI] [PubMed] [Google Scholar]
- 35.Niraula TP, Shah SK, Chatterjee SK, Bhattarai A.. 2018. Effect of methanol on the surface tension and viscosity of sodiumdodecyl sulfate (SDS) in aqueous medium at 298.15–323.15 K. Karbala Int. J. Mod. Sci. 4, 26–34. ( 10.1016/j.kijoms.2017.10.004) [DOI] [Google Scholar]
- 36.Shah SK, Chatterjee SK, Bhattarai A. 2015. The effect of methanol on the micellar properties of dodecyltrimethylammonium bromide (DTAB) in aqueous medium at different temperatures. J. Surfactants Deterg. 19, 201–207. ( 10.1007/s11743-015-1755-x) [DOI] [Google Scholar]
- 37.Holland PM, Rubingh DN. 1992. Mixed surfactant systems. In Mixed surfactant systems, pp. 2–30. American Chemical Society. [Google Scholar]
- 38.Rosen MJ, Zhu BY. 1984. Synergism in binary mixtures of surfactants. J. Colloid Interface Sci. 99, 427–434. ( 10.1016/0021-9797(84)90129-2) [DOI] [Google Scholar]
- 39.Chakraborty S, Chakraborty A, Saha SK. 2014. Tuning of physico-chemical characteristics of charged micelles by controlling head group interactions via hydrophobically and sterically modified counter ions. RSC Adv. 4, 32 579–32 587. ( 10.1039/c4ra03937h) [DOI] [Google Scholar]
- 40.Banipal TS, Sood AK. 2013. Mixed micellar and interfacial interactions of a triblock polymer (EO37PO56EO37) with a series of monomeric and dimeric surfactants. J. Surfactants Deterg. 16, 881–891. ( 10.1007/s11743-013-1516-7) [DOI] [Google Scholar]
- 41.Sachin KM, Chandra A, Singh M. 2017. Nanodispersion of flavonoids in aqueous DMSO-BSA catalysed by cationic surfactants of variable alkyl chain at T= 298.15 to 308.15 K. J. Mol. Liq. 246, 379–395. ( 10.1016/j.molliq.2017.09.076) [DOI] [Google Scholar]
- 42.Feky AAE, et al. 2016. Use of biodegradation ratios in monitoring trend of biostimulated biodegradation in crude oil polluted soils. Int. J. Sci. Technol. Res. 5, 179–184. [Google Scholar]
- 43.Li F, Rosen MJ, Sulthana SB. 2001. Surface properties of cationic gemini surfactants and their interaction with alkylglucoside or -maltoside surfactants. Langmuir 17, 1037–1042. ( 10.1021/la001162b) [DOI] [Google Scholar]
- 44.Qin L, Wang X-H. 2017. Surface adsorption and thermodynamic properties of mixed system of ionic liquid surfactants with cetyltrimethyl ammonium bromide. RSC Adv. 7, 51 426–51 435. ( 10.1039/c7ra08915e) [DOI] [Google Scholar]
- 45.Khan IA, Mohammad R, Alam MS. 2010. surface properties and mixed micellization of cationic gemini surfactants with ethyleneamines. J. Chem. Eng. Data 55, 370–380. ( 10.1021/je9003756) [DOI] [Google Scholar]
- 46.Israelachvili JN, Mitchell DJ, Ninham BW. 1976. Theory of self-assembly of hydrocarbon amphiphiles into micelles and bilayers. J. Chem. Soc. Faraday Trans. 72, 1525 ( 10.1039/f29767201525) [DOI] [Google Scholar]
- 47.Nagarajan R. 2002. Molecular packing parameter and surfactant self-assembly: the neglected role of the surfactant tail. Langmuir 18, 31–38. ( 10.1021/la010831y) [DOI] [Google Scholar]
- 48.Sagisaka M, Saito T, Yoshizawa A, Rogers SE, Guittard F, Hill C, Blesic M. 2019. Water-in-CO2 microemulsions stabilized by fluorinated cation-anion surfactant pairs. Langmuir 35, 3445–3454. ( 10.1021/acs.langmuir.8b03942) [DOI] [PubMed] [Google Scholar]
- 49.Tanford C. 1980. The hydrophobic effect: formation of micelles and biological membranes. 2nd edn New York, NY: Wiley. [Google Scholar]
- 50.Mukhim T, Ismail K. 2011. Aggregation, counter ion binding and adsorption behaviors of cetylpyridinium chloride in water/glycerol media at 25°C. J. Surfactants Deterg. 15, 47–51. ( 10.1007/s11743-011-1281-4) [DOI] [Google Scholar]
- 51.Das D, Ismail K. 2008. Aggregation and adsorption properties of sodium dodecyl sulfate in water–acetamide mixtures. J. Colloid Interface Sci. 327, 198–203. ( 10.1016/j.jcis.2008.07.045) [DOI] [PubMed] [Google Scholar]
- 52.Patel R, Khan AB, Dohare N, Ali MM, Rajor HK.. 2015. Mixed micellization and interfacial properties of ionic liquid-type imidazolium gemini surfactant with amphiphilic drug amitriptyline hydrochloride and its thermodynamics. J. Surfactants Deterg. 18, 719–728. ( 10.1007/s11743-015-1709-3) [DOI] [Google Scholar]
- 53.Basu RG, Chakraborty I, Ghosh S, Moulik SP.. 2007. On mixed binary surfactant systems comprising MEGA 10 and alkyltrimethylammonium bromides: a detailed physicochemical study with a critical analysis. J. Colloid Interface Sci. 307, 543–553. ( 10.1016/j.jcis.2006.11.055) [DOI] [PubMed] [Google Scholar]
- 54.Parekh P, Varade D, Parikh J, Bahadur P. 2011. Anionic–cationic mixed surfactant systems: micellar interaction of sodium dodecyl trioxyethylene sulfate with cationic gemini surfactants. Colloids Surf. A 385, 111–120. ( 10.1016/j.colsurfa.2011.05.057) [DOI] [Google Scholar]
- 55.Nabi A, Tasneem S, Jesudason CG, Lee VS, Zain SBM. 2018. Study of interaction between cationic surfactant (CTAB) and paracetamol by electrical conductivity, tensiometric and spectroscopic methods. J. Mol. Liq. 256, 100–107. ( 10.1016/j.molliq.2018.01.185) [DOI] [Google Scholar]
- 56.Sugihara G, Nagadome S, Oh S-W, Ko J-S.. 2008. A review of recent studies on aqueous binary mixed surfactant systems. J. Oleo. Sci. 57, 61–92. ( 10.5650/jos.57.61) [DOI] [PubMed] [Google Scholar]
- 57.Dan A, Ghosh S, Moulik SP. 2009. Physicochemistry of the interaction between inulin and alkyltrimethylammonium bromides in aqueous medium and the formed coacervates. J. Phys. Chem. B 113, 8505–8513. ( 10.1021/jp902641d) [DOI] [PubMed] [Google Scholar]
- 58.Hao LS, Jia Y-F, Liu Q, Wang Y, Xu G-Y, Nan Y-Q.. 2016. Influences of molecular structure of the cationic surfactant, additives and medium on the micellization of cationic/anionic surfactant mixed systems. Colloids Surf. A 511, 91–104. ( 10.1016/j.colsurfa.2016.09.054) [DOI] [Google Scholar]
- 59.Varade D, Joshi T, Aswal VK, Goyal PS, Hassan PA, Bahadur P.. 2005. Effect of salt on the micelles of cetyl pyridinium chloride. Colloids Surf. A 259, 95–101. ( 10.1016/j.colsurfa.2005.02.018) [DOI] [Google Scholar]
- 60.Chatterjee A, Moulik SP, Sanyal SK, Mishra BK, Puri PM.. 2001. Thermodynamics of micelle formation of ionic surfactants: a critical assessment for sodium dodecyl sulfate, cetyl pyridinium chloride and dioctyl sulfosuccinate (Na salt) by microcalorimetric, conductometric, and tensiometric measurements. J. Phys. Chem. B 105, 12 823–12 831. ( 10.1021/jp0123029) [DOI] [Google Scholar]
- 61.Pan A, Naskar B, Prameela GKS, Phani Kumar BVN, Mandal AB, Bhattacharya SC, Moulik SP.. 2012. Amphiphile behavior in mixed solvent media I: Self-aggregation and ion association of sodium dodecylsulfate in 1,4-dioxane–water and methanol–water media. Langmuir 28, 13 830–13 843. ( 10.1021/la303281d) [DOI] [PubMed] [Google Scholar]
- 62.Herrington KL, Kaler EW, Miller DD, Zasadzinski JA, Chiruvolu S.. 1993. Phase behavior of aqueous mixtures of dodecyltrimethylammonium bromide (DTAB) and sodium dodecyl sulfate (SDS). J. Phys. Chem. 97, 13 792–13 802. ( 10.1021/j100153a058) [DOI] [Google Scholar]
- 63.Rub MA. 2019. Aggregation and interfacial phenomenon of amphiphilic drug under the influence of pharmaceutical excipients (green/ biocompatible gemini surfactant). PLoS ONE 14, e0211077 ( 10.1371/journal.pone.0211077) [DOI] [PMC free article] [PubMed] [Google Scholar]
- 64.Mata J, Varade D, Bahadur P. 2005. Aggregation behavior of quaternary salt based cationic surfactants. Thermochim. Acta 428, 147–155. ( 10.1016/j.tca.2004.11.009) [DOI] [Google Scholar]
- 65.Kamenka N, Chorro M, Talmon Y, Zana R. 1992. Study of mixed aggregates in aqueous solutions of sodium dodecyl sulfate and dodecyltrimethylammonium bromide. Colloids Surf. 67, 213–222. ( 10.1016/0166-6622(92)80300-Q) [DOI] [Google Scholar]
- 66.Hao LS, Yang N, Xu G-Y, Jia Y-F, Liu Q, Nan Y-Q.. 2016. Specific ion effects on the micellization of aqueous mixed cationic/anionic surfactant systems with various counterions. Colloids Surf. A 504, 161–173. ( 10.1016/j.colsurfa.2016.05.073) [DOI] [Google Scholar]
- 67.Niraula TP, Chatterjee SK, Bhattarai A. 2018. Micellization of sodium dodecyl sulphate in presence and absence of alkali metal halides at different temperatures in water and methanol-water mixtures. J. Mol. Liq. 250, 287–294. ( 10.1016/j.molliq.2017.12.014) [DOI] [Google Scholar]
- 68.del Rio JM, Prieto G, Sarmiento F, Mosquera V.. 1995. Thermodynamics of micellization of N-octyltrimethylammonium bromide in different media. Langmuir 11, 1511–1514. ( 10.1021/la00005a018) [DOI] [Google Scholar]
- 69.Chauhan S, Sharma K. 2014. Effect of temperature and additives on the critical micelle concentration and thermodynamics of micelle formation of sodium dodecyl benzene sulfonate and dodecyltrimethylammonium bromide in aqueous solution: a conductometric study. J. Chem. Thermodyn. 71, 205–211. ( 10.1016/j.jct.2013.12.019) [DOI] [Google Scholar]
- 70.Ghosh DKK, Quagliotto P. 2009. Micellization behavior of [C-16-4-C-16], 2Br(-) gemini surfactant in binary aqueous-solvent mixtures. Indian J. Chem. 48A, 1522–1526. [Google Scholar]
- 71.Norvaišas P, Petrauskas V, Matulis D. 2012. Thermodynamics of cationic and anionic surfactant interaction. J. Phys. Chem. B 116, 2138–2144. ( 10.1021/jp2095888) [DOI] [PubMed] [Google Scholar]
- 72.Rub MA, Asiri AM, Naqvi AZ, Rahman MM, Khan SB, Din K.. 2013. Mixed micellization between amphiphilic drug promethazine hydrochloride and cationic surfactant (conventional as well as gemini). J. Mol. Liq. 177, 19–25. ( 10.1016/j.molliq.2012.10.003) [DOI] [Google Scholar]
- 73.Talhout R, Engberts JBFN. 1997. Self-assembly in mixtures of sodium alkyl sulfates and alkyltrimethylammonium bromides: aggregation behavior and catalytic properties. Langmuir 13, 5001–5006. ( 10.1021/la970388k) [DOI] [Google Scholar]
- 74.Mitra D, Chakraborty I, Bhattacharya SC, Moulik SP.. 2007. Interfacial and solution properties of tetraalkylammonium bromides and their sodium dodecyl sulfate interacted products: a detailed physicochemical study. Langmuir 23, 3049–3061. ( 10.1021/la062830h) [DOI] [PubMed] [Google Scholar]
- 75.Sohrabi B, Poorgholami-Bejarpasi N, Nayeri N. 2014. Dispersion of carbon nanotubes using mixed surfactants: experimental and molecular dynamics simulation studies. J. Phys. Chem. B 118, 3094–3103. ( 10.1021/jp407532j) [DOI] [PubMed] [Google Scholar]
- 76.Liu R, Yoshida H, Narisawa S, Fujita S, Arai M.. 2012. The dispersion of TiO2 modified by the accumulation of CO2 molecules in water: an effective medium for photocatalytic H2 production. RSC Adv. 2, 8002 ( 10.1039/c2ra21102e) [DOI] [Google Scholar]
- 77.Zaghbani N, Dhahbi M, Hafiane A. 2011. Spectral study of Eriochrome Blue Black R in different cationic surfactant solutions. Spectrochim. Acta A 79, 1528–1531. ( 10.1016/j.saa.2011.05.011) [DOI] [PubMed] [Google Scholar]
- 78.Tunç S, Duman O, Kancı B. 2012. Spectrophotometric investigation of the interactions between cationic dye (C.I. Basic Yellow 2) and anionic surfactant (sodium dioctylsulfosuccinate) in the premicellar and micellar region. Dyes Pigm. 94, 233–238. ( 10.1016/j.dyepig.2012.01.016) [DOI] [Google Scholar]
- 79.Kansal S, Singh M, Sud D. 2007. Studies on photodegradation of two commercial dyes in aqueous phase using different photocatalysts. J. Hazard. Mater. 141, 581–590. ( 10.1016/j.jhazmat.2006.07.035) [DOI] [PubMed] [Google Scholar]
- 80.Wang YH, Liu XQ, Meng GY. 2008. Preparation and properties of supported 100% titania ceramic membranes. Mater. Res. Bull. 43, 1480–1491. ( 10.1016/j.materresbull.2007.06.041) [DOI] [Google Scholar]
- 81.Magid LJ, Konno K, Martin CA. 1981. Binding of phenols to inverted micelles and microemulsion aggregates. J. Phys. Chem. 85, 1434–1439. ( 10.1021/j150610a031) [DOI] [Google Scholar]
- 82.Hunter RJ. 1981. Zeta potential in colloid science. London, UK: Academic Press; See https://www.elsevier.com/books/zeta-potential-in-colloid-science/hunter/978-0-12-361961-7. [Google Scholar]
- 83.Dobrowolska ME, Koper GJM. 2014. Optimal ionic strength for nonionically initiated polymerization. Soft Matter 10, 1151 ( 10.1039/c3sm51998h) [DOI] [PubMed] [Google Scholar]
- 84.Savvin SB, Chernova RK, Shtykov SN. 1991. Poverkhnostno-aktivnye veshchestva(surfactants). Moscow, Russia: Nauka. [Google Scholar]
- 85.Stepanov BI. 1977. Vvedenie v khimiyu i tekhnologiyu organicheskikh krasitelei (Introduction to chemistry and technology of organic dyes). Moscow, Russia: Khimiya. [Google Scholar]
- 86.Naeem K, Shah SS, Shah SWH, Laghari GM. 2000. Solubilization of cationic hemicyanine dyesin anionic surfactant micelles: a partitioning study. Monatshefte Fuer Chemie/Chem. Mon. 131, 761 ( 10.1007/s007060050023) [DOI] [Google Scholar]
- 87.Karukstis KK, Litz JP, Garber MB, Angell LM, Korir GK.. 2010. A spectral approach to determine location and orientation of azo dyes within surfactant aggregates. Spectrochim. Acta A 75, 1354–1361. ( 10.1016/j.saa.2009.12.087) [DOI] [PubMed] [Google Scholar]
- 88.Bales BL, Benrraou M, Zana R. 2002. Krafft temperature and micelle ionization of aqueous solutions of cesium dodecyl sulfate. J. Phys. Chem. B 106, 9033–9035. ( 10.1021/jp021297l) [DOI] [Google Scholar]
- 89.King WE. 1979. Principles of solution and solubility, Kozo Shinoda (translated in collaboration with Paul Becher). New York, NY: Marcel Dekker. [Google Scholar]
- 90.Oakes J, Gratton P. 2003. Solubilisation of dyes by surfactant micelles. Part 2: molecular interactions of azo dyes with cationic and zwitterionic surfactants. Coloration Technol. 119, 100–107. ( 10.1111/j.1478-4408.2003.tb00157.x) [DOI] [Google Scholar]
- 91.Zhang JS, Lee S, Lee JW. 2007. Does SDS micellize under methane hydrate-forming conditions below the normal Krafft point? J. Colloid Interface Sci. 315, 313–318. ( 10.1016/j.jcis.2007.06.049) [DOI] [PubMed] [Google Scholar]
- 92.Gayet P, Dicharry C, Marion G, Graciaa A, Lachaise J, Nesterov A.. 2005. Experimental determination of methane hydrate dissociation curve up to 55 MPa by using a small amount of surfactant as hydrate promoter. Chem. Eng. Sci. 60, 5751–5758. ( 10.1016/j.ces.2005.04.069) [DOI] [Google Scholar]
- 93.Khan F, Rub MA, Azum N, Asiri AM.. 2018. Mixtures of antidepressant amphiphilic drug imipramine hydrochloride and anionic surfactant: micellar and thermodynamic investigation. J. Phys. Org. Chem. 31, e3812 ( 10.1002/poc.3812) [DOI] [Google Scholar]
Associated Data
This section collects any data citations, data availability statements, or supplementary materials included in this article.
Supplementary Materials
Data Availability Statement
The graphical data of specific conductivities and UV–Vis that supporting this paper have been uploaded as electronic supplementary material.


