

Abstract
Using pomelo peel's pulp (PPP) as raw material, a new chemically modified PPP was prepared by the process of fermentation, cooking, freeze-drying, and so on. The adsorbent has been characterized by EDS, IR, BET and SEM. The factors of different adsorption conditions such as pH value, adsorption temperature, mass of adsorbent, adsorption time and initial concentration of UO22+ were investigated. The adsorption mechanism was explored by adsorption thermodynamics and kinetics experiments. The results indicate that the pH value is 6.0, the dosage of adsorbent is 500 mg l–1, the temperature is 50°C and the adsorption time is 90 min, which is the best adsorption condition. When the initial concentration of UO22+ is 35 mg l–1, the adsorbed amount of uranyl ions by the modified PPP adsorbent can reach 42.733 mg g−1, 26.8% higher than the adsorption amount of unmodified adsorbent (31.276 mg g−1), which is obviously enhanced. The kinetic and thermodynamic experiments show that the adsorption process is in good agreement with the pseudo second-order kinetics model, that it is an endothermic reaction, and the reaction is spontaneous. The adsorption process is entropy-dominated. The Freundlich adsorption isotherm can describe the adsorption process more accurately.
Keywords: chemical modification, pomelo peel's pulp, adsorbent, uranyl ions, adsorption
1. Introduction
With the continuous development of the nuclear industry, a large amount of uranium-containing wastewater has been generated, causing great harm to the human body and the environment [1,2]. How to effectively treat uranium-containing wastewater has become the current research hotspot. At present, there are mainly methods for treating wastewater containing uranium: membrane separation method [3], adsorption method [4–12], chemical precipitation method [13] and electrolysis method [14], of which the adsorption method is the most efficient and simplest method [15–19]. This caused widespread concern among scholars at home and abroad. Tao et al. [20] used barium metaphosphate as an adsorbent to study the adsorption properties of uranyl ions under various conditions, and the maximum adsorption capacity could reach 261.78 mg g−1 under the optimal conditions; Zong-bo et al. [21] synthesized polyamino-containing ligands modified ordered mesoporous materials with surface area 1052 cm2 g−1, and the adsorption of uranium could reach 454 mg g−1. Although the above studies obtain excellent results on adsorption of uranyl ions, they used chemical synthesis to prepare materials, and raw materials are not easily available.
Pomelo production is extremely rich in China. PPP is a by-product of pomelo. A large number of pomelo peels are discarded each year, polluting the environment and wasting resources. PPP has a rough surface, a large pore size, and good adsorption [22]. PPP is expected to become a potential adsorbent. Pei et al. [23] used the ZnCl2 activation method to modify citron skin to prepare absorbent, and the adsorption rate of Pb2+ could reach >90% under optimal conditions; Yanhua et al. [24] studied different kinds of modified grapefruit skin: the results showed that the alkalized modified grapefruit skin adsorbent had the best effect, and that the adsorption rate could reach >92% under suitable conditions for Pb2+. The above research indicates that the modified biomass material is a better potential adsorbent. Therefore, the modified PPP adsorbent was prepared, and this work not only develops a new route for the recycling of PPP, but also an efficient means for removal of UO22+ in water, which would represent a high application value.
In this study, a new chemically modified PPP adsorbent was prepared, and the adsorbent has been characterized by EDS, IR, BET and SEM. The factors of different conditions such as pH value, temperature, mass of adsorbent, adsorption time, and initial concentration of UO22+ on adsorption performance were also investigated. The adsorption mechanism was explored through adsorption thermodynamics and adsorption kinetics experiments.
2. Material and methods
2.1. Reagents
Sodium thiosulfate, starch, AR (Tianjin sailboat Chemical Reagent Technology Co., Ltd.); methanol, acetic acid, AR (Hunan Huihong Reagent Co., Ltd.); azo II isopropyl formate (Jiuding Chemicals Co., Ltd.); oxaloacetic acid (Beijing Balingway Technology Co., Ltd.), U3O8, AR (Beijing Nuclear Industry Institute of Chemical Metallurgy); NaOH, AR (Tianjin Aobokai Chemical Co., Ltd.); hydrochloric acid, nitric acid, AR (Hengyang Kaixin Chemical Reagent Co., Ltd.); anhydrous sodium acetate, AR (Guangdong Provincial Chemical Reagent Engineering Research and Development Center); chloroacetic Acid, AR (Tianjin Fuchen Chemical Reagent Co., Ltd.); and azoarsenic III, AR (Tianjin Kemiou Chemical Reagent Co., Ltd.).
2.2. Instrumentation
X-Max EDS meter (Oxford); Micro for TriStar II Plus 2.02 BET tester (Micro); JSM-7500F SEM analyzer (JEOL); Nicolet-460 Fourier transform infrared spectrometer (Thermo Fisher Scientific, USA); FA2004 electronic balance, accuracy of 0.0001 g (Shanghai Haoyu Hengping Scientific Instrument Co., Ltd.); T6Xinyue visible spectrophotometer (Beijing General Analysis Instrument Co., Ltd.); 6219 pH meter (Shanghai Renshi Electronics Co., Ltd.); 101-1BS-Electric blast drying box (Bangxi Instrument Technology (Shanghai) Co., Ltd.); TD5A-WS desktop low-speed centrifuge (Changsha Well Kangxiang Eagle Centrifuge Co., Ltd.); LGJ-18 freeze drying machine (Ningbo Xinzhi Biotechnology Co., Ltd.); KQ2200DE Chinese liquid crystal ultrasonic cleaner (Kunshan Meimei Ultrasonic Instruments); and DF-101S collector-type thermostatically heated magnetic stirrer (Changsha Taikang Instrument Equipment Co., Ltd.).
2.3. Preparation of adsorbent
Pomelos purchased on the market were stripped to obtain PPP materials. After the PPP was shredded, soaked in deionized water and a small amount of Na2S2O3 was added to keep the dissolved oxygen in the water at about 0.4 mg l−1. Then a particular amount of methanol and acetic acid solution was added. After maintaining the above state for 30 days, the PPP was taken out and mixed with starch at a mass ratio of 10 : 1. Next, a particular amount of 0.3% isopropyl azodicarboxylic acid was added and stirred for 24 h. PPP was placed on the upper layer, and 20% oxaloacetate solution was placed on the lower layer, which was boiled in the autoclave for 60 min. The sample was then cooled and dried in a vacuum freeze dryer to obtain a fluffy white adsorbent.
2.4. Determination of U(VI)
In total, 0.5 ml of the solution under testing and 0.5 ml arsenazo III solution were added to a 5 ml volumetric flask. The volume was adjusted with sodium acetate-chloroacetate buffer solution, the mixture was shaken well and stirred for 25 min. The absorbance of the solution was measured using a spectrophotometer at 652 nm wavelength with a blank reagent as a reference.
2.5. Adsorption experiment
Twenty ml of uranyl ion solution was added to a 50 ml beaker to change the adsorption experiment conditions: pH value, temperature, mass of sorbent, adsorption time, the initial concentration of uranyl ion, etc. All experiments were conducted in a thermostatically heated magnetic stirrer. The adsorbed solution was centrifuged. After separation, the uranyl ion concentration in the supernatant was measured by spectrophotometry.
The adsorption efficiency (θ) and the adsorption capacity (q) are calculated as follows:
| 2.1 |
and
| 2.2 |
where θ is the adsorption efficiency (%), qt is the adsorption amount at time t (mg g−1), C0 is the uranyl ion initial concentration (mg l−1), Ce is the uranyl ion equilibrium concentration (mg l−1), m is the mass of sorbent (g), and V is the volume of the solution (l).
3. Results and discussion
3.1. Standard curve
Different concentrations of uranyl ion solution were prepared to the mark line in a series of 5 ml volumetric flasks, and the absorbance of uranyl ion solutions was measured. The standard curve of the uranium ion concentration and absorbance was plotted in figure 1
| 3.1 |
where A is absorbance and C is uranyl ion concentration (mg l−1).
Figure 1.
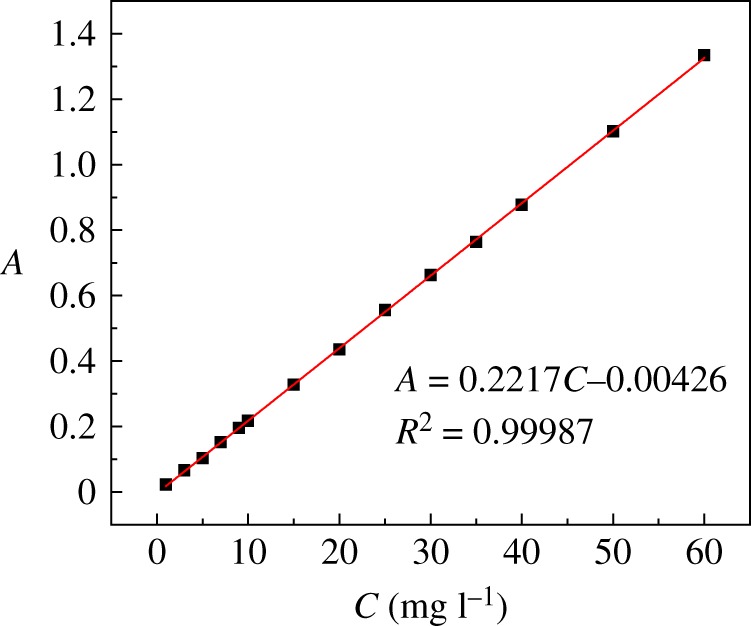
The standard curve of uranyl ion concentration versus absorbance.
Fitting the absorbance to the uranyl ion concentration as a function of (equation (3.1)) R2 = 0.9998, which proves a good fit.
3.2. BET
The specific surface area, average pore diameters and pore volume of the modified PPP measured by the BET method are listed in table 1. According to the data in the table, the BET surface area of the unmodified PPP and the modified PPP is 1.061 and 36.733 m2 g−1, respectively, indicating that the modified PPP adsorbent with a large BET surface area has potential adsorption properties for UO22+.
Table 1.
BET surface area, pore volume and average pore diameters of samples.
| samples | BET surface area (m² g−1) | pore volume (cm³ g−1) | pore diameters (nm) |
|---|---|---|---|
| unmodified PPP | 1.061 | 0.0021 | 1.450 |
| modified PPP | 36.733 | 0.0336 | 3.656 |
3.3. EDS
EDS analysis of modified PPP and adsorbent after adsorption of uranyl ion (AAUI) was performed, and the results are shown in table 2 and figure 2. According to the data in the table, the modified PPP contains mainly C and O, and it also contains a small amount of K, Ca and other elements. The mass percentage of U in the adsorbent before and after adsorbing uranium increased from 0 to 8.96%, and the atomic percentage increased from 0 to 0.57%, which shows that a large amount of uranium ions are adsorbed on the modified PPP.
Table 2.
Results of EDS for chemical elements on modified PPP before and after adsorption for U(VI).
| before |
after |
|||
|---|---|---|---|---|
| element | W % | At % | W % | At % |
| C K | 46.59 | 53.89 | 42.33 | 53.47 |
| O K | 52.89 | 45.93 | 48.29 | 45.80 |
| U M | 0 | 0 | 8.96 | 0.57 |
| K K | 0.28 | 0.10 | 0.05 | 0.02 |
| Ca K | 0.24 | 0.08 | 0.37 | 0.14 |
Figure 2.

EDS spectra of chemical elements on modified PPP (a) before and (b) after adsorption for U(VI).
3.4. SEM
The modified PPP and AAUI were analysed by SEM, and the results are shown in figure 3. It can be seen from figure 3 that the surface of the modified PPP has good pore structure, rough surface and a continuous and uniform porous structure, which is favourable for adsorption. The surface porosity of PPP is reduced after adsorption of uranyl ion, and the overall look of its surface is changed to be relatively flat, which is caused by the adsorption of uranyl ions.
Figure 3.

Microcosmic configuration of modified PPP (a) before and (b) after adsorption for U(VI).
3.5. IR
The infrared spectra of the modified PPP and AAUI are shown in figure 4. It can be seen from figure 4a that the stretching vibration peaks at 1021 cm−1 and 1241 cm−1 correspond to C–N and C–O, respectively. The deformation vibration peaks at 1435 cm−1 and 1638 cm−1 correspond to O–H and N–H, respectively, and the stretching vibration peaks at 1742 cm−1, 2929 cm−1 and 3406 cm−1 correspond to C=O, C–H and O–H, respectively. Compared with the plot of figure 4a, in the infrared spectrum of the modified PPP after adsorption of uranyl ions, the position of the absorption peak is shifted to a certain degree, and the intensity of the absorption peak is reduced. This phenomenon illustrates that the structure of AAUI has changed. The wavenumber of the O–H stretching vibration peak changed to 3428 cm−1, suggesting that its contribution to surface complexation reactions cannot be ignored [25]. The peak at 1742 cm−1 corresponds to C=O stretching vibration, which is obviously weakened, and this indicates that the influence of uranyl ions on the adsorbent of C=O was probably related to the complexation between them [26]. The characteristic peak is significantly enhanced and moving to high wavenumbers at near 1383 cm−1, and the peak corresponds to –CH symmetric bending vibrations –CHOH [27], suggesting that the complexation reaction occurs between –CHOH and UO22+. The reason for the above change may be due to the adsorption of uranyl ions at the active site on the surface of PPP, replacing the H+ on the surface group of the adsorbent.
Figure 4.
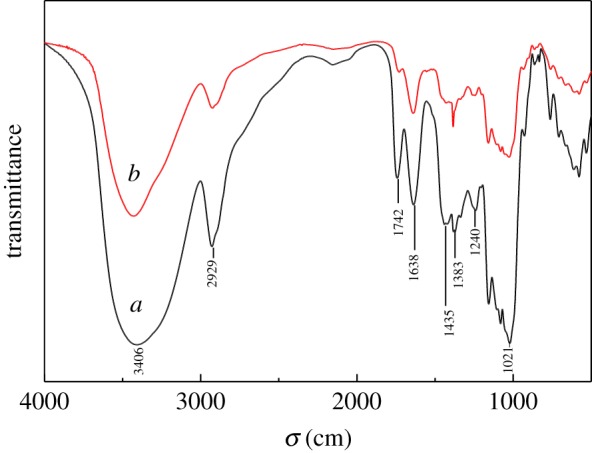
IR spectra of modified PPP (a) before and (b) after adsorption for U(VI).
3.6. Effect of pH
Batch adsorption tests were performed at pH ranging from 2 to 7. As shown in figure 5, these results show that pH has a significant effect on adsorption. When pH = 5.0, the adsorption efficiency and the adsorption capacity of uranyl ions by the modified PPP adsorbent were the highest, 73.27% and 14.654 mg g−1, respectively; increasing the pH from 2 to 5, the adsorption efficiency and the adsorption amount gradually increase; when pH = 5.0–6.0, the adsorption rate and the amount of adsorption change only slightly; when pH > 6.0, the adsorption rate and the amount of adsorption are lower. So the optimum pH for the adsorption of uranyl ions by modified PPP was 5.0–6.0.
Figure 5.
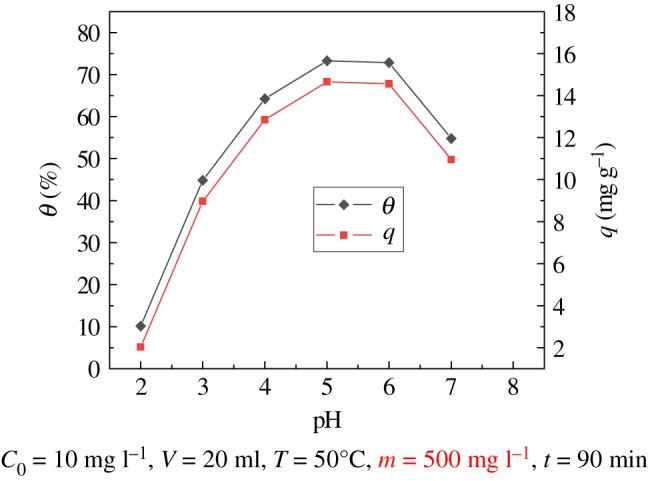
Effect of pH on modified PPP adsorption of U(VI).
Since the pH of the adsorption medium affects the ionization of the functional groups and the ion species, the influence of pH on adsorption is very large. When the solution is strongly acidic, H+ in the solution has a positive charge and competes with uranyl ions for the active site of the adsorbent. H+ first binds to the active site on the surface of the adsorbent, and uranyl ions are repelled and it is difficult to reach the active site, which leads to lower adsorption rates and capacities. When pH > 6.0, as the alkalinity of the solution increases, the hydroxide ion concentration in the solution continuously increases, and hydroxide ions and uranyl ions can form some ions with lower adsorption affinity, including [UO2OH]+, [(UO2)3(OH)5]+, [(UO2)2(OH)2(OH)2]2+, [(UO2)3(OH)4]2+, [(UO2)2OH]3+, [(UO2)3(OH)]5+, [(UO2)3(OH)7]− and [UO2(OH)4]2−. The adsorption of uranyl ions decreases [7,28,29].
3.7. Effect of temperature
The effect of adsorption over the temperature range of 30–70°C was explored. As shown in figure 6, the result illustrates that the temperature has a significant influence on the adsorption. The adsorption rate and capacity increase with temperature. When the temperature is 70°C, the adsorption efficiency reaches 80.94% and the corresponding adsorption capacity is 16.188 mg g−1. It can be seen that when the temperature is between 50°C and 70°C, the adsorption performance of UO22+ is the best, and over this temperature range, the adsorption capacity and the adsorption rate change only slightly with the increase in temperature. For ease of operation, experiments were conducted at 50°C.
Figure 6.
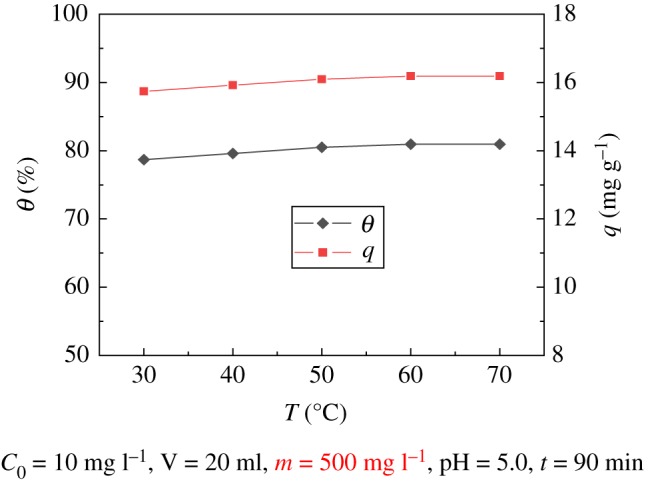
Effect of temperature on modified PPP adsorption of U(VI).
3.8. Effect of adsorbent dose
The effect of the mass of adsorbent dose on the adsorption was analysed. As shown in figure 7, by increasing the adsorbent dose from 250 to 1250 mg l−1, the adsorption efficiency of uranyl ions gradually increased from 59.29% to 82.30%. The change in adsorption amount is opposite to the removal rate. With the increase in adsorbent dose, the adsorption amount decreases from 23.715 to 6.583 mg g−1. The main reason for this is that with the amount of adsorbent increasing, the number of active sites for adsorption increases and the adsorption rate of uranyl ions can also gradually increase; however, the concentration of uranyl ions is constant, and with the mass of adsorbent increasing, the amount of adsorbed uranium per unit mass decreases, so that the amount of adsorption decreases.
Figure 7.
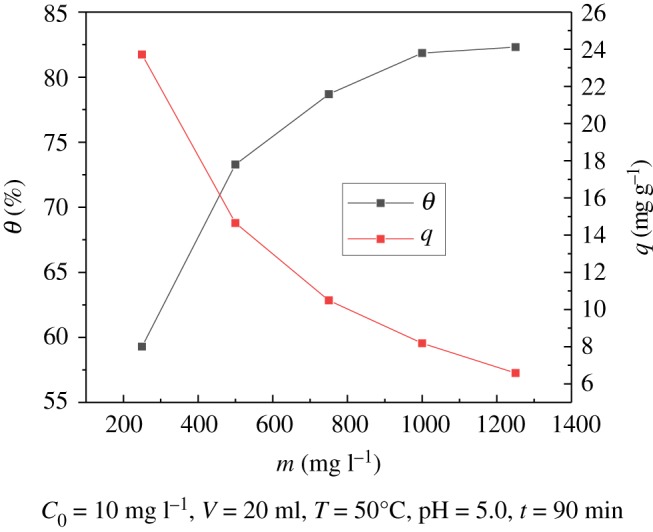
Effect of adsorbent dose on adsorption of U(VI).
3.9. Effect of contact time
The effect of different contact times (ranging from 15 to 150 min) was investigated. The results are shown in figure 8, indicating that the adsorption rate of uranyl ions in the modified PPP reached 71.92% when adsorption lasted for 30 min. The adsorption capacity and adsorption rates increase continuously until 60 min. In the flat section, the adsorption rate was 79.13%, and the adsorption capacity was 15.827 mg g−1. At 90 min, the adsorption capacity and adsorption rate remained basically unchanged; the phenomenon confirms that the adsorption process has attained the adsorption equilibrium.
Figure 8.
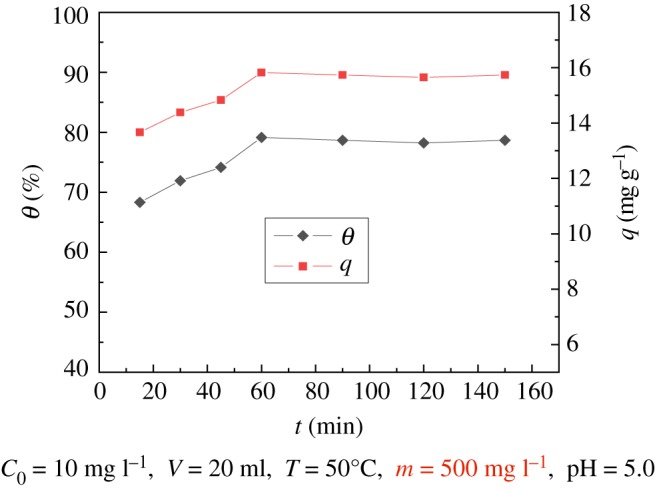
Effect of time on modified PPP adsorption of U(VI).
The adsorption of uranyl ions by modified PPP may take place on the outer surface and the inner surface of the sample [16,30]. The uranyl ions are first adsorbed on the surface of the sample. The adsorption efficiency is fast and the time required is short. However, uranyl ions need to be adsorbed on the inner surface, and two processes are required. First, the molecules diffuse into the cavities of the adsorbent, and then they are adsorbed. The adsorption of uranyl ions is relatively slow; therefore, the image tends to be gentle until adsorption reaches equilibrium.
3.10. Effect of initial concentration
The effect of the initial mass concentration of uranyl ions on the adsorption was analysed. The results are shown in figure 9, indicating that with the increase in the uranyl ion initial concentration, the adsorption rate of the modified PPP decreases, while the adsorption amount increases first and then decreases; when the initial concentration of uranyl ion reached 70 mg l−1, the maximum adsorption capacity was 61.041 mg g−1, but the adsorption rate was only 43.60%. When the initial mass concentration of uranyl ions was 5 mg l−1, the adsorption rate was 76.31% and the adsorption capacity was only 7.631 mg g−1. This phenomenon confirms that the initial mass concentration of uranyl ions has a significant influence on the adsorption performance of the modified PPP; PPP is adaptable to the treatment of medium and low concentrations of uranium-containing nuclear industrial wastewater.
Figure 9.
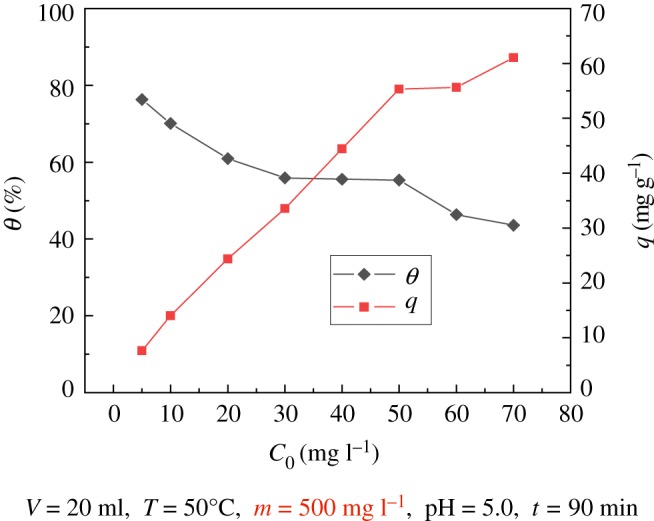
Effect of U(VI) initial concentration on modified PPP adsorption of U(VI).
When the initial concentration of uranyl ions in the solution is low, the uranyl ions can be in full contact with PPP, so the adsorption rate is higher; however, if the adsorbent's active site is not fully combined with uranyl ions, this results in low adsorption. As the initial concentration of uranyl ions continues to increase, the amount of adsorption increases significantly, and the adsorption rate decreases significantly. This is due to the increased concentration of uranyl ions, which is a gradual excess compared with the amount of adsorbent used. When the adsorption reaches saturation, the uranyl ion exists in the solution in a free state, resulting in a reduction in the adsorption rate, but the adsorption amount of uranium per unit mass becomes larger. Therefore, the amount of adsorption increases continuously.
3.11. Comparison of adsorption properties between modified and unmodified PPP
Through a series of adsorption experiments, the optimal conditions for the adsorption of uranyl ions by the modified PPP were obtained. Under this optimal condition, the uranyl ion adsorption experiments of modified and unmodified PPP were performed. As shown in figure 10, the results suggest that the adsorbed amount of the modified PPP can reach 42.733 mg g−1, and the adsorption rate is 61.05%. The adsorption capacity of unmodified PPP and rate were only 31.276 mg g−1 and 44.68%, respectively. The amount of adsorption increased by 26.8%, and the results confirm that the uranyl ion adsorption performance of the modified PPP significantly increased.
Figure 10.
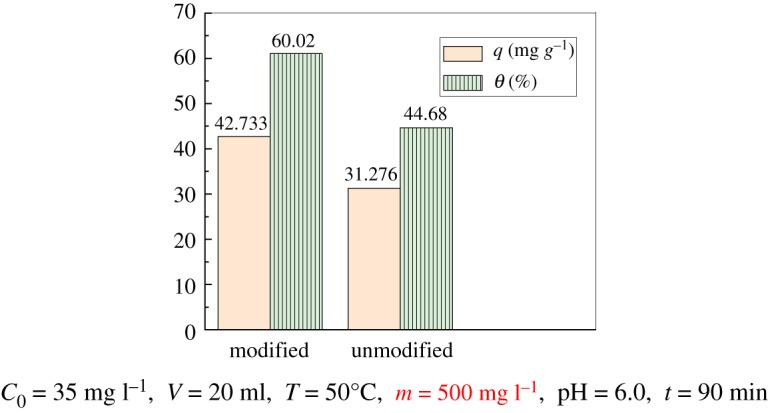
Comparison of adsorption properties between modified and unmodified PPP.
3.12. Kinetic parameters for adsorption of UO22+
Adsorption kinetics can provide information about the adsorption mechanism. The adsorption rate can be fitted, the adsorption mechanism can be inferred, and a reasonable adsorption kinetics model can be established. The kinetic model is currently used for the pseudo first-order model (3.2) and the pseudo second-order model (3.3).
| 3.2 |
and
| 3.3 |
where qe is the equilibrium adsorption capacity (mg g−1), qt is the capacity of adsorption at time t (mg g−1), t is the adsorption time (min), K1 is the pseudo first-order model adsorption rate constant (min−1), and K2 is the pseudo second-order model adsorption rate constant (g mg−1 min−1).
The above two adsorption kinetic models were used to fit the adsorption process. The kinetic parameters are given in table 3. As shown in figures 11 and 12, the pseudo second-order kinetics model (R2 = 0.9995) is better than the pseudo first-order kinetics model (R2 = 0.8093); the theoretical equilibrium adsorption capacity calculated by the pseudo second-order kinetics model is 16.059 mg g−1. The theoretical equilibrium adsorption capacity calculated by the pseudo first-order kinetic model is 2.604 mg g−1, and the equilibrium adsorption capacity obtained by the experiment was 15.827 mg g−1. The results suggest that the theoretical adsorption capacity obtained by the pseudo second-order kinetic model is closer to the experimental value. Therefore, the adsorption process is more consistent with the pseudo second-order model, and confirms that the adsorption process is chemical adsorption [31,32].
Table 3.
Kinetic parameters of U(VI) adsorption on modified PPP.
| model | q(mg g−1) | k | R2 |
|---|---|---|---|
| pseudo first-order | 2.604 | 0.0026 (min−1) | 0.8093 |
| pseudo second-order | 16.059 | 0.0232 (g mg−1 min−1) | 0.9995 |
Figure 11.
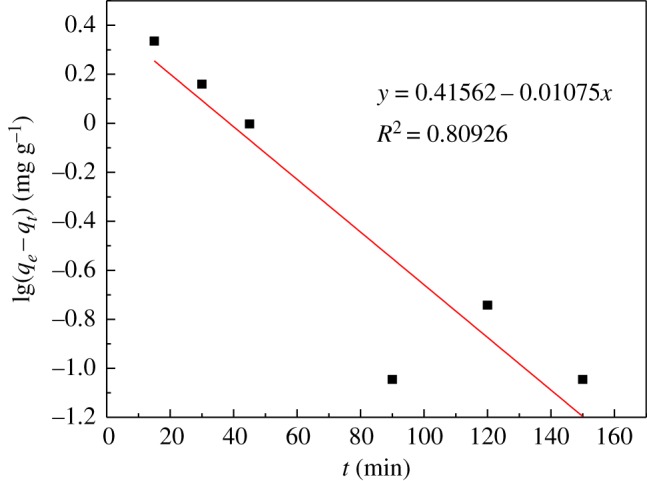
Pseudo first-order model.
Figure 12.
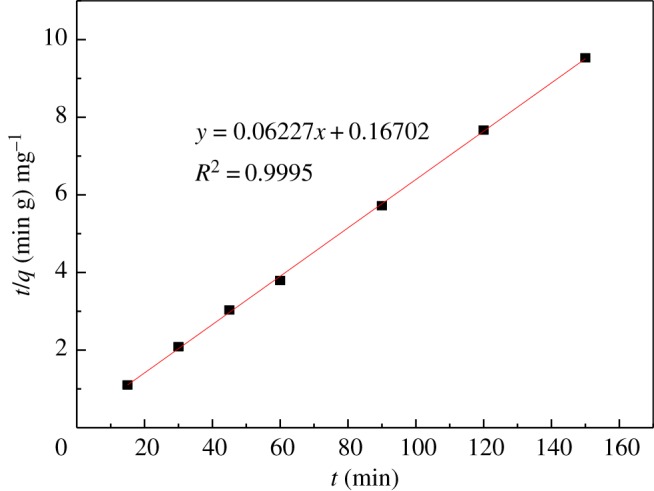
Pseudo second-order model.
3.13. Thermodynamic parameters for adsorption of UO22+
Thermodynamic parameters, for instance, enthalpy change ΔH (kJ mol−1), entropy change ΔS (J K−1 mol−1) and Gibbs free energy ΔG (kJ mol−1), can be fitted by an adsorption thermodynamic model, which directly reflects the relationship between adsorbent and adsorbate molecules, and between adsorbent and solute. ΔH, ΔS and ΔG are calculated by the following equations:
| 3.4 |
| 3.5 |
| 3.6 |
where Kd is the adsorption partition coefficient (l mg–1), qe is the equilibrium adsorption capacity (mg g−1), Ce is the equilibrium concentration (mg l−1), R is the ideal gas constant (8.314 J mol−1 K−1), T is the temperature (K), ΔH is the enthalpy change (kJ mol−1), ΔS is the entropy change (J K−1 mol−1), and ΔG is the Gibbs free energy (kJ mol−1).
Next, lnKd is mapped to 1/T and fitted to a straight line. The results are shown in figure 13. The slope and intercept were ΔH/R and ΔS/R, respectively, and the thermodynamic parameters were obtained. The results are listed in table 4.
Figure 13.
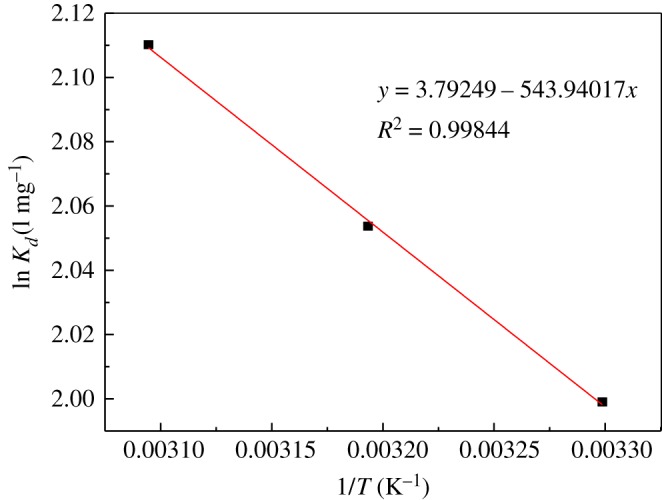
Plot of versus 1/T.
Table 4.
Thermodynamic parameters of U(VI) adsorption on modified PPP.
| ΔG (kJ mol−1) |
||||
|---|---|---|---|---|
| ΔH (kJ mol−1) | ΔS (J k−1 mol−1) | 303.15 K | 313.15 K | 323.15 K |
| 4.522 | 31.531 | −5.036 | −5.352 | −5.667 |
Table 4 testifies that the adsorption process ΔH > 0, confirming that the adsorption process is an endothermic process; ΔS > 0, indicating that the degree of freedom of the process is increased, and the degree of dislocation between the solid and liquid phases in the adsorption process is increased, which may be due to the formation of stable complexes on the surface of PPP when uranyl ions were adsorbed on the PPP. The ΔG values at the three temperatures shown in the table are negative, showing that the adsorption process is spontaneous, and as the temperature increases, the absolute value of ΔG increases, that is, as the temperature increases the spontaneous degree of the adsorption process increases. The data in the table also show that as at all temperatures ΔG is a negative value, the adsorption process is an entropy-dominated rather than a helium-dominated process [33,34].
3.14. Adsorption isotherm
Furthermore, the adsorption process was investigated; the Langmuir isotherm equation and the Freundlich isotherm equation were used for the fitting.
Langmuir isotherm equation:
| 3.7 |
Freundlich isotherm equation:
| 3.8 |
where Ce is the equilibrium concentration of uranyl ions (mg l−1), qe is the equilibrium adsorption capacity (mg g−1), q0 is the maximum adsorption capacity (mg g−1), KL is the Langmuir adsorption equilibrium constant, KF is the Freundlich adsorption coefficient, and n is the Freundlich constant.
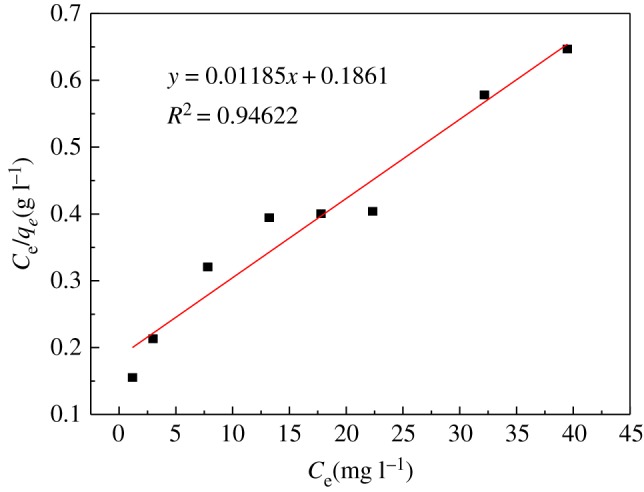
Two isothermal adsorption equations were used for fitting. The parameters are given in table 5. These results are shown in figures 14 and 15.
Table 5.
Langmuir and Freundlich parameters of U(VI) adsorption on modified PPP.
| Langmuir |
Freundlich |
||||
|---|---|---|---|---|---|
| q0 | KL | R2 | n | KF | R2 |
| 84.388 | 0.064 | 0.946 | 1.6778 | 7.134 | 0.994 |
Figure 14.
Langmuir adsorption isotherm.
Figure 15.
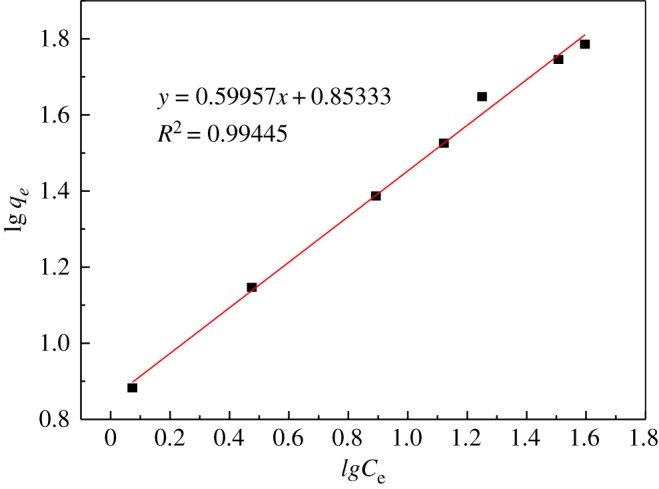
Freundlich adsorption isotherm.
From the data shown, the Freundlich adsorption model (R2 = 0.994) has a higher degree of fit than the Langmuir model (R2 = 0.946). The characteristic parameters n > 1, 1/n = 0.599, indicating that the modified PPP has good uranyl ion adsorption performance; the Langmuir isotherm model provides two parameters, the maximum adsorption capacity (q0) and Langmuir adsorption equilibrium. The constant (KL), by fitting, shows that the maximum adsorption capacity which can be reached is 84.388 mg g−1. In summary, the adsorption process is in good agreement with the Freundlich adsorption model [35].
3.15. Desorption and reusability of the modified PPP
The above adsorption experiment steps were repeated to perform a cycle regeneration experiment: 100 ml of 0.50 mol l−1 NaOH was designated as an eluent for desorption of UO22+ from modified PPP. Figure 16 indicates that the adsorption capacity of the modified PPP decreased from 42.733 mg g−1 in the first cycle to 40.121 mg g−1 in the fifth cycle. After five cycles of adsorption and regeneration, the performance of the modified PPP did not decrease significantly. The above data suggest that the modified PPP is a kind of repeatable adsorption material after regeneration.
Figure 16.
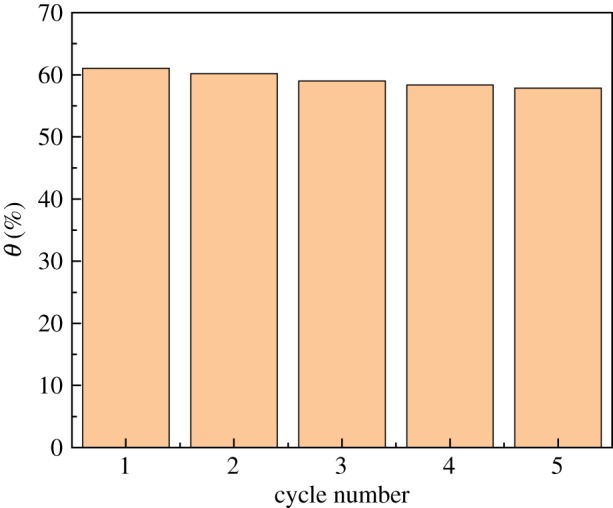
Effect of cycle times on adsorption performance.
3.16. Mechanisms
The kinetic and thermodynamic experiments show that the adsorption process is in good agreement with the pseudo second-order kinetics model and it is an endothermic reaction, and the reaction is spontaneous, confirming that the adsorption process is chemical adsorption. In addition, the adsorption mechanism of modified PPP for uranyl ions was further proved by the analysis of IR. The results indicate that the modified PPP may achieve the purpose of removing UO22+ from solutions through surface complexation and ion exchange [27,30].
Therefore, the sorption mechanism can be expressed by the following reactions:
| 3.9 |
| 3.10 |
| 3.11 |
The possible mechanisms of the adsorption process are shown in figure 17.
Figure 17.

The adsorption mechanism of modified PPP for uranylions.
4. Conclusion
The modified PPP and AAUI have been investigated by BET, SEM, IR and EDS. The factors of different conditions such as pH value, temperature, mass of sorbent, adsorption time, and initial concentration of UO22+ on the adsorption of uranyl ions were studied. The results of adsorption thermodynamics and adsorption kinetics experiments were as follows:
-
(1)
SEM showed that the surface of the modified PPP had good porous structure, rough surface, continuous and uniform porous structure, which was conducive to adsorption;
-
(2)
The optimum pH for the adsorption of uranyl ions by modified PPP was 5.0–6.0; when the initial mass concentration of UO22+ was 35 mg l−1 and the pH value was 6.0, the dosage of adsorbent was 500 mg l−1, temperature 50°C and adsorption time 90 min, the adsorbed capacity of uranyl ions by the modified PPP adsorbent can reach 42.733 mg g−1, the adsorption rate is 61.05%, while the adsorption capacity of unmodified adsorbent was only 31.276 mg g−1, and the adsorption rate was 44.68%. The amount of adsorption increased by 26.8%, thus the results confirm that the uranyl ion adsorption performance of the modified PPP is obviously enhanced.
-
(3)
The kinetic and thermodynamic experiments show that the adsorption process is in good agreement with the pseudo second-order kinetics model and it is an endothermic reaction, and the reaction is spontaneous. The adsorption process is entropy-dominated. The Freundlich adsorption isotherm can describe the adsorption process more accurately. The primary mechanism of adsorption was surface complexation and ion exchange.
Supplementary Material
Acknowledgements
We gratefully acknowledge the anonymous reviewers for their constructive comments which have improved the quality of this paper. We also acknowledge Dr Liu Yong (University of South China) for his assistance.
Data accessibility
The datasets supporting this article have been uploaded as part of the electronic supplementary material (http://dx.doi.org/10.5061/dryad.rg27v0h).
Authors' contributions
Conceived and designed the experiments: P.Y. and Y.X.. Performed the experiments: J.T., A.L. and L.L. Analysed the data: Y.X., A.L., L.L. and H.S. Contributed reagents/materials/analysis tools: P.Y., Y.X. and J.T. Wrote the paper: P.Y., Y.X. and J.T. Copyedited the manuscript: P.Y. and Y.X.
Competing interests
We have no competing interests.
Funding
This study was financially supported by the Natural Science Foundation of Hunan Province (2017JJ2231) and Hunan Province Engineering Research Center of Radioactive Control Technology in Uranium Mining and Metallurgy, and Hunan Province Engineering Technology Research Center of Uranium Tailings Treatment Technology, University of South China (2019YKZX1007).
References
- 1.Pintor AMA, Silvestre-Albero AM, Ferreira CIA, Pereira JPC, Vilar VJP, Botelho CMS, Rodríguez-Reinoso F, Boaventura RAR. 2013. Textural and surface characterization of cork-based sorbents for the removal of oil from water. Indust. Eng. Chem. Res. 52, 16 427–16 435. ( 10.1021/ie402038n) [DOI] [Google Scholar]
- 2.Gilman AP, Villeneuve DC, Secours VE, Yagminas AP, Tracy BL, Quinn JM, Valli VE, Willes RJ, Moss MA. 1998. Uranyl nitrate:28-day and 91-day toxicity studies in the Sprague-Dawley rat. Toxicol. Sci. 41, 117–128. ( 10.1006/toxs.1997.2367) [DOI] [PubMed] [Google Scholar]
- 3.Kryvoruchko AP, Yurlova LY. 2014. Use of polyelectrolytes in ultra- and nanofiltration treatment of uranium-contaminated waters. Radiochemistry 56, 410–415. ( 10.1134/S1066362214040092) [DOI] [Google Scholar]
- 4.Li SY, Xie SB, Zhao C, Zhang YP, Liu JX, Cai T. 2013. Efficiency of adsorption of wastewater containing uranium by fly ash. Adv. Mater. Res. 639–640, 1295–1299. ( 10.4028/www.scientific.net/AMR.639-640.1295) [DOI] [Google Scholar]
- 5.Xiaomeng W, Hong G, Rui W, Heng J. 2016. Adsorption and mechanism research of cerium hydroxide for UO22+ ion. Ion Exchange Adsorp. 32, 054–061. ( 10.16026/j.cnki.iea.2016010054) [DOI] [Google Scholar]
- 6.Ulusoy H, Şimşek S. 2013. Removal of uranyl ions in aquatic mediums by using a new material: gallocyanine grafted hydrogel. J. Hazard. Mater. 254–255, 397–405. ( 10.1016/j.jhazmat.2013.04.004) [DOI] [PubMed] [Google Scholar]
- 7.Zhou L, Shang C, Liu Z, Huang G, Adesina AA. 2012. Selective adsorption of uranium(VI) from aqueous solutions using the ion-imprinted magnetic chitosan resins. J. Colloid Interface Sci. 366, 165–172. ( 10.1016/j.jcis.2011.09.069) [DOI] [PubMed] [Google Scholar]
- 8.Xiao-tong C, Ying Q, Yang W, Bing L, Ya-ping T. 2014. Treatment of uranium-containing process wastewater with high concentration nitrate by silica gel adsorption method. Atom. Energy Sci. Technol. 48, 1928–1932. ( 10.7538/yzk.2014.48.11.1928) [DOI] [Google Scholar]
- 9.Weiguang Y, Jihui L, Dun W, Zhenyi L, Yucang Z. 2017. The preparation of biochar from pre-oxidation of banana stem and its adsorption of Cu2+. Chem. Indus. Eng. Progress 36, 1499–1505. ( 10.16085/j.issn.1000-6613.2017.04.045) [DOI] [Google Scholar]
- 10.Gaballah I, Goy D, Allain E, Kilbertus G, Thauront J. 1997. Recovery of copper through decontamination of synthetic solutions using modified barks. Metall. Mater. Trans. B 28, 13–23. ( 10.1007/s11663-997-0122-3) [DOI] [Google Scholar]
- 11.Li JWXZ. 2018. Metal-organic framework-based materials: superior adsorbents for the capture of toxic and radioactive metal ions. Chem. Soc. Rev. 47, 2322–2356. ( 10.1039/C7CS00543A) [DOI] [PubMed] [Google Scholar]
- 12.Guixia ZXHZ. 2018. Polymer-based nanocomposites for heavy metal ions removal from aqueous solution: a review. Polymer Chem. 9, 3562–3582. ( 10.1039/C8PY00484F) [DOI] [Google Scholar]
- 13.Charerntanyarak L. 1999. Heavy metals removal by chemical coagulation and precipitation. Water Sci. Technol. 39, 135–138. ( 10.1016/S0273-1223(99)00304-2) [DOI] [Google Scholar]
- 14.Nanseu-Njiki CP, Tchamango SR, Ngom PC, Darchen A, Ngameni E. 2009. Mercury(II) removal from water by electrocoagulation using aluminium and iron electrodes. J. Hazard. Mater. 168, 1430–1436. ( 10.1016/j.jhazmat.03.042) [DOI] [PubMed] [Google Scholar]
- 15.Ghosh A, Das P, Sinha K. 2015. Modeling of biosorption of Cu(II) by alkali-modified spent tea leaves using response surface methodology (RSM) and artificial neural network (ANN). Appl. Water Sci. 5, 191–199. ( 10.1007/s13201-014-0180-z) [DOI] [Google Scholar]
- 16.Chang-fu W, Zhi-rong L, Gui-rong X, Yi L, Yun W, Li-min Z. 2016. Adsorptive properties of sunflower seed shells for UO22+ in aqueous solution. J. Nuclear Radiochem. 38, 107–115. ( 10.7538/hhx.2016.38.02.0107) [DOI] [Google Scholar]
- 17.Thirumavalavan M, Lai Y, Lin L, Lee J. 2010. Cellulose-based native and surface modified fruit peels for the adsorption of heavy metal ions from aqueous solution: Langmuir adsorption isotherms. J. Chem. Eng. Data 55, 1186–1192. ( 10.1021/je900585t) [DOI] [Google Scholar]
- 18.Lei Z, Jin L, Hong-Bo L. 2017. Carbon aerogels prepared based on sol-gel reaction of cellulose colloid with AEP and its adsorption of copper ions in aqueous solution. J. Inorganic Mater. 32, 1159–1164. ( 10.15541/jim20170053) [DOI] [Google Scholar]
- 19.Wan NWS, Hanafiah MAKM. 2008. Removal of heavy metal ions from wastewater by chemically modified plant wastes as adsorbents: a review. Bioresour. Technol. 99, 3935–3948. ( 10.1016/j.carbpol.2010.11.004) [DOI] [PubMed] [Google Scholar]
- 20.Tao D, Rui W, Hongxue L, Xiaomeng W, Hong G, Heng J, Sheng L, Shibo W. 2016. Adsorption of uranyl ions onto new adsorbent of Ce(PO3)4. Ion Exchange Adsorp. 32, 461–467. ( 10.16026/j.cnki.iea.2016050461) [DOI] [Google Scholar]
- 21.Zong-bo Z, Ya-li Y, Zhi-hui Z, Yi W, Wei L, Le L, Qi L.. 2016. Preparation and adsorption of uranyl of multi-amino nitrogen ligands functionalized mesoporous silica materials. Appl. Chem. Indus. 45, 603–607. ( 10.16581/j.cnki.issn1671-3206.20160115.044) [DOI] [Google Scholar]
- 22.Looyrach J, Methacanon P, Gamonpilas C, Lekpittaya P, Lertworasirikul A. 2015. Pomelo (Citrus maxima) peel-inspired property for development of eco-friendly loose-fill foam. Key Eng. Mater. 659, 279–283. ( 10.4028/www.scientific.net/KEM.659.279) [DOI] [Google Scholar]
- 23.Pei YY, Liu JY. 2011. Adsorption of Pb2+ in wastewater using adsorbent derived from grapefruit peel. Adv. Mater. Res. 391–392, 968–972. ( 10.4028/www.scientific.net/AMR.391-392.968) [DOI] [Google Scholar]
- 24.Yanhua G, Yanxiang L, Li L, Wangxi W, Yuanfang Z. 2017. Preparation of pomelo peel based biosorbent and its adsorption behavior for heavy metal lead ions. J. Jianghan Univ. Nat. Sci. Edn. 45, 411–417. ( 10.16389/j.cnki.cn42-1737/n.2017.05.005) [DOI] [Google Scholar]
- 25.Song S, et al. 2018. Interaction of U(VI) with ternary layered double hydroxides by combined batch experiments and spectroscopy study. Chem. Eng. J. 338, 579–590. ( 10.1016/j.cej.2018.01.055) [DOI] [Google Scholar]
- 26.Yao-yao H, Run-ping S, Han-fang H, Fa-li W, Xiao-xue W, Jian-gang D, Bin J. 2017. Selective adsorption of thorium in radioactive waste water by pummelo peel. Appl. Chem. Indus. 46, 1742–1746. ( 10.16581/j.cnki.issn1671-3206.20170714.032) [DOI] [Google Scholar]
- 27.Zhang B, Chen N, Feng C, Zhang Z. 2018. Adsorption for phosphate by crosslinked/non-crosslinked-chitosan-Fe(III) complex sorbents: characteristic and mechanism. Chem. Eng. J. 353, 361–372. ( 10.1016/j.cej.2018.07.092) [DOI] [Google Scholar]
- 28.Ai Y, Liu Y, Lan W, Jin J, Xing J, Zou Y, Zhao C, Wang X. 2018. The effect of pH on the U(VI) sorption on graphene oxide (GO): a theoretical study. Chem. Eng. J. 343, 460–466. ( 10.1016/j.cej.2018.03.027) [DOI] [Google Scholar]
- 29.Song S, et al. 2019. A novel multi-shelled Fe3O4@MnOx hollow microspheres for immobilizing U(VI) and Eu(III). Chem. Eng. J. 355, 697–709. ( 10.1016/j.cej.2018.08.205) [DOI] [Google Scholar]
- 30.Yao W, et al. 2018. Synthesis of novel flower-like layered double oxides/carbon dots nanocomposites for U(VI) and 241Am(III) efficient removal: batch and EXAFS studies. Chem. Eng. J. 332, 775–786. ( 10.1016/j.cej.2017.09.011) [DOI] [Google Scholar]
- 31.Peniche H, Osorio A, Acosta N, de la Campa A, Peniche C.. 2005. Preparation and characterization of superparamagnetic chitosan microspheres: application as a support for the immobilization of tyrosinase. J. Appl. Polym. Sci. 98, 651–657. ( 10.1002/app.22086) [DOI] [Google Scholar]
- 32.Zhou L, Jin J, Liu Z, Liang X, Shang C. 2011. Adsorption of acid dyes from aqueous solutions by the ethylenediamine-modified magnetic chitosan nanoparticles. J. Hazard. Mater. 185, 1045–1052. ( 10.1016/j.jhazmat.2010.10.012) [DOI] [PubMed] [Google Scholar]
- 33.Donia AM, Atia AA, El-Boraey H, Mabrouk DH. 2006. Uptake studies of copper(II) on glycidyl methacrylate chelating resin containing Fe2O3 particles. Sep. Purif. Technol. 49, 64–70. ( 10.1016/j.seppur.2005.08.008) [DOI] [Google Scholar]
- 34.Yin L, et al. 2019. Smart construction of mesoporous carbon templated hierarchical Mg-Al and Ni-Al layered double hydroxides for remarkably enhanced U(VI) management. Chem. Eng. J. 359, 1550–1562. ( 10.1016/j.cej.2018.11.017) [DOI] [Google Scholar]
- 35.Zhang C, et al. 2018. Highly uranium elimination by crab shells-derived porous graphitic carbon nitride: batch, EXAFS and theoretical calculations. Chem. Eng. J. 346, 406–415. ( 10.1016/j.cej.2018.03.186) [DOI] [Google Scholar]
Associated Data
This section collects any data citations, data availability statements, or supplementary materials included in this article.
Supplementary Materials
Data Availability Statement
The datasets supporting this article have been uploaded as part of the electronic supplementary material (http://dx.doi.org/10.5061/dryad.rg27v0h).