

Abstract
The objective of this study was to carry out a detailed quantitative analysis of the very high intensity runs during actual play in the 2013-2014 Spanish First Division, at a general level and according to the specific playing position and half. 380 matches of the Spanish First Division in the 2013 - 2014 season were monitored using the Mediacoach video motion analysis tool. Total distance, very high intensity (above 21 km/h) running distance and the number of runs at very high intensity of 230 players from 20 teams in the Spanish First Division were analysed. The main findings of the study were that the performance indicators at very high intensities decreased from the first half to the second half for all outfield players (covered distance: 4694 ± 538 m vs 4485 ± 437 m, sprint distance: 256 ± 72 m vs 239 ± 67 m, number of sprints: 14.3 ± 3.5 vs 13.2 ± 3.1), except the central defenders (sprint distance: 166 ± 37 vs 166 ± 40 m, number of sprints: 10.0 ± 2.1 vs 9.8 ± 3.8). Secondly, although wide defenders (9759 ± 665 m) and central midfielders (9776 ± 942 m) covered the most distance during matches, it were the wide defenders (30 ± 5), centre-forwards (28 ± 7) and wide midfielders (31 ± 8) who performed the most runs at very high intensity. Consequently, the distance they ran at these very high intensity runs followed the same pattern. Such results enable general and specific profiles by demarcation to be established based on the demands of the game at high-level competitive play.
Key words: player tracking, soccer, total distance, sprint distance, number of runs, Mediacoach
Introduction
There is a growing interest in soccer which has increased the research on match analysis in order to gain more knowledge about the physiological and technical demands of the game (Bradley et al., 2013; Carling et al., 2012; Castellano et al., 2014; Di Salvo et al., 2010; Vigne et al., 2010). These studies have provided very useful information about players’ performance during the entire match (Barros et al., 2007; Bloomfield et al., 2007; Bradley et al., 2013) and at different periods of the game (Bradley et al., 2010; Vigne et al., 2010). Furthermore, many studies have analysed players based on the specific playing position of players (Figure 1) (Di Salvo et al., 2007, 2010).
Figure 1.
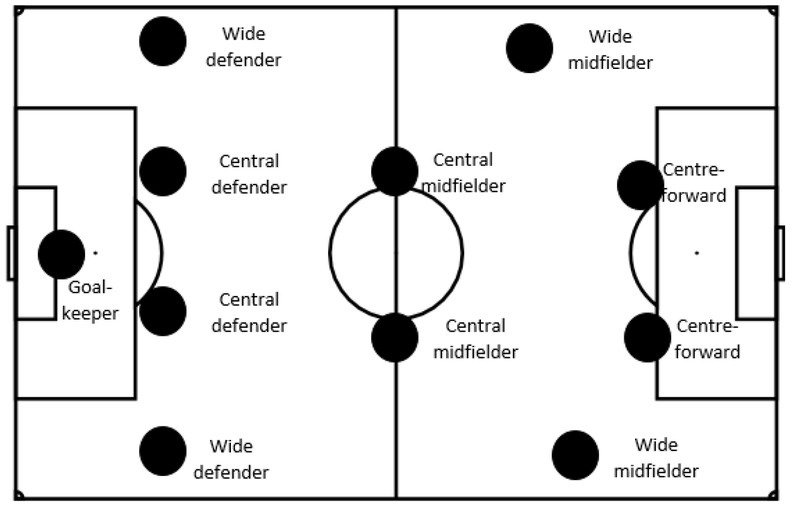
Description of player positions.
On an average, a player runs about 9-11
km per game (Bradley et al., 2013; Dellal et al., 2011; Mallo et al., 2015), with this number varying in terms of specific positions. It has been found that wide midfielders and central midfielders are the ones that run the most, followed by centre-forwards and wide defenders, while central defenders are the ones that run the least (Bradley et al., 2010; Rampinini et al., 2007). However, as soccer players perform intermittent running actions in the sport, distance covered at very high intensities compared to total distance covered appears to be a better variable to understand the physical demands of the sport (Mallo et al., 2015).
A majority of the studies reported distances covered at sprint speed that varied between 205 and 275 m (Andrzejewski et al., 2015; Bradley et al., 2010; Di Salvo et al., 2007, 2010). They also observed that the players that sprinted the most were centre forwards, followed by wide mid-fielders and wide defenders, then central midfielders and finally central defenders. The number of sprints was highly variable, between 3 and 40 per game (Di Salvo et al., 2007), where the average distance run was 19.3 ± 3.2 m. As a result of fatigue, the number of sprints and the distance run decreased over the duration of the match (Mohr et al., 2003; Rampinini et al., 2007), with the performance characteristics differing from one half to another, again being different based on the playing position (Andrzejewski et al., 2015). The differences in performance from the first to the second half become important as this information can be used by coaches to prepare players to perform at their highest level for the entire duration of the match. This can either be achieved by using the information to make appropriate substitutions, perhaps by bringing on explosive players in the second half when performance of opposition defenders reduces, or even by having players train in conditions of fatigue.
Ever since the last decade, Spanish football has dominated European and world soccer. Having won a FIFA World Cup and two UEFA Euro championships, teams from Spain have won the most number of UEFA Champions Leagues (n = 17) (UEFA, 2017a), UEFA Europa Leagues (n = 10) (UEFA, 2017b), and FIFA Club World Cups (n = 5) (FIFA, 2017). Moreover, since 2009 all winners of the Balon d’Or have played in Spanish teams (France Football, 2017), alluding to the great technical quality of the players playing in the Spanish league (Sarmento et al., 2013). Differences were also obtained in the performance characteristics of the players in the Spanish league compared to other elite professional leagues, for example wide midfielders and wide defenders covered greater distances at very high intensities (above 21 km/h) compared to their counterparts in the FA Premier League (Dellal et al., 2011).
Since 2011, the Spanish Professional Football League (Liga de Futbol Profesional, LFP) has been using the Mediacoach system (MediaPro, Barcelona, Spain) to provide semi-automatic tracking of players for all matches in the first and second divisions (MediaPro, 2017). To the best of our knowledge, there are no match analysis studies performed with this system, and the last descriptive study conducted on the physical activity of soccer players in relation to their playing position was in 2006-07 (Dellal et al., 2011).
In view of the lack of recent studies carried out with data from the Spanish first division (La Liga), especially in the period of its dominance and with the Mediacoach system, an update of match analysis is important in order to address the game’s constant evolution. Using the Mediacoach automatic player tracking system, performance characteristics of players based on their position can be noted, especially making it possible to get data of players when they execute very high intensity runs. Very high intensity runs probably are one of the most important factors that helps win matches, since it helps players to outrun opponents. As mentioned earlier, the distance and number of very high intensity runs vary based on the half and playing position. This data can potentially provide an insight into the performance characteristics of players playing in the Spanish football league. Thus, the objective of this study was to carry out a detailed quantitative analysis of the very high intensity runs during actual play in the 2013 - 2014 season in the Liga BBVA™, at a general level and according to the specific playing position and half.
Methods
Design and Procedures
The 380 games of the Spanish First Division in the 2013 - 2014 season were monitored using the Mediacoach video motion analysis tool (MediaPro, Barcelona, Spain). This tool has been used by the 42 teams of the 1st and 2nd division of the Spanish professional soccer league (Liga de Fútbol Profesional (LFP)) during the last six years. Sixteen cameras placed high in the stadiums record the movements of the 22 players.
Although many of previous match analysis studies estimate sprint speed to be above 25 km/h, numerous discrepancies have been observed when the defined sprint speed was lower, for example Barros et al. (2007) found higher average sprint distances (437 ± 171 m) when they estimated that sprint speed was over 23 km/h. Many of the previous investigations (Sarmento et al., 2014) report other intervals, considering high intensity runs to be of speed above 14.4 km/h (Bradley et al., 2010) and very high intensity runs to be of speed above 19.8 km/h (Bradley et al., 2010) or 21 km/h (Dellal et al., 2011). However, based on the different match analysis systems used (Castellano et al., 2014), varying results could be obtained, especially when movements exceeded the speed of 20 km/h (Mallo et al., 2015).
Hence, from the system, the following data was extracted: total distance run, distance run at a very high intensity (above 21 km/h (Dellal et al., 2011)), the number of very high intensity runs, along with technical and game information (i.e. goals, shots on the goal, shots on the target, assistance, passing accuracy, total number of passes, ball recoveries, losses of possession, fouls committed and fouls received). The data was transferred to a server that was accessible by all the teams for subsequent analysis and use. Permission to use the data was obtained and the research followed the ethical guidelines of the ethics committee of the Universidad Politécnica de Madrid.
Participants and measures
Data (total distance, very high intensity running and number of runs) of 497 players from 20 teams in the Spanish First Division were analysed. However, only players who played more than 11 complete games in a season and for more than 89 minutes in the games were selected, giving a sample size of 230 players. The players (age = 27.5 ± 3.89 years, body mass = 77.6 ± 5.74 kg and body height = 180 ± 9.18 cm) were divided into six groups for data collection purposes (Figure 2): the goalkeeper, central defenders, wide defenders, midfielders, centre-forwards and wide midfielders.
Figure 2.

Flow diagram showing the selection process of the final sample
Statistical analysis
The Kolmogorov–Smirnov test was used to examine the goodness of fit of the data collected. All the variables complied with the assumption of normality and were transformed to typified values to analyse the presence of outlier data. There were no observations above the three standard deviations. The Pearson's correlation coefficient was used to analyse the correlations between variables. A Multivariate Analysis of Variance (MANOVA) was carried out to compare total distance, the number of very high intensity runs and very high intensity run distance per each position (i.e. goalkeeper, centre, back, midfielder, centre-forward and wide midfielder). The Levene's test was used to analyse the assumption of homogeneity of variances. However, due to the non-orthogonality of the groups, this assumption was not fulfilled. Therefore, the Dunnet's post Hoc T3 test was used, assuming unequal variances.
A 2 (first and second half) x 6 (positions) analysis of variance (ANOVA) was used for each criterion variable (i.e. total distance, very high intensity run distance and the number of very high intensity runs). The level of statistical significance was set at p < 0.05. Effect sizes were determined using partial η2 values where the thresholds for small, medium and large effects were 0.01, 0.06 and 0.14, respectively (Richardson, 2011). All the analyses were conducted using data analysis software (SPSS Inc, Chicago, Illinois, USA).
Results
A total of 230 players were analysed throughout a minimum of 12 and a maximum of 38 games (22 ± 7.16). The general results obtained without taking into consideration the specific position or the playing period established that the field players (i.e. excluding goalkeepers) ran a total average distance of 9268 ± 960 m (IC95% = 9137 – 9399 m); covered a very high intensity run distance of 448 ± 156 m (IC95% = 427 – 469 m); and completed a total number of very high intensity runs of 25.27 ± 7.3 (IC95% = 24.27 – 26.27) per game. Therefore, the field players ran 17.73 m per each very high intensity run. Considering each half separately, the average distance run was 4729 ± 566 m in the first and 4537 ± 480 m in the second half.
A significant effect of the playing position was found for all three variables: total distance, very high intensity running distance and the number of very high intensity runs (F ≥ 96, p ≤ 0.0001, η2 ≥ 0.68, Figure 3). Post hoc comparisons showed that goalkeepers performed less in all the three variables compared to the other positions, while midfielders and wide defenders covered most distance during matches compared with the other positions (Figure 3). However, with regard to the number and distance of very high intensity runs, it was found that midfielder and central defenders did run less than the other three field positions at very high intensities (Figure 3).
Figure 3.
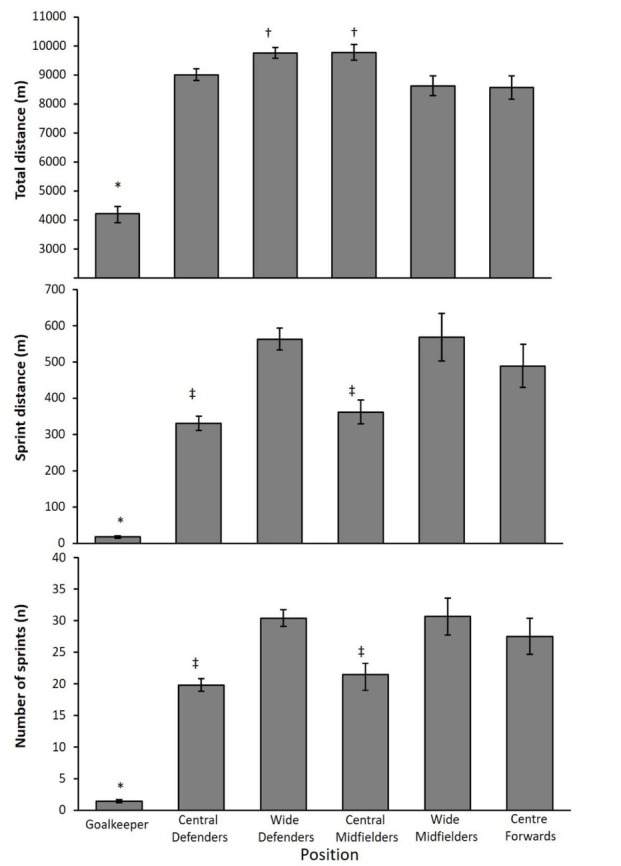
Performance characteristics (total distance, distance run at very high intensities and number of very high intensity runs) based on the position for the whole match
* indicates a significant difference between the goalkeeper and other positions with p < 0.001;
† indicates a difference between wide defenders and central midfielders, and wide midfielders, central defenders and centre forwards with p < 0.05;
‡ indicates a difference between wide midfielders, wide defenders and centre forwards, and central defenders and central midfielders with p < 0.05
When data was measured in the first and second half, a significant effect (F ≥ 35, p ≤ 0.0001, η2 ≥ 0.13) of the playing period was found i.e. in the second period all field players covered less total distance (Figure 4). However, considering the number and distance of very high intensity runs, these values decreased in all field positions except for central defenders (Figure 4).
Figure 4.
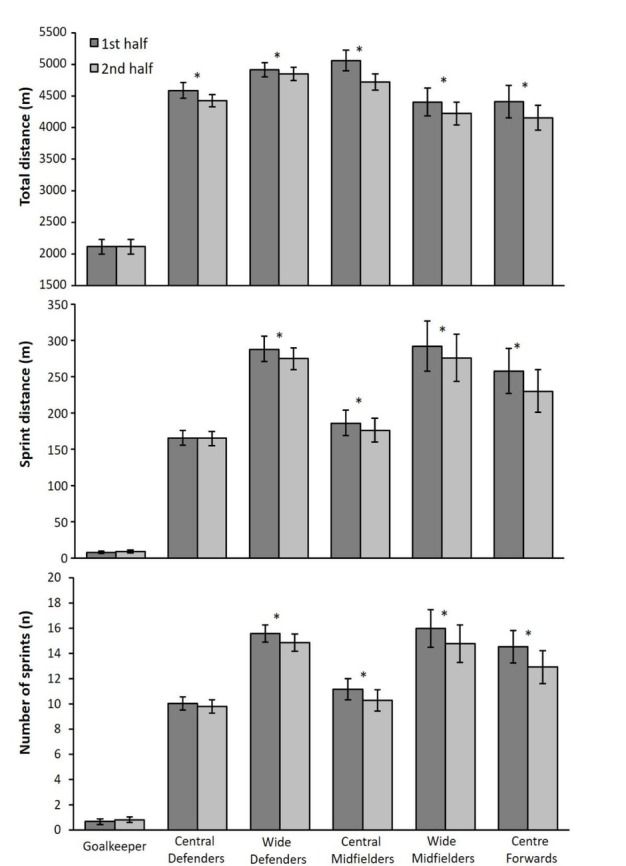
Performance characteristics (total distance, distance run at very high intensities, and number of very high intensity runs) based on the position compared across the two halves
* indicates a significant difference between the first and the second half with p < 0.05
Discussion
A detailed analysis of competition effort of the players in the Spanish first division was carried out in this study, where the objective was to determine the very high intensity runs of each position, and then compare the data of both halves of the match. The main findings of the study were that the performance indicators at very high intensities decreased from the first half to the second half for all outfield players, except for the central defenders. Secondly, although the wide defenders and central midfielders covered most distance during matches, wide defenders, centre-forwards and wide midfielders were the ones who performed the greatest number of runs at very high intensity. Consequently, the distance they covered at these very high intensity runs followed the same pattern.
Central defenders were amongst the outfield players who performed the least number of very high intensity runs, along with central midfielders. This characteristic is similar to that found in previous studies in the Spanish La Liga (Dellal et al., 2011; Di Salvo et al., 2007). However, the performance characteristics of central defenders did not change from the first to the second half at very high intensities, which did happen with regard to central midfielders. Central midfielders are important in both attack and defence, which is evident from the fact that they were the players that ran the most during a match (Di Salvo et al., 2010; Rampinini et al., 2009). They mainly direct passes in order to maintain possession or create a goal scoring opportunity; or track midfielders of the opposition in order to win back possession when their team does not have control of the ball. The central defenders’ primary function is defensive to prevent or intervene in a goal scoring opportunity, accounting for the significantly lower total distance ran by central defenders. Probably a combination of the tactical demands of the game where they constitute the last line of defence before the goalkeeper, and a lower fatigue level could explain the similar characteristics of their performance at very high intensities.
It can be argued that the total distance ran by central defenders decreased from the first to the second half. However, one must consider that attacking players they defended: mainly centre forwards, wide midfielders and central midfielders, reduced their performance characteristics in terms of total distance ran and those at very high intensities. This could be due to players’ fatigue (Mohr et al., 2003) of attacking players, and as a consequence, there was a reduction in the demands at very high intensities in central defenders.
An important observation to be made is that central defenders in Spain, were not the players who ran the least amongst all outfield players. Although no significant differences were obtained between central defenders, wide midfielders and centre forwards, central defenders ran more than the players in the latter two positions, a finding contrary to that reported previously (Andrzejewski et al., 2015; Barros et al., 2007; Di Salvo et al., 2007). This could be due to different tactics applied in Spain recently indicating an emphasis on a more mobile centre back.
The average distance run per player per match in this study (9268 ± 960 m) was lower than that measured in the FA Premier League (Dellal et al., 2011; Rampinini et al., 2007) and Italian Serie A (Rampinini et al., 2009). These differences highlight tactical differences in the style of play in different competitions. Soccer differs across the continent, with coaches describing Spanish soccer being more technical, Italian more tactical and English more free flowing (Sarmento et al., 2013). The distances covered were much less than those reported for all positions in 2005-06 and 2002-04 Spanish La Liga seasons as well (Dellal et al., 2011; Di Salvo et al., 2007). These differences at the continental and national level highlight the evolution of the game over the years. To the best of the authors’ knowledge, the most recent study (Andrzejewski et al., 2015) corresponded to the 2008-09 and 2010-11 seasons of the Europa League, where the performance of a single Polish team was followed in ten games each season.
This study did not differentiate between the distance run at very high intensities and that at what some researchers describe as sprint speed. Previous research suggests that there is large variation in the speed at which players begin to sprint (Carling et al., 2012), and thus we chose to report distances at very high intensities alone, including those at sprint speed. Hence, when comparing the average distances ran at very high intensities to sprint characteristics in other studies, discrepancies in the results were seen. In this study, the average distance run while sprinting was 448 ± 156 m, yet when the reference sprint speed was higher, lower distances were obtained (> 23 km/h, 437 ± 171 m (Barros et al., 2007); > 25.1 km/h, between 230 and 300 m (Andrzejewski et al., 2015; Bradley et al., 2013; Di Salvo et al., 2010)). Similarly, differences were obtained in the average number of sprints (25.27 ± 7.3 vs 17.3 ± 7.7 sprints per match compared to Di Salvo et al. (2007).
Dellal et al. (2011) did report values for Spanish soccer players at very high intensities in the 2006-07 season, and if one were to combine those values with the sprint distances reported, they obtained a significantly higher distance of 530 m per match. These differences could be due to the tactical evolution and/or the diverse systems used (Amisco vs Mediapro) and one must keep in mind the evolution of technology between 2006-07 and 2013-14.
This study only analyzed total distances ran and the distances and number of runs at very high intensities, and only for those players that played ninety minutes or more. One limitation was that the distances run at other intensities were not taken into account. The other data such as goals and assists based on the half and the player position could provide more information to coaches regarding the tactics being used by the teams in Spain nowadays. The aspect of playing at home or away could also been factored in, as it has been shown that teams perform differently when playing at home or away (Lago-Penas et al., 2017).
Conclusions
The results obtained appear to confirm a specific demand depending on the position occupied in the pitch amongst elite players in Spain at the time when Spanish soccer is dominating the game. Differences were found in the total distance run, the number and distance of runs at very high intensities based on the position and the half. Such results enable general and specific profiles by demarcation to be established that are based on the demands of the game at high level competitive play, which may be of great interest to practitioners. They can use the information obtained about total distance, sprint distance and the number of sprints to quantify the weekly load according to the specific position. This can then be applied to design training sessions for different players based on their positions at specific moments during the season. In the event of a player getting injured, this data can help design a specific return-to-play program for the injured athlete in order to adapt to the characteristics of the position in which the player plays in.
References
- Andrzejewski M, Chmura J, Pluta B, Konarski JM. Sprinting Activities and Distance Covered by Top Level Europa League Soccer Players. Int J Sports Sci Coa. 2015;10(1):39–50. [Google Scholar]
- Barros R, Misuta M, Menezes R, Figueroa P, Moura F, Cunha S, Leite N. Analysis of the distances covered by first division Brazilian soccer players obtained with an automatic tracking method. J Sports Sci Med. 2007;6:233–242. [PMC free article] [PubMed] [Google Scholar]
- Bloomfield J, Polman R, O’Donoghue P. Physical demands of different positions in FA Premier League Soccer. J Sports Sci Med. 2007;6:63–70. [PMC free article] [PubMed] [Google Scholar]
- Bradley PS, Carling C, Gomez Diaz A, Hood P, Barnes C, Ade J, Mohr M. Match performance and physical capacity of players in the top three competitive standards of English professional soccer. Hum Movement Sci. 2013;32:808–821. doi: 10.1016/j.humov.2013.06.002. [DOI] [PubMed] [Google Scholar]
- Bradley PS, Di Mascio M, Peart D, Olsen P, Sheldon B. High- intensity activity profiles of elite soccer players at different performance levels. J Strength Cond Res. 2010;24:2343–2351. doi: 10.1519/JSC.0b013e3181aeb1b3. [DOI] [PubMed] [Google Scholar]
- Carling C, Le Gall F, Dupont G. Analysis of repeated high-intensity running performance in professional soccer. J Sports Sci. 2012;30(4):325–336. doi: 10.1080/02640414.2011.652655. [DOI] [PubMed] [Google Scholar]
- Castellano J, Alvarez-Pastor D, Bradley PS. Evaluation of Res Using Computerised Tracking Systems (Amisco (R) and Prozone (R)) to Analyse Physical Performance in Elite Soccer: A Systematic Review. Sports Med. 2014;44(5):701–712. doi: 10.1007/s40279-014-0144-3. [DOI] [PubMed] [Google Scholar]
- Dellal A, Chamari K, Wong DP, Ahmaidi S, Kellerm D, Barrosn R, Carling C. Comparison of physical and technical performance in European soccer match-play: FA Premier League and La Liga. European J Sport Sci. 2011;11(1):51–59. [Google Scholar]
- Di Salvo V, Baron R, Gonzalez-Haro C, Gormasz C, Pigozzi F, Bachl N. Sprinting analysis of elite soccer players during European Champions League and UEFA Cup matches. J Sports Sci. 2010;28(14):1489–1494. doi: 10.1080/02640414.2010.521166. [DOI] [PubMed] [Google Scholar]
- Di Salvo V, Baron R, Tschan H, Calderón Montero F J, Bachl N, Pigozzi F. Performance characteristics according to playing position in elite soccer. Int J Sports Med. 2007;28:222–227. doi: 10.1055/s-2006-924294. [DOI] [PubMed] [Google Scholar]
- FIFA. FIFA Club World Cup. 2017. http://www.fifa.com/fifa-tournaments/statistics-and-records/clubworldcup/index.html Available at.
- France Football. La liste complête des lauréats du Ballon d'or, de 1956 à nos jours. 2017. https://www.francefootball.fr/ballon-d-or/palmares/ Available at.
- Lago-Penas C, Gomez MA, Pollard R. Home advantage in elite soccer matches. A transient effect? Int J Perform Anal Sport. 2017;17(1-2):86–95. [Google Scholar]
- Mallo J, Mena E, Nevado F, Paredes V. Physical Demands of Top-Class Soccer Friendly Matches in Relation to a Playing Position Using Global Positioning System Technology. J Hum Kinet. 2015;47(1):179–188. doi: 10.1515/hukin-2015-0073. [DOI] [PMC free article] [PubMed] [Google Scholar]
- MediaPro. ABOUT MEDIACOACH 2017. http://mediacoach.es/mediacoach/ Available at.
- Mohr M, Krustrup P, Bangsbo J. Match performance of high-standard soccer players with special reference to development of fatigue. J Sports Sci. 2003;21:519–528. doi: 10.1080/0264041031000071182. [DOI] [PubMed] [Google Scholar]
- Rampinini E, Coutts C, Castagna C, Sassi R, Impellizzeri F. Variation in top level soccer match performance. Int J of Sports Med. 2007;28:1018–1024. doi: 10.1055/s-2007-965158. [DOI] [PubMed] [Google Scholar]
- Rampinini E, Impellizzeri F, Castagna C, Coutts AJ, Wisloff U. Technical performance during soccer matches of the Italian Serie A league: Effect of fatigue and competitive level. J Sci Med Sport. 2009;12:227– 233. doi: 10.1016/j.jsams.2007.10.002. [DOI] [PubMed] [Google Scholar]
- Richardson JTE. Eta squared and partial eta squared as measures of effect size in educational Research. Edu Res Review. 2011;6(2):135–147. [Google Scholar]
- Sarmento H, Marcelino R, Anguera MT, Campanico J, Matos N, Leitao JC. Match analysis in football: a systematic review. J Sports Sci. 2014;32(20):1831–1843. doi: 10.1080/02640414.2014.898852. [DOI] [PubMed] [Google Scholar]
- Sarmento H, Pereira A, Matos N, Campanico J, Anguera MT, Leitao J. English Premier League, Spain's La Liga and Italy's Serie's A - What's Different? Int J Perform Anal Sport. 2013;13(3):773–789. [Google Scholar]
- UEFA. European Cup roll of honour. 2017. http://www.uefa.com/uefachampionsleague/history/champions/index.html Available at.
- UEFA. From Fairs Cup via UEFA Cup to UEFA Europa League. 2017. http://www.uefa.com/uefaeuropaleague/history/index.html Available at.
- Vigne G, Gaudino C, Rogowski I, Alloatti G, Hautier C. Activity profile in elite Italian soccer. Int J Sports Med. 2010;31:304–310. doi: 10.1055/s-0030-1248320. [DOI] [PubMed] [Google Scholar]